Abstract
This study analyzes the impact of Industry 4.0 and SARS-CoV-2 on the manufacturing industry, in which manufacturing entities are faced with insufficient resources and uncertain services; however, the current study does not fit this situation well. A multi-service composition for complex manufacturing tasks in a cloud manufacturing environment is proposed to improve the utilization of manufacturing service resources. Combining execution time, cost, energy consumption, service reliability and availability, a quality of service (QoS) model is constructed as the evaluation standard. A hybrid search algorithm (VS–ABC algorithm) based on the vortex search algorithm (VS) and the artificial bee colony algorithm (ABC) is introduced and combines the advantages of the two algorithms in search range and calculation speed. We take the customization production of automobiles as an example, and the case study shows that the VS–ABC algorithm has better applicability compared with traditional vortex search and artificial bee colony algorithms.
Keywords:
manufacturing; customized products; service composition; evaluation model; hybrid search algorithm MSC:
49K40; 90C31; 49N05; 93C05
1. Introduction
The proposal of Industry 4.0 caused the manufacturing industry to change from the traditional production type to the service type, which meets the diversified needs of customers in the new era. Meanwhile, 5G network technology drives the development and reform of manufacturing technology by virtue of its characteristics of high communication speed and quality, high reliability and low delay, which are far superior to 4G technology. In the process of transformation, some problems in the traditional manufacturing industry gradually emerged and were reflected in the imbalanced manufacturing technology of manufacturing entities, insufficient manufacturing resources, delivery delay, high energy consumption and poor service reliability. In addition, with the advent of COVID-19 caused by SARS-CoV-2, the global economy and production have received varying degrees of impact [1]. The COVID-19 outbreak in 2019 has exacerbated the global economic shocks, seriously affected the reliability and credibility of economic entities, and threatened the survival and development of manufacturing enterprises. Cloud manufacturing is a service-oriented manufacturing model based on cloud computing, virtualization and other technologies, and can provide solutions to diversified product customization problems and shorten product life-cycle problems [2]. Cloud manufacturing uses cloud service platforms to centrally manage distributed manufacturing resources, which improves the utilization rate of manufacturing resources by virtualizing manufacturing resources and capabilities, and overcomes the limitations of a single enterprise in manufacturing resources and capabilities [3]. The key to cloud manufacturing lies in the construction and solution of a service composition model, which is also a hot issue.
In recent years, many scholars have addressed the evaluation and optimization of cloud service combination strategies by the genetic algorithm, the particle swarm optimization algorithm and so on.
This paper summarizes some relevant studies as follows:
- (1)
- Related to the task decomposition of cloud manufacturing and cloud services.
Attiya et al. applied cloud services and scheduled tasks based on simulated annealing and disruption operators for global optimization [4]. Zhang et al. further pointed out that cloud manufacturing can be used to solve the bottleneck problems in the manufacturing process [5]. Wang et al. improved the related problems of associated task perception in cloud manufacturing [6]. Li et al. presented cloud manufacturing technology based on a QoS awareness multi-objective optimization problem [7]. Wang studied the sustainability of cloud manufacturing services [8]. Hu et al. analyzed the matching of resources in cloud manufacturing [9]. Based on cloud manufacturing, Hu et al. studied the decomposition of manufacturing tasks [10]. Singh introduced the connection and application between cloud manufacturing and 3D printing [11]. Zhang analyzed the optimization of 3D printing task ordering on cloud service platforms [12]. Lee K-L used a German software company as an example to discuss the development of Industry 4.0 with the application of cloud technology and other technologies [13].
Related researchers and studies are shown in Table 1.

Table 1.
Researchers and studies related to cloud services.
- (2)
- Related to evaluation models of service composition and optimization algorithms of composition strategies.
Lin improved the GA algorithm [14]. By improving the gray wolf algorithm, Yang et al. studied energy consumption awareness through compositional optimization of cloud manufacturing [15]. Zhang et al. proposed a multi-task scheduling method for cloud manufacturing based on utility perception [16]. Gavvala et al. explored the combination strategy of cloud services based on the behavior pattern of eagles [17]. Maryam et al. conducted a topology analysis on the cloud manufacturing supply and demand super-network [18]. Asfandyar et al. evaluated the cost of cloud computing with a QoS awareness model [19]. Sefati et al. used an adaptive penalty function and QoS model to optimize cloud service composition [20]. Liu et al. evaluated trust services based on a QoS awareness model [21]. Rakrouki et al. used QoS awareness to evaluate task flow scheduling in cloud computing environments [22]. Based on cloud–fog computing, Syed. et al. used QoS awareness [23]. Babbar et al. proposed a QoS-aware architecture to deal with the server load of cloud intelligent services [24]. BEN et al. constrained deadlines for cloud computing tasks in a QoS model [25].
Related researchers and studies are shown in Table 2.
Table 2.
Researchers and studies related to evaluation model and optimization algorithm.
- (3)
- Related to improvement of vortex search and artificial bee colony algorithms.
Kaixiang et al. uses the artificial bee colony algorithm to optimize school scheduling [26]. Mei et al. applied a sorting-based discrete artificial bee colony algorithm to solve a scheduling problem [27]. Gulnur et al. cited a new hybrid BA–ABC algorithm to overcome global optimization problems [28]. Safayenikoo et al. compared the vortex search algorithm, multi-verse optimizer, and shuffled complex evolution in optimizing the configuration of a multi-layer perceptron neural network [29]. Grisales-Noreña et al. proposed a hybrid algorithm based on population-based incremental learning and the vortex search algorithm to optimal location and sizing of distributed generators in direct current networks [30]. Paz-Rodríguez et al. optimized integration of photovoltaic sources with the vortex search algorithm [31]. John et al. used a discrete version of the vortex search algorithm [32].
Related researchers and studies are shown in Table 3.
Table 3.
Researchers and studies related to algorithm improvement.
Most of the studies above put forward relevant methods and algorithms to improve and evaluate service composition problems, but these studies are not good enough to apply to the problems faced by manufacturing and there are still research gaps in multi-service composition. These studies usually take the single-service composition mode to match and decompose the manufacturing task, and optimize it as the main research object. However, when a large number of complex manufacturing tasks occur, the existing service composition plan cannot be applied appropriately. In terms of algorithms, these algorithms usually have a single solution and are still deficient in global optimization and local optimization.
In conclusion, the following contributions are included in this paper:
- A multi-service composition is proposed to improve the utilization of manufacturing service resources;
- A QoS model is built to evaluate cloud service compositions;
- A hybrid search algorithm is introduced that combines the advantages of the vortex search algorithm and the artificial bee colony algorithm.
The remaining sections of this paper are organized as follows: Section 2 introduces the global optimization model of multi-service composition and the QoS evaluation model. Section 3 proposes the hybrid search algorithm (VS–ABC algorithm). Section 4 verifies the applicability of the VS–ABC algorithm through experiments. Finally, Section 5 concludes the paper.
2. Global Optimization Model of Multi-Service Composition for Customized Products in Cloud Manufacturing Environment
2.1. Optimization Strategy Development
The characteristic feature of traditional customized service composition strategy is that each task group has its corresponding service group. That is, for any subtask Tn, there exists service candidate set , whose QoS value of the whole service composition should be as large as possible if it meets the restriction conditions. The traditional service composition process is shown in Figure 1.
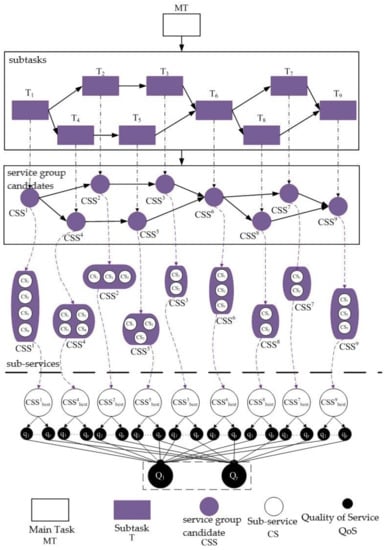
Figure 1.
Service composition process in traditional strategy.
Compared with other service composition strategies, the traditional strategy selects the sub-service with the highest single QoS score rather than the sub-service with the highest overall QoS score. In addition, there is a “1:1” mapping between tasks and service compositions, which greatly restricts the optimization efficiency and globality of service composition of customized products as the part B of Figure 1. The larger the number of customization tasks, the more obvious the problems of the traditional service composition strategy are. For example, when more than two manufacturing tasks are combined into a more complex manufacturing task, it is not enough to meet the requirements of customization production. Therefore, in order to address the problem where the demand is greater than the supply in the traditional service composition strategy for complex tasks, an optimization plan of service composition is proposed, which improves the traditional service composition strategy and is adaptable for complex manufacturing tasks.
The manufacturing task of product customization will continue to increase due to the recursion of service composition. The task intensity cannot be performed by a single manufacturing service group, and it is difficult to complete independently and gradually. Therefore, the idle service composition whose QoS value does not meet the restriction conditions can be recombined to form an aggregate of multiple service groups. The multiple service groups in the assembly jointly respond to the manufacturing task request of the customized service, forming a one-to-many mapping between tasks and service groups as the part A of Figure 1.
The global optimization strategy includes two stages: preparation and implementation. The preparation stage includes the task decomposition, which divides the main task into corresponding subtasks, and task discovery, which is the recombination of the service candidate set according to the needs of the subtasks.
The traditional service composition process and the multi-service composition process are shown in Table 4.
Table 4.
Comparison of service combination process.
The global optimization strategy of the product customization process is shown in Figure 2.
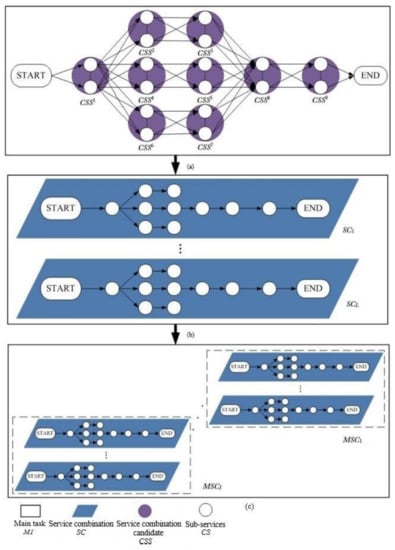
Figure 2.
Global optimization strategy for product customization process. (a) Service Combination. (b) Service Combination Candidate. (c) MSC Multi-service Composition.
2.2. Construction of Multi-Service Composition Model for Customized Products in Cloud Manufacturing Environment
The increase in the number of service compositions will inevitably lead to a series of problems such as cost rise and manufacturing time delay, which will reduce the efficiency of manufacturing task completion. Therefore, in order to obtain the optimal solution of multi-service composition of customized products in cloud manufacturing environment, an evaluation model based on QoS attributes, a QoS model is established to solve the cost and time problems caused by the increasing number of service compositions. Based on the characteristics of the production process and the actual production situation of customized products, five attributes, namely, A (availability), C (cost), E (energy), R (reliability), and T (time), are selected as QoS evaluation indexes. According to the characteristics of these attributes, relevant data such as sum, mean, product and extreme value are counted. T is based on the sum of all service composition attributes. C and E are related to cost and are calculated using corresponding attributes. R and A are determined by the comprehensive performance of all tasks, which are calculated by the product of corresponding attributes.
2.2.1. Model Preparation Stage
The specific symbols in the multi-service composite QoS model are shown in Table 5.
Table 5.
The description of symbols.
The decision variables and their descriptions are shown in Table 6.
Table 6.
Parameters and decision variables.
According to the workflow model, QoS expression can be established. In the process of selecting subtasks, each subtask has probability of being selected, and . In the selection cycle of subtasks, a subtask will be repeated many times, and its selection times are represented by weight ω, we then multiply the value of each QoS attribute by the weight to obtain the final value.
The QoS expression of the external composite process is shown in Table 7, Table 8, Table 9, Table 10 and Table 11.
Table 7.
QoS expressions of internal composite (Time).
Table 8.
QoS expressions of internal composite (Cost).
Table 9.
QoS expressions of internal composite (Energy).
Table 10.
QoS expressions of internal composite (Reliability).
Table 11.
QoS expressions of internal composite (Availability).
The QoS evaluation model can be obtained from Table 7, Table 8, Table 9, Table 10 and Table 11 as Formula (1):
In the composition process of sub-services, the internal and external composition processes are considered comprehensively, and the QoS values of both are calculated at the same time, which represent the n:1 correspondence between service composition and subtasks.
The QoS model of multi-service composition is converted into a mathematical model for evaluation, and the formula can be expressed as Formula (2):
where
2.2.2. Building Up Model
Compared with the optimization strategy of the traditional service composition, the service composition regrouping process is added to the global optimization strategy of the multi-service composition. Therefore, the QoS evaluation model needs to combine the two processes, which are described as follows:
- (1)
- QoS model of internal composition process.
For any service composition SCl, there is a QoS expression, i.e., Formula (3):
where f1 to f5 are determined by SCl, and their results should be weighted when taken as an evaluation standard.
- (1)
- Calibration stage
To make T, C and E as small as possible and R and A as large as possible, the five types of data will be processed in different ways. The processing formulas are as follows:
- (2)
- Weighted processing stage
According to Formula (4) to Formula (8) above, the QoS evaluation value is expressed as Formula (9):
Similarly, the QoS value constraint formula of the total task is expressed as Formula (10):
- (2)
- QoS model of external composite process.
The overall QoS results need to be further processed:
- (1)
- The calculation formula of the QoS evaluation value of a multi-service composition composed of a single service group is expressed as Formula (11):
- (2)
- Multi-service composition composed of multiple service groups.
Combining with Formula (2), the QoS evaluation value formula can be presented as Formula (12):
where
can be obtained from Formula (4) to Formula (8).
- (3)
- Personalized customization-oriented multi-service composition optimization model.
To sum up, the model transforms the problem of multi-objective composition optimization, quantifies the optimal composition into the maximum QoS value and transforms it into a mathematical problem. The specific model is as follows:
where
Formula (13) is the objective function. In order to obtain the maximum QoS value, Formula (14) to Formula (18) are the constraint conditions of MSCI. Formula (13) represents the objective function of the multi-service composition optimization model, and Formula (14) to Formula (18) are the five constraints of the objective function related to the optimization problem. Formula (14) indicates that the execution path of the multi-service composition can be selected only when the overall QoS attribute value of the multi-service composition is greater than or equal to the QoS attribute value required by the manufacturing task. Formula (15) indicates that any selected sub-service can only come from the corresponding cloud service candidate set, and the corresponding number is one. Formula (16) indicates that any sub-service can only come from a service composition. Formula (17) indicates that there is a one-to-one mapping correspondence between a multi-service composition and a manufacturing task, but it is essentially a many-to-one relationship between a single-service composition and manufacturing tasks. Formula (18) indicates that the number of candidate service compositions cannot be less than the number of multi-service compositions, and each multi-service composition contains at least one single-service composition.
3. VS–ABC Hybrid Search Algorithm
3.1. Vortex Search Algorithm
The search mechanism of the vortex search algorithm (VS) is inspired by the eddy current mode to simulate eddy current motion. The VS algorithm uses an adaptive length adjustment strategy to improve the performance of the search process. Compared with other meta-heuristic optimization algorithms, the VS algorithm has some favorable characteristics, such as simple operation, few parameter settings and strong search ability. The VS algorithm is a kind of global optimization algorithm, and its local search ability is relatively weak. Hence, it is easy to converge prematurely.
The process of the VS algorithm can be divided into four sections: generating the initial solution, generating the candidate solution, replacing the current solution and the radius-decreasing process.
In two-dimensional space, the initial search center is presented by Formula (19).
The initial radius of the search is:
Then, VS algorithm uses in Gaussian distribution to generate the initial candidate solution set, where n represents the number of solution sets as in Formula (21).
Finally, there is the radius-decreasing process, where the algorithm uses an incomplete gamma function to decrease the value of the radius at each iteration as in Formulas (22) and (23).
The algorithm flow chart is shown in Figure 3.
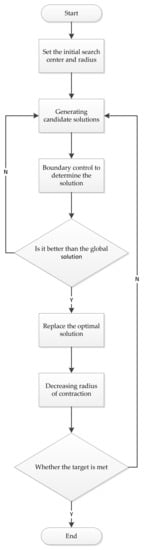
Figure 3.
The flow chart of VS algorithm.
In the process of the VS algorithm, the position information of the vortex center is mapped to the optimization problem, which is a feasible solution of a D-dimensional vector, and the dimension of the vector corresponds to the QoS attribute. The VS algorithm is a global optimization algorithm. Accordingly, it is suitable for solving the service composition grouping process in the global strategy of multi-service composition.
3.2. Artificial Bee Colony Algorithm
The artificial bee colony algorithm (ABC) is a heuristic intelligent search algorithm created by Karaboga in 2005 based on bee colony behavior. In the process of operation, the ABC algorithm uses different behaviors of three kinds of bees, namely hired bees, observed bees and scout bees, to solve an optimization problem.
The hired bees will inform the observed bees of the food source information through a wagging dance, and the observed bees will choose the food source and search around the food source. The scout bees are responsible for finding new food sources, and the amount of honey in the food source is expressed as the value of fitness. When collecting honey, hired bees and observed bees implement the local search. According to the honey source information, appropriate areas are selected for mining, and excellent honey source information is preserved in accordance with the greedy principle. In the later stage of the algorithm, the final goal of the problem is achieved through a continuous iterative process.
The ABC algorithm obtains the best solution to the problem through continuous search behavior. A flow chart of the ABC algorithm is shown in Figure 4.
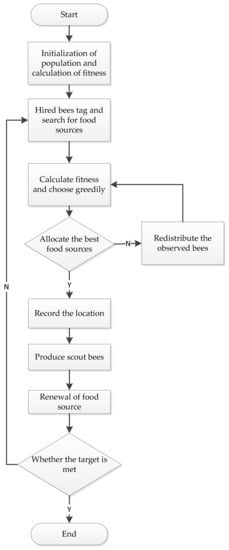
Figure 4.
The flow chart of ABC algorithm.
In the process of the ABC algorithm, the honey-gathering behavior of bees can be mapped to the optimization problem, the food source is the feasible solution set of the optimization problem, the amount of honey in the food source is the optimization value of the optimization problem, and the process of searching and picking honey is the process of solving the problem. Accordingly, the vector generated by the fitness value of the ABC algorithm can be presented as the attribute vector of QoS. Since the ABC algorithm is a local optimization, it is suitable for solving the service composition process in the global strategy of multi-service composition.
3.3. VS–ABC Hybrid Search Algorithm
The vortex search algorithm (VS) is a global search algorithm with a large search range. It is usually used to solve a single-target solution set. The artificial bee colony algorithm (ABC) is a swarm optimization algorithm with prominent local search. Wang et al. proposed a novel hybrid vortex search and artificial bee colony algorithm for numerical optimization problems [33]. Simplified from the hybrid algorithm, a new VS–ABC hybrid search algorithm is formed. In this study, the process of service composition is defined as the local optimization stage, and the process of service composition regrouping is defined as the global optimization stage. Therefore, combined with the advantages of VS and ABC algorithms, the global search is carried out based on the local optimal solution of the ABC algorithm, so as to expand the search scope of the algorithm and maintain the characteristics of fast convergence. The search speed of the internal composition process is ensured, and the search scope of the external composition stage is enlarged, which further ensures the accuracy of the target solution. It is optimized in both time and space, and the possibility of falling into a local optimal solution is reduced.
In the local search stage, firstly, based on the ABC algorithm, the formula is used to generate the initial solution and calculate the fitness. Then, the optimal value is achieved by the greedy selection of the observed bees, and the cycle is stopped when a solution satisfying the target appears. After that, the global search is started by the VS algorithm. Starting from the local optimal solution generated in the local search stage, the iteration radius is calculated according to the formula ; and are changed by Gaussian distribution. The global optimal solution is obtained after the cycle.
The flow chart of the hybrid VS–ABC algorithm is shown in Figure 5.
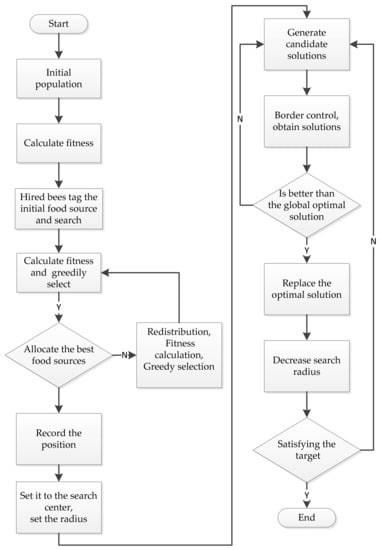
Figure 5.
The flow chart of hybrid VS–ABC algorithm.
The composition path of multiple service groups of the hybrid search algorithm can be represented by the vector of optimal solutions.
The pseudo-codes of the VS–ABC algorithm are described as follows (Algorithm 1):
| Algorithm 1 Initializing the population of solutions xi, i = 1, 2,…, n. |
| 1: Produce new solutions vij for the hired bees and evaluate them. 2: Greedy selection of hired bees. 3: IF 4: Allocated the best food source 5: 6: ELSE 7: Produce new solutions vij for the hired bees and evaluate them 8: Greedy selection of hired bees 9: 10: Generate candidate solutions 11: Border control 12: REPEAT 13: IF 14: xbest is better than 15: 16: ELSE 17: 18: Decrease search radius 19: END |
3.4. Validation of VS–ABC Algorithm
In order to test the effectiveness of the VS–ABC algorithm and whether it has the ability to escape from the local optimal state, three benchmark functions, including Sphere, Rastrigin and Griewank functions, are used to verify the algorithm. Among them, Rastrigin and Griewank are multi-modal functions with multiple extreme values in the domain of the functions. Different from the previous two functions, Sphere is a unimodal function with only one extreme value in the domain of the function. The details of the functions are shown in Table 12.
Table 12.
The information of benchmark functions.
In order to compare the performance of three different algorithms, namely the vortex search algorithm, ABC algorithm and VS–ABC algorithm, the maximum number of iterations in this experiment is set to 100, the number of solution sets and initial population SN of the algorithm is set to 20, and the three algorithms are independently run 20 times. According to the running results, the changes in the optimal value, minimum value, average value and standard deviation of the three algorithms applied on three functions are recorded. The detailed data are shown in Table 13, Table 14 and Table 15.
Table 13.
The numerical results of Sphere.
Table 14.
The numerical results of Rastrigin.
Table 15.
The numerical results of Griewank.
As can be seen from the above three tables, the standard deviation of the ABC algorithm is the largest among the three functions, while the average value is the overall smallest among the three algorithms. The solution accuracy of the ABC algorithm is relatively low, and the algorithm fluctuates greatly as it is in an unstable state. In solving multi-modal functions, the disadvantage of the algorithm in global searches is especially obvious. Although the standard deviation of the VS algorithm is small compared with the VS–ABC algorithm, there is still some difference in its solving ability of complex problems, which is still insufficient. The VS–ABC algorithm has excellent performance among the three algorithms, and the value of standard deviation is small, indicating that the VS–ABC algorithm has high solving ability and solving accuracy. Therefore, the VS–ABC algorithm has the best global search and local search abilities among the three algorithms.
Sphere, Rastrigin and Griewank functions are iterated, and the convergence curves of the three algorithms are shown in Figure 6.
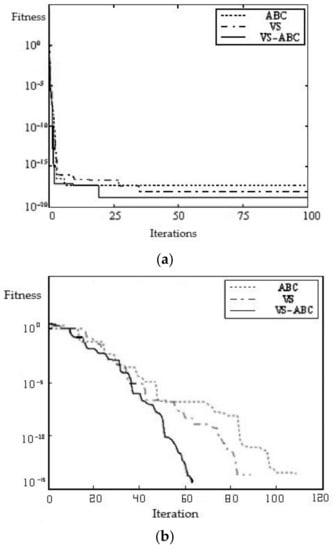
Figure 6.
The convergence curve of three functions. (a) The convergence curve of Sphere. (b) The convergence curve of Rastrigin. (c) The convergence of Griewank.
Figure 6 illustrates a scenario where the fitness value of the ABC algorithm shows the largest downward trend with the continuous increase in the number of iterations, especially in solving multi-peak functions with multiple extreme values. Due to the disadvantage of the ABC algorithm in its global search ability, the ABC algorithm is more likely to fall into the local optimal state than the other two algorithms, and the convergence speed of the ABC algorithm shows a downward trend. Under the same fitness value, the ABC algorithm needs a larger time span to find the optimal solution, and the gap with other algorithms will become more and more obvious as the number of iterations increases. The VS algorithm has a higher overall performance than the ABC algorithm, and it does not converge in advance. However, its local search ability is not outstanding, and the optimal value is still far from that of the hybrid search algorithm. The optimal value of the VS algorithm is still quite different from that of the hybrid search algorithm. With the increase in the number of iterations, the VS–ABC algorithm has more obvious advantages in global and local search abilities, and the performance of its fitness value is the best among the three algorithms. Furthermore, the VS–ABC algorithm has excellent solution accuracy and relative stability, which can escape from the state of local maximum.
4. Experiment Simulation
The proposed evaluation model and optimization algorithm are applied to the problem of a personalized automobile product customization service. Existing automobile manufacturers are mostly small- and medium-sized enterprises, and it is difficult to complete the whole life cycle of automobile production by themselves. Problems such as long delivery cycle, high manufacturing cost and insufficient manufacturing resources are common. Therefore, enterprises need to use cloud manufacturing service platforms to search for idle manufacturing resources and improve their utilization to complete the customization of automobile manufacturing tasks, so that products can be delivered to customers on time. Cloud manufacturing can integrate the resources of the entire automobile manufacturing enterprise and allocate them according to demand, completing the coordination of information and services. Optimizing the cloud manufacturing service composition and realizing the coordination and centralized management of distributed manufacturing resources can improve the production efficiency and benefits.
First of all, the automobile manufacturing tasks are decomposed. The cloud service platform is used to conduct a preliminary analysis on the characteristics, relevant parameter constraints and correlation model of the vehicle. Based on T, C, E, R and A, the sub-service and sub-service composition are matched twice and the VS–ABC algorithm is combined to find the optimal service composition strategy. Meanwhile, the results are compared with the VS algorithm and the ABC algorithm through experiments to verify the applicability of the VS–ABC algorithm.
4.1. Optimizing the Composition of Customized Services for Personalized Automotive Products
Combined with problem model in Section 2.2.2 and the VS–ABC algorithm, the fitness calculation formula of multi-service composition optimization can be obtained:
SMCI represents the Ith execution path of the multi-service composition. Based on the general applicability, let W1 = W2 = W3 = W4 = W5. The QoS attribute vector set of multi-service compositions can be expressed as . Then, the VS–ABC algorithm is used to optimize the problem based on these data.
To sum up, the multi-service combinatorial optimization problem is transformed into a mathematical problem and mapped by the VS–ABC algorithm to obtain the objective function so as to obtain the optimal QoS value of multi-service composition.
The mapping between the algorithm and the optimization problem is shown in Table 16.
Table 16.
Mapping relationship between VS–ABC and optimization problem.
4.2. Result Analysis
4.2.1. Convergence Analysis
Test environment: CPU Intel Core I3-10105F, 3.7 GHz, 4G portable computer. The test was carried out with simulation experiments through MATLAB.
The convergence of the three algorithms is compared on the basis of the number of subtasks (n = 10 and n = 50), the number of sub-services (J = 100) and the number of iterations (100). The experimental results are shown in Figure 7 and Figure 8.
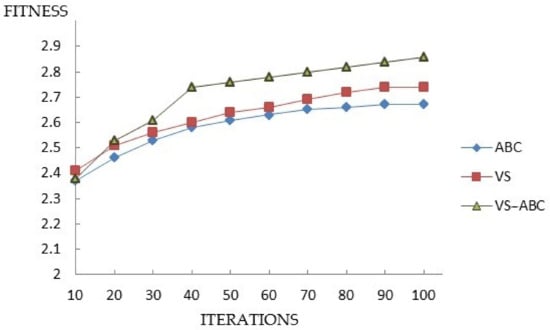
Figure 7.
The trend of average fitness for 10 tasks for three algorithms.
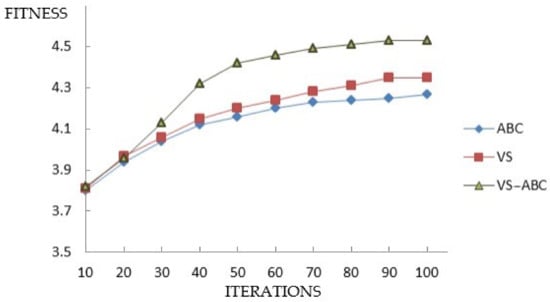
Figure 8.
The trend of average fitness for 50 tasks for three algorithms.
It can be clearly seen from Figure 7 and Figure 8 that the VS–ABC algorithm has a significant enhancement in convergence speed, and the more iterations (more than 30 times) there are, the greater the advantage of the hybrid search algorithm.
The VS–ABC algorithm is significantly faster in convergence speed. The ABC algorithm can enter the stable stage of convergence quickly, and its convergence is good, but its global search ability is insufficient. The larger the search space, the more obvious the disadvantage. The VS algorithm has a large search range in the early stage, but its convergence speed is slow. As the number of sub-services continues to increase, the VS algorithm’s problems become more and more obvious. As for the VS–ABC algorithm, because it combines the advantages of the VS and ABC algorithms, it has fast operation speed and a large search range. Furthermore, it is superior to the first two algorithms in both efficiency and effect of optimization, and its ability to avoid local optimums strengthens its stability.
The mean and standard deviation of fitness of the three algorithms are shown in Table 17.
Table 17.
Mean value and standard value of fitness in three algorithms.
As can be seen from Table 17, compared with the VS algorithm ABC algorithms, the VS–ABC algorithm has smaller standard deviation and better stability. Meanwhile, the standard deviation of the hybrid search algorithm changes least when the number of subtasks n increases, indicating that it is more suitable for multi-service composition optimization.
4.2.2. Time Performance Analysis
In order to evaluate the speed of the VS–ABC algorithm, the number of manufacturing subtasks is n = 100, and the number of sub-services ranges from J = 100 to J = 1000. The running-time trend of the algorithm is shown in Figure 9.
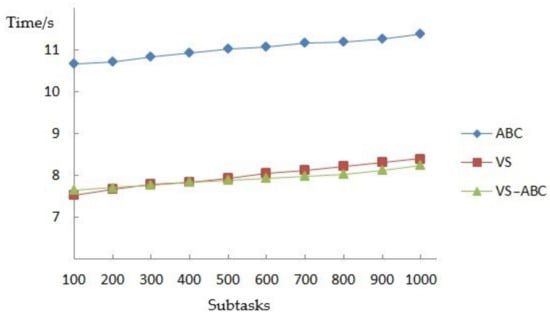
Figure 9.
The trend of three algorithms’ running time (n = 100, J = 100–1000).
When the number of sub-services is J = 400, and the number of manufacturing subtasks is from n = 100 to n = 1000, the algorithms’ running-time trend graphs can be obtained, as shown in Figure 10.
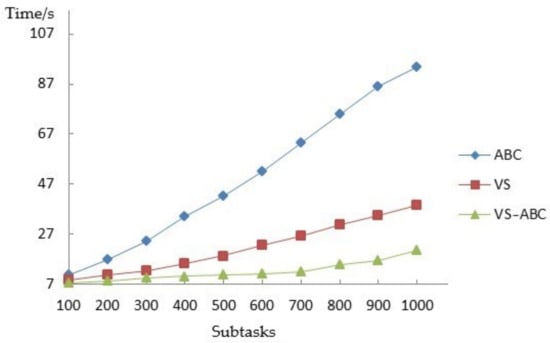
Figure 10.
The trend of three algorithms’ running time (J = 400, n = 100–1000).
It can be seen from Figure 9 that the change in the number of sub-services has little influence on the algorithm’s efficiency, but the VS–ABC and VS algorithms are obviously superior to the ABC algorithm. According to the analysis of Figure 10, as the number of manufacturing subtasks increases, the difference in computing speed among the three algorithms becomes larger and larger, and the VS–ABC algorithm is still superior to the other two algorithms in terms of computing time.
In conclusion, the VS–ABC algorithm has better processing efficiency and effect than the VS and ABC algorithms in finding the optimal multi-service composition strategy. At the same time, it has better stability and applicability in the application.
5. Conclusions
To address the problem where traditional service composition optimization strategy struggles to meet the personalized product manufacturing requirements under a cloud manufacturing mode, this study aims to analyze the relationship between manufacturing tasks and service composition, builds the evaluation model of service quality, and discusses the VS–ABC algorithm and its application. The main research results are as follows:
- (1)
- According to the supply chain management mode of product customization, the system structure and customization process of cloud manufacturing are constructed. This study analyzes the inadaptability of traditional service composition strategy in customization production modes. According to the recursion of service composition, the response of a single-service group is improved to a multi-service group, and the optimization strategy of multi-service composition for product customization is established;
- (2)
- The QoS evaluation model is established. Based on the constraint conditions of cost, time, energy, reliability and availability, the evaluation composition of weighted QoS attribute values is obtained by weighted calculation of the constraint conditions, and a multi-service composition strategy is provided;
- (3)
- The VS–ABC algorithm is introduced, which combines the characteristics of the VS algorithm in covering the global search space and the ABC algorithm in covering local search. The VS–ABC algorithm not only expands the search scope but also ensures the convergence speed, improves the problem‘s tendency to fall into the local optimal solution, and improves the accuracy of the optimal solution. Meanwhile, three benchmark functions are used to verify the effectiveness of the VS–ABC algorithm. The validation confirms that the VS–ABC algorithm can effectively avoid falling into the state of local optimal solutions, and the stability is outstanding;
- (4)
- A case study is considered and analyzed. The manufacturing tasks are decomposed and the sub-service groups are matched twice, which verifies the effectiveness of the proposed QoS mathematical model. Compared with the convergence effect and speed of the VS and ABC algorithms, the stability of the VS–ABC algorithm is superior.
In addition, our study does not deeply discuss and study how to collect and update real-time data of manufacturing resources, and we also should consider the processing of urgent orders adequately. The above problems will be studied in subsequent works. Regarding algorithms, we will try to implement a comparative study with different meta-heuristic algorithms to verify the solving ability of the VS–ABC algorithm.
Author Contributions
Conceptualization, funding acquisition, supervision, writing—review and editing, D.L.; project administration, visualization, writing—original draft, J.W.; methodology, resources, R.B.; data curation, L.L.; formal analysis, investigation, Y.L. All authors have read and agreed to the published version of the manuscript.
Funding
This research is supported by the China Scholarship Council (File No. (201908210398)).
Data Availability Statement
Not applicable.
Conflicts of Interest
The authors declare no conflict of interest.
References
- Sun, X.; Wandelt, S.; Zhang, A. On the degree of synchronization between air transport connectivity and COVID-19 cases at worldwide level. Transp Policy 2021, 105, 115–123. [Google Scholar] [CrossRef] [PubMed]
- Bohu, L.; Lin, Z.; Xudong, C. Introduction to cloud manufacturing. ZTE Commun. 2010, 16, 6–8. Available online: https://www.zte.com.cn/global/about/magazine/zte-communications/2010/4/en_140/196752.html (accessed on 25 August 2010).
- Li, H.B.; Zhang, L.; Ren, L.; Chai, D.X.; Tao, F.; Luo, L.Y.; Wang, Z.Y.; Yin, C.; Huang, G. Further discussion on cloud manufacturing. Comput. Integr. Manuf. Syst. 2011, 17, 449–457. [Google Scholar] [CrossRef]
- Attiya, I.; Abualigah, L.; Alshathri, S.; Elsadek, D.; Abd Elaziz, M. Dynamic Jellyfish Search Algorithm Based on Simulated Annealing and Disruption Operators for Global Optimization with Applications to Cloud Task Scheduling. Mathematics 2022, 10, 1894. [Google Scholar] [CrossRef]
- Zhang, L.; Luo, Y.; Tao, F.; Li, B.H.; Ren, L.; Zhang, X.; Guo, H.; Cheng, Y.; Hu, A.; Liu, Y. Cloud manufacturing: A new manufacturing paradigm. Enterp. Inf. Syst. 2018, 8, 167–187. [Google Scholar] [CrossRef]
- Wang, F.; Laili, Y.; Zhang, L. A many-objective memetic algorithm for correlation-aware service composition in cloud manufacturing. Int. J. Prod. Res. 2020, 59, 1–19. [Google Scholar] [CrossRef]
- Li, F.; Zhang, L.; Liu, Y.K. QoS-aware service in Cloud Manufacturing: A Gale-Shapley Algorithm-Based Approach. IEEE Trans. Syst. Man Cybern. Syst. 2020, 50, 2386–2397. [Google Scholar] [CrossRef]
- Wang, J. Research on sustainable evolution of China’s cloud manufacturing policies. Technol. Soc. 2021, 66, 101639. [Google Scholar] [CrossRef]
- Hu, Y.; Pan, L.; Gu, D.; Wang, Z.; Liu, H.; Wang, Y. Matching of Manufacturing Resources in Cloud Manufacturing Environment. Symmetry 2021, 13, 1970. [Google Scholar] [CrossRef]
- Hu, Y.; Zhang, Z.; Wang, J.; Wang, Z.; Liu, H. Task Decomposition Based on Cloud Manufacturing Platform. Symmetry 2021, 13, 1311. [Google Scholar] [CrossRef]
- Singh, R.; Gehlot, A.; Akram, S.V.; Gupta, L.R.; Jena, M.K.; Prakash, C.; Singh, S.; Kumar, R. Cloud Manufacturing, Internet of Things-Assisted Manufacturing and 3D Printing Technology: Reliable Tools for Sustainable Construction. Sustainability 2021, 13, 7327. [Google Scholar] [CrossRef]
- Zhang, C.; Zhang, C.; Zhuang, J.; Han, H.; Yuan, B.; Liu, J.; Yang, K.; Zhuang, S.; Li, R. Evaluation of Cloud 3D Printing Order Task Execution Based on the AHP-TOPSIS Optimal Set Algorithm and the Baldwin Effect. Micromachines 2021, 12, 801. [Google Scholar] [CrossRef] [PubMed]
- Lee, K.-L.; Roesinger, A.; Hommel, U. Development and Practice of Industry 4.0 in China—Practical Experience of a German Industrial Software Company in China. Sci 2022, 4, 28. [Google Scholar] [CrossRef]
- Lin, Y.K.; Chong, C.H. Fast GA-based project scheduling for computing resources allocation in a cloud manufacturing system. J. Intell. Manuf. 2017, 28, 1189–1201. [Google Scholar] [CrossRef]
- Yang, Y.; Yang, B.; Wang, S.; Liu, W.; Jin, T. An Improved Grey Wolf Optimizer Algorithm for Energy-Aware Service Composition in Cloud Manufacturing. Int. J. Adv. Manuf. Technol. 2019, 105, 3079–3091. [Google Scholar] [CrossRef]
- Zhang, W.; Xiao, J.; Zhang, S.; Lin, J.; Feng, R. A utility-aware multi-task scheduling method in cloud manufacturing using extended NSGA-II embedded with game theory. Int. J. Comput. Integr. Manuf. 2021, 34, 175–194. [Google Scholar] [CrossRef]
- Gavvala, S.K.; Jatothb, C.; Gangadharan, G.R.; Buyyad, R. QoS-aware cloud service composition using eagle strategy. Future Gener. Comput. Syst. 2019, 90, 273–290. [Google Scholar] [CrossRef]
- Maryam, R.N.; Koroush, E.; Omid, F.V. Topology analysis of manufacturing service supply–demand hyper-network considering QoS properties in the cloud manufacturing system. Robot. Comput. -Integr. Manuf. 2021, 72, 102205. [Google Scholar] [CrossRef]
- Khan, A.; Umar, A.I.; Shirazi, S.H.; Ishaq, W.; Shah, M.; Assam, M.; Mohamed, A. QoS-Aware Cost Minimization Strategy for AMI Applications in Smart Grid Using Cloud Computing. Sensors 2022, 22, 4969. [Google Scholar] [CrossRef]
- Sefati, S.S.; Halunga, S. A Hybrid Service Selection and Composition for Cloud Computing Using the Adaptive Penalty Function in Genetic and Artificial Bee Colony Algorithm. Sensors 2022, 22, 4873. [Google Scholar] [CrossRef]
- Liu, W.; Zhang, X.; Feng, W.; Huang, M.; Xu, Y. Optimization of PBFT Algorithm Based on QoS-Aware Trust Service Evaluation. Sensors 2022, 22, 4590. [Google Scholar] [CrossRef]
- Rakrouki, M.A.; Alharbe, N. QoS-Aware Algorithm Based on Task Flow Scheduling in Cloud Computing Environment. Sensors 2022, 22, 2632. [Google Scholar] [CrossRef] [PubMed]
- Syed, S.A.; Rashid, M.; Hussain, S.; Azim, F.; Zahid, H.; Umer, A.; Waheed, A.; Zareei, M.; Vargas-Rosales, C. QoS Aware and Fault Tolerance Based Software-Defined Vehicular Networks Using Cloud-Fog Computing. Sensors 2022, 22, 401. [Google Scholar] [CrossRef]
- Babbar, H.; Rani, S.; Singh, A.; Abd-Elnaby, M.; Choi, B.J. Cloud Based Smart City Services for Industrial Internet of Things in Software-Defined Networking. Sustainability 2021, 13, 8910. [Google Scholar] [CrossRef]
- Ben Alla, S.; Ben Alla, H.; Touhafi, A.; Ezzati, A. An Efficient Energy-Aware Tasks Scheduling with Deadline-Constrained in Cloud Computing. Computers 2019, 8, 46. [Google Scholar] [CrossRef]
- Zhu, K.; Li, L.D.; Li, M. School Timetabling Optimisation Using Artificial Bee Colony Algorithm Based on a Virtual Searching Space Method. Mathematics 2022, 10, 73. [Google Scholar] [CrossRef]
- Li, M.; Wang, G.-G.; Yu, H. Sorting-Based Discrete Artificial Bee Colony Algorithm for Solving Fuzzy Hybrid Flow Shop Green Scheduling Problem. Mathematics 2021, 9, 2250. [Google Scholar] [CrossRef]
- Yildizdan, G.; Baykan, Ö.K. A New Hybrid BA_ABC Algorithm for Global Optimization Problems. Mathematics 2020, 8, 1749. [Google Scholar] [CrossRef]
- Safayenikoo, H.; Khajehzadeh, M.; Nehdi, M.L. Novel Evolutionary-Optimized Neural Network for Predicting Fresh Concrete Slump. Sustainability 2022, 14, 4934. [Google Scholar] [CrossRef]
- Grisales-Noreña, L.F.; Montoya, O.D.; Hincapié-Isaza, R.A.; Granada Echeverri, M.; Perea-Moreno, A.-J. Optimal Location and Sizing of DGs in DC Networks Using a Hybrid Methodology Based on the PPBIL Algorithm and the VSA. Mathematics 2021, 9, 1913. [Google Scholar] [CrossRef]
- Paz-Rodríguez, A.; Castro-Ordoñez, J.F.; Montoya, O.D.; Giral-Ramírez, D.A. Optimal Integration of Photovoltaic Sources in Distribution Networks for Daily Energy Losses Minimization Using the Vortex Search Algorithm. Appl. Sci 2021, 11, 4418. [Google Scholar] [CrossRef]
- Martínez-Gil, J.F.; Moyano-García, N.A.; Montoya, O.D.; Alarcon-Villamil, J.A. Optimal Selection of Conductors in Three-Phase Distribution Networks Using a Discrete Version of the Vortex Search Algorithm. Computation 2021, 9, 80. [Google Scholar] [CrossRef]
- Wang, Z.; Wu, G.; Wan, Z. A novel hybrid vortex search and artificial bee colony algorithm for numerical optimization problems. Wuhan Univ. J. Nat. Sci. 2017, 22, 295–306. [Google Scholar] [CrossRef]


Publisher’s Note: MDPI stays neutral with regard to jurisdictional claims in published maps and institutional affiliations. |
© 2022 by the authors. Licensee MDPI, Basel, Switzerland. This article is an open access article distributed under the terms and conditions of the Creative Commons Attribution (CC BY) license (https://creativecommons.org/licenses/by/4.0/).