1. Introduction
Electric energy storage systems are integral part of any renewable energy system [
1,
2]. For instance, employment of such technologies in renewable energy systems will manage and shift the loads efficiently to achieve an optimum energy consumption where minimum cost and energy loss is achieved [
3,
4]. The electric storage systems will allow for the generated electricity to be stored and used when the demand exceeds the direct generation resulting in a reduced cost of energy [
5,
6]. Furthermore, it helps the distributed (or stand-alone) renewable energy systems to be developed faster in different societies [
7,
8,
9].
Although the electric energy storage systems and the lithium-ion battery as their main component offer significant benefit toward energy efficiency measures, their relatively high environmental impact is raising concern [
10,
11,
12]. One of the main solutions to mitigate the higher environmental impact of such technologies is prolonging their cycle of use beyond their intended first application [
13,
14]. Second life batteries, disposed from electric vehicles after reaching 80% of their initial capacity [
15,
16,
17] could be reconfigured and used in less demanding applications. As the number of electric vehicles is increasing aligned with global net zero targets, it can be forecast that there will be large numbers of disposed second life batteries available which still have considerable capacity left to be used in other low stressed applications such as buildings [
18,
19].
Many studies investigated the application of second life batteries in buildings as their electric storage system. Mathews et al. [
20] have developed a thermo-economic model with capacity fade prediction for using second life batteries in residential buildings located in California. Considering a 60% state of health as the system’s end of life and limiting the SOC between 15% and 65%, it has been shown that battery energy storage system life is extended by up to 15 years. In this work, a data-based model is used to predict battery parameters variations in transient condition. Bhatt et al. [
21] have used machine learning methods for predicting the battery characteristics using experimental data obtained in the lab. The Long Short-Term Memory Network method has provided better accuracy compared to other methodologies used. The integration of second life battery energy storage system with an EV charging station is studied by Tong et al. [
22]. The second life battery storage system with 13.9 kWh capacity is considered in this study. In addition, the equivalent circuit model is used for mathematical modelling of second life batteries and PV cells, and the performance of system is evaluated in various weather conditions. The study has demonstrated an equivalent performance for the second life battery energy storage system to the fresh battery energy storage system with the advantage of a reduced price. Hart et al. [
23] have examined the impacts of using second life batteries in a CERTS microgrid application. For modelling of battery cells, the electrochemical impedance spectroscopy and hybrid-pulse power characterisation (HPPC) tests are utilised for fitting the model parameters using experimental data. It is concluded that using second life batteries in a micro-grid application provides promising performance for the system. In another similar study accomplished by Assuncao et al. [
24], a techno-economic assessment of second life battery system coupled with solar energy system in a building is performed. The ECM is used for mathematical modelling of batteries and forecasting the battery parameters’ fade such as capacity caused by degradation. The results have proven that second life batteries are cost effective when they are used in buildings for shifting of power during the day.
Based on the reviewed literature, the ECM is mostly used for modelling the second life battery applications. In addition, during mathematical modelling of second life batteries, the state of health (SoH) of the cells used in each pack is considered to be the same, in contrary with real applications. The second life modules collected from different vehicles have various SoH. Assuming a second life pack with homogenous health in modules could result in neglecting possible defections that could happen in practice. Accordingly, the main contribution of this study is to develop a technical assessment of the second life battery packs with heterogeneous SoH and comparison of results with the homogeneous packs. A methodology is introduced for modelling the second life packs by considering module-to-module SoH variations using the ECM. The results are validated against experimental data extracted from the lab. The degradation characterisation of the battery cells is also performed using the mix of experimental and forecast data. The performance of an off-grid PV system, integrated with second life battery energy storage system adopting (a) homogenous, and (b) heterogeneous SoH scenarios is analysed, and the finding highlighted.
2. Modelling and Simulation
In this study, a residential building equipped with stand-alone solar PV panels and EV charging station is considered as the case study. The residential building demand data is obtained by CREST demand model used in a study that analysed the electrical demand of UK residential buildings for 15,000 cases [
25]. The building is located in Oxford, UK. The specifications of proposed stand-alone PV power generation and energy storage systems are provided in
Table 1. The mathematical model used for predicting the solar energy generation using PVs is described in more detail in
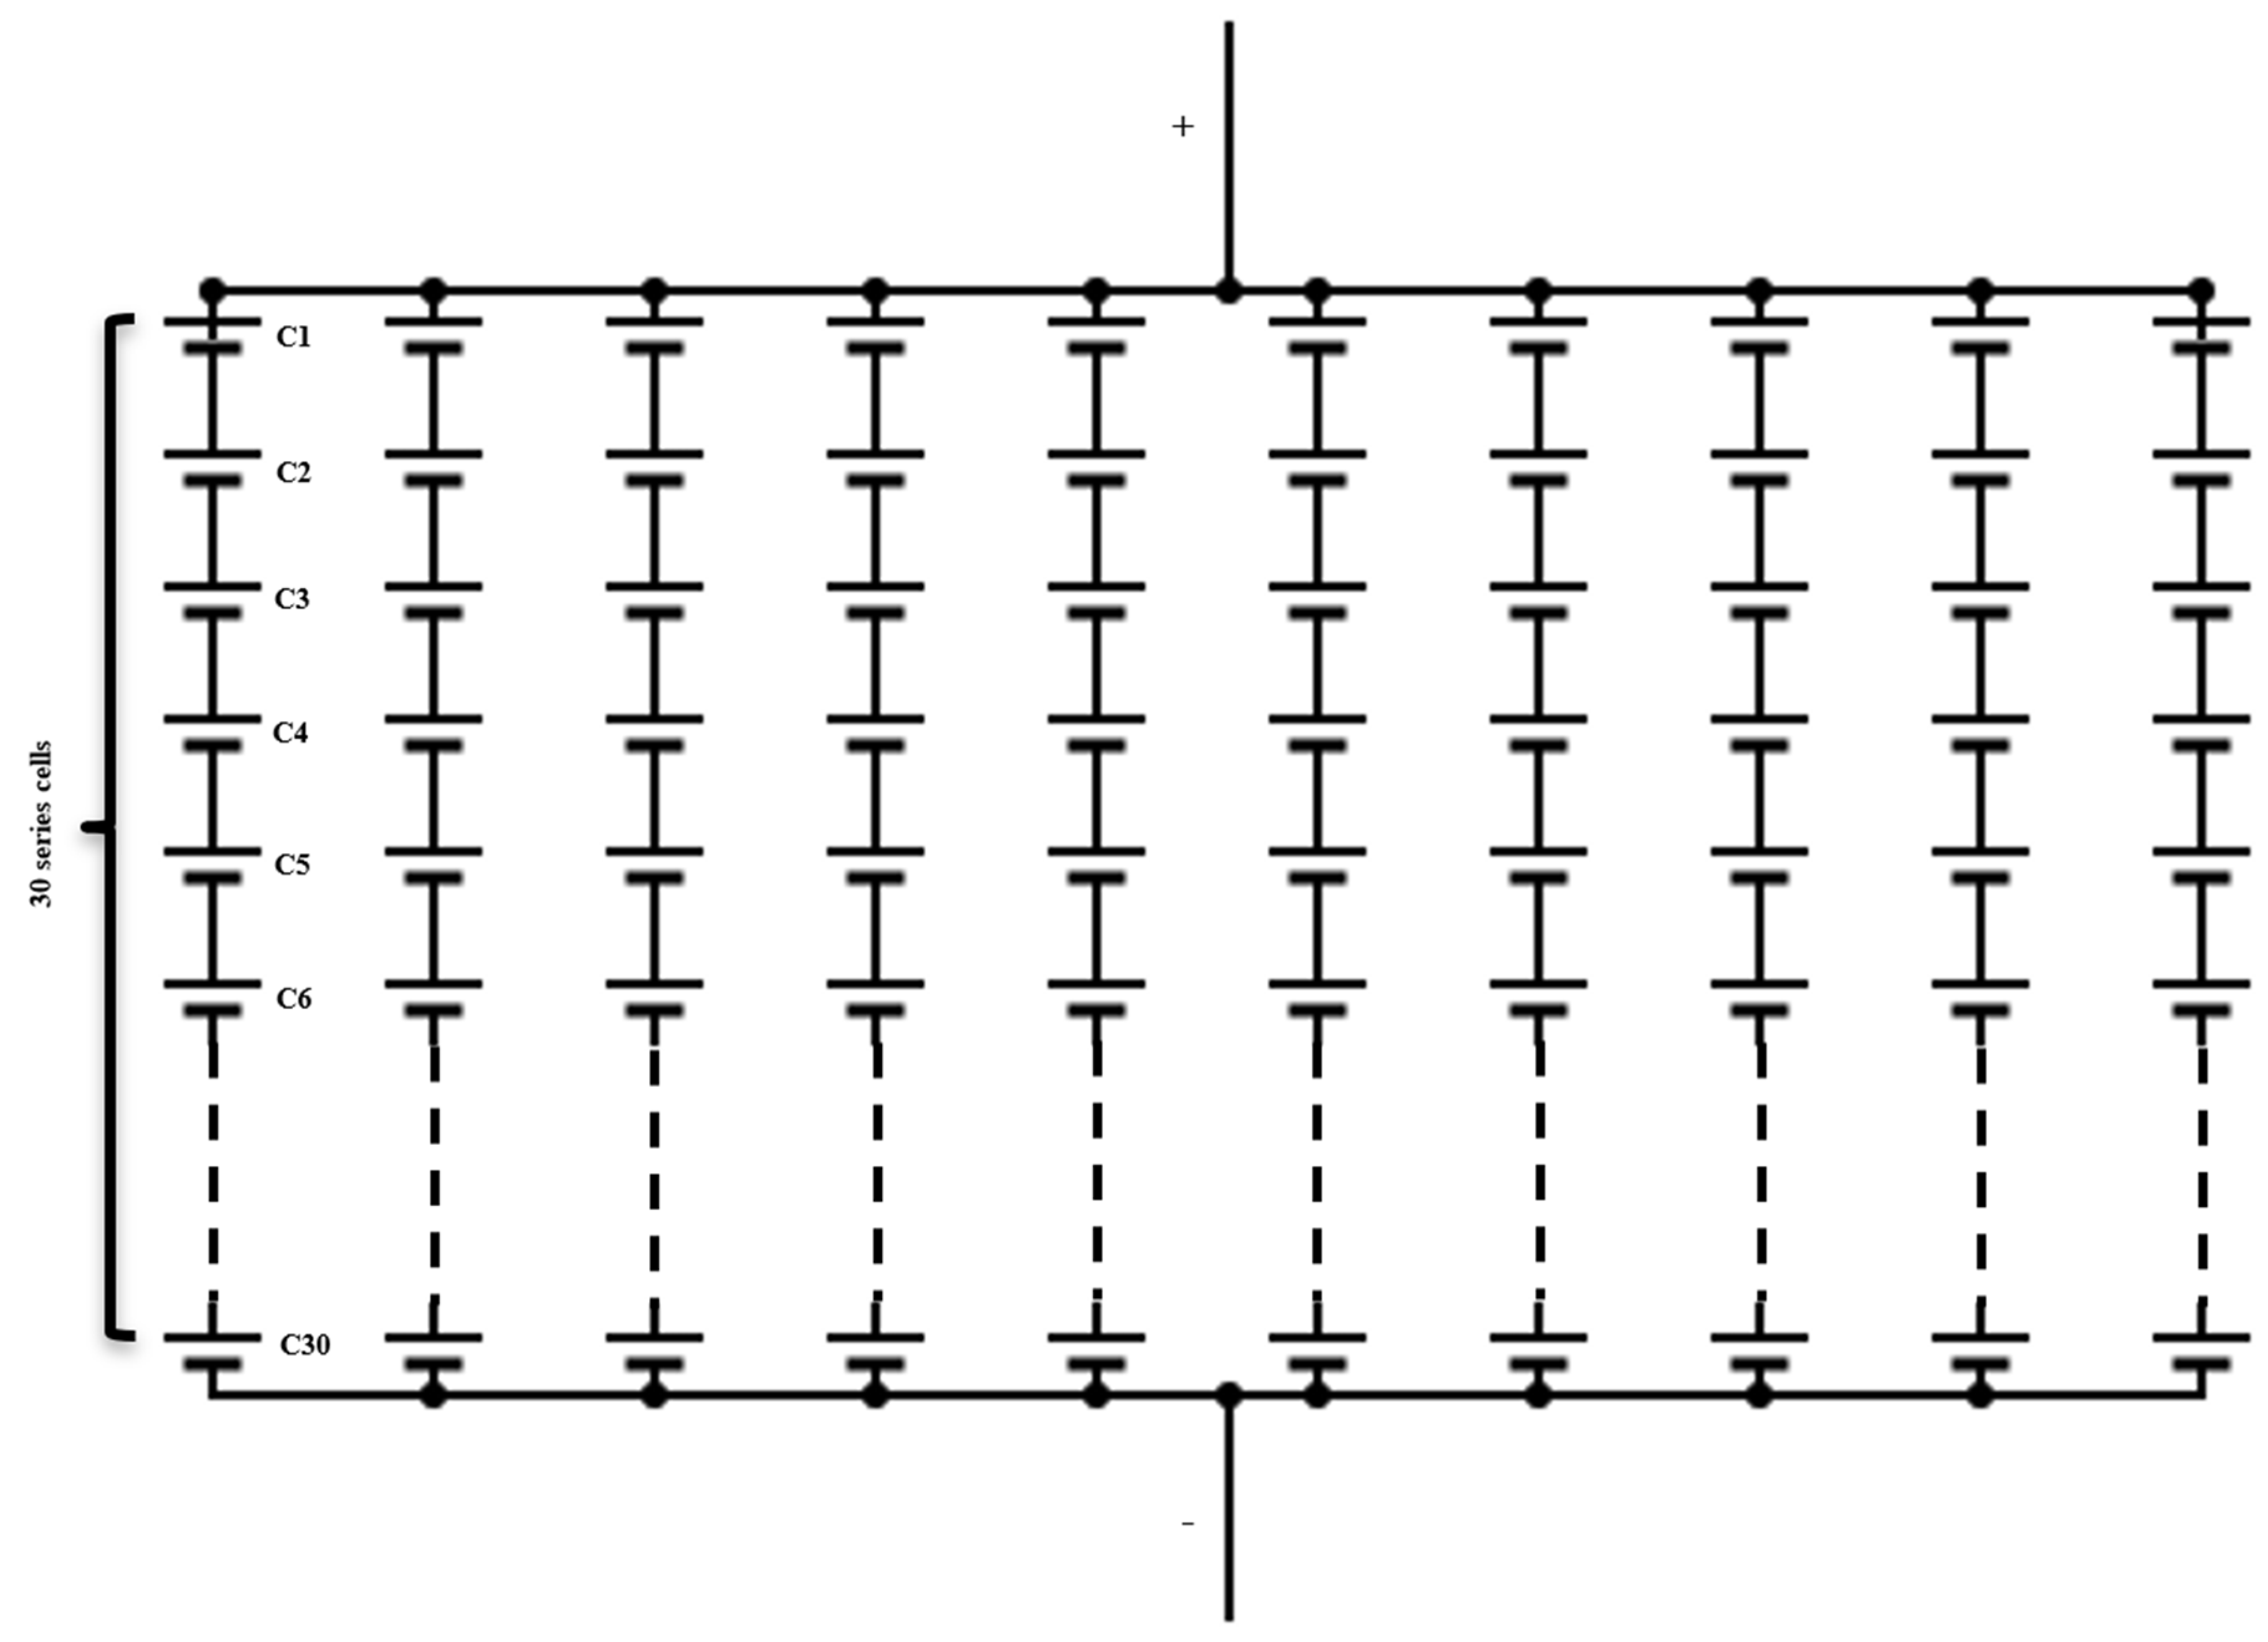
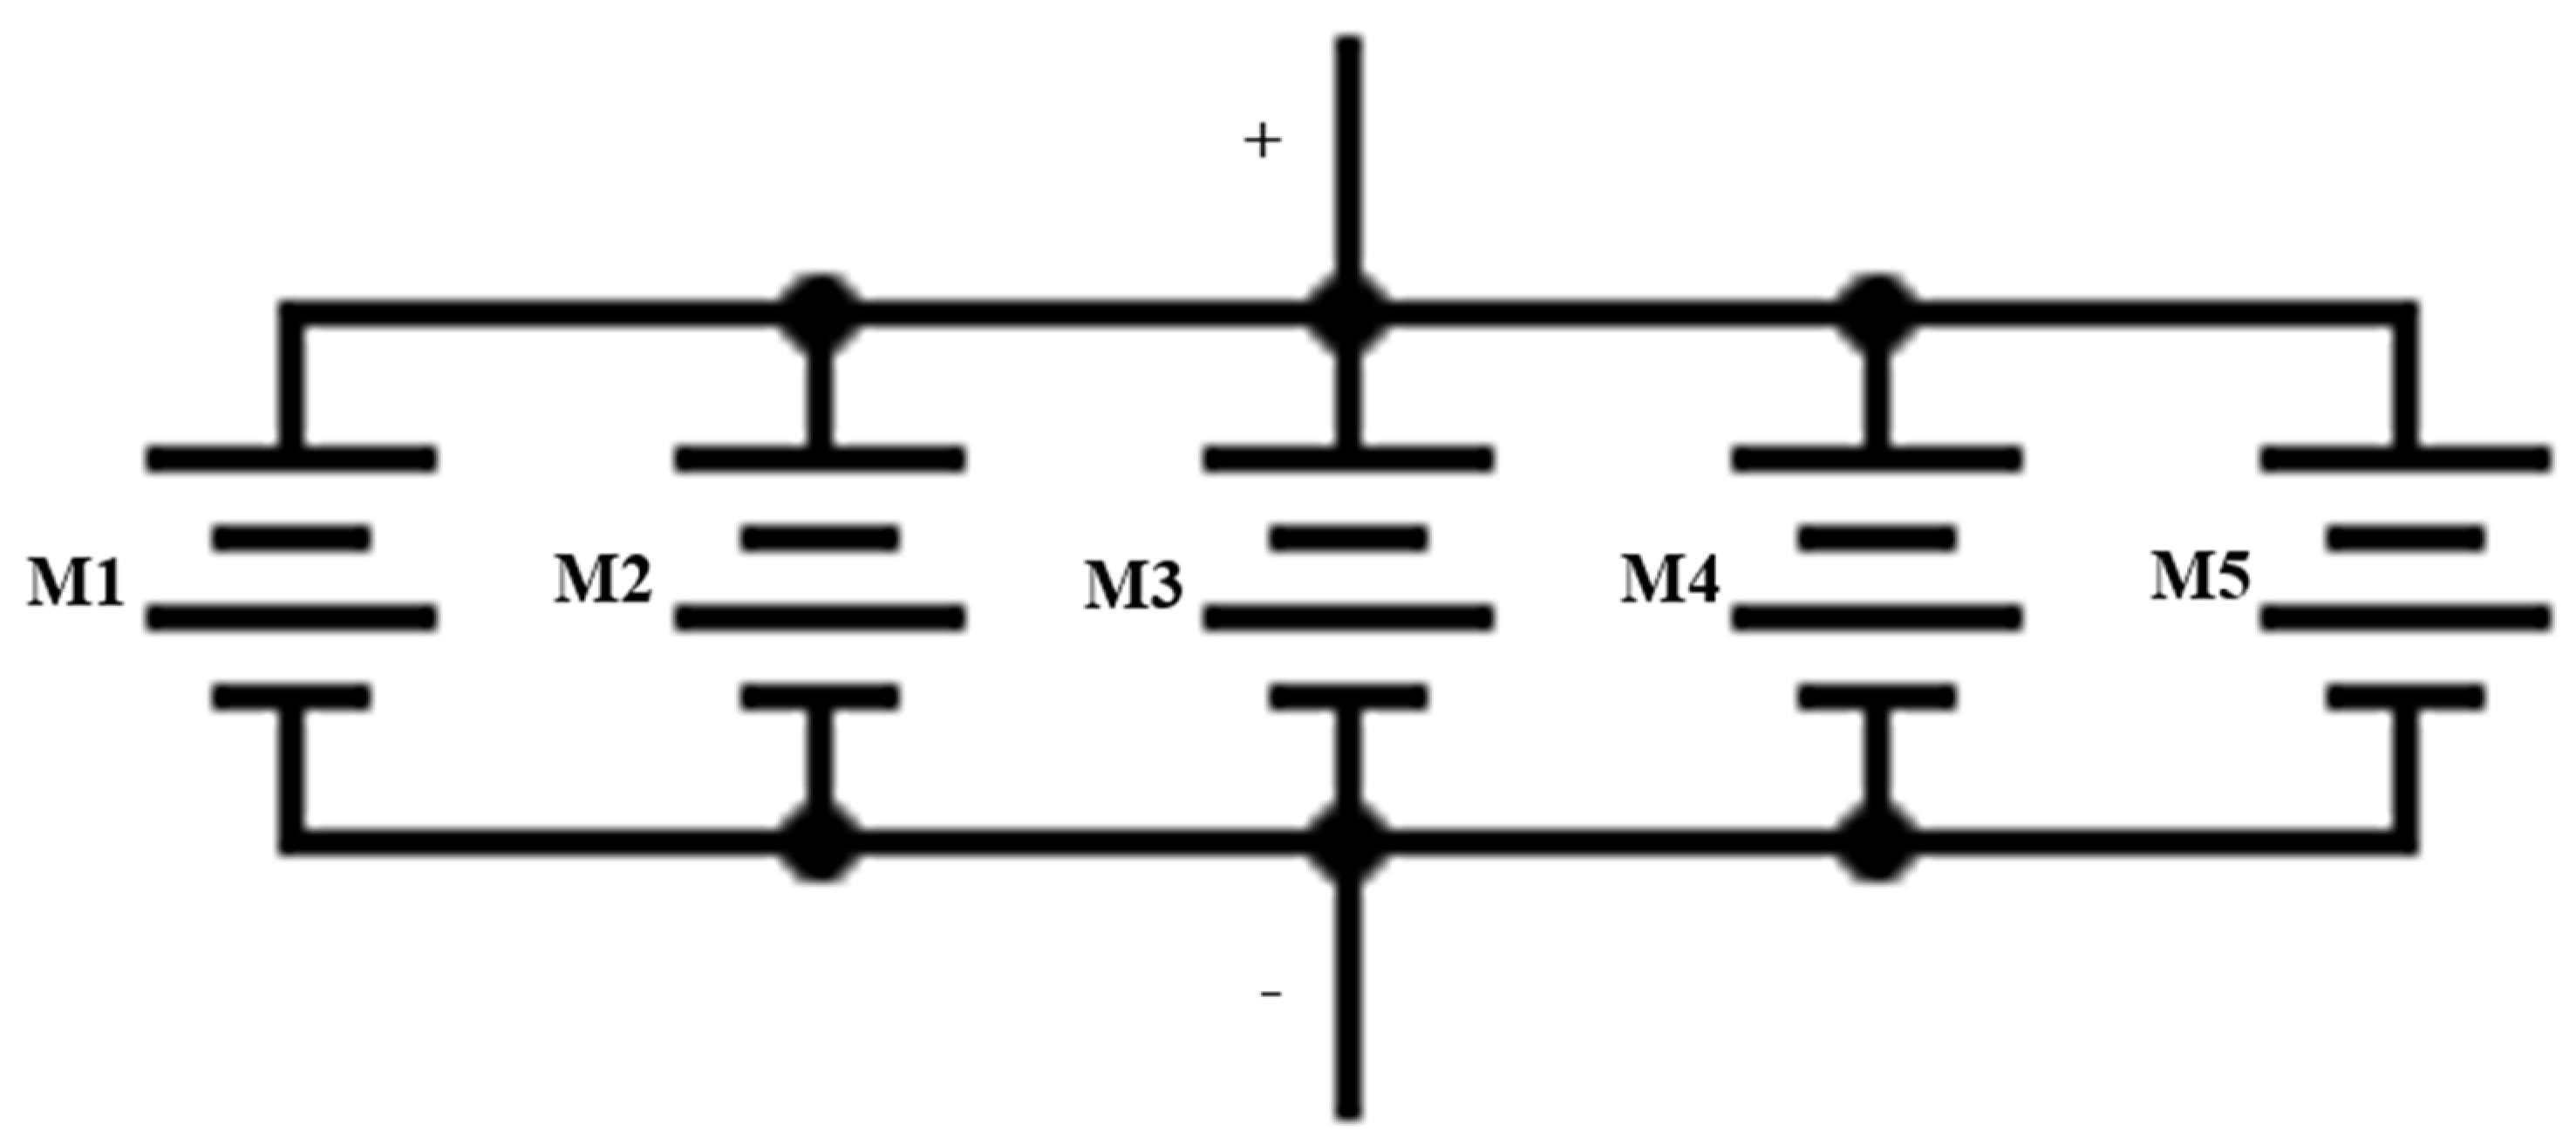
Appendix A. The topology and configuration of the cells and modules in the proposed second life battery packs are shown in
Figure 1 and
Figure 2. There are 5 modules connected in parallel in each pack. Each module, consists of 10 rows of 30 series cells connected in parallel. In addition, the block diagram of the system is shown in
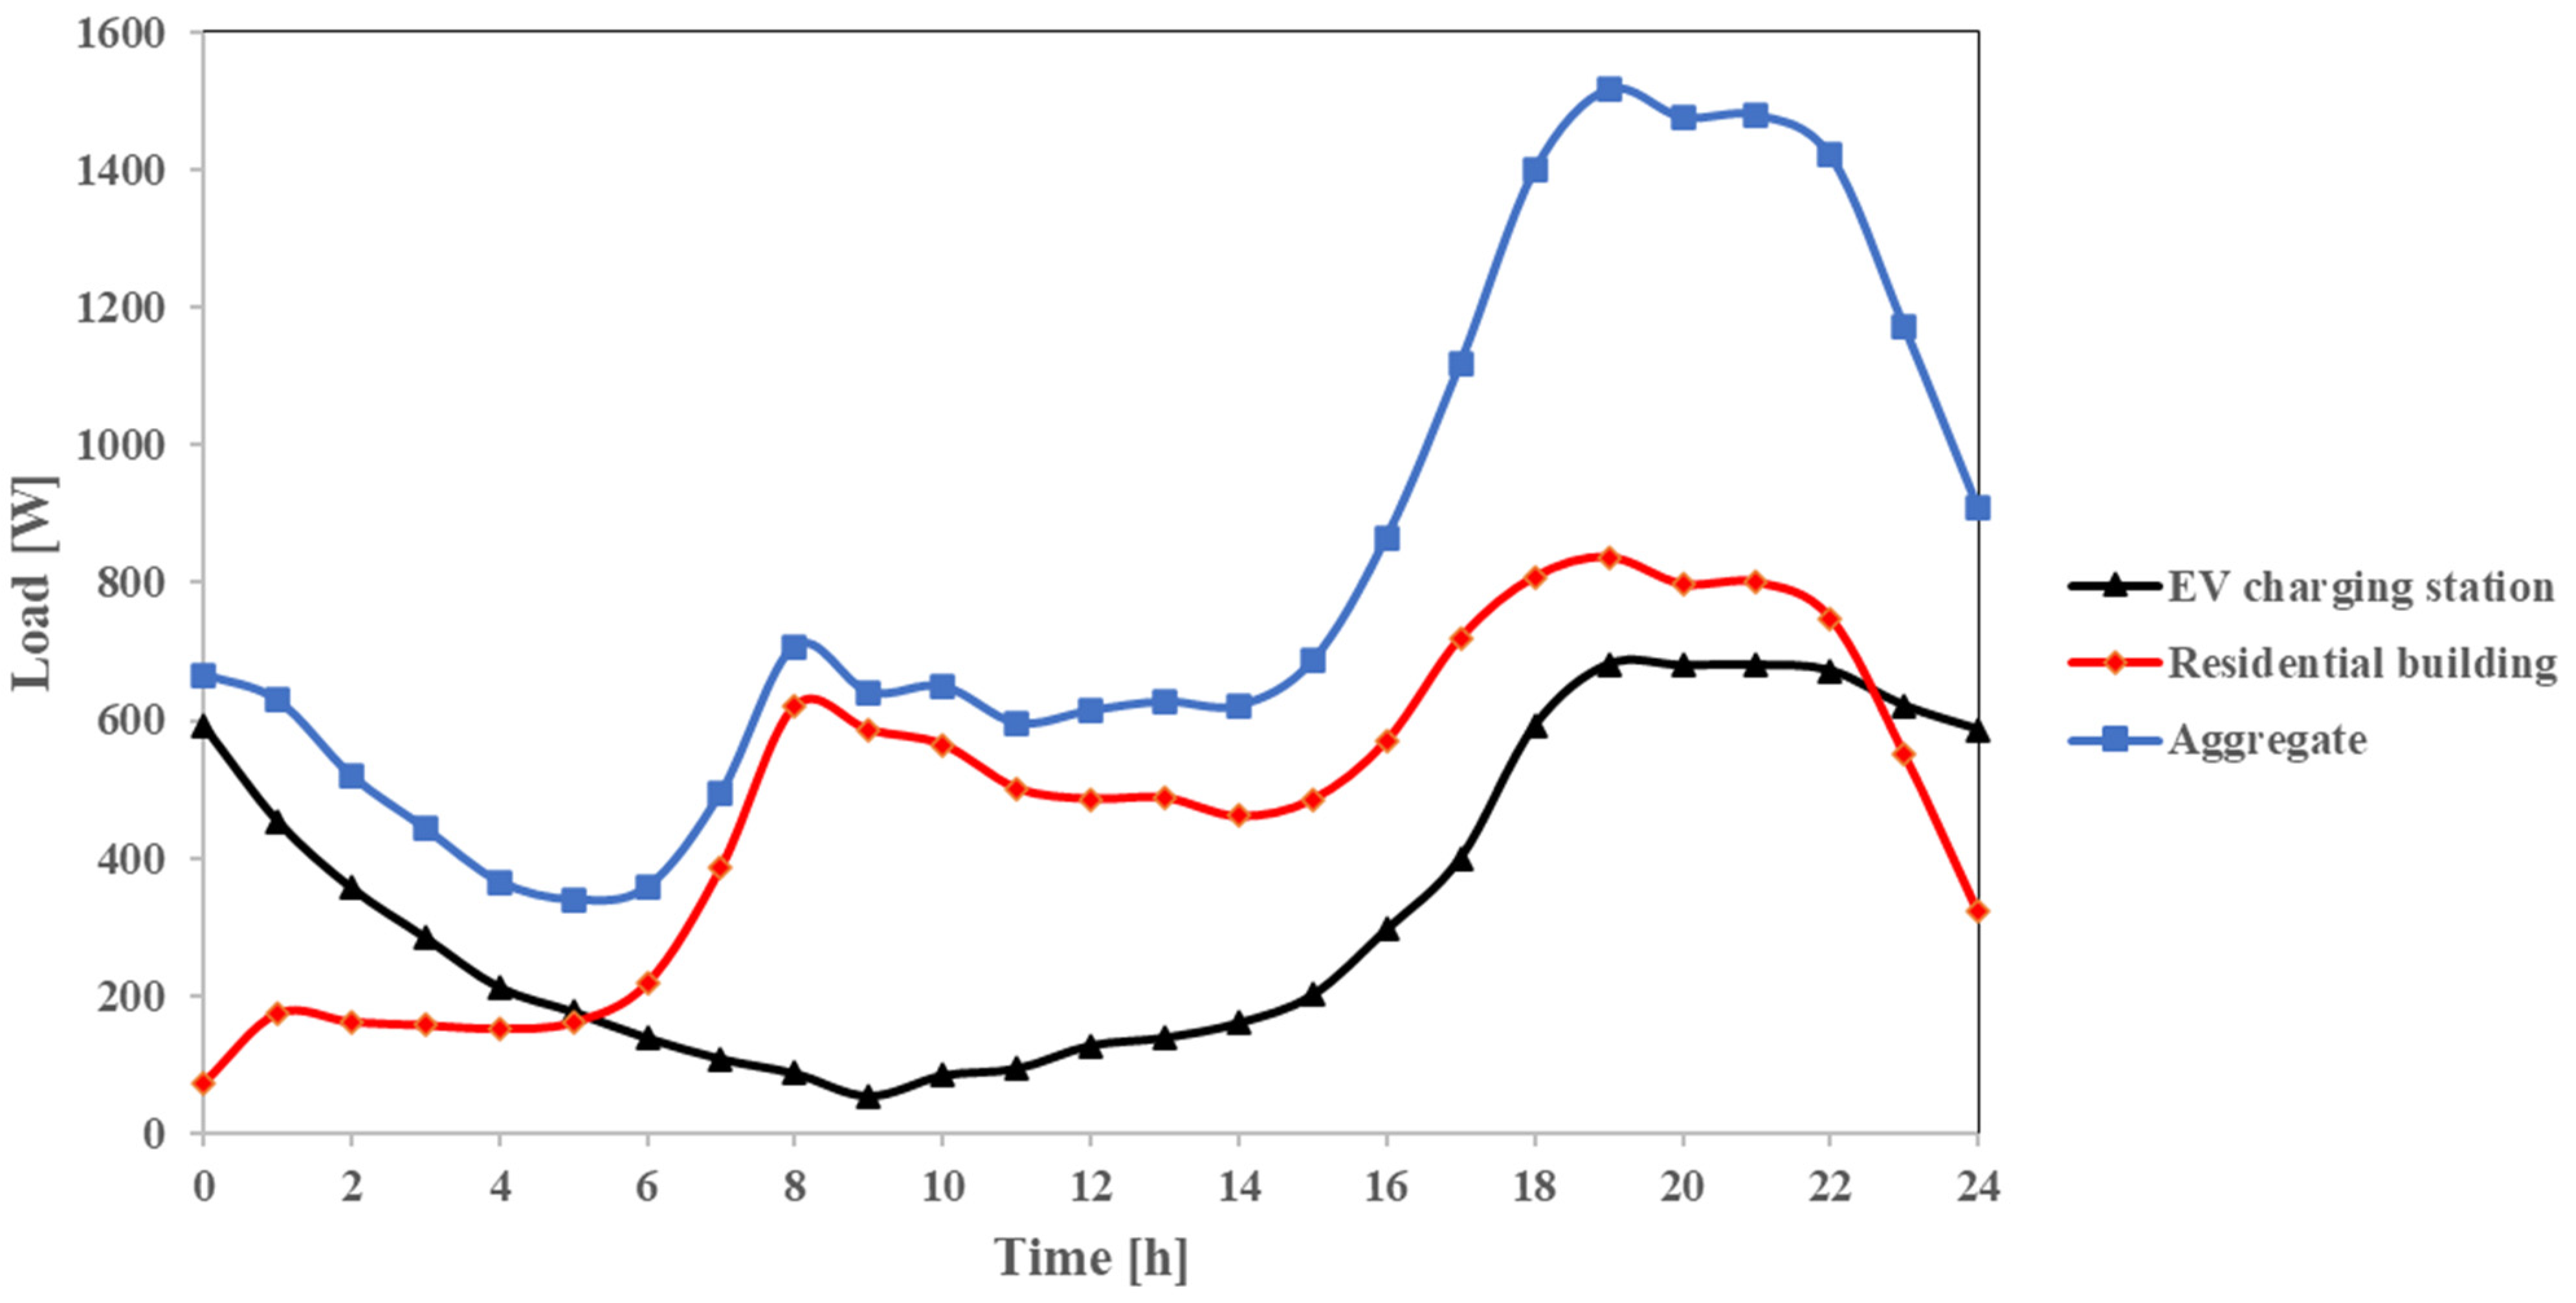
Figure 3. The produced energy by PV panels will be consumed in EV charging station and household consumers, while part of it will be stored in energy storage system. The load profiles applied to the system are shown in
Figure 4.
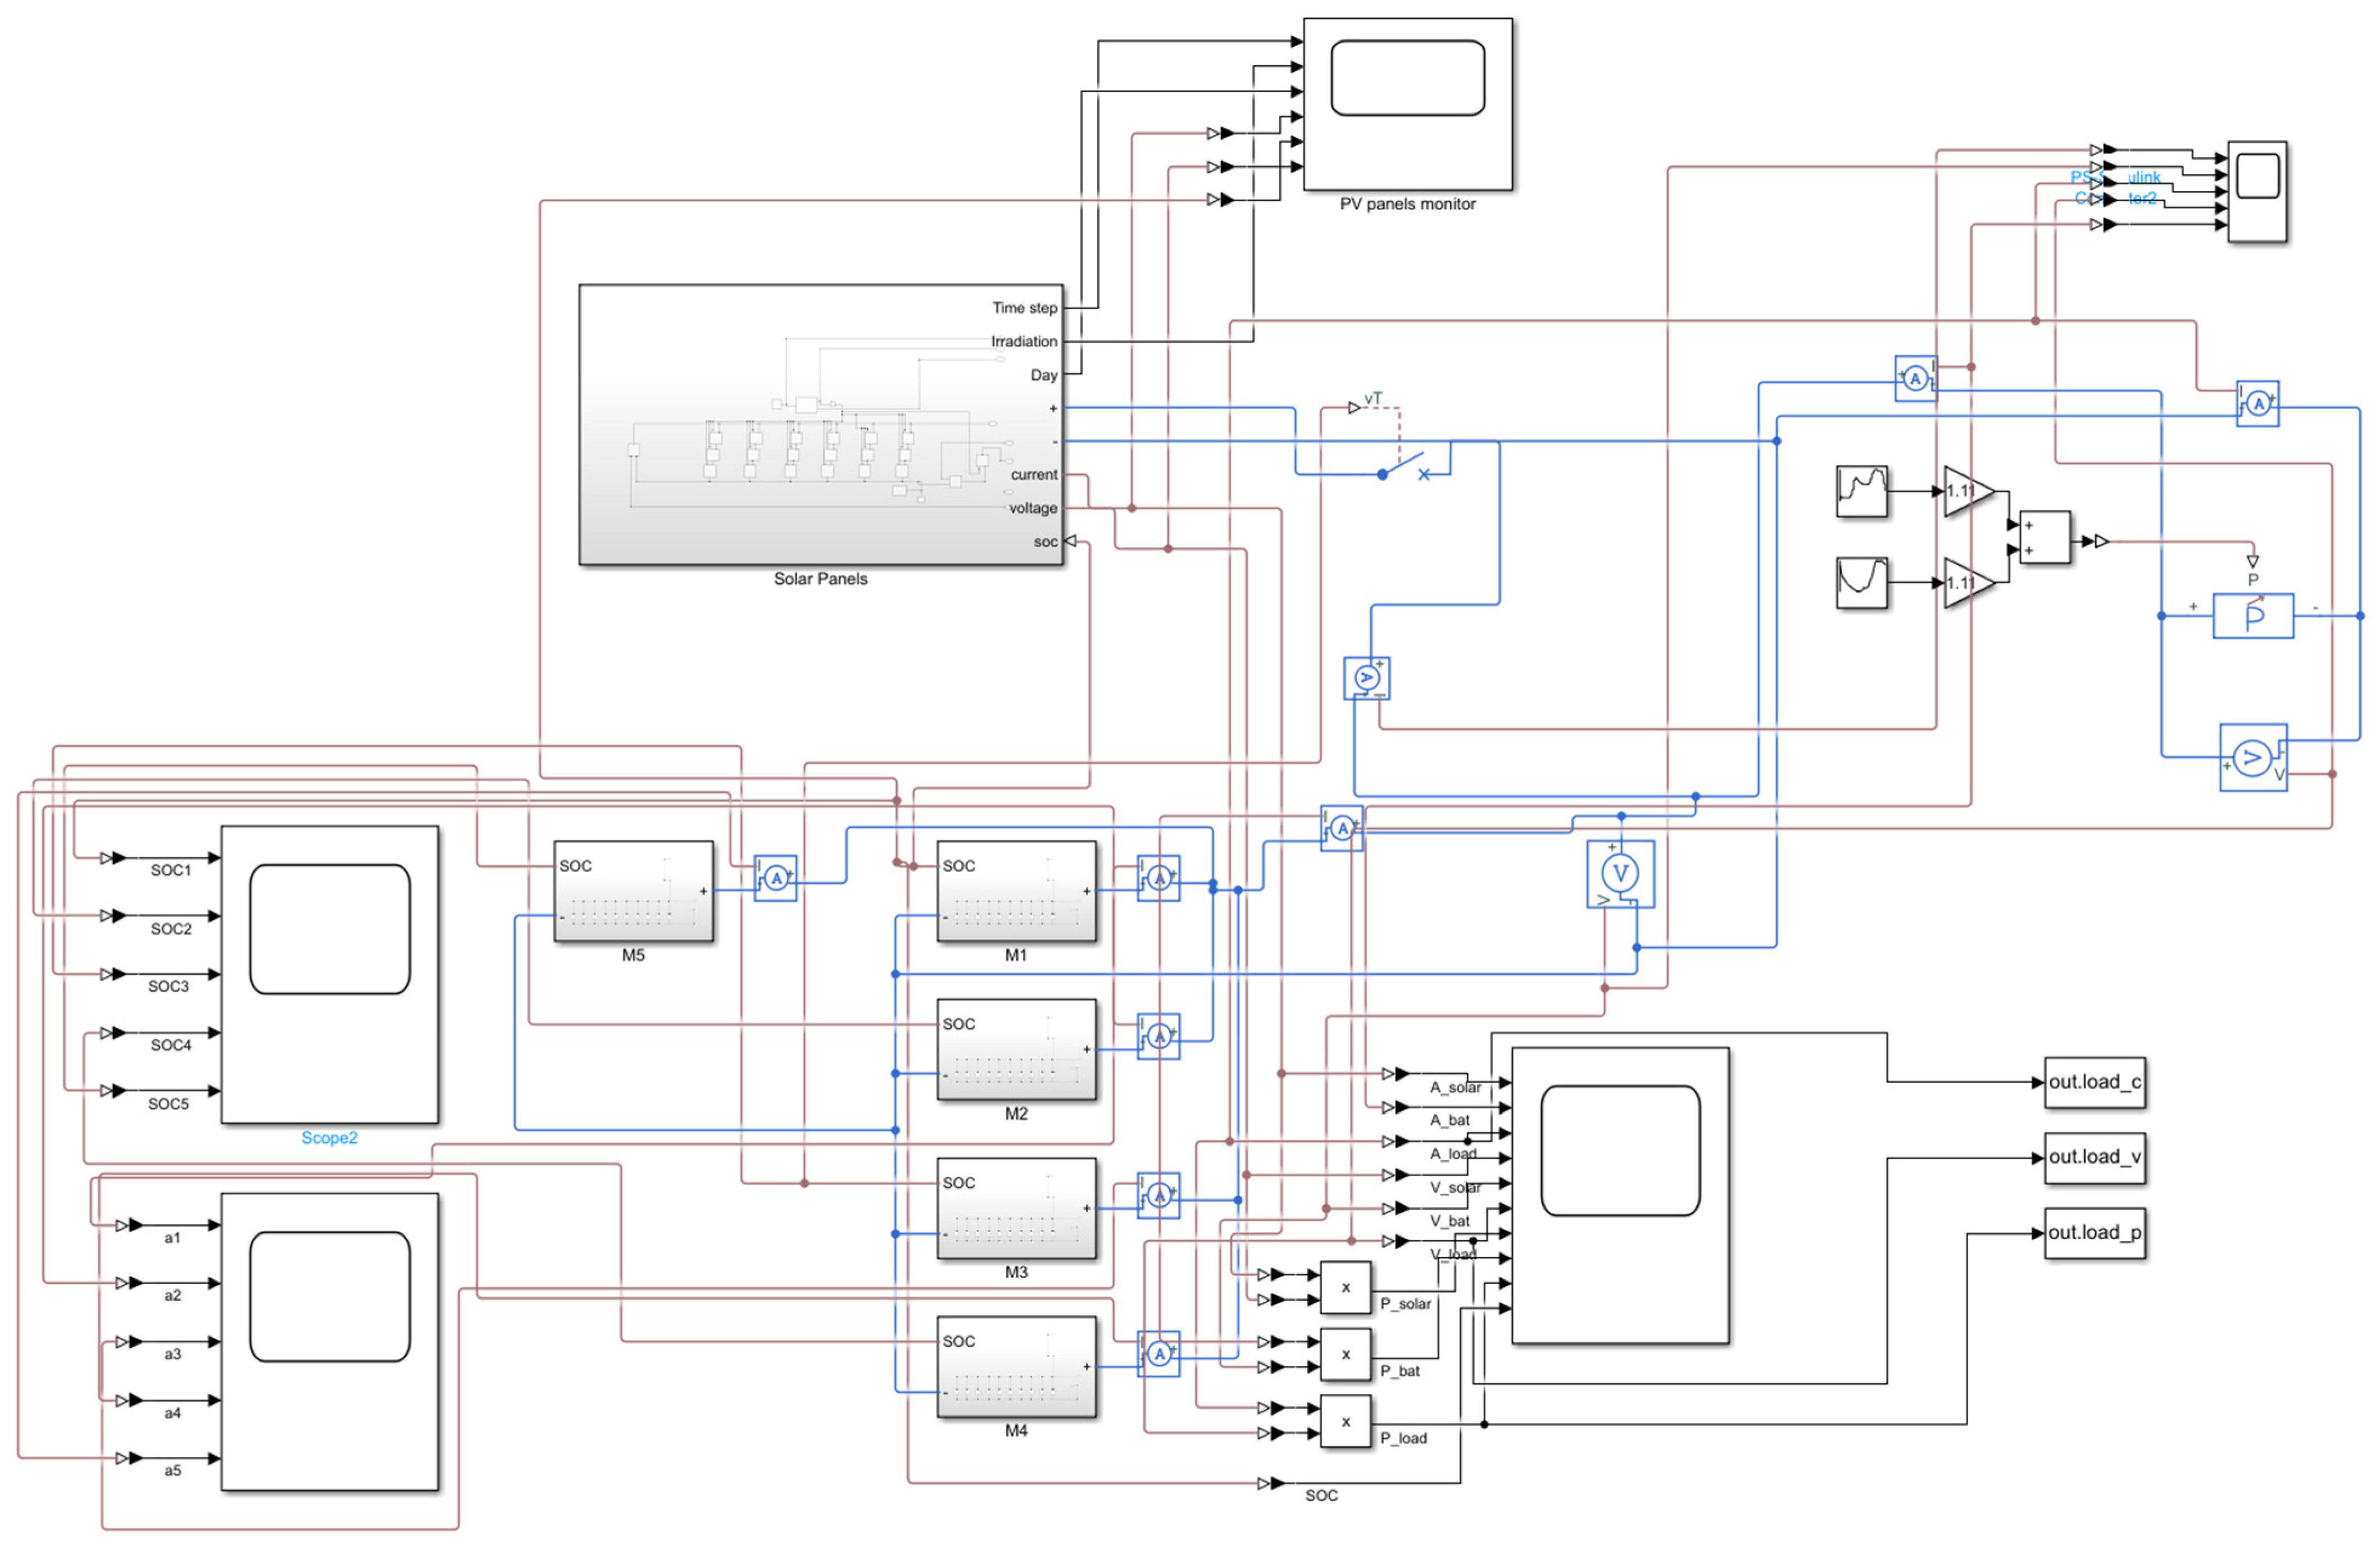
Figure 5 shows the proposed system block diagram in MATLAB Simulink. For preventing the batteries from being overcharged in the model, a circuit breaker block [
26,
27] is used in the mathematical model presented in
Figure 5. Accordingly, when batteries’ state of charge (SoC) raises above the threshold limit (which equals to 90% SoC in this study), PV panels will be disconnected from the system network.
In this study, the performance of two second life battery packs are compared to each other; the ones with homogeneous and heterogeneous SoH modules. In homogenous second life pack, the state of health of all modules are considered as the same and equal to 80%. While two modules with 85% SoH, two with 75% SoH, and one with 80% SoH are assumed in the heterogeneous pack, which contains five modules. The overall capacity of both second life battery packs is the same (
Table 2 and
Table 3).
Figure 4.
Different load demands applied to system [
25,
29].
Figure 4.
Different load demands applied to system [
25,
29].
Figure 5.
System block diagram in MATLAB Simulink.
Figure 5.
System block diagram in MATLAB Simulink.
2.1. Mathematical Modelling
2.1.1. Solar Energy Conversion
The PV cell block diagram used in MATLAB Simulink is shown in
Figure 6. As it is presented in
Table 1, Amersolar 360 W PV cells are used in this study for simulating the PV cells [
30]. The area of each PV panel equals to approximately 2 m
2 [
30].
Moreover, for calculating the PV output amperage, Equation (1) is employed:
where
is the thermal voltage,
and
are diode emission coefficients,
is the solar-generated current, and
and
are diode saturation currents [
30].
2.1.2. Second Life Batteries
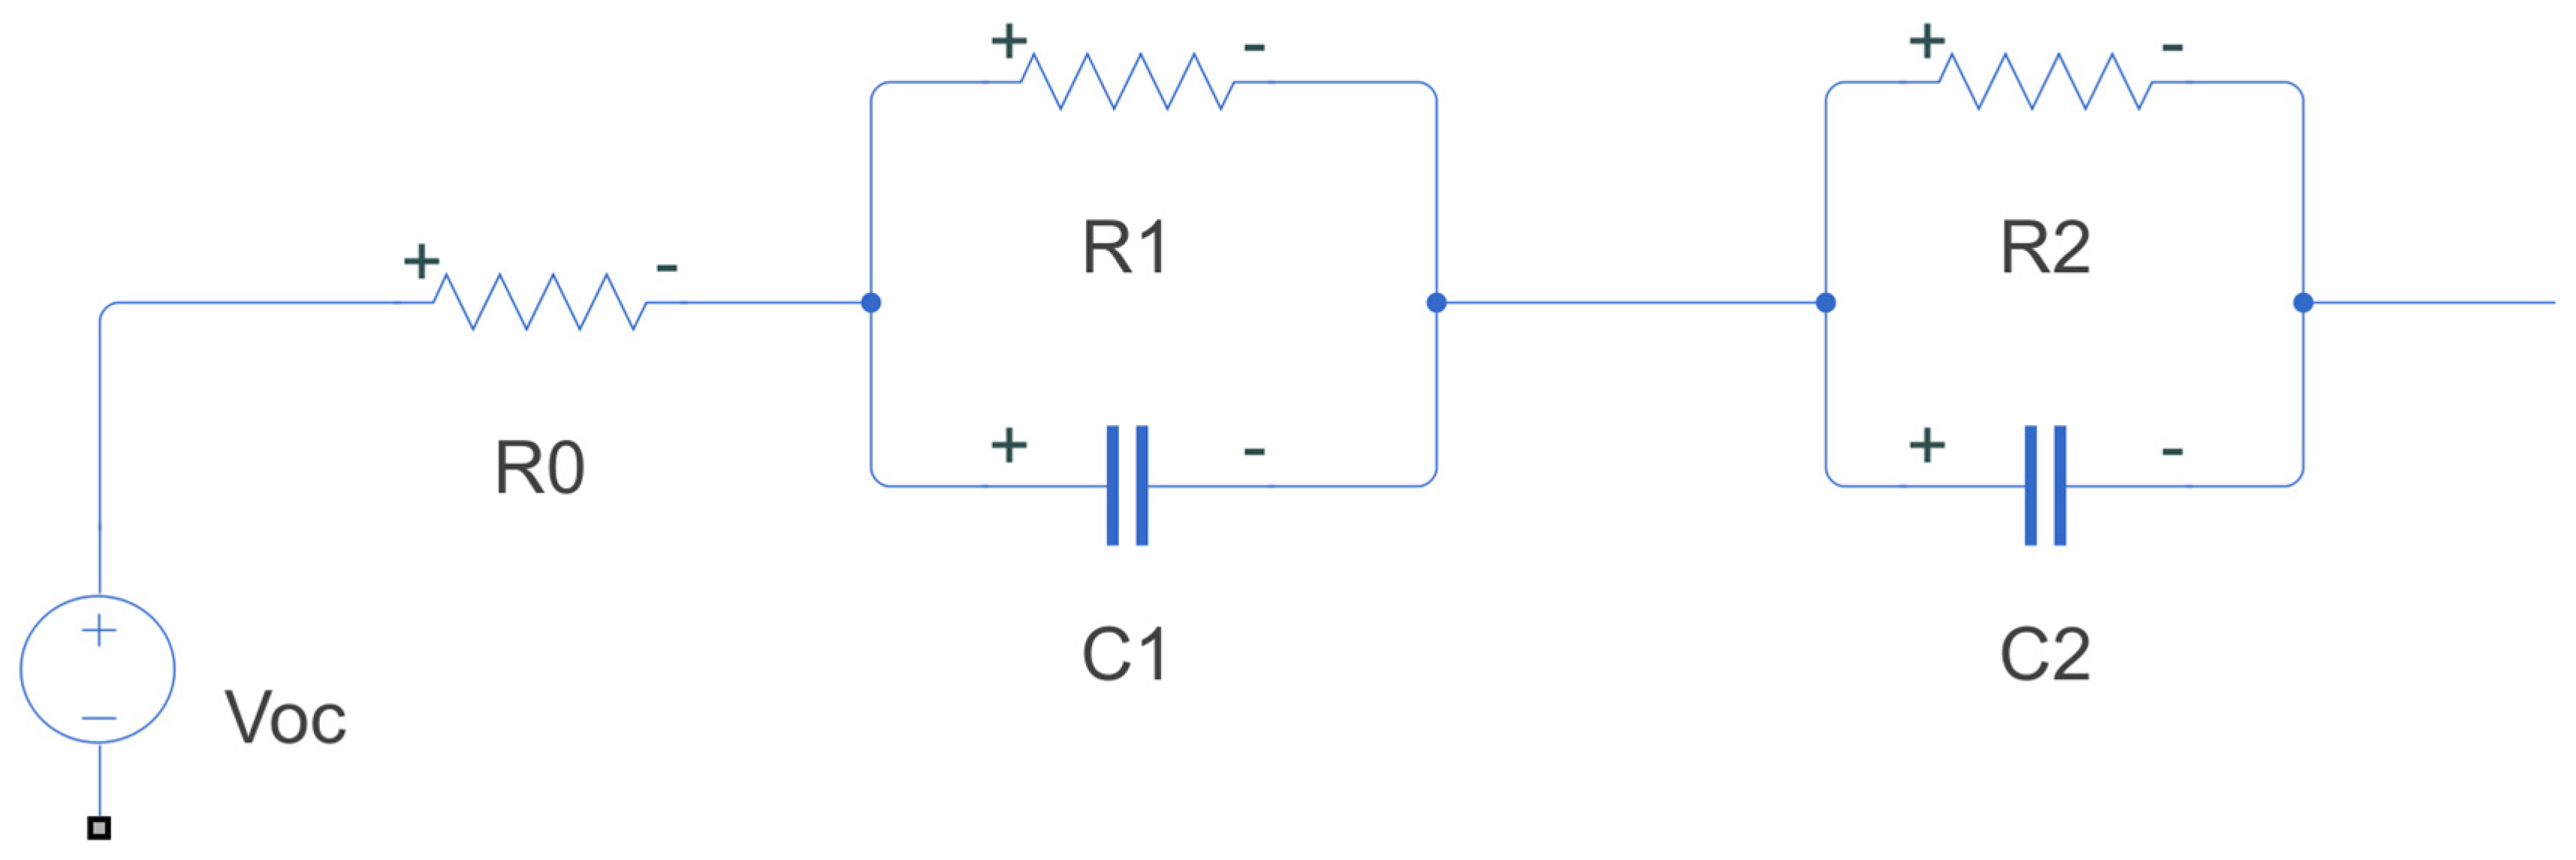
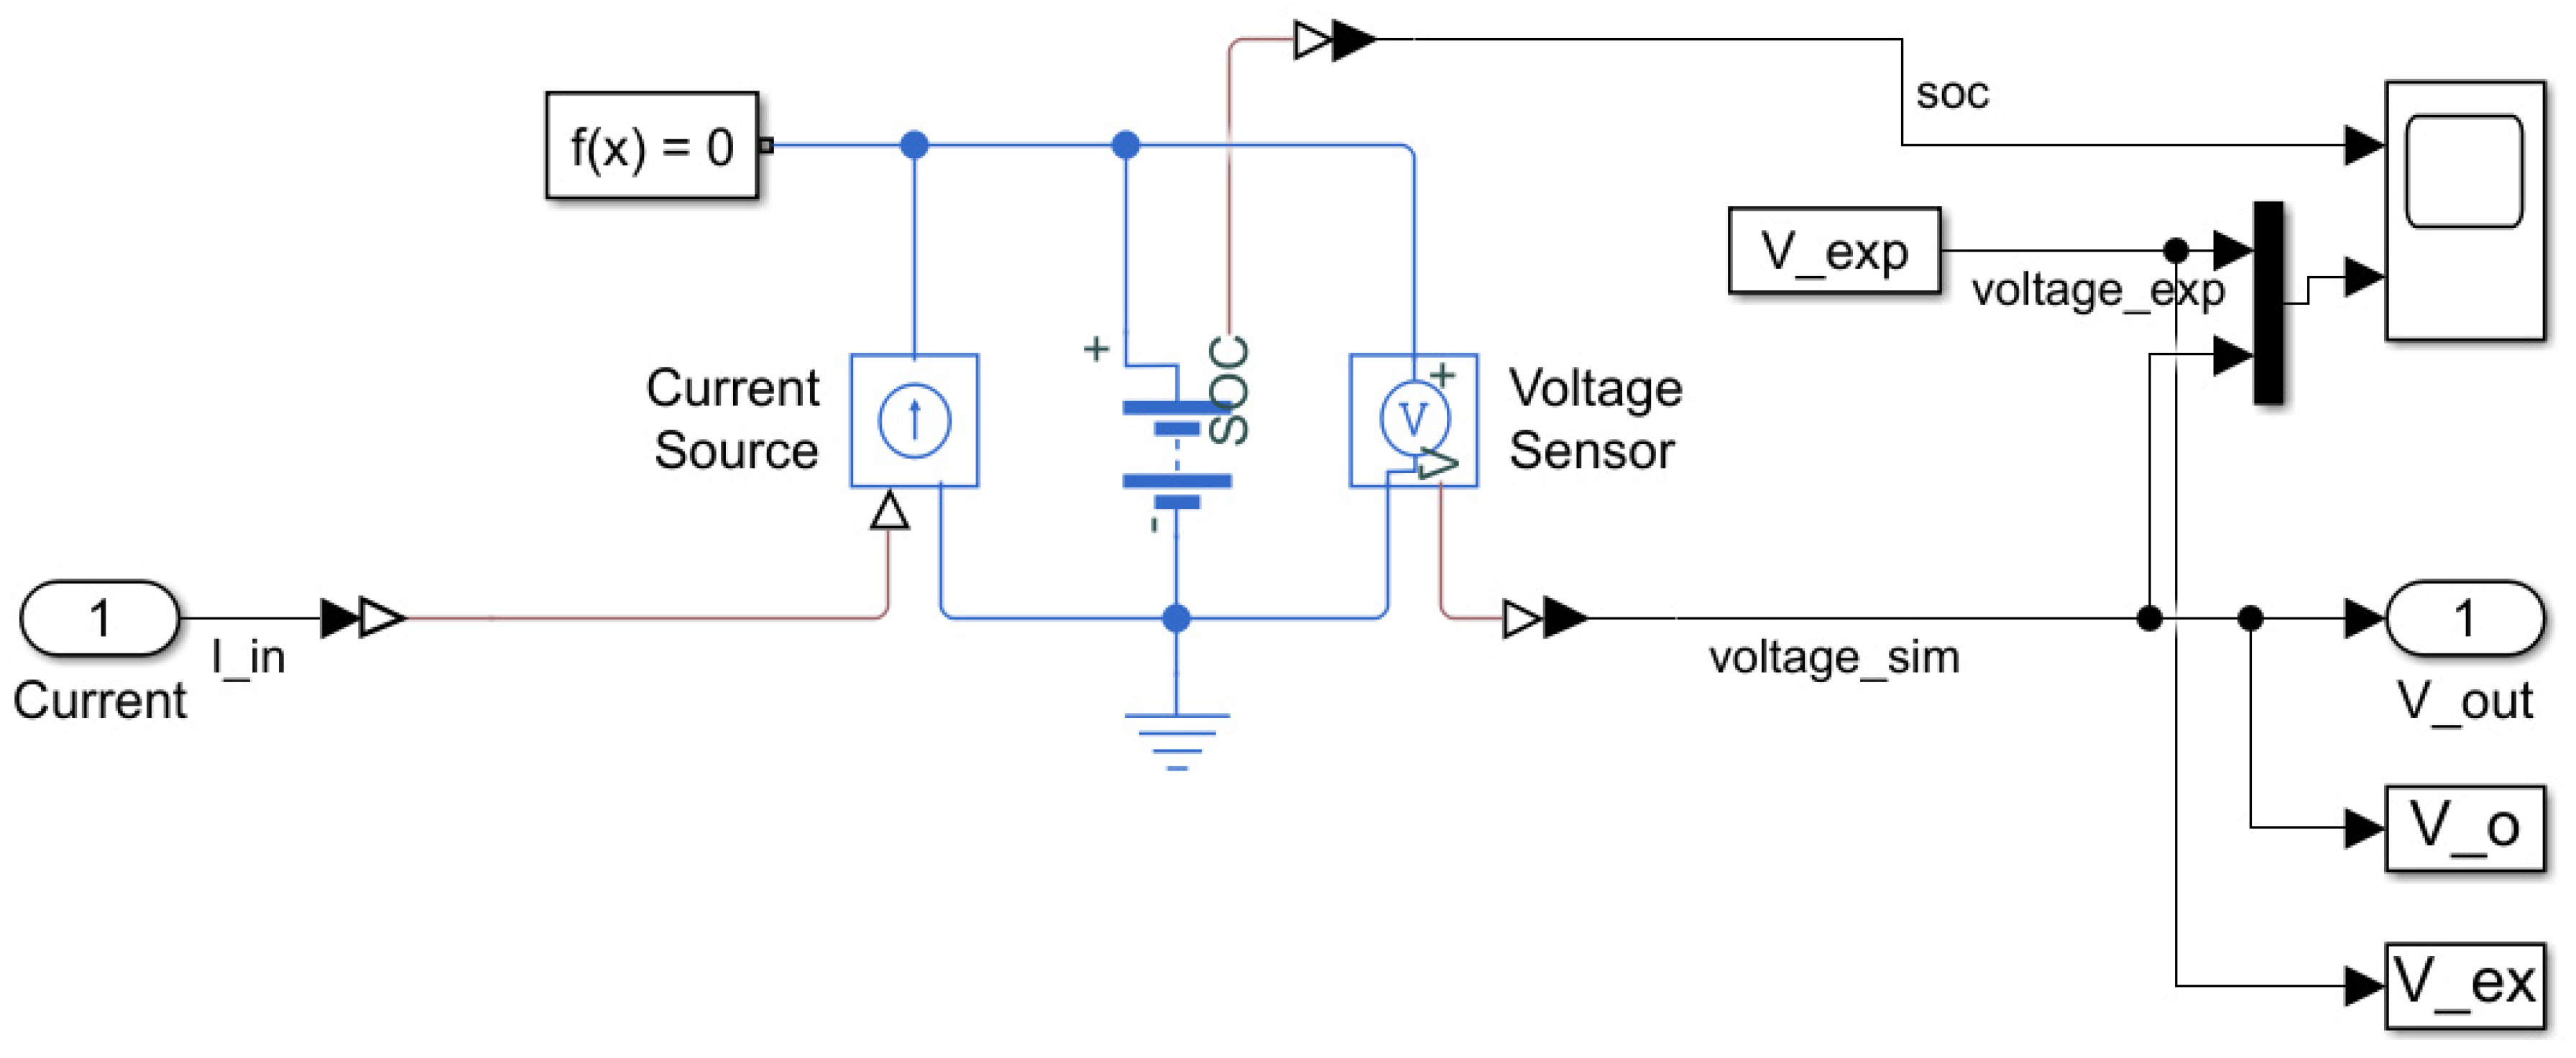
For simulating the second life batteries, second-order equivalent circuit model is used, the schematic diagram of which is shown in
Figure 7 [
31]. The second-order ECM was applied to allow for a true representation of the state of charge (SOC) of the battery, the effect of the number of cycles in the battery voltage, its capacity, as well as the energy losses by self-discharge [
1].
In second-order ECM, the variations of voltage can be obtained using Equation (2) [
31]:
where
and
are time constants and equals to [
31]:
To obtain , , and parameters, the parameter fitting is performed on HPPC data extracted from the lab for the cells. The parameter fitting description for the proposed second-order ECM using experimental data is presented in the next section.
In this paper, the battery state of charge is estimated using equation below [
32]:
where
,
and
n are battery cell capacity, self-discharge resistance and present number of cycles (battery aged), respectively.
2.2. Fitting and Validation
In this study, for considering the impacts of state of charge (SoC) and state of health (SoH) on ECM characterisation parameters, two lab tests have been performed on battery cells: HPPC and degradation test. The HPPC is performed to define the ECM parameters such as Voc, R0, R1, C1, R2, and C2 in various SoCs. The values of the mentioned parameters will be changed over time due to degradation or cycle ageing, the impacts of which is considered by shifting the values based on the results obtained or forecast based on degradation tests.
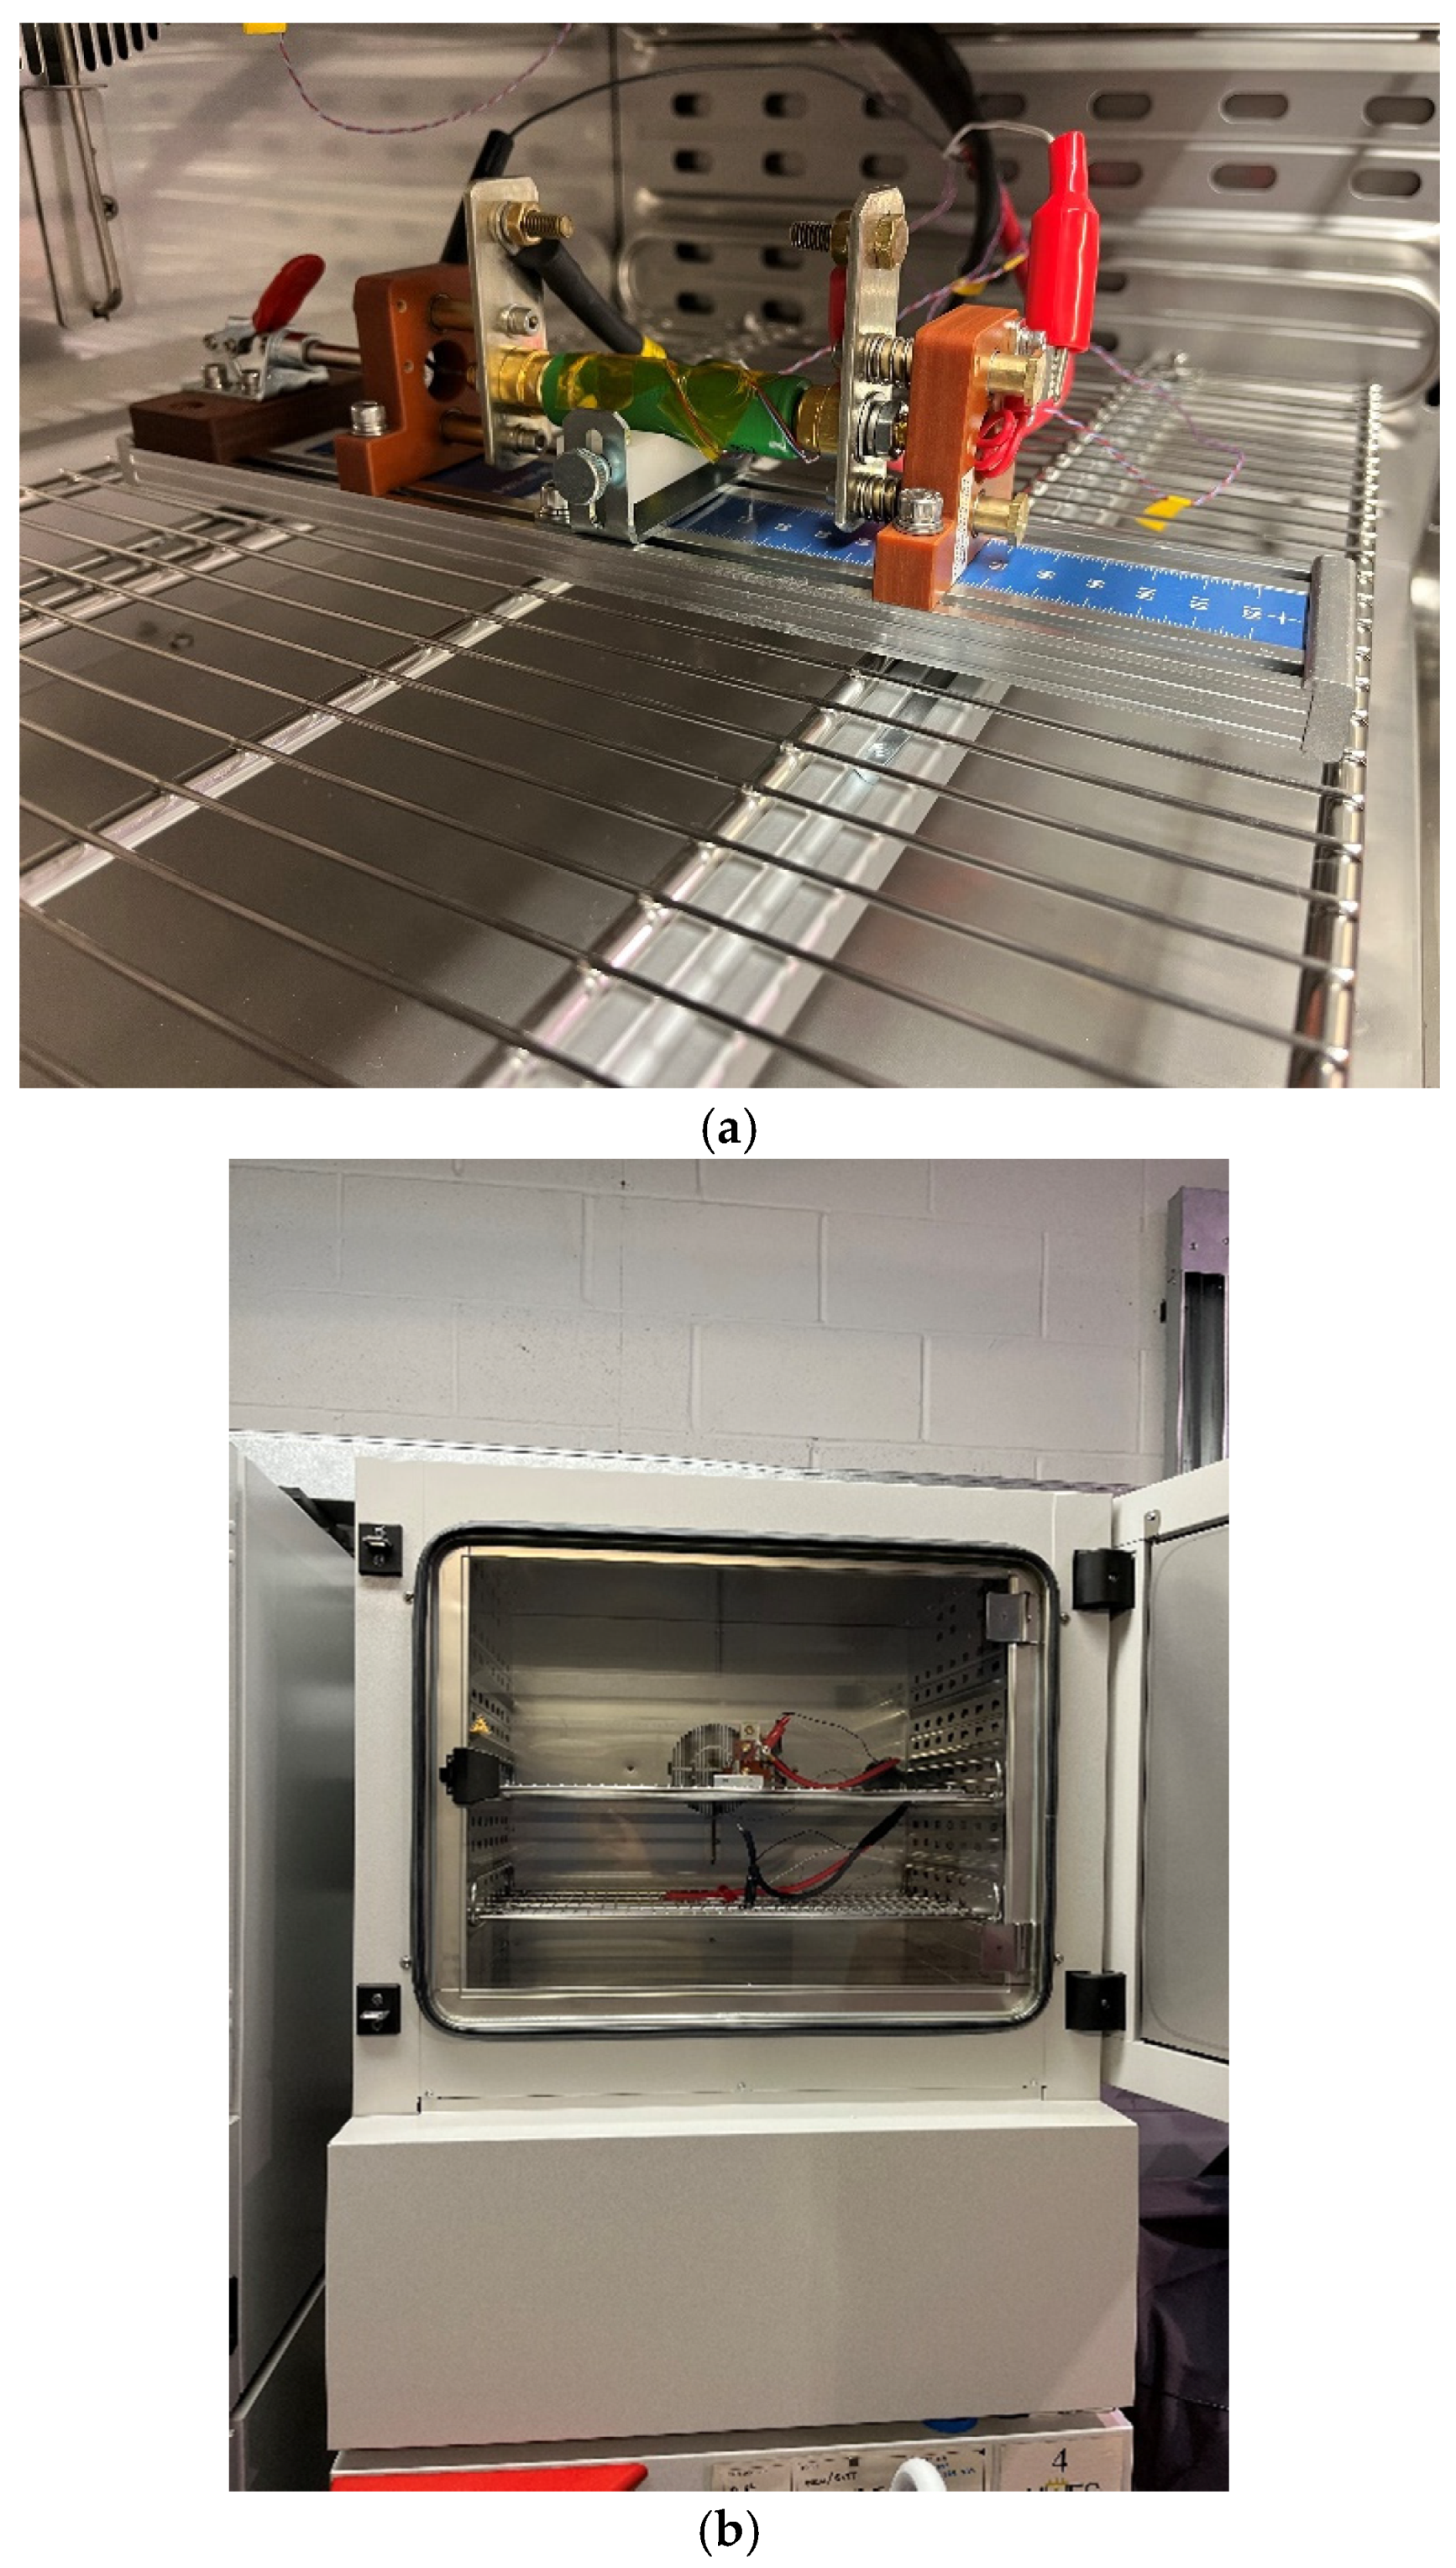
For fitting of the second-order ECM parameters, parameter estimator toolbox in MATLAB Simulink is used to obtain the optimum fitness for each parameter. The Levenberg-Marquart algorithm is used for the fitting purpose. HPPC test is conducted on the battery cells to obtain the relevant experimental data, demonstrated in
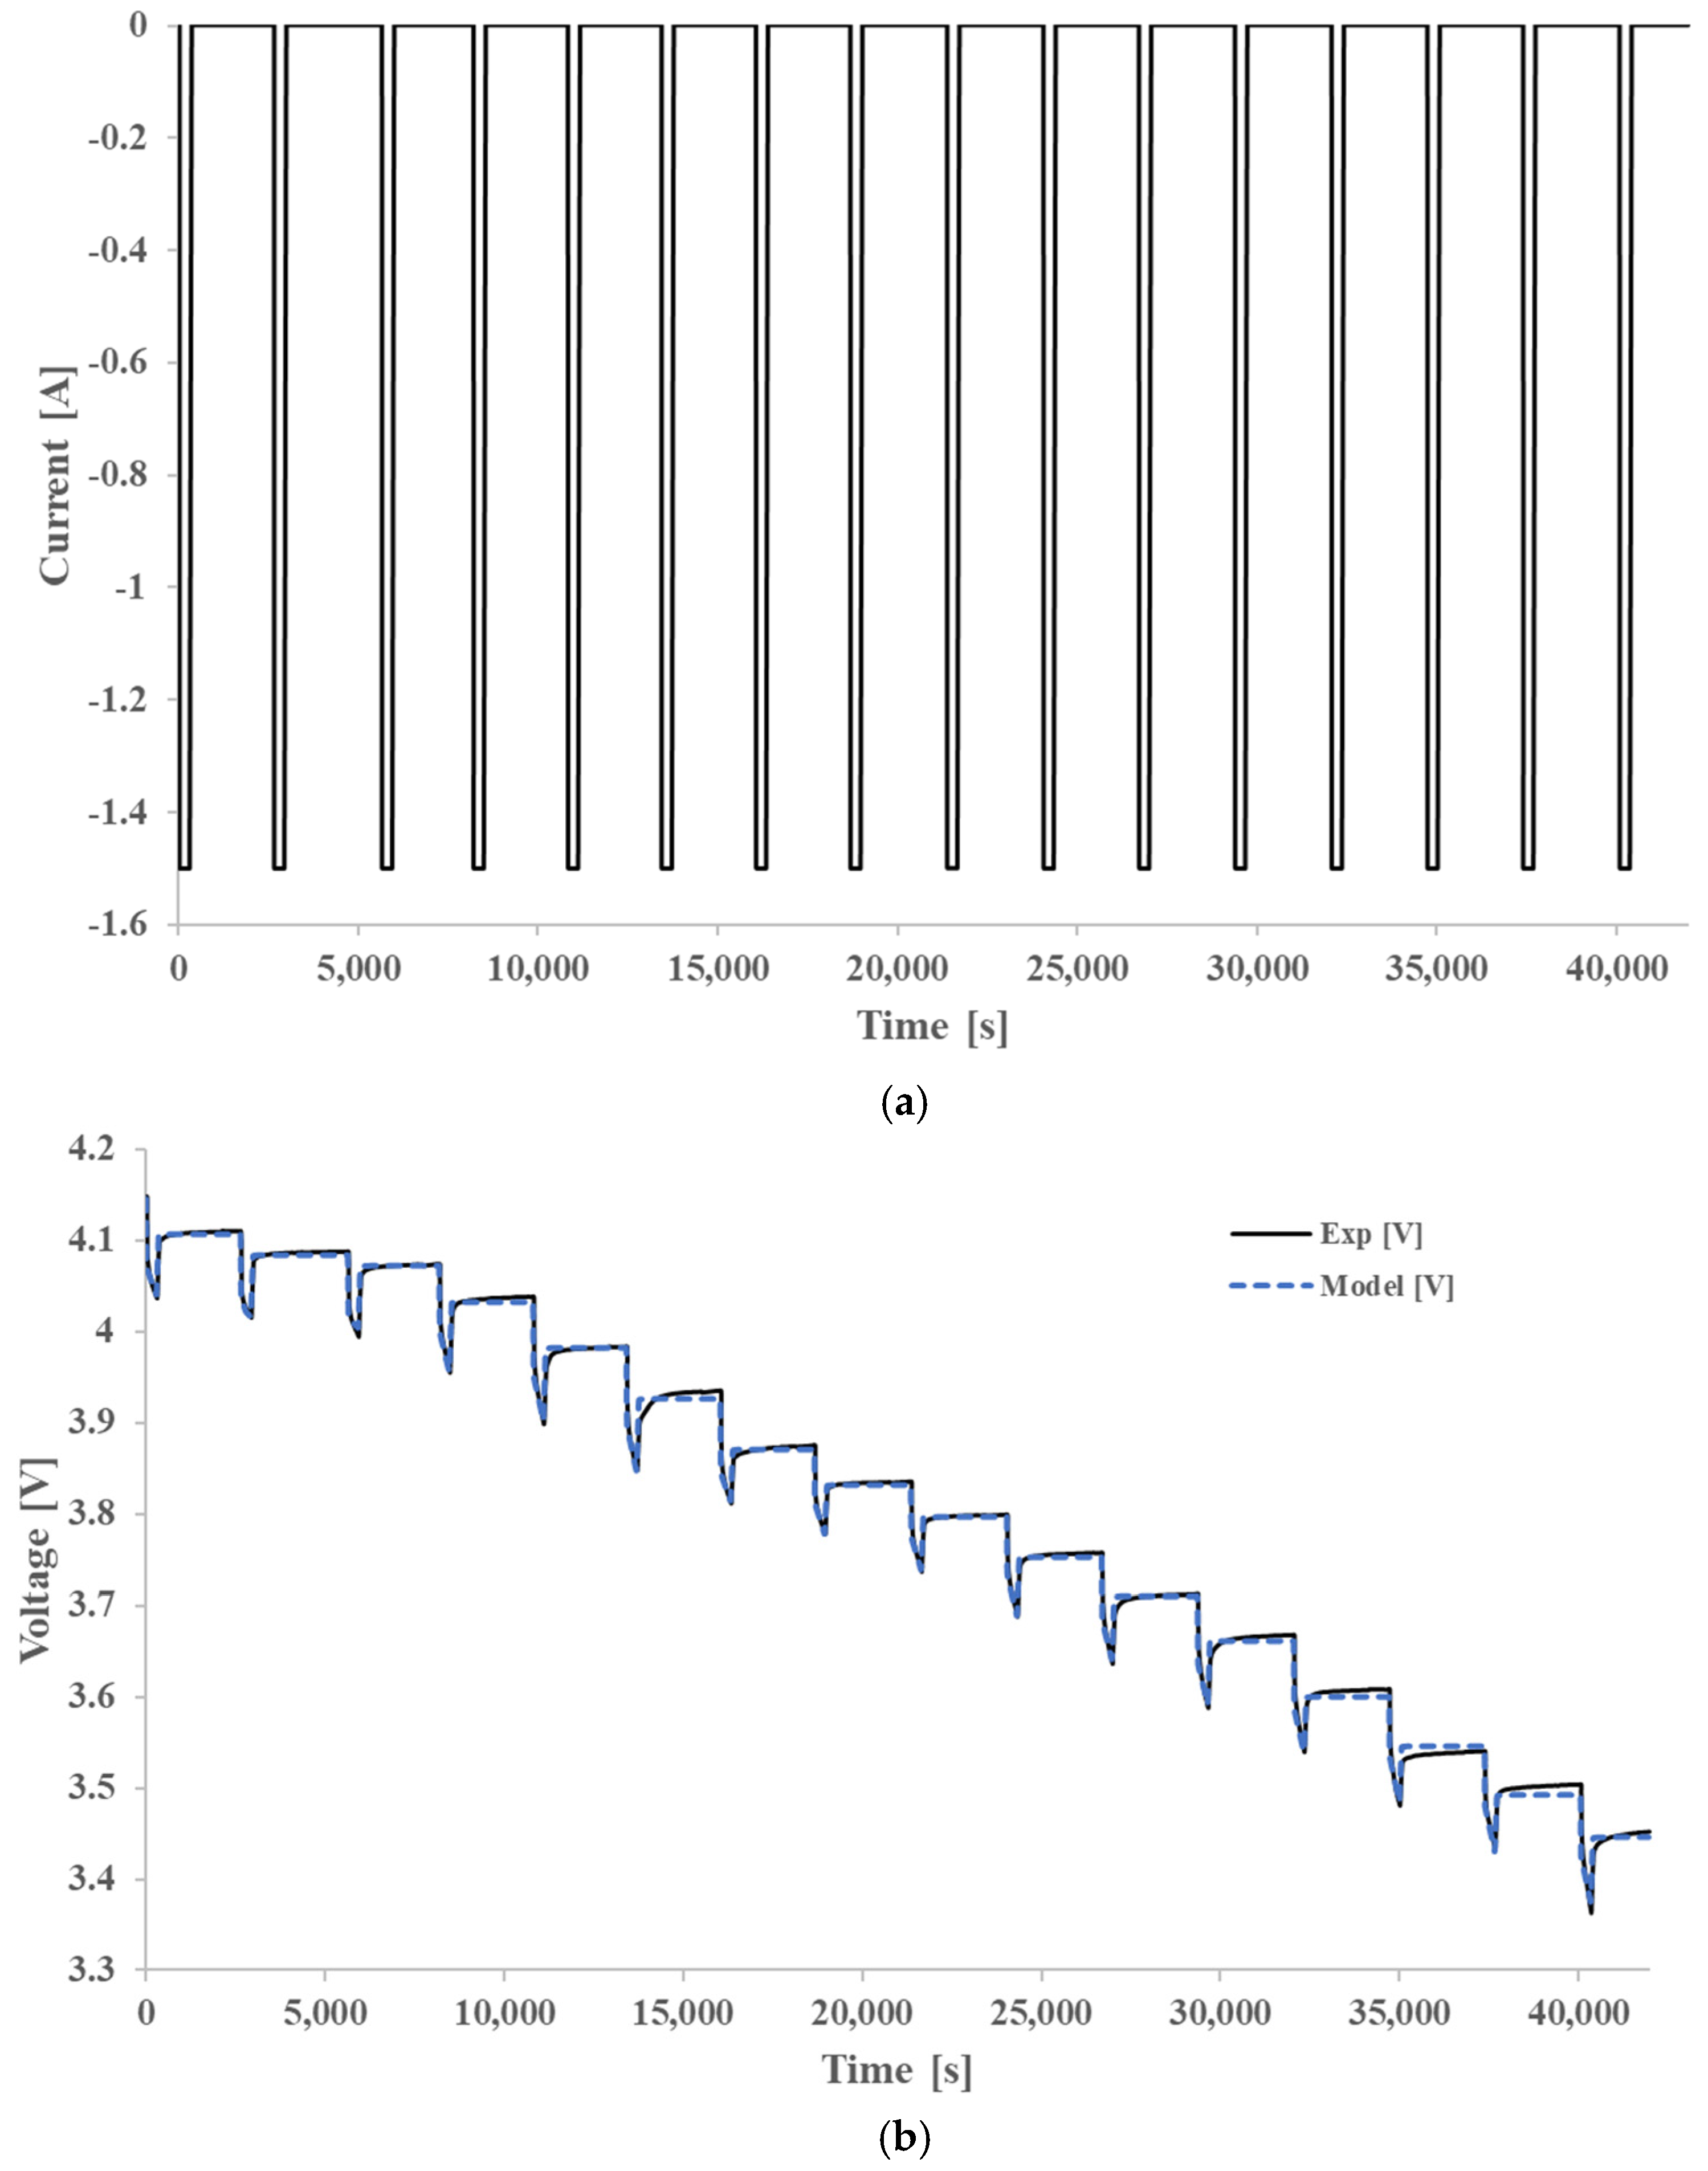
Figure 8. The battery cell is placed in a thermal chamber (BINDER KB115) and a cycler (ARBIN LBT21084) used to apply load on the cell. During the experimental tests, the current pulses (
Figure 9a) are applied to the cell in a 25 °C environmental temperature, and the output voltage of the cell is measured. The voltage and current measurement accuracy of the cycler equals to <±0.02%.
In addition, the experimental setup is also simulated in MATLAB Simulink (
Figure 10). The parameter estimator toolbox is employed to find the optimum parameters of ECM to achieve the best R-square. The experimental and model output voltage profiles are shown in
Figure 9b. An R-square value of 0.99 is achieved suggesting that the estimated parameters provide highly accurate voltage estimation. The estimated parameters are presented in
Table 4.
As it is mentioned in this section, the tests are performed by following two assumptions: the environment temperature equals to 25 °C and the cell is aged by being discharged with 1.5 C maximum amperage. All cells are considered identical within a module. Such limitations could be addressed in future research.
2.3. Degradation Analysis
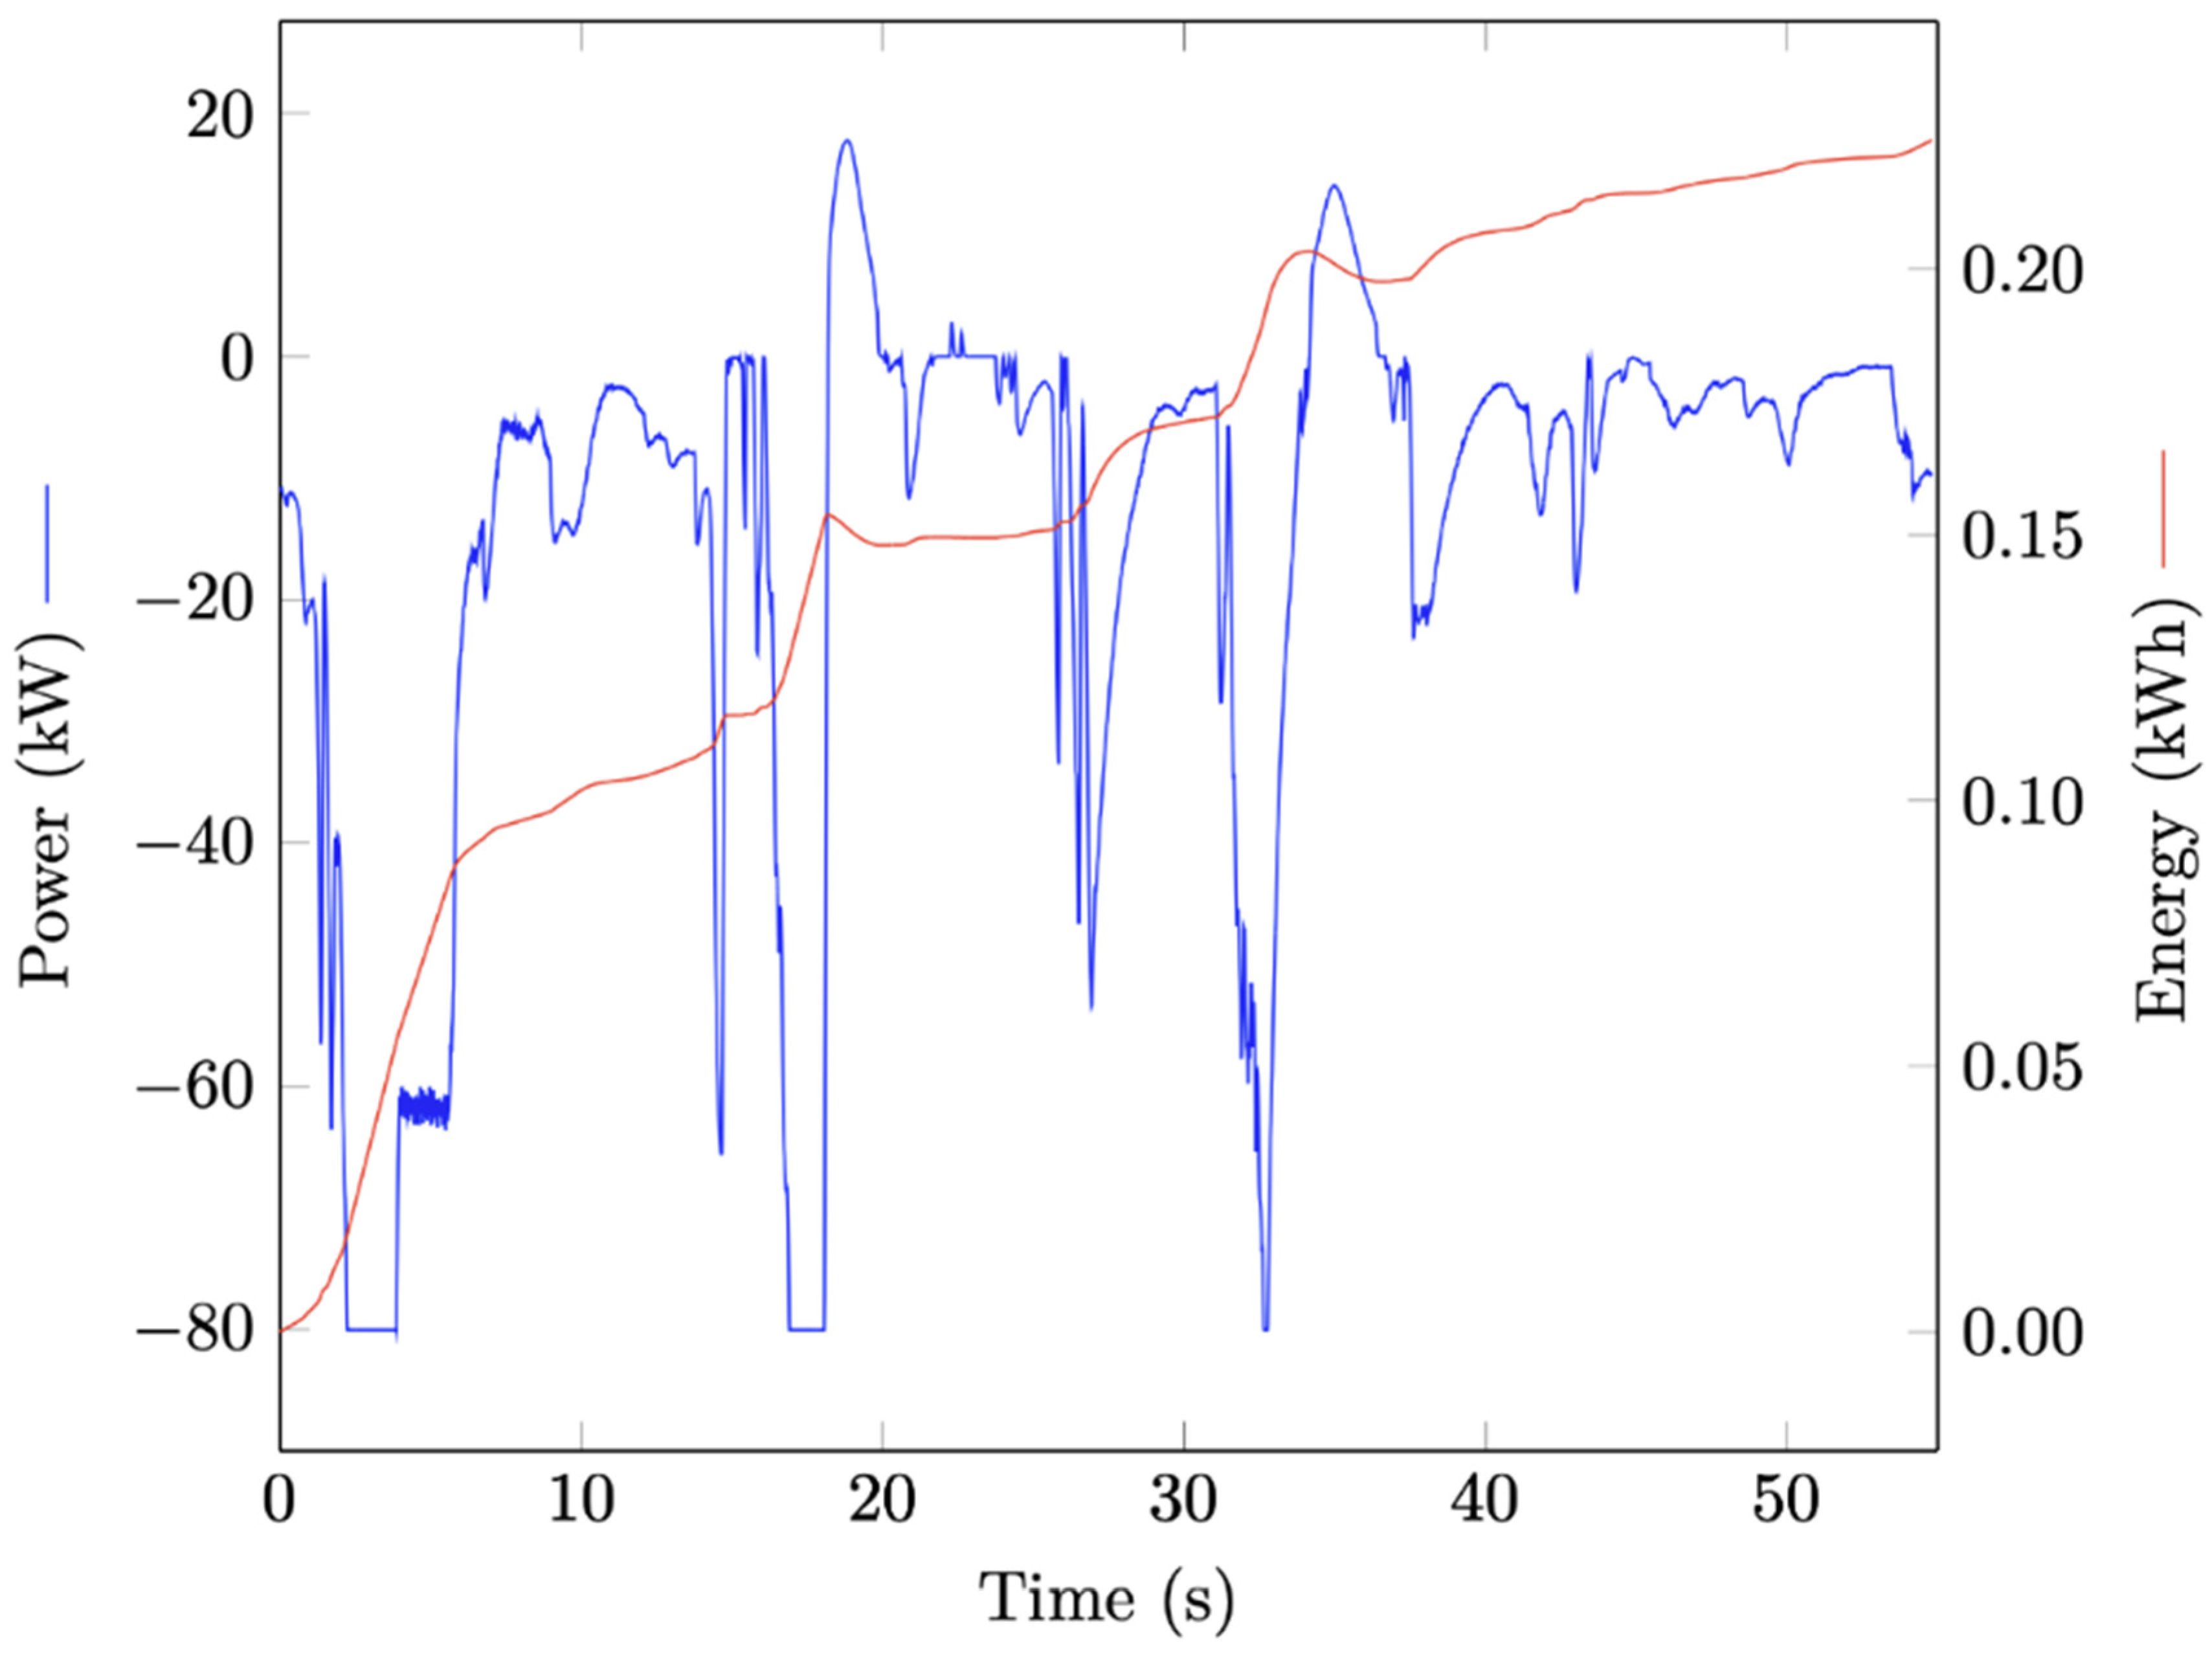
A degradation analysis is performed to investigate the impact of cell cycle ageing on its characteristics such as voltage, capacity, and resistance fades. The proposed cell is degraded using the endurance driving cycle presented in
Figure 11. The battery cell is aged by applying the presented endurance driving cycle. It is rested every 11 cycles for 3 min followed by a 30 min rest. The proposed endurance driving cycle is obtained by simulating the 4 WD electric vehicle with 450 V battery pack voltage using AVL VSM [
33]. A cell level ageing profile is applied to the module level in this study assuming identical SoH for all cells. This could be further enhanced by additional testing on module level to determine a relationship between the cell and module ageing profiles. Such analyses could potentially save time-consuming and expensive experimental testing for possible future applications.
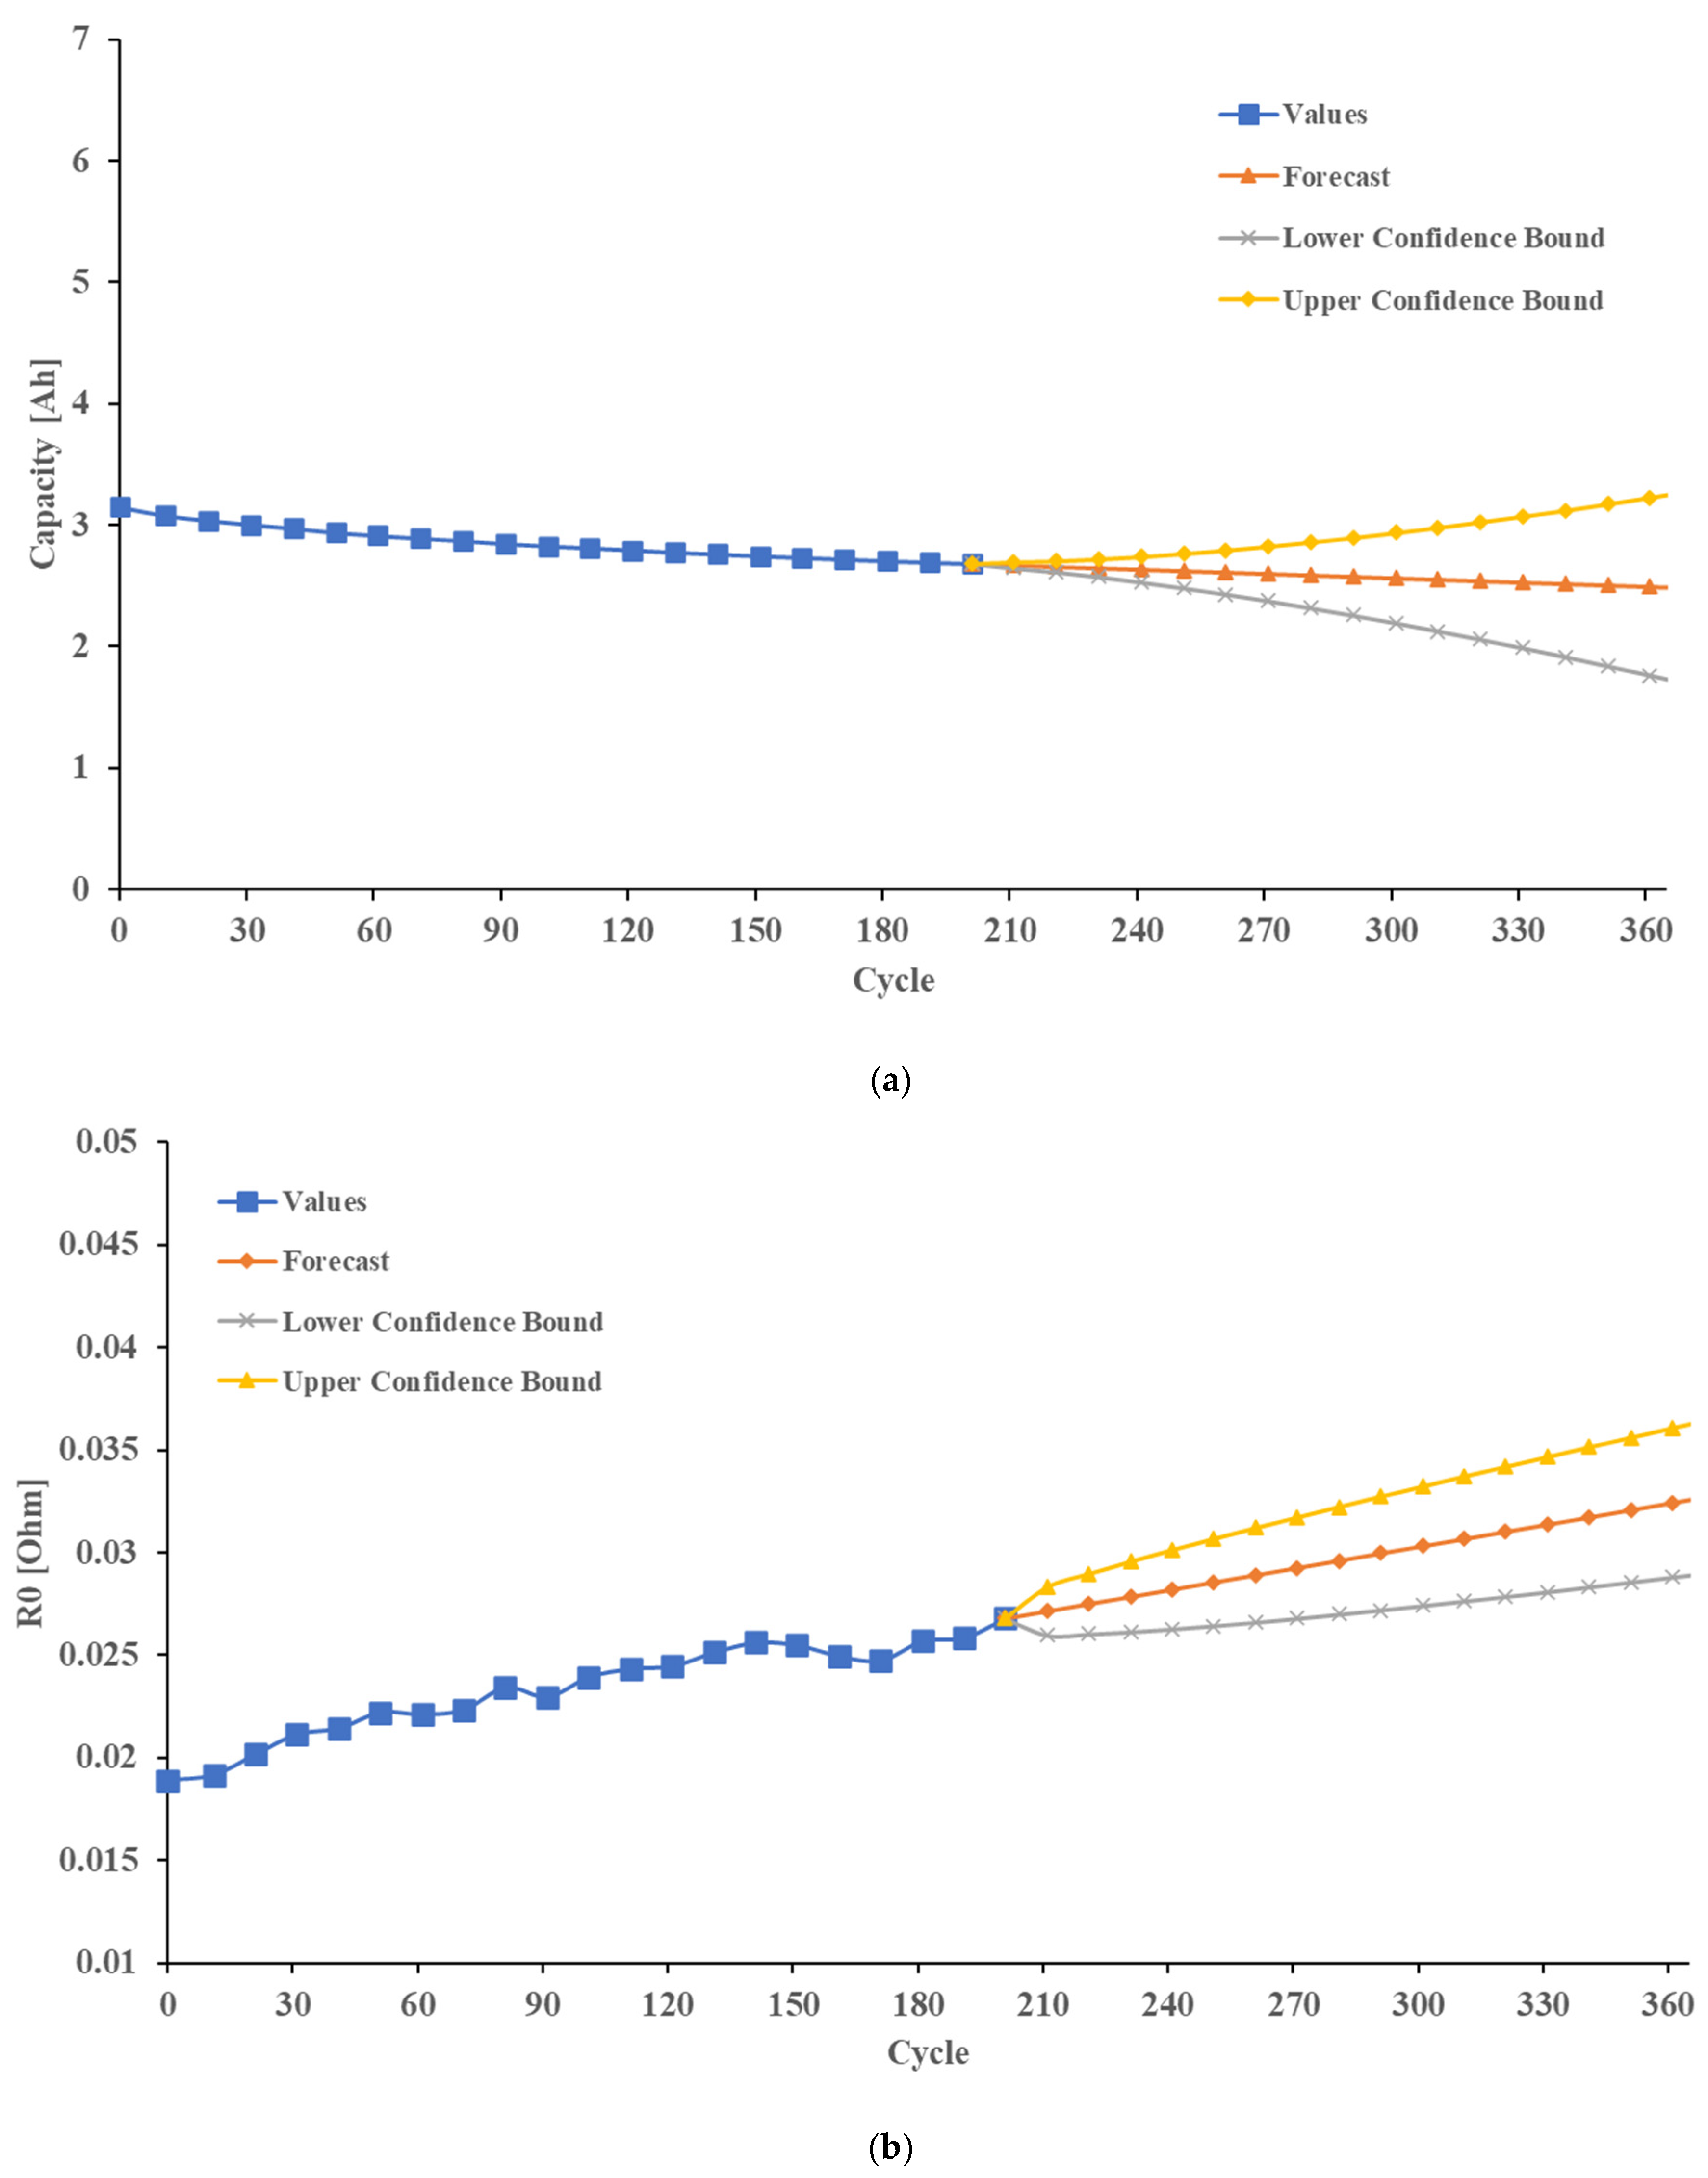
The cell has been put in the thermal chamber at 30 °C and an accelerated ageing current profile is applied. The cell voltage, resistance, and capacity are logged during the degradation test. The cell is aged by 201 cycles in the lab and its state of health decreased to approximately 85%. As the tests required a long period of time, it is decided that the cell degradation parameters are predicted from 85% SoH to nearly 65% SoH using Exponential Triple Smoothing (ETS) algorithm. In addition, based on the reviewed literature, it is assumed that the cell ageing knee (the point after which the degradation accelerates) is not reached before 65% SoH [
34]. As it can be seen in reference [
34] an similar works, in which the degradation test of the battery cell is performed until reaching of ageing knee or further, the capacity fade and other cycle ageing parameters are following the same trend until reaching of ageing knee. That is why in this paper it is decided to predict the ageing parameters from 85% SoH using Exponential Triple Smoothing by assuming that the battery cell is aged with the same ageing profile and environmental temperature as its first life. The results of the parameter predictions are shown in
Figure 12a–c.
3. Results and Discussions
The proposed model has been simulated for a whole year. The hourly logged data is presented in this section.
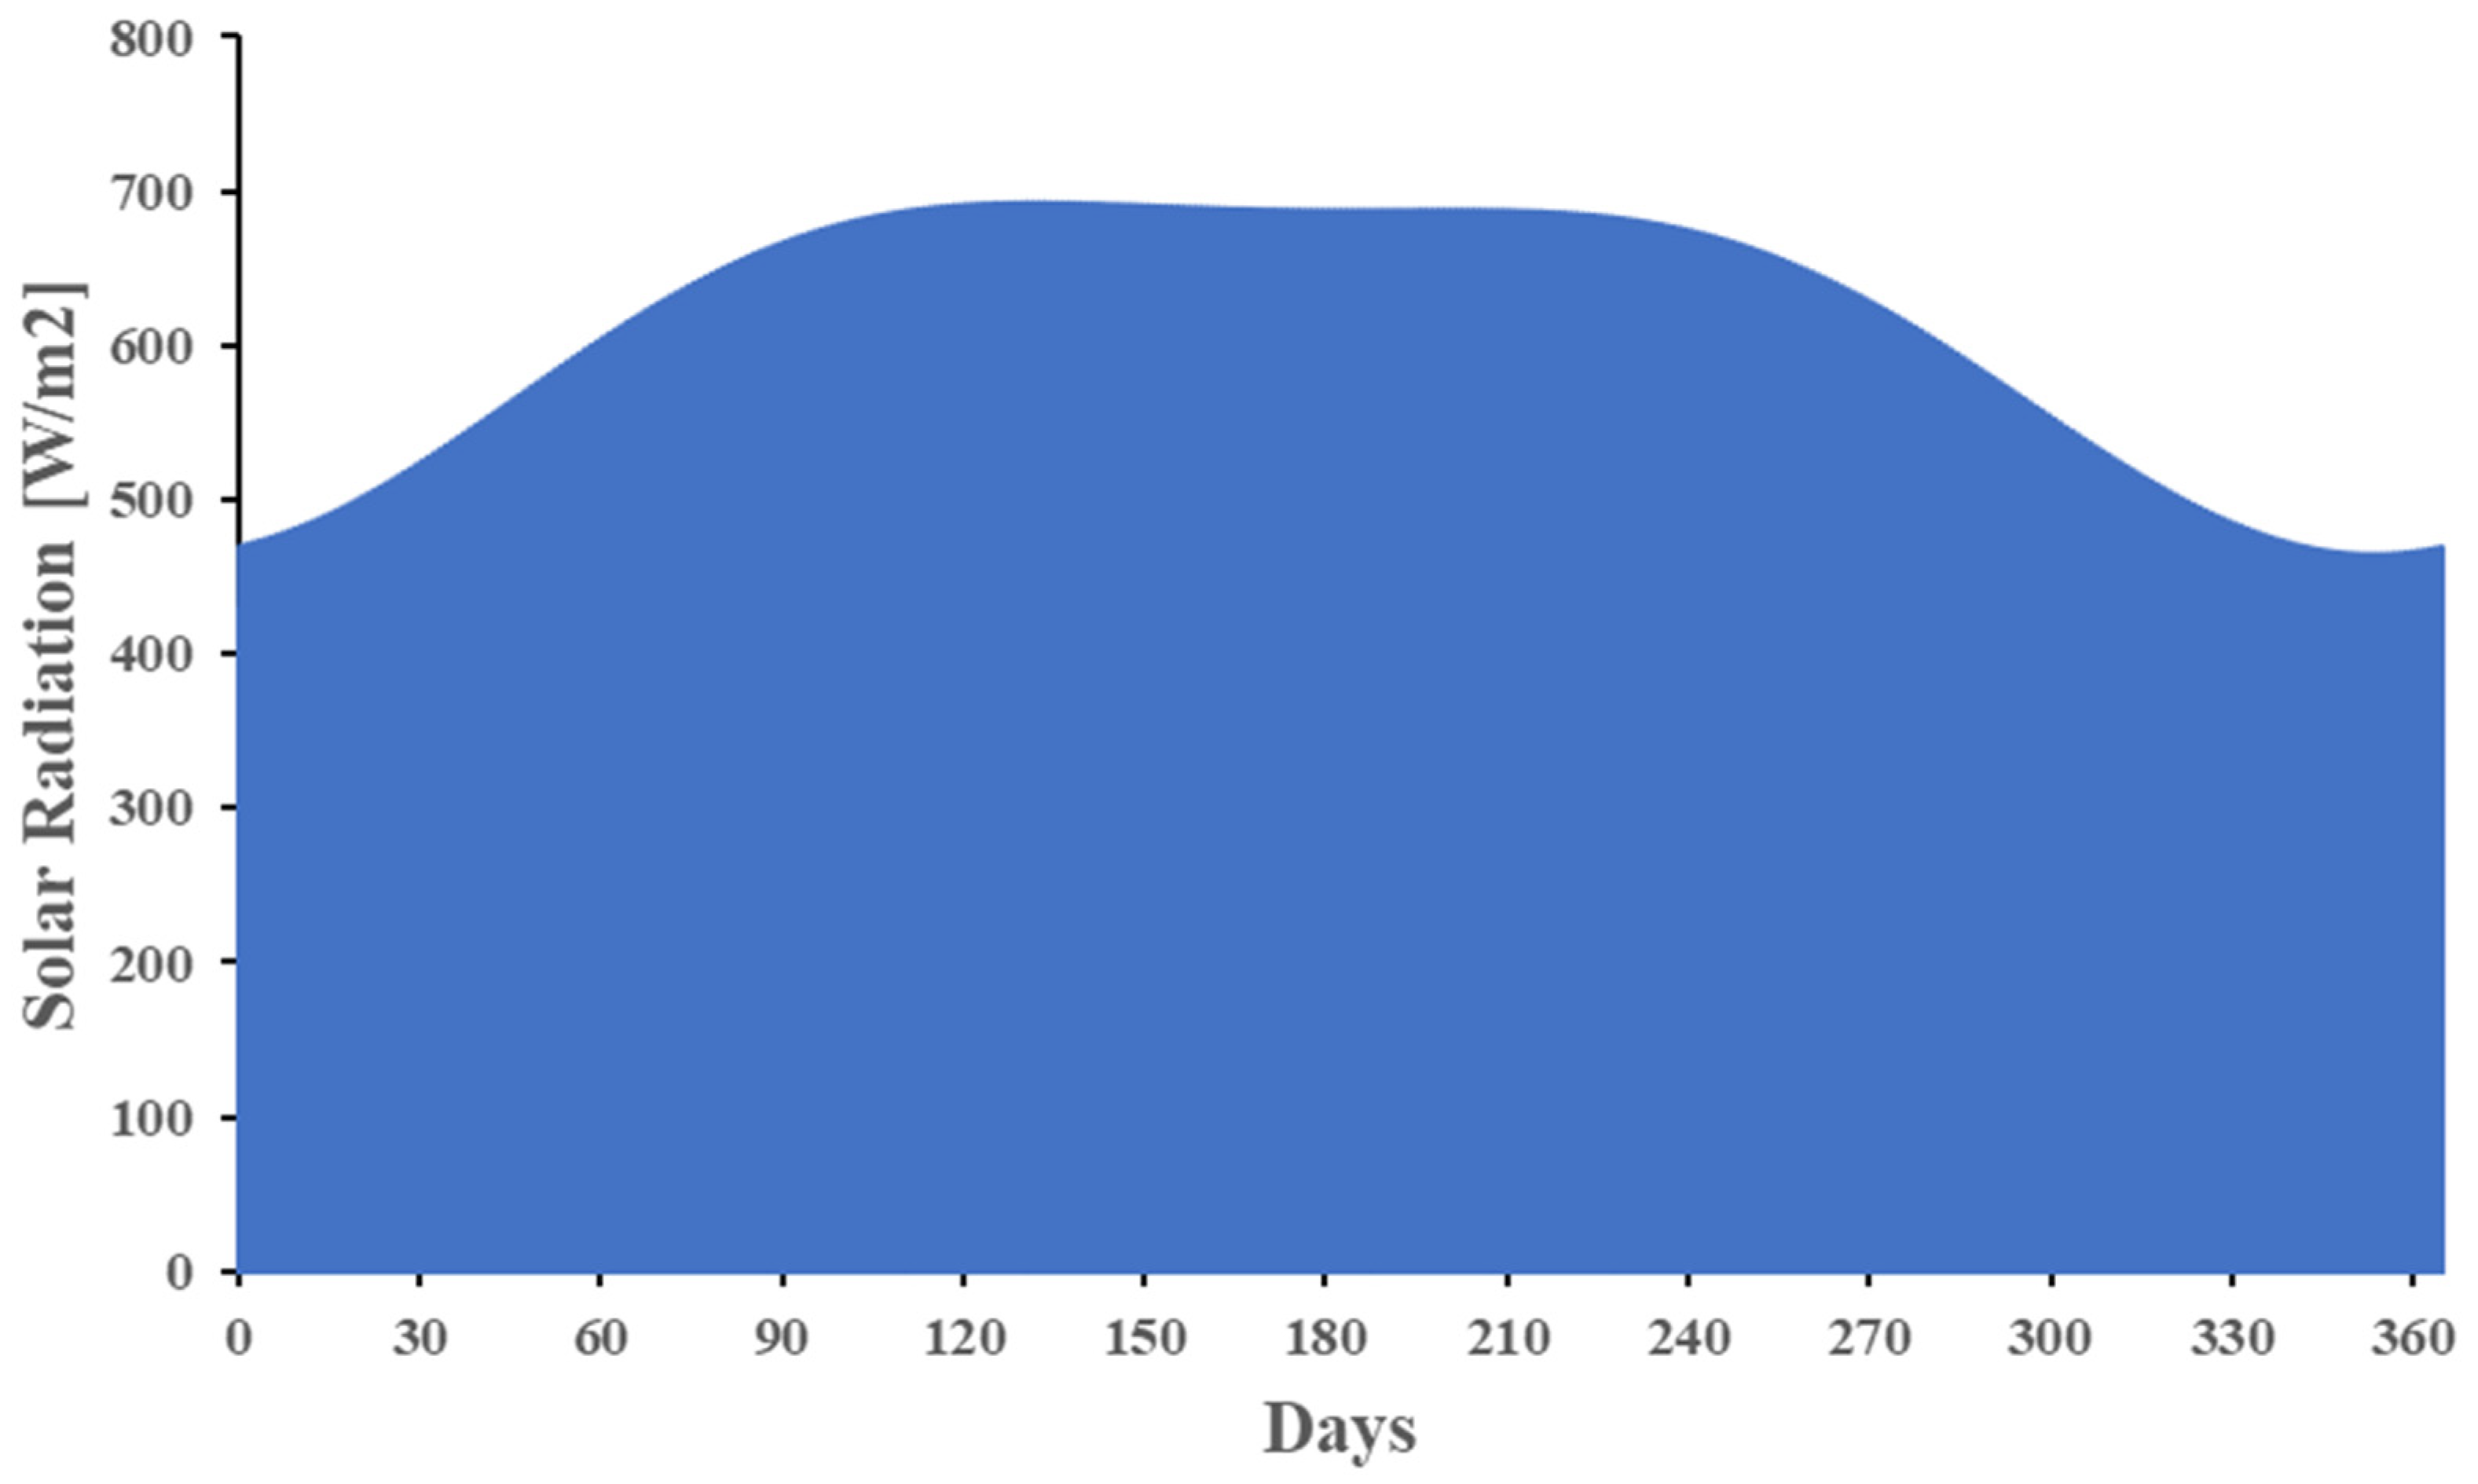
Figure 13 shows the daily peak solar radiation transmitted to the tilted plane mounted on the ceiling of the case study building. Maximum daily peak solar radiation is received in spring and summer which equals to approximately 690 W/m
2.
Table 5 presents the representative days of each season during the year for the studied climate [
35].
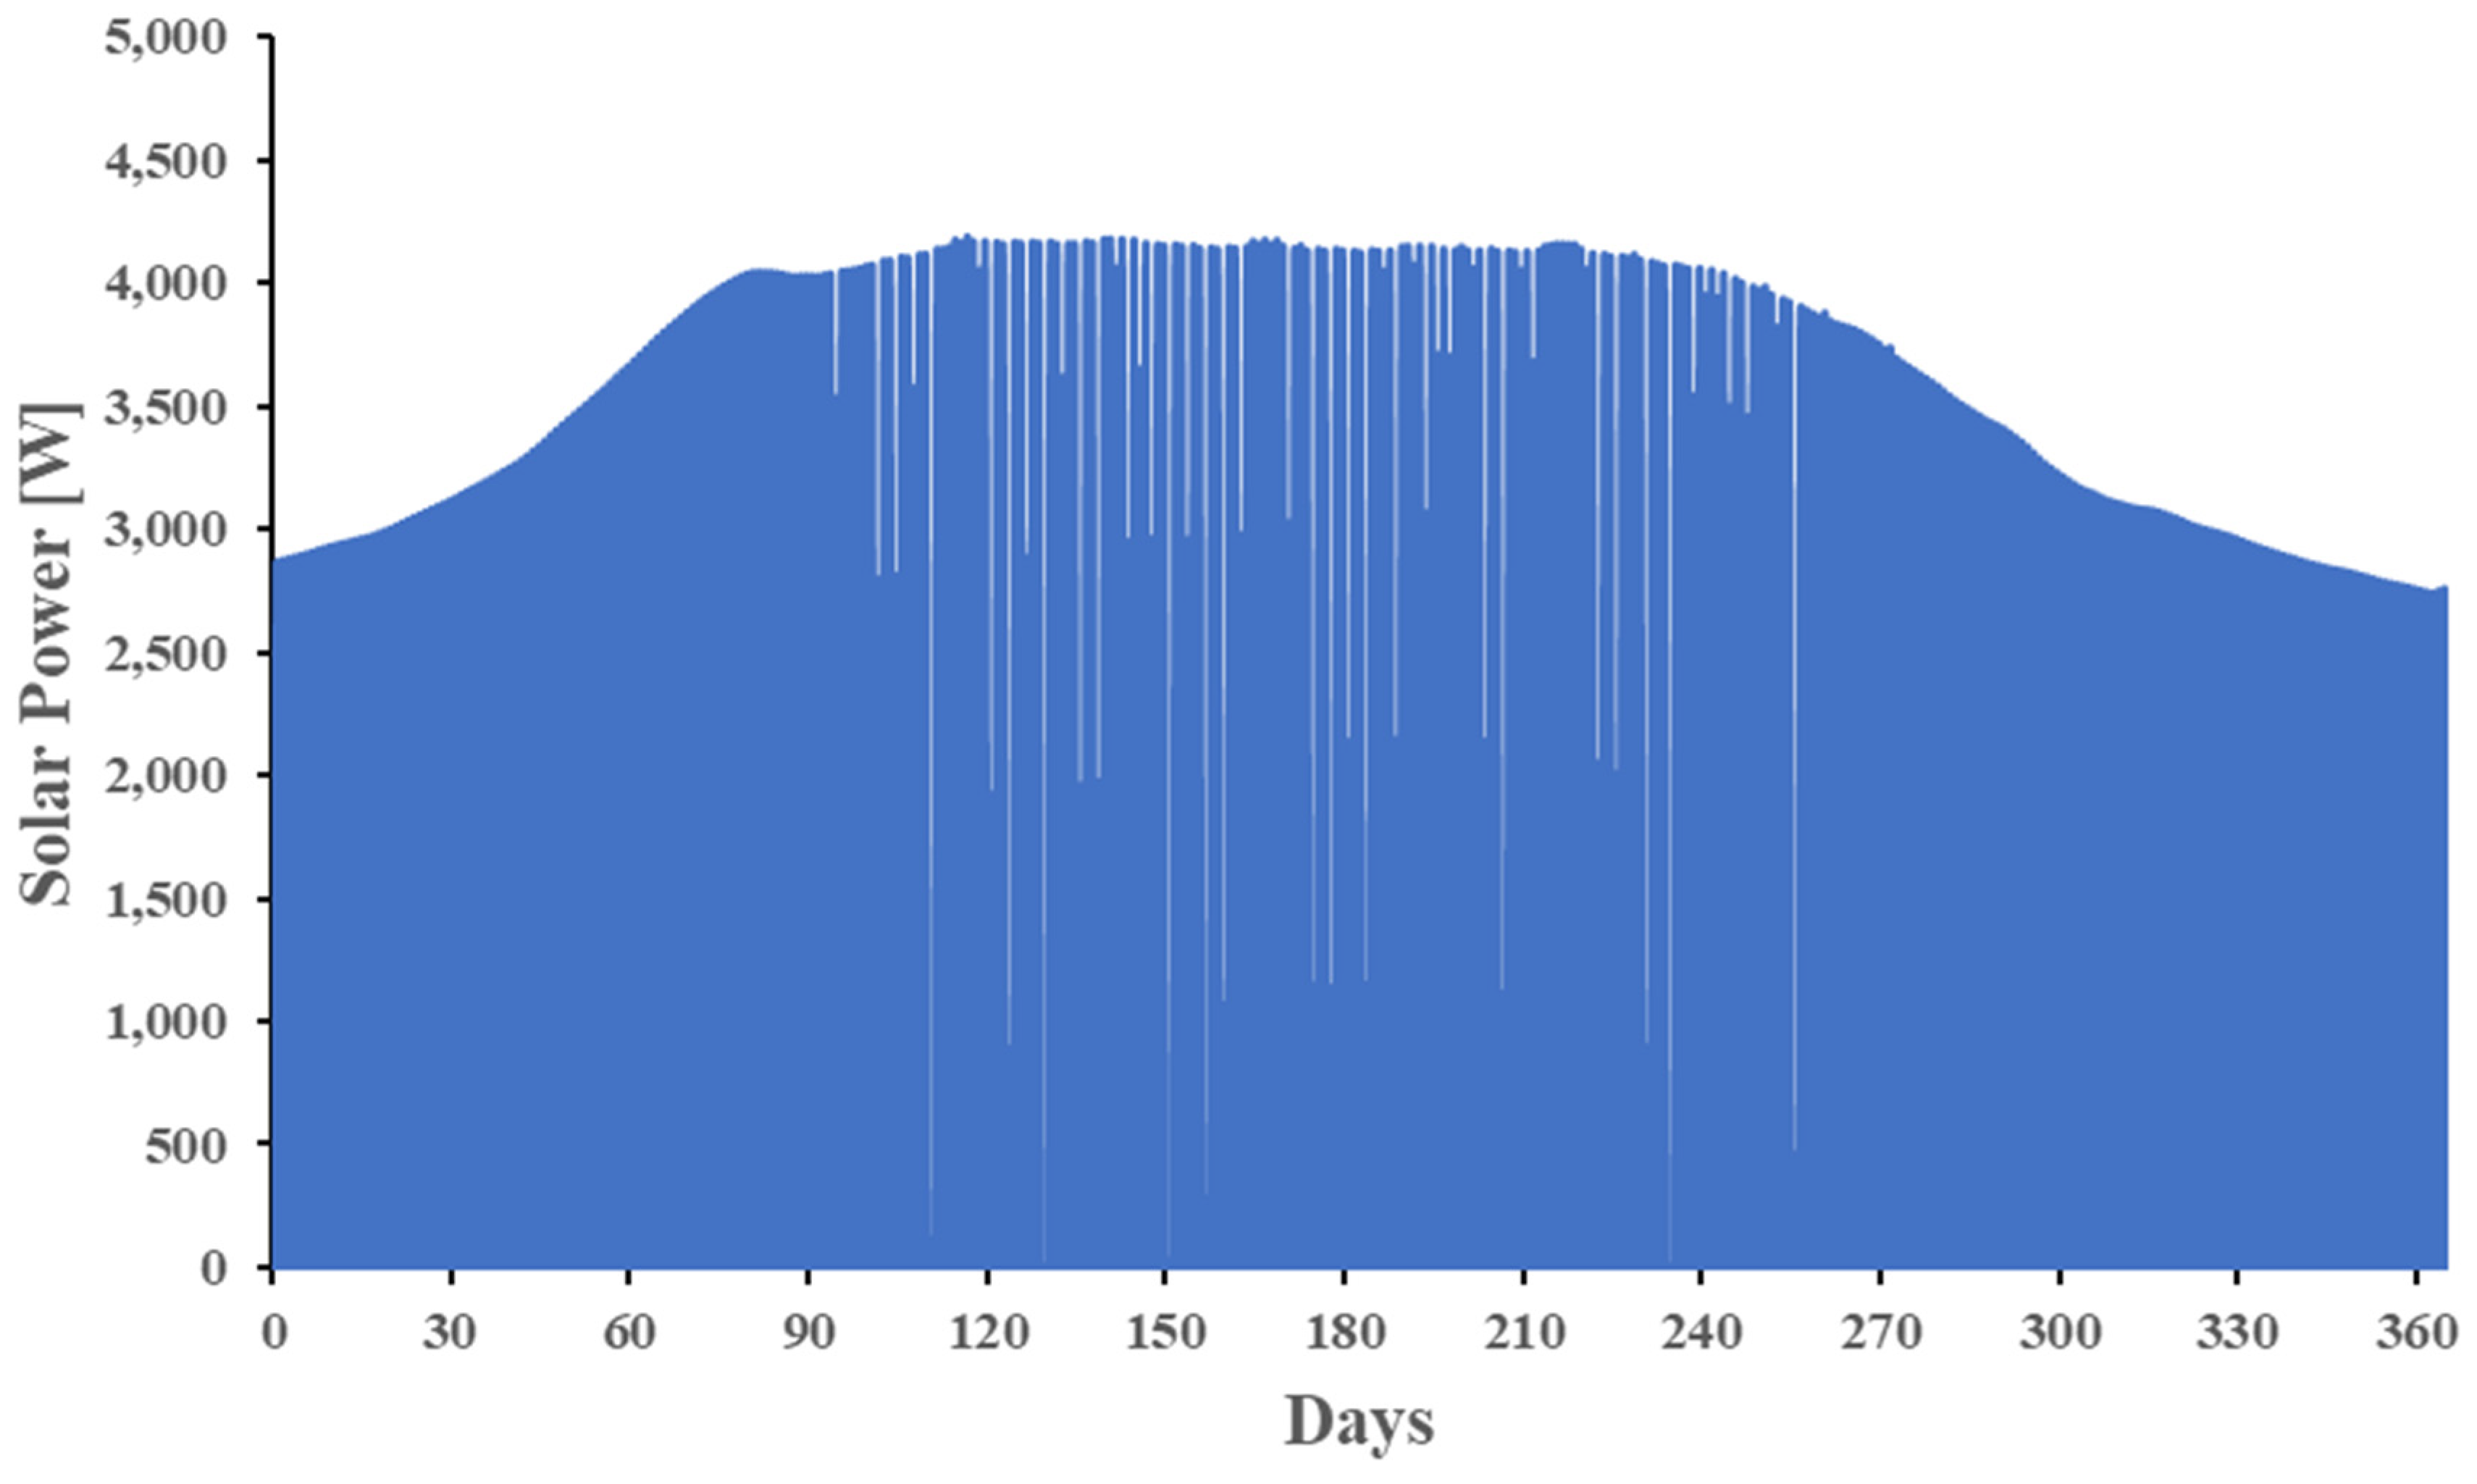
The annual and daily values of the generated solar power is shown in
Figure 14 and
Figure 15, respectively.
Figure 14 demonstrates the solar power generation peaks during spring and summer with a maximum annual power generation achieved in this period. Achieving high values of solar energy may result in overcharging of the battery packs. As the proposed system is not connected to the grid, the extra generated energy by solar panels cannot be stored or consumed in the system. This triggers the circuit breaker in the system to disconnect the solar panels from the other system components when the battery pack’s state of charge equals to 90%. The hourly values of the generated power in the representative day of each season are presented in
Figure 15. The maximum peak of solar power generation is reached in summer which equals to nearly 4.1 kW. The peak of solar power decreased to 3.43 kW and 2.97 kW in autumn and winter, respectively.
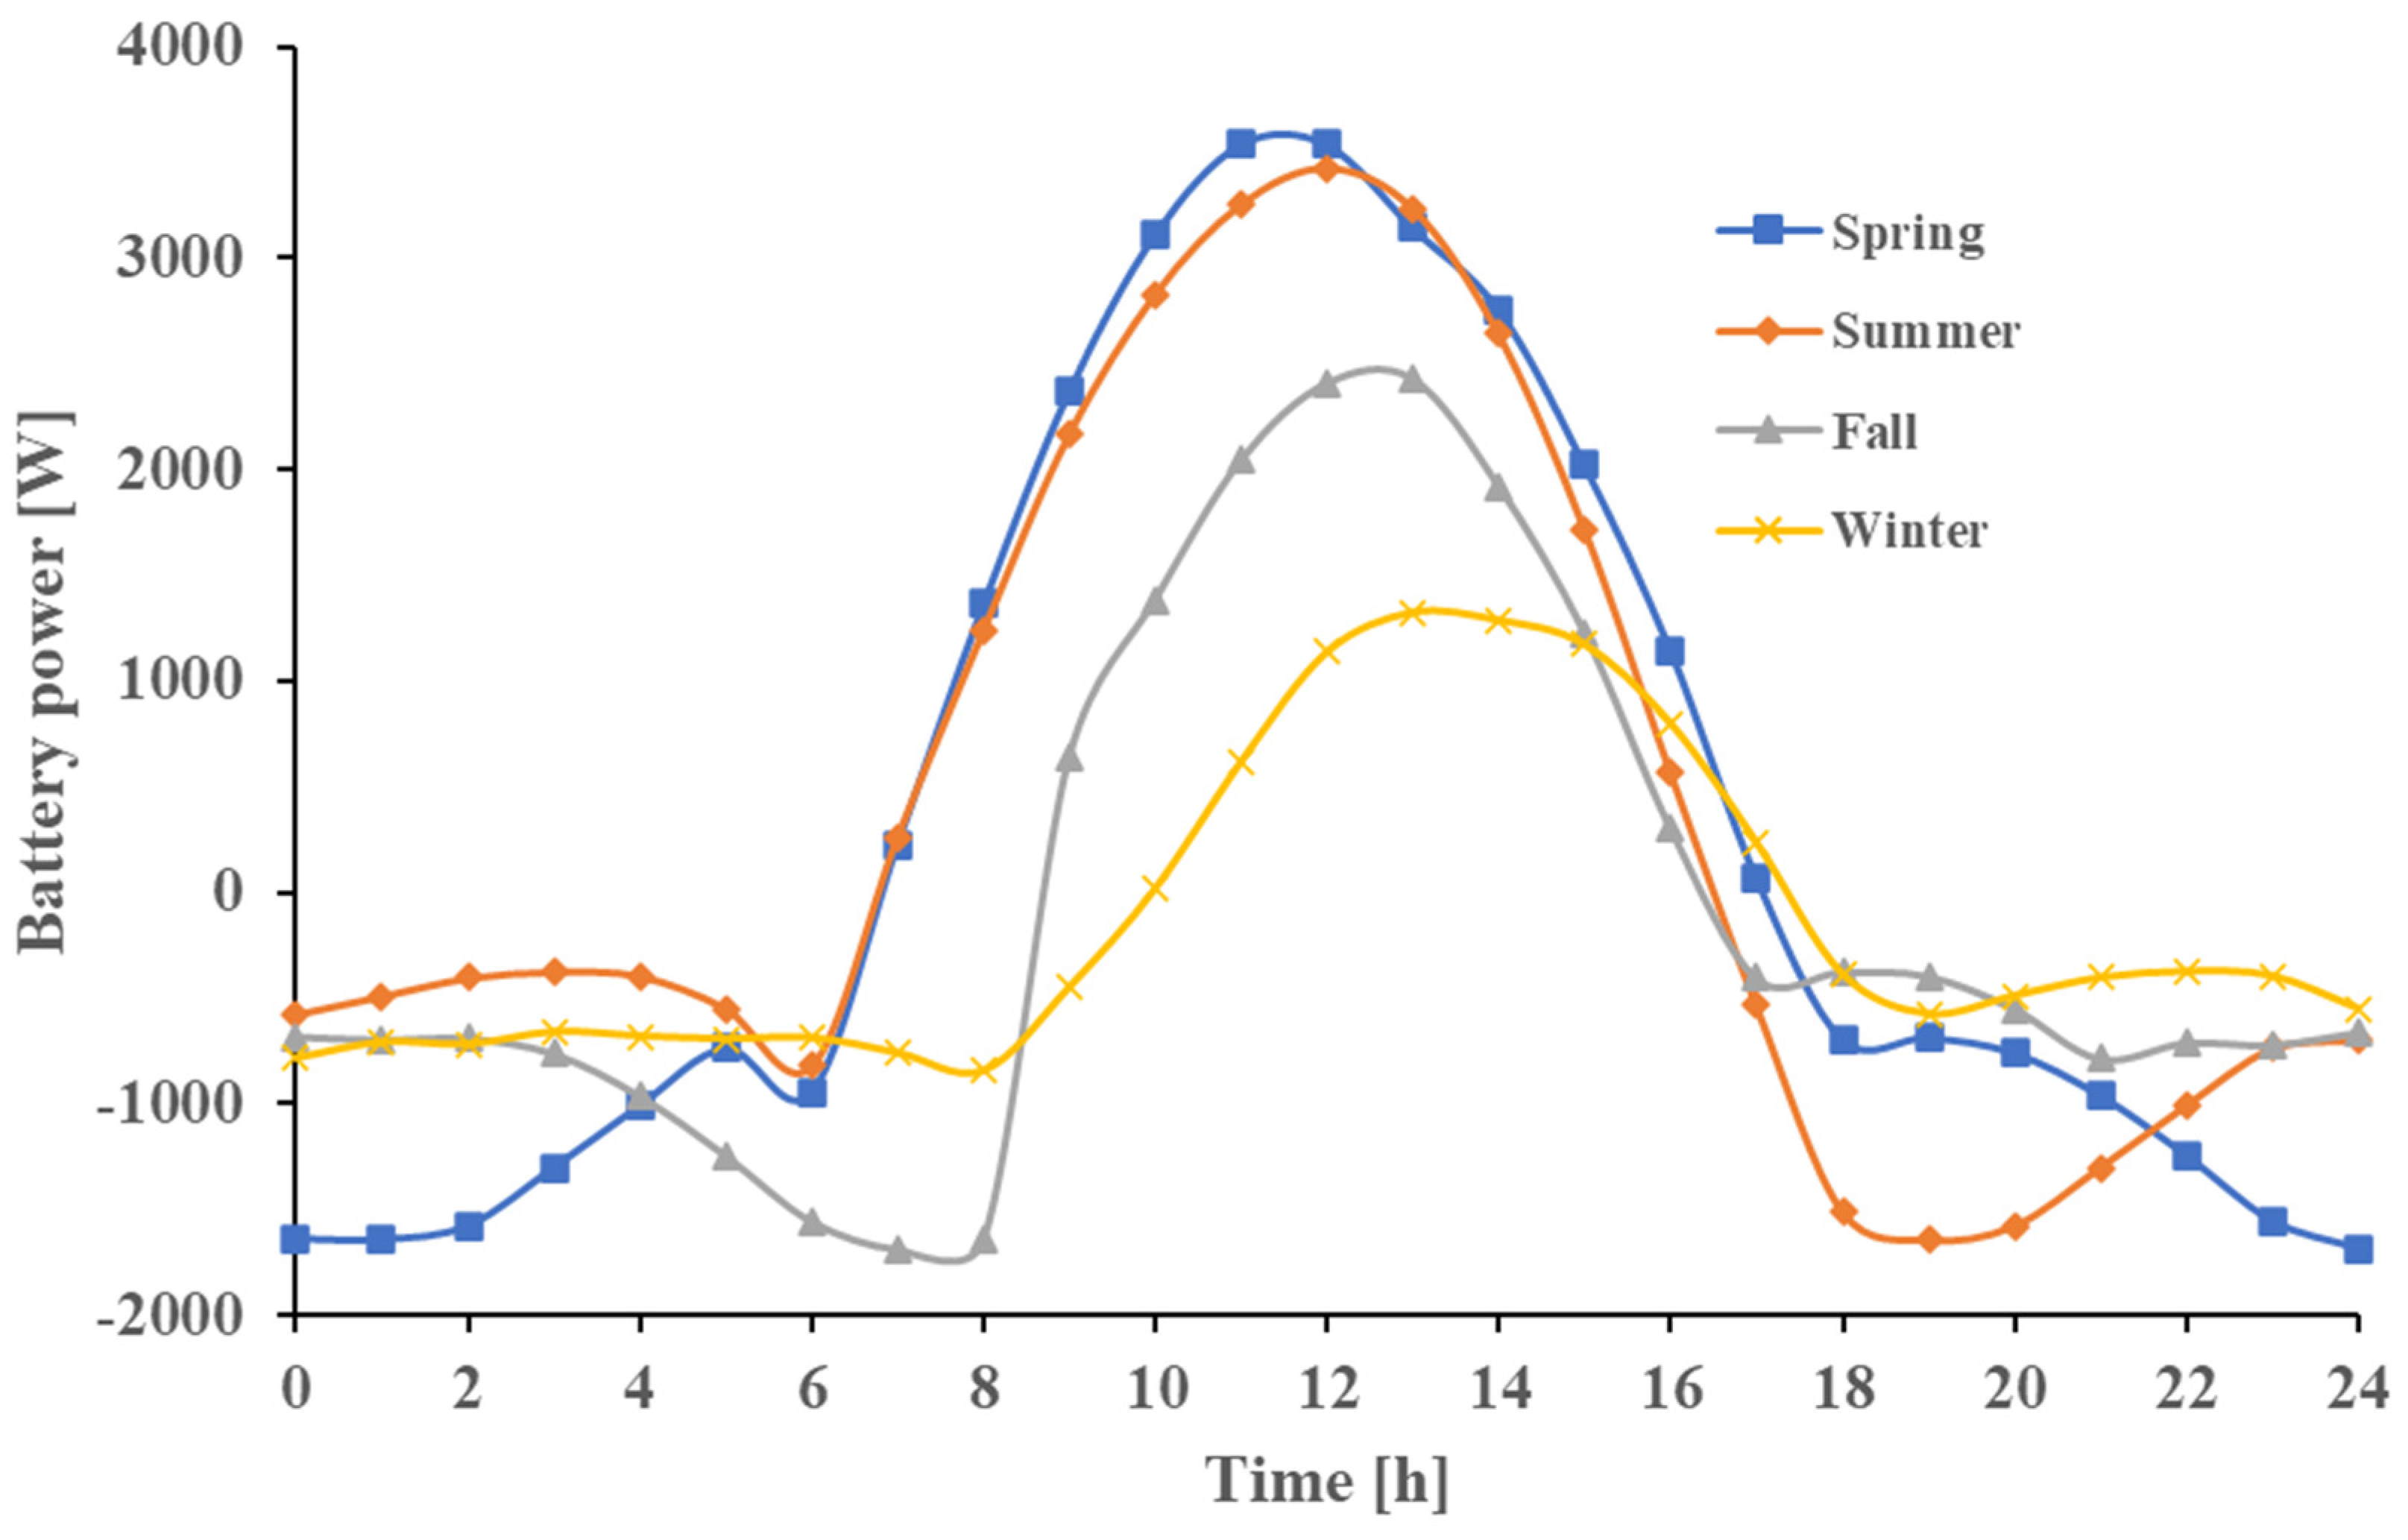
The daily and hourly battery charging and discharging power is shown in
Figure 16 and
Figure 17, respectively. As it can be seen in
Figure 16, battery charging power increased at the beginning of spring and reached its peak at the middle of summer when maximum value of solar power is generated and stored. In addition, the fluctuations which can be seen during the summer is due to the activation and deactivation of circuit breaker in the system to prevent battery packs from being overcharged. After reaching the annual charging power peak in the middle of summer, it decreases until the middle of winter when minimum radiation and solar power generation are observed. The annual discharging power is sustained as the demand values are assumed to be constant (by considering its maximum value) during the year in this study. In
Figure 17, more fluctuations can be seen in spring and summer days compared to autumn and winter resulting from higher amounts of charging rates and generated solar power.
The variations of battery modules’ state of charge in homogeneous and heterogeneous second life battery packs is shown in
Figure 18 during the year. The battery pack’ modules SoC is changed during the year as the initial and final SoC for each day is not the same during the year. Consequently, it results in fading or rising of the battery modules SoC peaks during the year as shown in
Figure 18. The SOC peaks during the year is fluctuated around its maximum values from the beginning of spring until the end of summer. The circuit breaker is controlled by SOC of the module with 80% SoH. Accordingly, when the module with 80% SoH reached its 90% SOC, the modules with 75% and 85% SOH reached 95% and 88% of their SOC, respectively. Sharper decrease in SOC peaks observed for the module with 85% SOH from the end of summer to the middle of winter due to significant decrease of solar energy (see
Figure 14).
In heterogeneous scenario, the lowest SOC peaks belong to the module with 85% SoH which is the healthiest module in the proposed second life battery pack due to the higher capacity available in this module. Furthermore, it is demonstrated that the SOC peak variations of the homogeneous second life battery pack during the year is nearly similar to the 80% SoH modules in the heterogeneous packs. This is due to both modules having similar capacities. The module with 70% SoH reached the highest SOC value among others during the year as it has the lowest capacity. The nature of analysis presented in
Figure 16 allows for the battery management systems to better control the ageing of each module separately, prolonging the lifespan of the system.
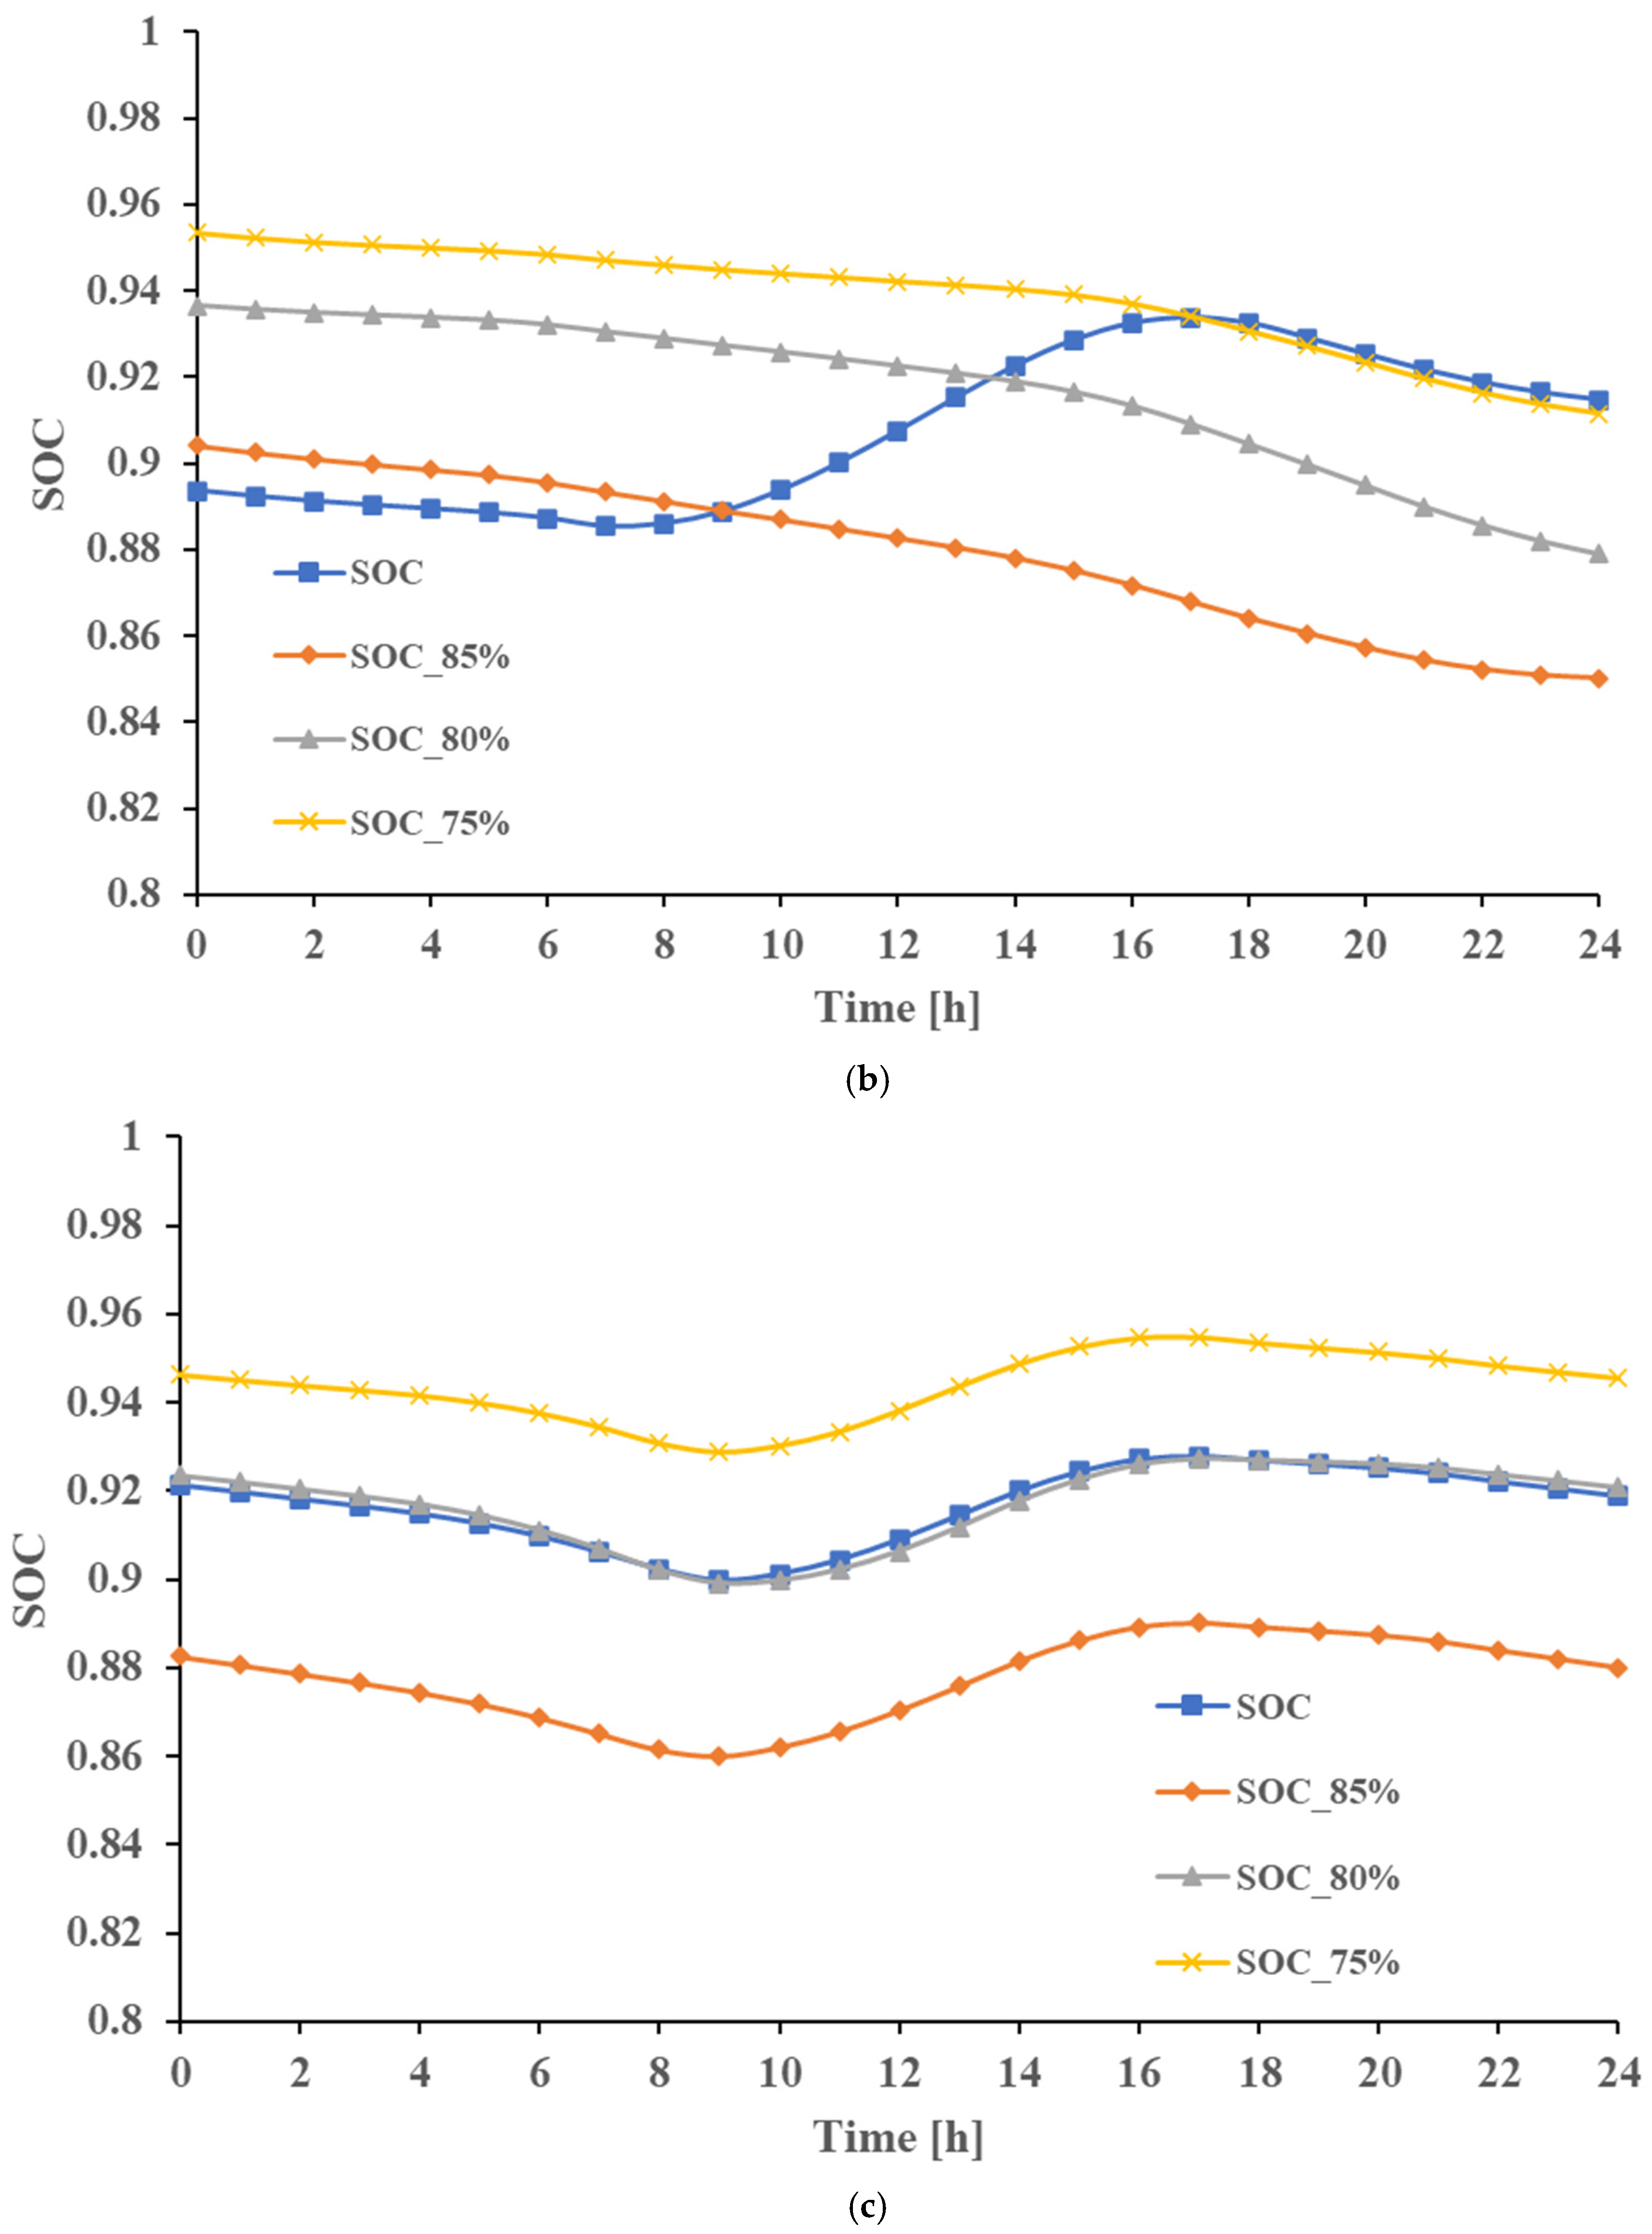
The hourly values of SOC in different seasons’ representative days are shown in
Figure 19a–d. As mentioned for
Figure 18, the SOC variations of the homogeneous second life battery pack are similar to the heterogeneous module with 80% SoH except in summer, due to the interruptions made by the circuit breaker leading to the system’s change of behaviour. Moreover, comparison of this figures proves that the lowest value of SOCs is reached in winter, due to having the lowest charging rate. Utilising larger capacity batteries in off-grid systems would result in storing more energy during summer. Assuming that demand of system would be constant, it can be predicted that there would be more energy available in batteries when the autumn begins leading to observing lesser SOC fade in autumn and winter.
The charging and discharging current of the modules with various SoH during the year is also show in
Figure 20 for the heterogeneous second life battery pack. The variation trend is similar to what was observed in
Figure 16, while maximum charging current (7 A) and minimum discharging current (3.8 A) are reached in spring and winter days. In addition, the current through the modules with lower SoH is lower than the ones with higher SoH leading to faster degradation of the cells with higher SoH. By assuming linear capacity fade for each module, it is expected that the SoH values of modules get closer to each other by passing of the time.
4. Conclusions
In this paper, mathematical modelling and transient analysis of a second life battery pack consisting of modules with a heterogeneous SoH is performed. The methodology presented in this study can be used for simulating second life battery packs containing cells/modules with various SoH, to provide realistic results representing the real-world conditions truly. This is significant as in most of the related published work in the literature, the module-to-module and cell-to-cell variations associated with the differences in their state of health is neglected.
For modelling of the second life battery pack, the 3Ah NCM battery cell’s experimental data was used to fit the parameters needed in the second-order equivalent circuit model. Degradation analysis of the proposed second life cells are performed using a mixture of the predicted and lab tested data. For prediction of second life SoH, exponential triple smoothing algorithm is employed in this study. The validated second life battery cell models are categorised in three groups based on their SoH; the cells with 75%, 80%, and 85% state of health. The second life battery pack with two scenarios is considered in this study; homogeneous and heterogeneous modules while the total capacity of the battery pack in both scenarios are the same. The battery packs are integrated with an off-grid PV system in a residential building located in Oxford, UK. A mathematical model is also utilised to predict the solar irradiance based on its location and time. The main conclusions drawn from this study can be listed as:
- -
Decreasing the SoH of the modules leads to higher SOC during the year due to their capacity decrease and ohmic resistance increase.
- -
There is higher electrical current through modules with higher state of health leading to a faster degradation of the modules compared to the ones with a lower SoH. It is expected that the SoH values of modules get closer to each other by passing of the time.
- -
The highest SOC values of the studied modules are achieved in the warmer months of the year. The circuit breaker switch is frequently activated in this period to prevent the batteries from being overcharged (>90%)
The methodology and modelling process introduced in this paper enables the researchers to predict the variations in the second life battery parameters, in cell and module levels. This leads to producing more efficient battery management systems allowing for a longer system lifespan.
The main advantage of the methodology introduced in this paper is that more accuracy can be reached in the parameter estimation performed by battery management systems. The voltage of cells and modules are predicted by BMS systems to control the battery pack parameters. The introduced algorithm will improve the accuracy of prediction. In addition, in this study, the statistical forecasting method is used to predict the second life battery state of health (or remained maximum capacity) in various times during operation, which decreases the experimental analysis time required for testing second life batteries. Furthermore, the second life batteries are collected from different EVs with unknown history of degradation, therefore, employment of such forecasting methods enables the BMS to predict the state of health of each module individually based on their historical functional measured data.
The impacts of sudden variation of different parameters such as environmental temperature or operational temperature on second life battery model cannot be predicted using this methodology and could be further improved using AI methods.
As computational processing time required for solving the introduced model is far lower than numerical physical models for second life batteries, it would save time and cost required for simulation time.
This research could be further enhanced by developing advanced state of health (SoH) estimation methods to consider the impacts of pack thermal parameters on its ageing process. Accordingly, the battery pack cooling system could be integrated with the model presented in this paper.
Author Contributions
Conceptualization, methodology, software, validation, F.S., P.H. and S.R.; formal analysis, S.R. and F.S.; resources, S.R. and D.M.; writing—original draft preparation, F.S. and S.R.; writing—review and editing, F.S., S.R., D.M., A.A. and P.H.; visualization, F.S. and S.R.; supervision, S.R., P.H. and D.M. All authors have read and agreed to the published version of the manuscript.
Funding
This research received no external funding.
Data Availability Statement
The related data are presented within the manuscript.
Conflicts of Interest
The authors declare they have no conflict of interest.
Nomenclature
| EV | Electric vehicle |
| PV | Photovoltaic panel |
| ESS | Energy storage system |
| ECM | Equivalent circuit model |
| ETS | Exponential triple smoothing |
| EIS | Electrochemical impedance spectroscopy |
| HPPC | Hybrid-pulse power characterisation |
| SoC | State of charge |
| SoH | State of health |
Appendix A
Appendix A.1. PV Panels
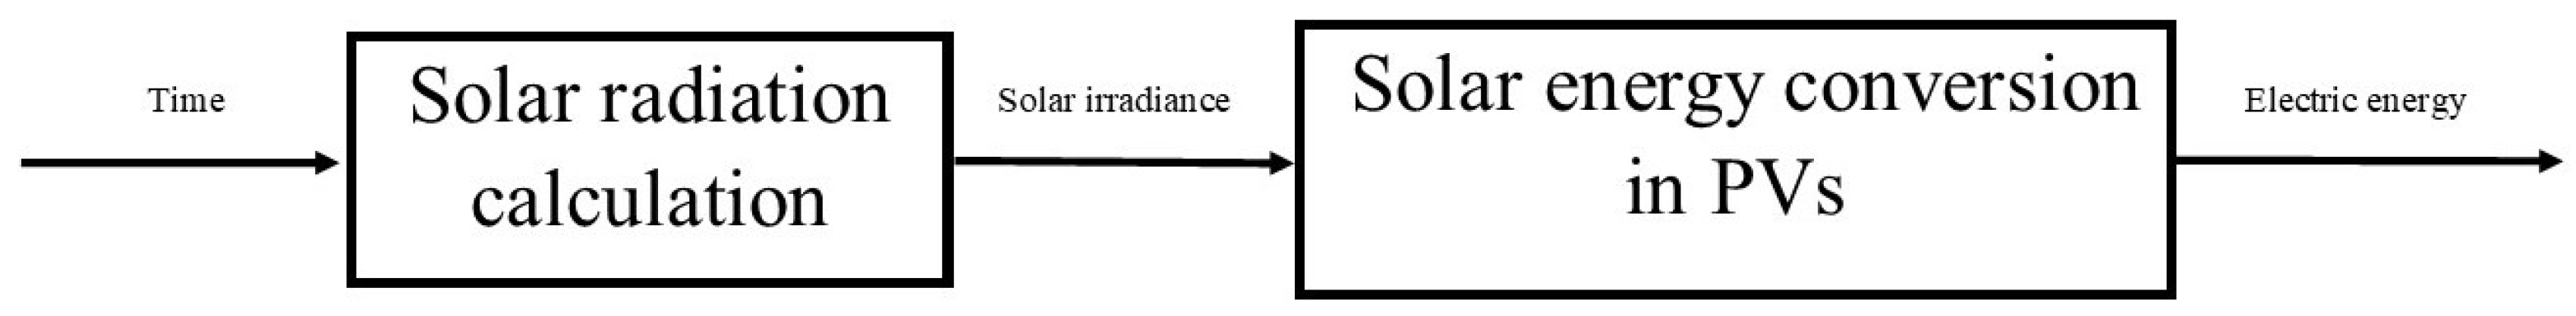
In this section, the mathematical model used for predicting the solar energy generation using PVs is described. As shown in
Figure A1, the input of the system would be the time parameter to calculate the value of solar radiation throughout the year. After obtaining solar irradiance values, the electric energy generated by the PV panels will be calculated, considering also the PV energy losses.
Figure A1.
Flow chart for calculation of electricity generated by solar irradiance.
Figure A1.
Flow chart for calculation of electricity generated by solar irradiance.
Solar Radiation
In order to calculate the incident solar radiation, the incidence angle (
) of the beam radiation for a tilted surface can be calculated using Equation (A1) [
35,
36]:
where
,
,
,
and
are declination, latitude, slope, hour angle, and surface azimuth angle, respectively [
35]. Oxford’s geographical altitude (=51.752°) is used for
parameter. A 30° pitched roof, as the most commonly used slope in the UK, is considered for
. To consider the declination, equation of Cooper is employed [
35]:
Equation (A3) is used for calculating radiation on the tilted plane (
) [
35,
37]:
where
is extraterrestrial radiation and assumed as 1367 W/m
2 [
38]. In addition, for considering the impacts of atmosphere environment on transmission of beam and diffuse radiations, Hottel method is used which is based on the following equations [
35,
38]:
and
are the atmospheric transmittance for beam and diffuse radiations, respectively. More information about the parameters used in Equations (A4) and (A5) can be found in this reference [
35]. Finally, Equation (A6) is employed to calculate the clear-sky radiation (
) [
35]:
References
- Ivanov, O.; Neagu, B.-C.; Grigoras, G.; Scarlatache, F.; Gavrilas, M. A metaheuristic algorithm for flexible energy storage management in residential electricity distribution grids. Mathematics 2021, 9, 2375. [Google Scholar] [CrossRef]
- Gómez Sánchez, M.; Macia, Y.M.; Fernández Gil, A.; Castro, C.; Nuñez González, S.M.; Pedrera Yanes, J. A mathematical model for the optimization of renewable energy systems. Mathematics 2020, 9, 39. [Google Scholar] [CrossRef]
- Bilal, M.; Alsaidan, I.; Alaraj, M.; Almasoudi, F.M.; Rizwan, M. Techno-Economic and Environmental Analysis of Grid-Connected Electric Vehicle Charging Station Using AI-Based Algorithm. Mathematics 2022, 10, 924. [Google Scholar] [CrossRef]
- Munankarmi, P.; Maguire, J.; Balamurugan, S.P.; Blonsky, M.; Roberts, D.; Jin, X. Community-scale interaction of energy efficiency and demand flexibility in residential buildings. Appl. Energy 2021, 298, 117149. [Google Scholar] [CrossRef]
- Khan, N.; Haq, I.U.; Ullah, F.U.M.; Khan, S.U.; Lee, M.Y. CL-Net: ConvLSTM-Based Hybrid Architecture for Batteries’ State of Health and Power Consumption Forecasting. Mathematics 2021, 9, 3326. [Google Scholar] [CrossRef]
- Rosati, A.; Facci, A.L.; Ubertini, S. Techno-economic analysis of battery electricity storage towards self-sufficient buildings. Energy Convers. Manag. 2022, 256, 115313. [Google Scholar] [CrossRef]
- Khezri, R.; Mahmoudi, A.; Aki, H. Optimal planning of solar photovoltaic and battery storage systems for grid-connected residential sector: Review, challenges and new perspectives. Renew. Sustain. Energy Rev. 2022, 153, 111763. [Google Scholar] [CrossRef]
- Mossa, M.A.; Gam, O.; Bianchi, N. Dynamic Performance Enhancement of a Renewable Energy System for Grid Connection and Stand-alone Operation with Battery Storage. Energies 2022, 15, 1002. [Google Scholar] [CrossRef]
- Güven, A.F.; Yörükeren, N.; Samy, M.M. Design optimization of a stand-alone green energy system of university campus based on Jaya-Harmony Search and Ant Colony Optimization algorithms approaches. Energy 2022, 253, 124089. [Google Scholar] [CrossRef]
- Mrozik, W.; Rajaeifar, M.A.; Heidrich, O.; Christensen, P. Environmental impacts, pollution sources and pathways of spent lithium-ion batteries. Energy Environ. Sci. 2021, 14, 6099–6121. [Google Scholar] [CrossRef]
- Jiang, S.; Hua, H.; Zhang, L.; Liu, X.; Wu, H.; Yuan, Z. Environmental impacts of hydrometallurgical recycling and reusing for manufacturing of lithium-ion traction batteries in China. Sci. Total Environ. 2022, 811, 152224. [Google Scholar] [CrossRef] [PubMed]
- Arshad, F.; Lin, J.; Manurkar, N.; Fan, E.; Ahmad, A.; Tariq, M.-U.; Wu, F.; Chen, R.; Li, L. Life Cycle Assessment of Lithium-ion Batteries: A Critical Review. Resour. Conserv. Recycl. 2022, 180, 106164. [Google Scholar] [CrossRef]
- Casals, L.C.; García, B.A.; Canal, C. Second life batteries lifespan: Rest of useful life and environmental analysis. J. Environ. Manag. 2019, 232, 354–363. [Google Scholar] [CrossRef] [PubMed]
- Shahjalal, M.; Roy, P.K.; Shams, T.; Fly, A.; Chowdhury, J.I.; Ahmed, R.; Liu, K. A review on second-life of Li-ion batteries: Prospects, challenges, and issues. Energy 2021, 241, 122881. [Google Scholar] [CrossRef]
- Locorotondo, E.; Cultrera, V.; Pugi, L.; Berzi, L.; Pasquali, M.; Andrenacci, N.; Lutzemberger, G.; Pierini, M. Impedance spectroscopy characterization of lithium batteries with different ages in second life application. In Proceedings of the 2020 IEEE International Conference on Environment and Electrical Engineering and 2020 IEEE Industrial and Commercial Power Systems Europe (EEEIC/I&CPS Europe), Madrid, Spain, 9–12 June 2020. [Google Scholar]
- Hu, X.; Deng, X.; Wang, F.; Deng, Z.; Lin, X.; Teodorescu, R.; Pecht, M.G. A Review of Second-Life Lithium-Ion Batteries for Stationary Energy Storage Applications. Proc. IEEE 2022, 110, 735–753. [Google Scholar] [CrossRef]
- Fallah, N.; Fitzpatrick, C. How will retired electric vehicle batteries perform in grid-based second-life applications? A comparative techno-economic evaluation of used batteries in different scenarios. J. Clean. Prod. 2022, 361, 132281. [Google Scholar] [CrossRef]
- Zhao, Y.; Pohl, O.; Bhatt, A.; Collis, G.; Mahon, P.; Rüther, T.; Hollenkamp, A. A Review on Battery Market Trends, Second-Life Reuse, and Recycling. Sustain. Chem. 2021, 2, 167–205. [Google Scholar] [CrossRef]
- Rahil, A.; Partenie, E.; Bowkett, M.; Nazir, M.H.; Hussain, M.M. Investigating the possibility of using second-life batteries for grid applications. Batter. Energy 2022, 1, 20210001. [Google Scholar] [CrossRef]
- Mathews, I.; Xu, B.; He, W.; Barreto, V.; Buonassisi, T.; Peters, I.M. Technoeconomic model of second-life batteries for utility-scale solar considering calendar and cycle aging. Appl. Energy 2020, 269, 115127. [Google Scholar] [CrossRef]
- Bhatt, A.; Ongsakul, W.; Madhu, N.; Singh, J.G. Machine learning-based approach for useful capacity prediction of second-life batteries employing appropriate input selection. Int. J. Energy Res. 2021, 45, 21023–21049. [Google Scholar] [CrossRef]
- Tong, S.; Fung, T.; Klein, M.P.; Weisbach, D.A.; Park, J.W. Demonstration of reusing electric vehicle battery for solar energy storage and demand side management. J. Energy Storage 2017, 11, 200–210. [Google Scholar] [CrossRef]
- Hart, P.; Kollmeyer, P.; Juang, L.; Lasseter, R.; Jahns, T. Modeling of second-life batteries for use in a CERTS microgrid. In Proceedings of the 2014 Power and Energy Conference at Illinois (PECI), Champaign, IL, USA, 20–21 February 2015. [Google Scholar]
- Assunção, A.; Moura, P.S.; de Almeida, A.T. Technical and economic assessment of the secondary use of repurposed electric vehicle batteries in the residential sector to support solar energy. Appl. Energy 2016, 181, 120–131. [Google Scholar] [CrossRef]
- Pimm, A.J.; Cockerill, T.T.; Taylor, P.G. The potential for peak shaving on low voltage distribution networks using electricity storage. J. Energy Storage 2018, 16, 231–242. [Google Scholar] [CrossRef]
- Barth, T.; Lange, J. Flexible and Cost-Effective HiL System for Module-Based VSC Simulation–Part II: A Fast and Tunable FPGA Based Circuit Simulation Model. In Proceedings of the PCIM Europe 2022, International Exhibition and Conference for Power Electronics, Intelligent Motion, Renewable Energy and Energy Management, Nuremberg, Germany, 10–12 May 2022. [Google Scholar]
- Neupane, D.; Gurung, S.; Neupane, S.; Bhattarai, N. Power Sharing in Solar PV: Microhydro Hybrid System Using Power Angle Control Strategy. J. Control. Autom. Electr. Syst. 2022, 1–11. [Google Scholar] [CrossRef]
- AS-6M 360W~400W—Amerisolar. Available online: https://www.weamerisolar.eu/wp-content/uploads/2021/03/AS-6M-Module-Specification-1956-992-40mm.pdf (accessed on 1 August 2022).
- Sprake, D.; Vagapov, Y.; Lupin, S.; Anuchin, A. Housing estate energy storage feasibility for a 2050 scenario. In Proceedings of the 2017 Internet Technologies and Applications (ITA), Wrexham, UK, 12–15 September 2017. [Google Scholar]
- Solar Cell. Available online: https://uk.mathworks.com/help/physmod/sps/ref/solarcell.html;jsessionid=bdf3b2865e01ab9c5896c9e033dc (accessed on 1 August 2022).
- Wang, S.; Takyi-Aninakwa, P.; Fan, Y.; Yu, C.; Jin, S.; Fernandez, C.; Stroe, D.-I. A novel feedback correction-adaptive Kalman filtering method for the whole-life-cycle state of charge and closed-circuit voltage prediction of lithium-ion batteries based on the second-order electrical equivalent circuit model. Int. J. Electr. Power Energy Syst. 2022, 139, 108020. [Google Scholar] [CrossRef]
- Documentation: Mathworks. 2022. Available online: https://uk.mathworks.com/help/ (accessed on 1 August 2022).
- Planden, B.; Lukow, K.; Collier, G.; Morrey, D. Battery Testing Consortium: A Framework for Improvements in High-Power Battery Design. Adv. Battery Power 2022. [Google Scholar] [CrossRef]
- Braco, E.; Martín, I.S.; Berrueta, A.; Sanchis, P.; Ursúa, A. Experimental assessment of cycling ageing of lithium-ion second-life batteries from electric vehicles. J. Energy Storage 2020, 32, 101695. [Google Scholar] [CrossRef]
- Duffie, J.A.; Beckman, W.A. Solar Engineering of Thermal Processes; Wiley: Hoboken, NJ, USA, 2013. [Google Scholar]
- Boccalatte, A.; Fossa, M.; Ménézo, C. Calculation of the incidence angle modifier of a Linear Fresnel Collector: The proposed declination and zenith angle model compared to the biaxial factored approach. Renew. Energy 2022, 185, 123–138. [Google Scholar] [CrossRef]
- Salek, F.; Rahnama, M.; Eshghi, H.; Babaie, M.; Naserian, M.M. Investigation of Solar-Driven Hydroxy gas production system performance integrated with photovoltaic panels with single-axis tracking system. Renew. Energy Res. Appl. 2022, 3, 31–40. [Google Scholar]
- Salek, F.; Eshghi, H.; Zamen, M.; Ahmadi, M.H. Energy and exergy analysis of an atmospheric water generator integrated with the compound parabolic collector with storage tank in various climates. Energy Rep. 2022, 8, 2401–2412. [Google Scholar] [CrossRef]
Figure 1.
Cells configuration in each module.
Figure 1.
Cells configuration in each module.
Figure 2.
Modules configuration in each pack.
Figure 2.
Modules configuration in each pack.
Figure 3.
Schematic block diagram of the proposed off-grid energy system.
Figure 3.
Schematic block diagram of the proposed off-grid energy system.
Figure 6.
PV cell block diagram in MATLAB Simulink.
Figure 6.
PV cell block diagram in MATLAB Simulink.
Figure 7.
Schematic diagram of battery cell ECM with 2 RCs.
Figure 7.
Schematic diagram of battery cell ECM with 2 RCs.
Figure 8.
3Ah NCM cell (a) experimental setup which put in (b) thermal chamber.
Figure 8.
3Ah NCM cell (a) experimental setup which put in (b) thermal chamber.
Figure 9.
The HPPC test (a) current and (b) voltage.
Figure 9.
The HPPC test (a) current and (b) voltage.
Figure 10.
The block diagram of experimental setup for HPPC test in MATLAB Simulink.
Figure 10.
The block diagram of experimental setup for HPPC test in MATLAB Simulink.
Figure 11.
The endurance driving cycle profile used in degradation analysis of the cell
33.
Figure 11.
The endurance driving cycle profile used in degradation analysis of the cell
33.
Figure 12.
Real and forecasted (a) capacity, (b) resistance and (c) voltage of the cell.
Figure 12.
Real and forecasted (a) capacity, (b) resistance and (c) voltage of the cell.
Figure 13.
Solar radiation in different days during the year.
Figure 13.
Solar radiation in different days during the year.
Figure 14.
Generated solar power in different days during the year.
Figure 14.
Generated solar power in different days during the year.
Figure 15.
The hourly generated solar power in representative days of each season during the year.
Figure 15.
The hourly generated solar power in representative days of each season during the year.
Figure 16.
Battery power in different days during the year.
Figure 16.
Battery power in different days during the year.
Figure 17.
Battery power variations in representative days of various seasons.
Figure 17.
Battery power variations in representative days of various seasons.
Figure 18.
Battery state of charge in different days during the year.
Figure 18.
Battery state of charge in different days during the year.
Figure 19.
Battery modules state of charge variations during representative days of (a) spring, (b) summer, (c) autumn and (d) winter for first scenario with homogenous modules (SOC) and second scenario with heterogeneous modules.
Figure 19.
Battery modules state of charge variations during representative days of (a) spring, (b) summer, (c) autumn and (d) winter for first scenario with homogenous modules (SOC) and second scenario with heterogeneous modules.
Figure 20.
Electric current of different modules in different days during the year.
Figure 20.
Electric current of different modules in different days during the year.
Table 1.
Specifications of system components.
Table 1.
Specifications of system components.
| Component | Unit | Value |
|---|
| Solar panel model [28] | - | Amerisolar AS 6 M 360 W |
| Number of solar panels [28] | - | 18 |
| Second life battery cell model | - | 3Ah NCM |
| Number of cells in a module | - | 300 |
| Number of cells in series in a row in each module | - | 30 |
| Number of cell rows in each module | - | 10 |
| Number of modules in a pack | - | 5 |
| Number of packs | - | 4 |
| Total capacity of second life battery pack | kWh | 14.94 |
| Energy storage system nominal voltage | V | 120 |
| DC/AC Inverter efficiency | % | 90 |
| DC/DC converter efficiency | % | 98 |
Table 2.
Battery pack’ modules specifications for heterogeneous and homogeneous packs.
Table 2.
Battery pack’ modules specifications for heterogeneous and homogeneous packs.
| Component | SoH [%]
Heterogeneous | SoH [%]
Homogeneous |
|---|
| Module 1 | 85 | 80 |
| Module 2 | 85 | 80 |
| Module 3 | 80 | 80 |
| Module 4 | 75 | 80 |
| Module 5 | 75 | 80 |
Table 3.
Scenarios considered in this study.
Table 3.
Scenarios considered in this study.
| Scenario | Capacity |
|---|
| Homogenous second life battery pack | 14.94 kWh |
| Heterogenous second life battery pack | 14.94 kWh |
Table 4.
Estimated parameters for second-order ECM.
Table 4.
Estimated parameters for second-order ECM.
| SOC | No Load Voltage (Voc) | R0 | R1 | R2 | tau1 | tau2 |
|---|
| 6.25 | 2.88 | 0.01 | 0.0005 | 0.0005 | 10 | 100 |
| 12.5 | 2.88 | 0.01 | 0.0005 | 0.0005 | 10 | 100 |
| 18.75 | 2.88 | 0.01 | 0.0005 | 0.0005 | 10 | 100 |
| 25 | 3.5161 | 0.010009 | 0.0005 | 0.0005 | 10.002 | 100.04 |
| 31.25 | 3.443 | 0.044544 | 0.000788 | 0.000743 | 10.153 | 99.764 |
| 37.5 | 3.5153 | 0.043134 | 0.000792 | 0.000775 | 10.252 | 99.444 |
| 43.75 | 3.5929 | 0.041804 | 0.000776 | 0.000807 | 10.272 | 99.426 |
| 50 | 3.682 | 0.050099 | 0.000854 | 0.000834 | 10.359 | 99.639 |
| 56.25 | 3.7438 | 0.045364 | 0.000812 | 0.000843 | 10.29 | 99.298 |
| 62.5 | 3.8079 | 0.040091 | 0.000748 | 0.000732 | 10.202 | 99.545 |
| 68.75 | 3.8548 | 0.034336 | 0.000693 | 0.00069 | 10.2 | 100.26 |
| 75 | 3.9358 | 0.055542 | 0.00091 | 0.000863 | 10.271 | 99.526 |
| 81.25 | 4.0176 | 0.055272 | 0.000913 | 0.000905 | 10.287 | 99.061 |
| 87.5 | 4.0758 | 0.046265 | 0.000805 | 0.000793 | 10.296 | 100.11 |
| 93.75 | 4.0892 | 0.043434 | 0.000751 | 0.000707 | 10.127 | 99.369 |
| 100 | 4.1456 | 0.048704 | 0.000863 | 0.000801 | 10.011 | 98.335 |
Table 5.
The representative days of different seasons for UK [
35].
Table 5.
The representative days of different seasons for UK [
35].
| Season | Representative Month | Representative Day |
|---|
| Spring | April | 105 |
| Summer | July | 198 |
| Autumn | October | 288 |
| Winter | January | 17 |
| Publisher’s Note: MDPI stays neutral with regard to jurisdictional claims in published maps and institutional affiliations. |
© 2022 by the authors. Licensee MDPI, Basel, Switzerland. This article is an open access article distributed under the terms and conditions of the Creative Commons Attribution (CC BY) license (https://creativecommons.org/licenses/by/4.0/).


