
ReRec: A Divide-and-Conquer Approach to Recommendation Based on Repeat Purchase Behaviors of Users in Community E-Commerce


Abstract
:1. Introduction
2. Problem Statement
3. Related Works
3.1. Nearest Neighborhood Based Recommendation
3.2. Matrix Factorization Based Recommendation
3.3. Context-Aware Recommendation
4. The Proposed Approach
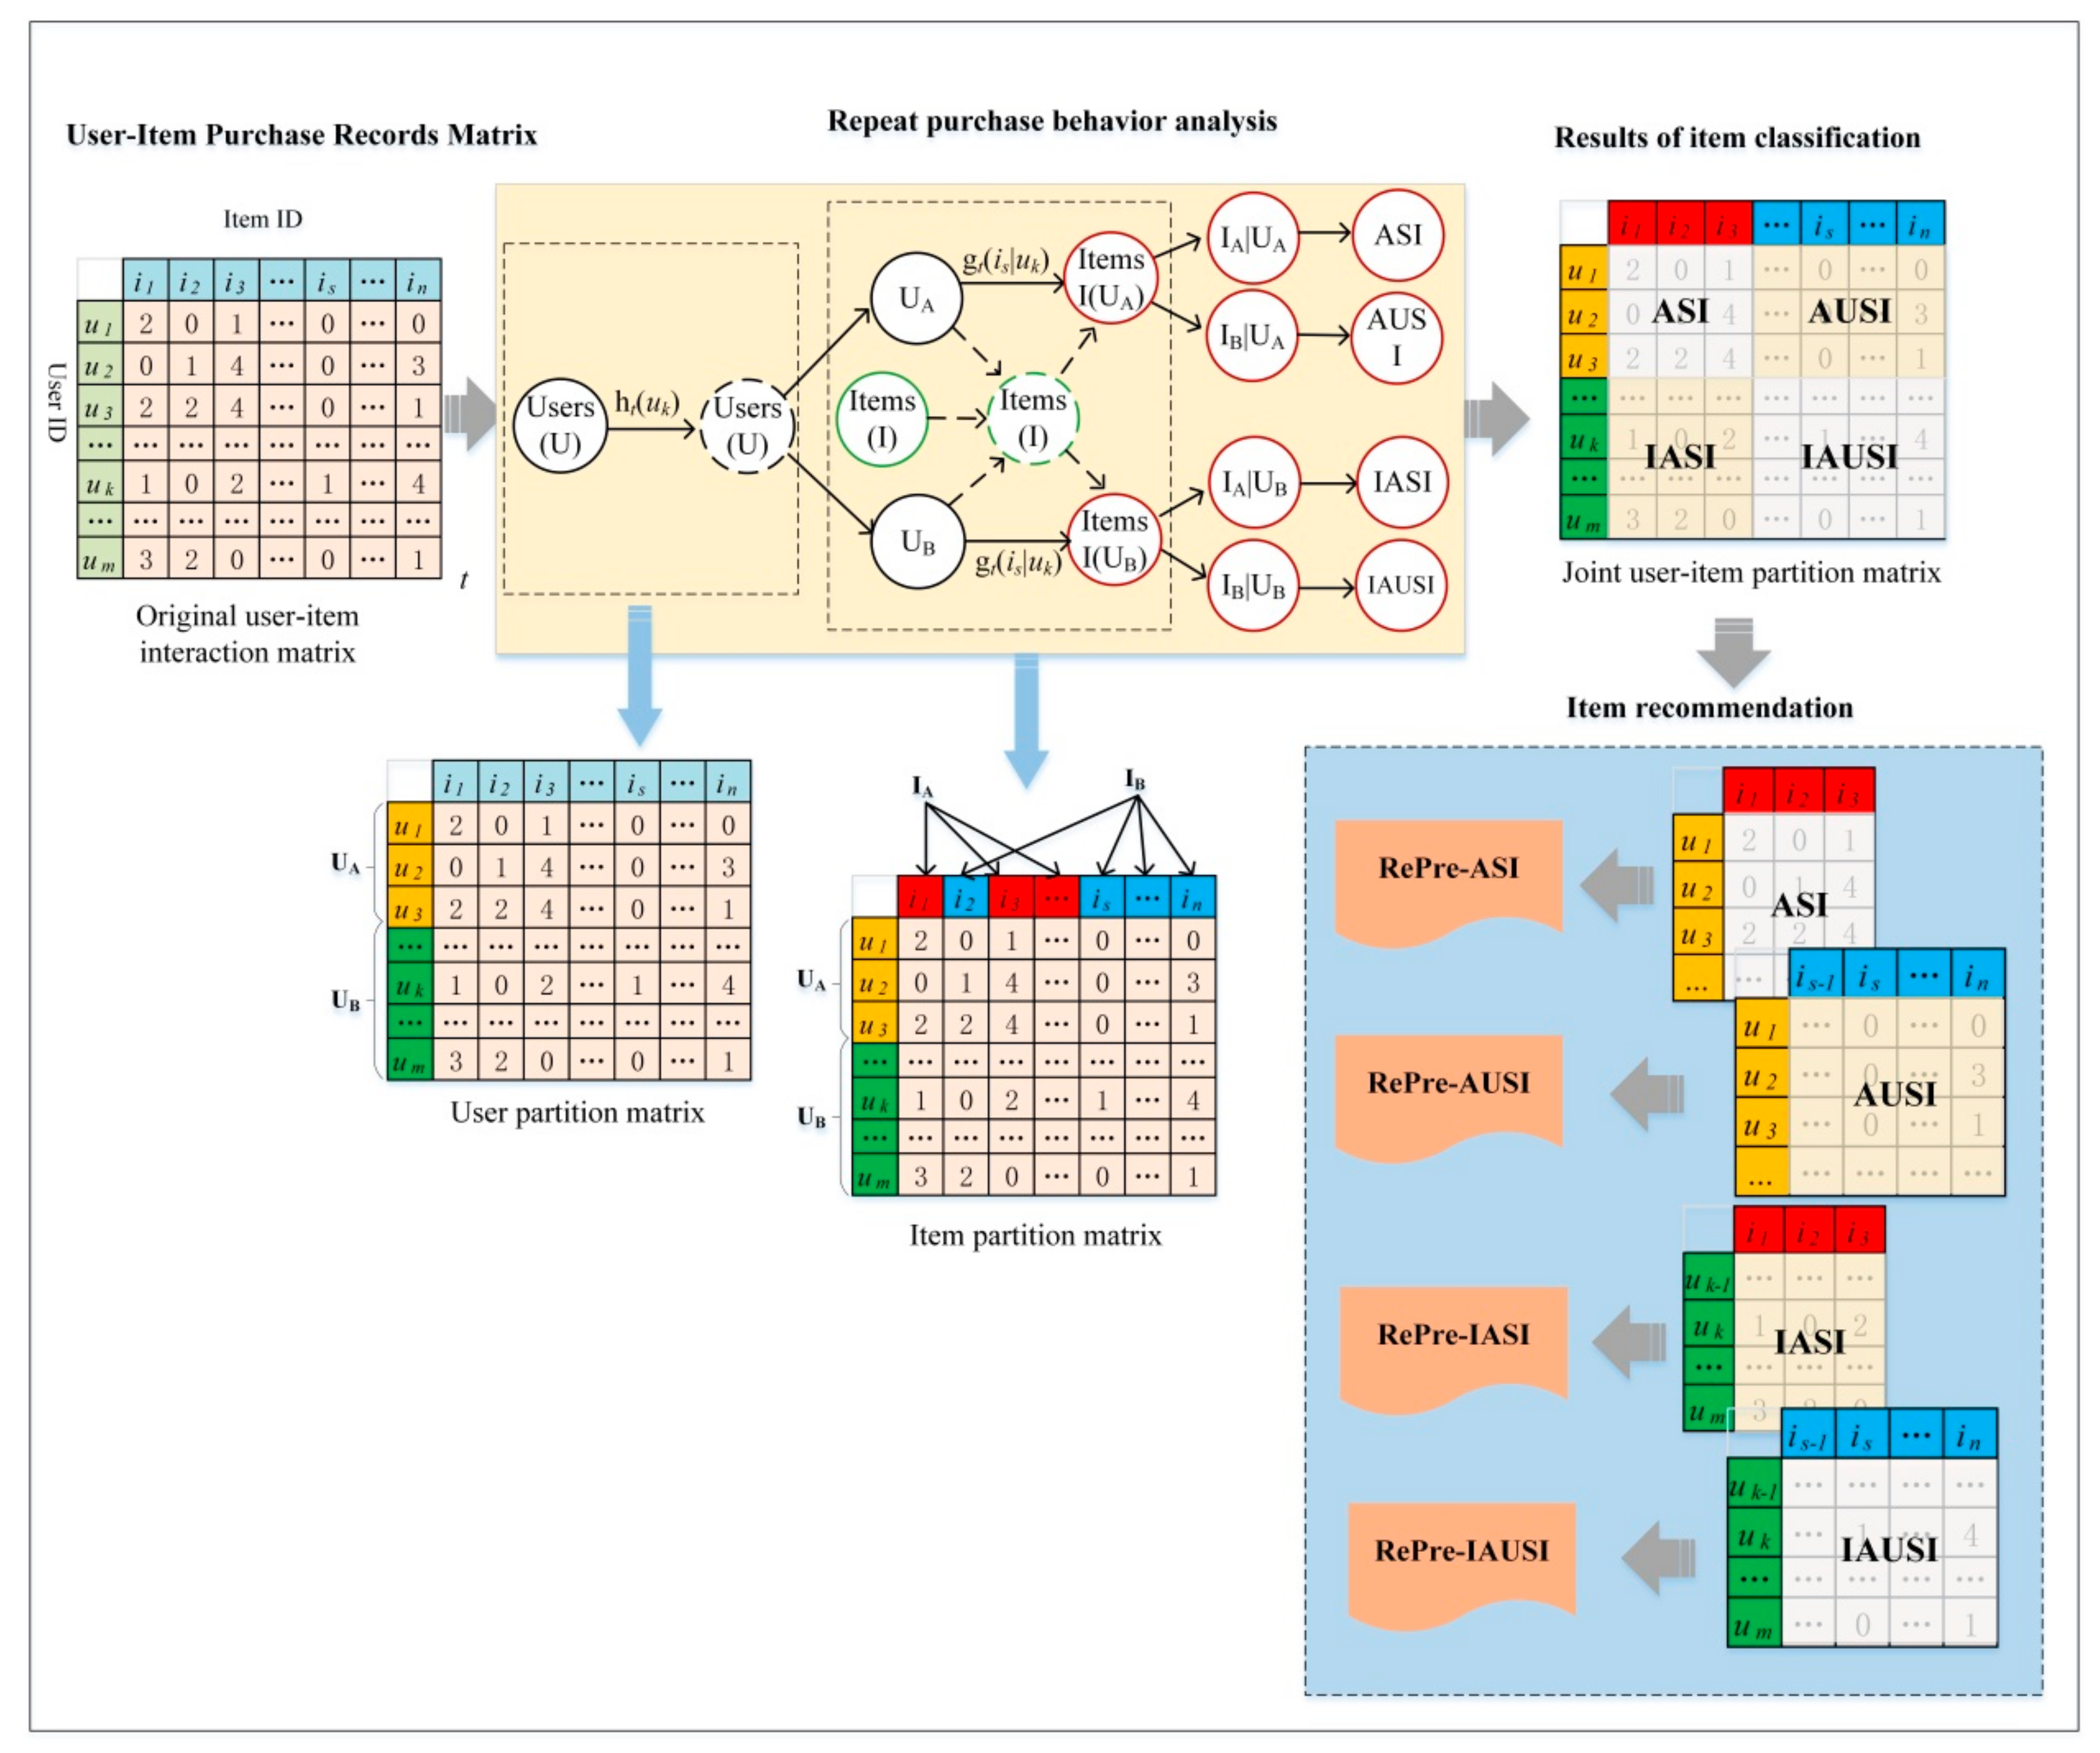
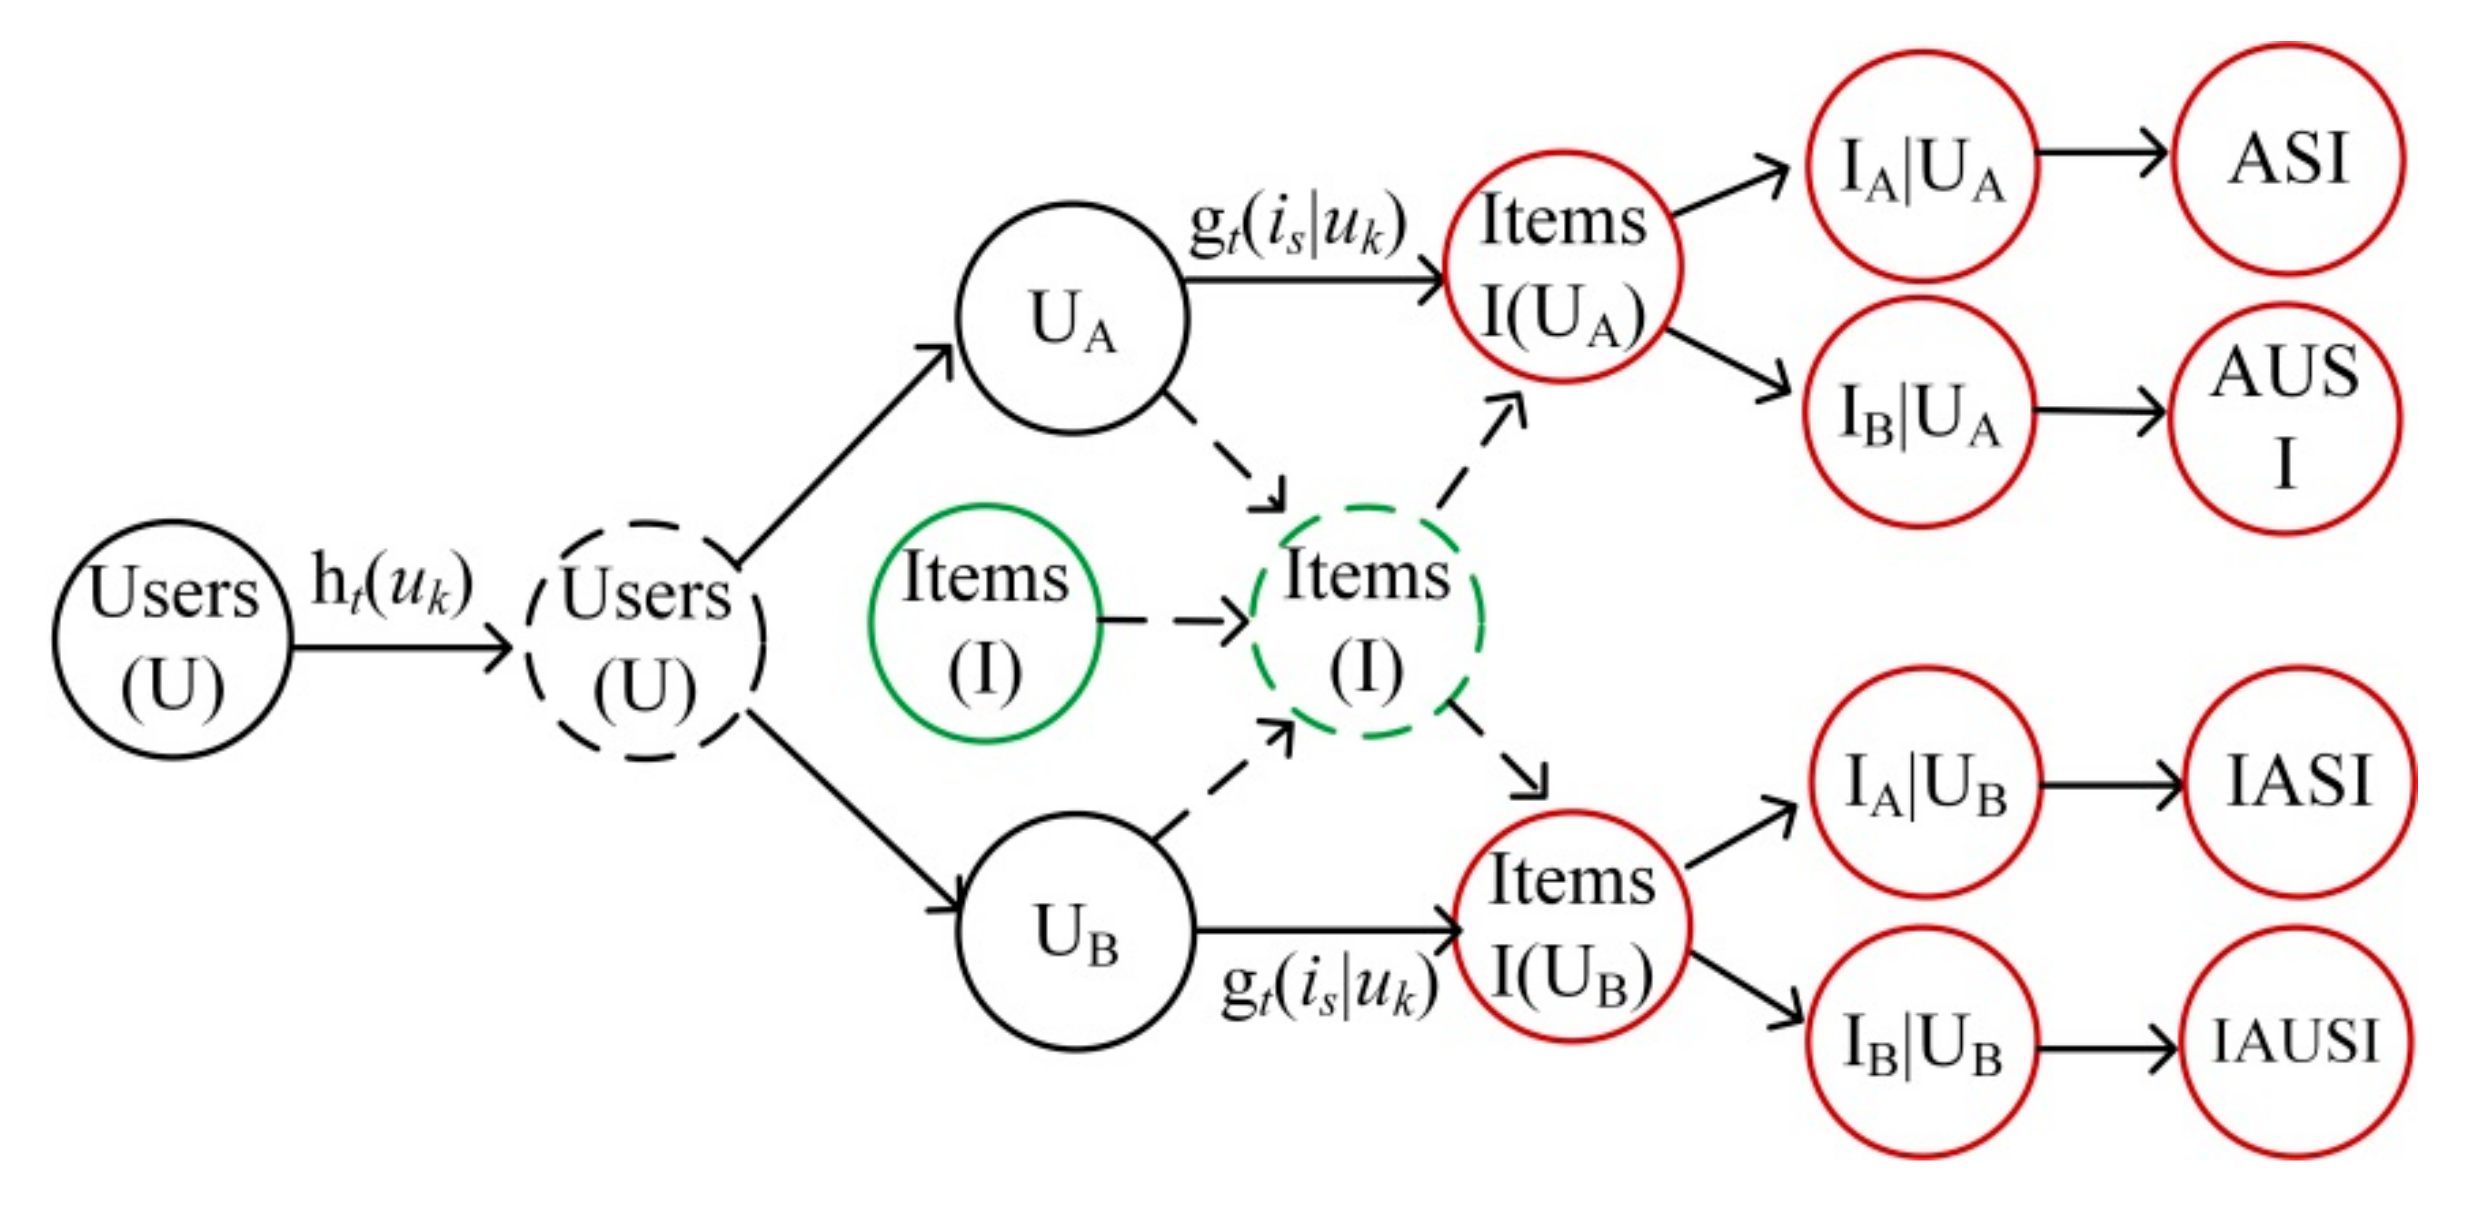
4.1. The Overview of the ReRec Approach
4.2. Repeat Purchase Behavior Modeling
4.2.1. The Classification Models
4.2.2. User–Item Interaction
4.3. Item Recommendation
4.3.1. Model of ReRec-ASI
4.3.2. Model of ReRec-AUSI
4.3.3. Model of ReRec-IASI
4.3.4. Model of ReRec-IAUSI
5. Experiments
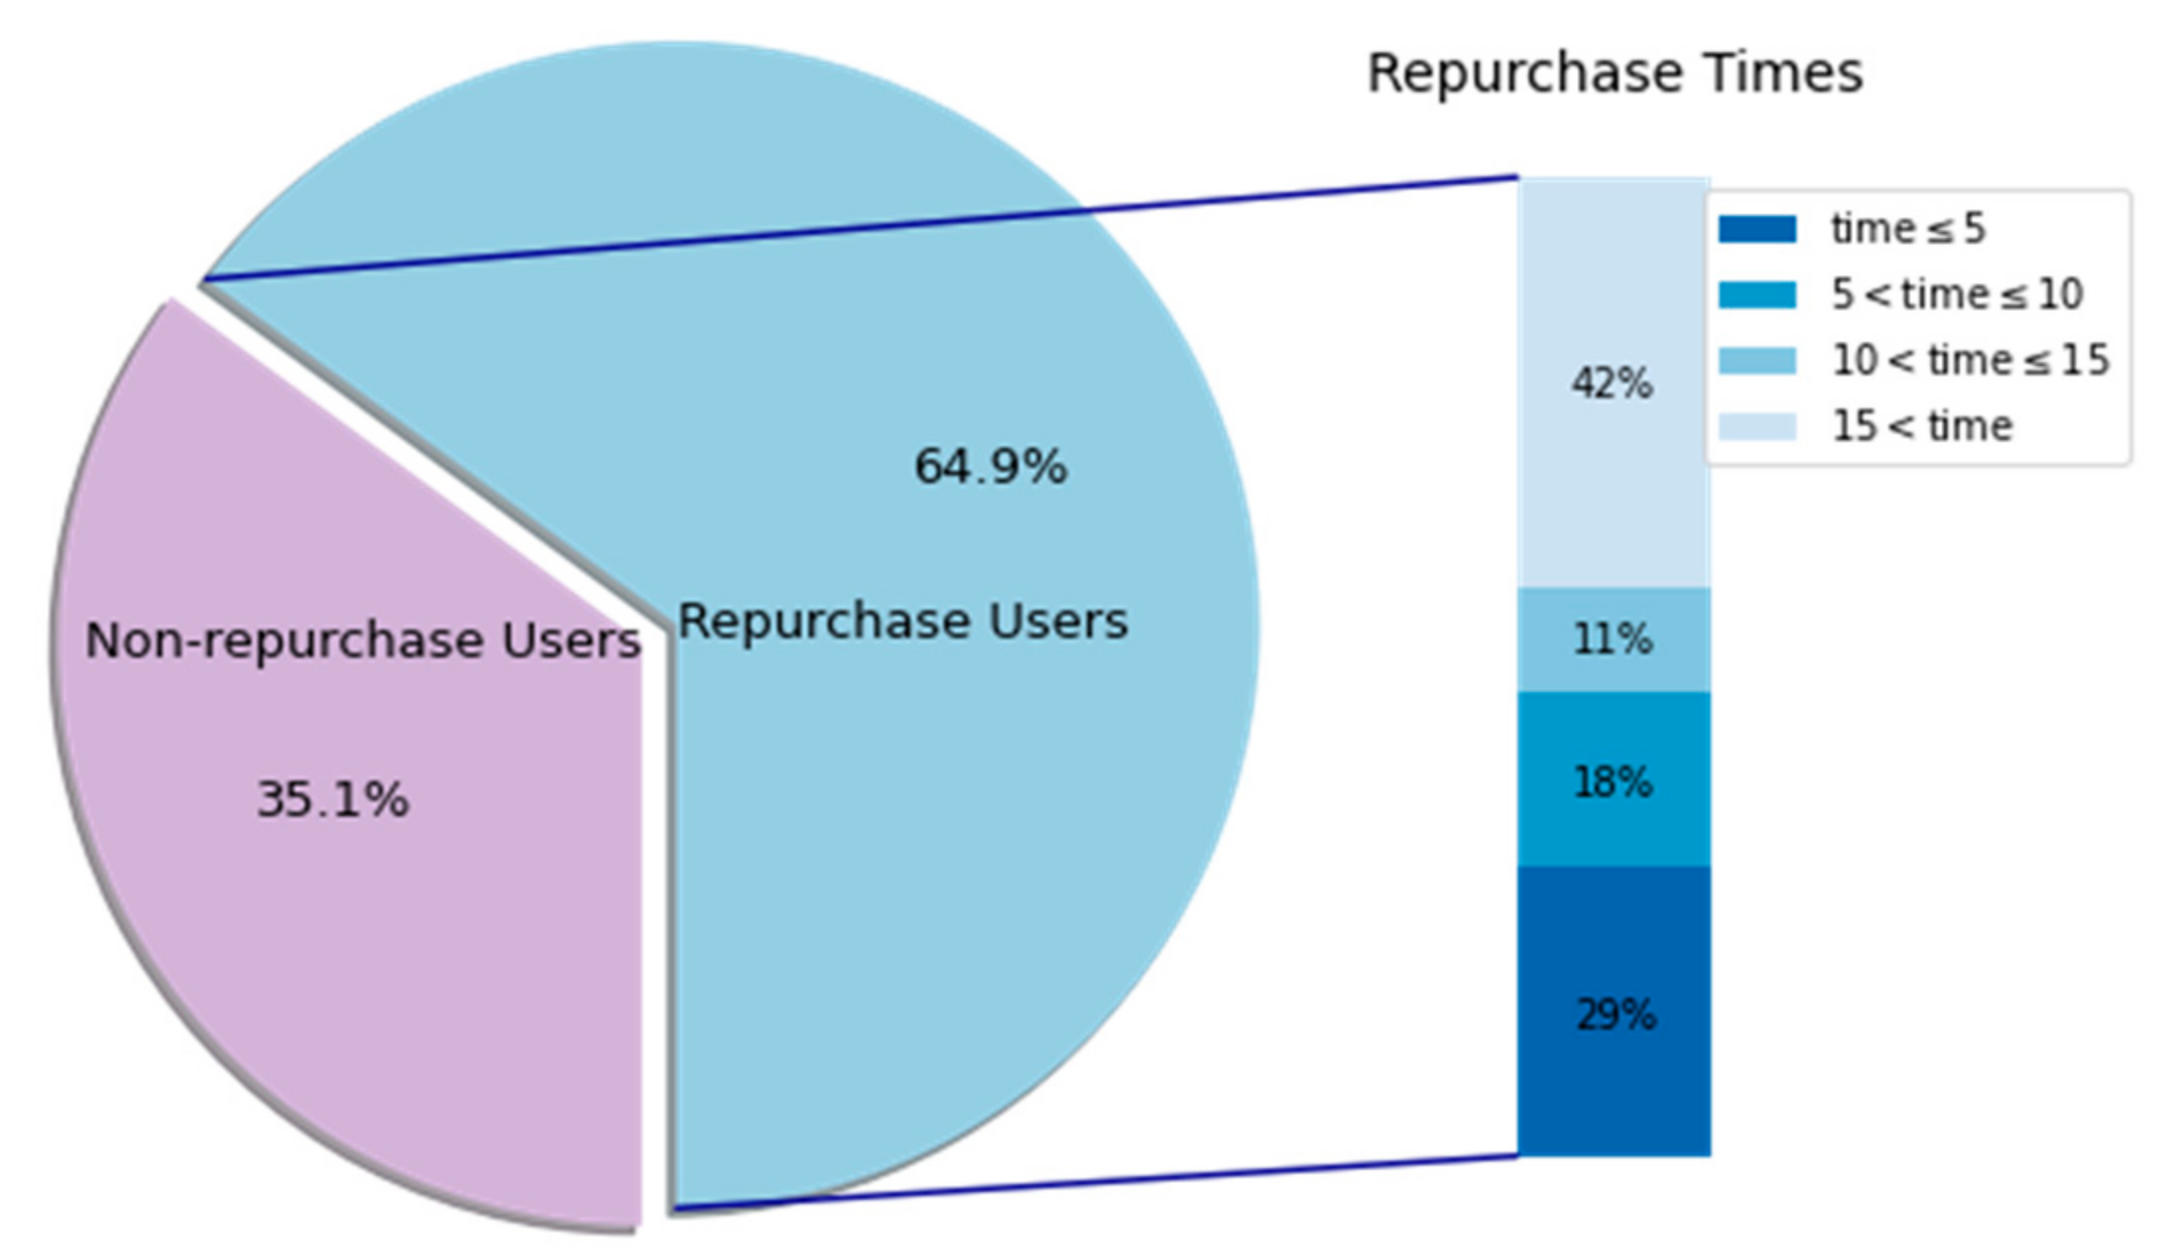
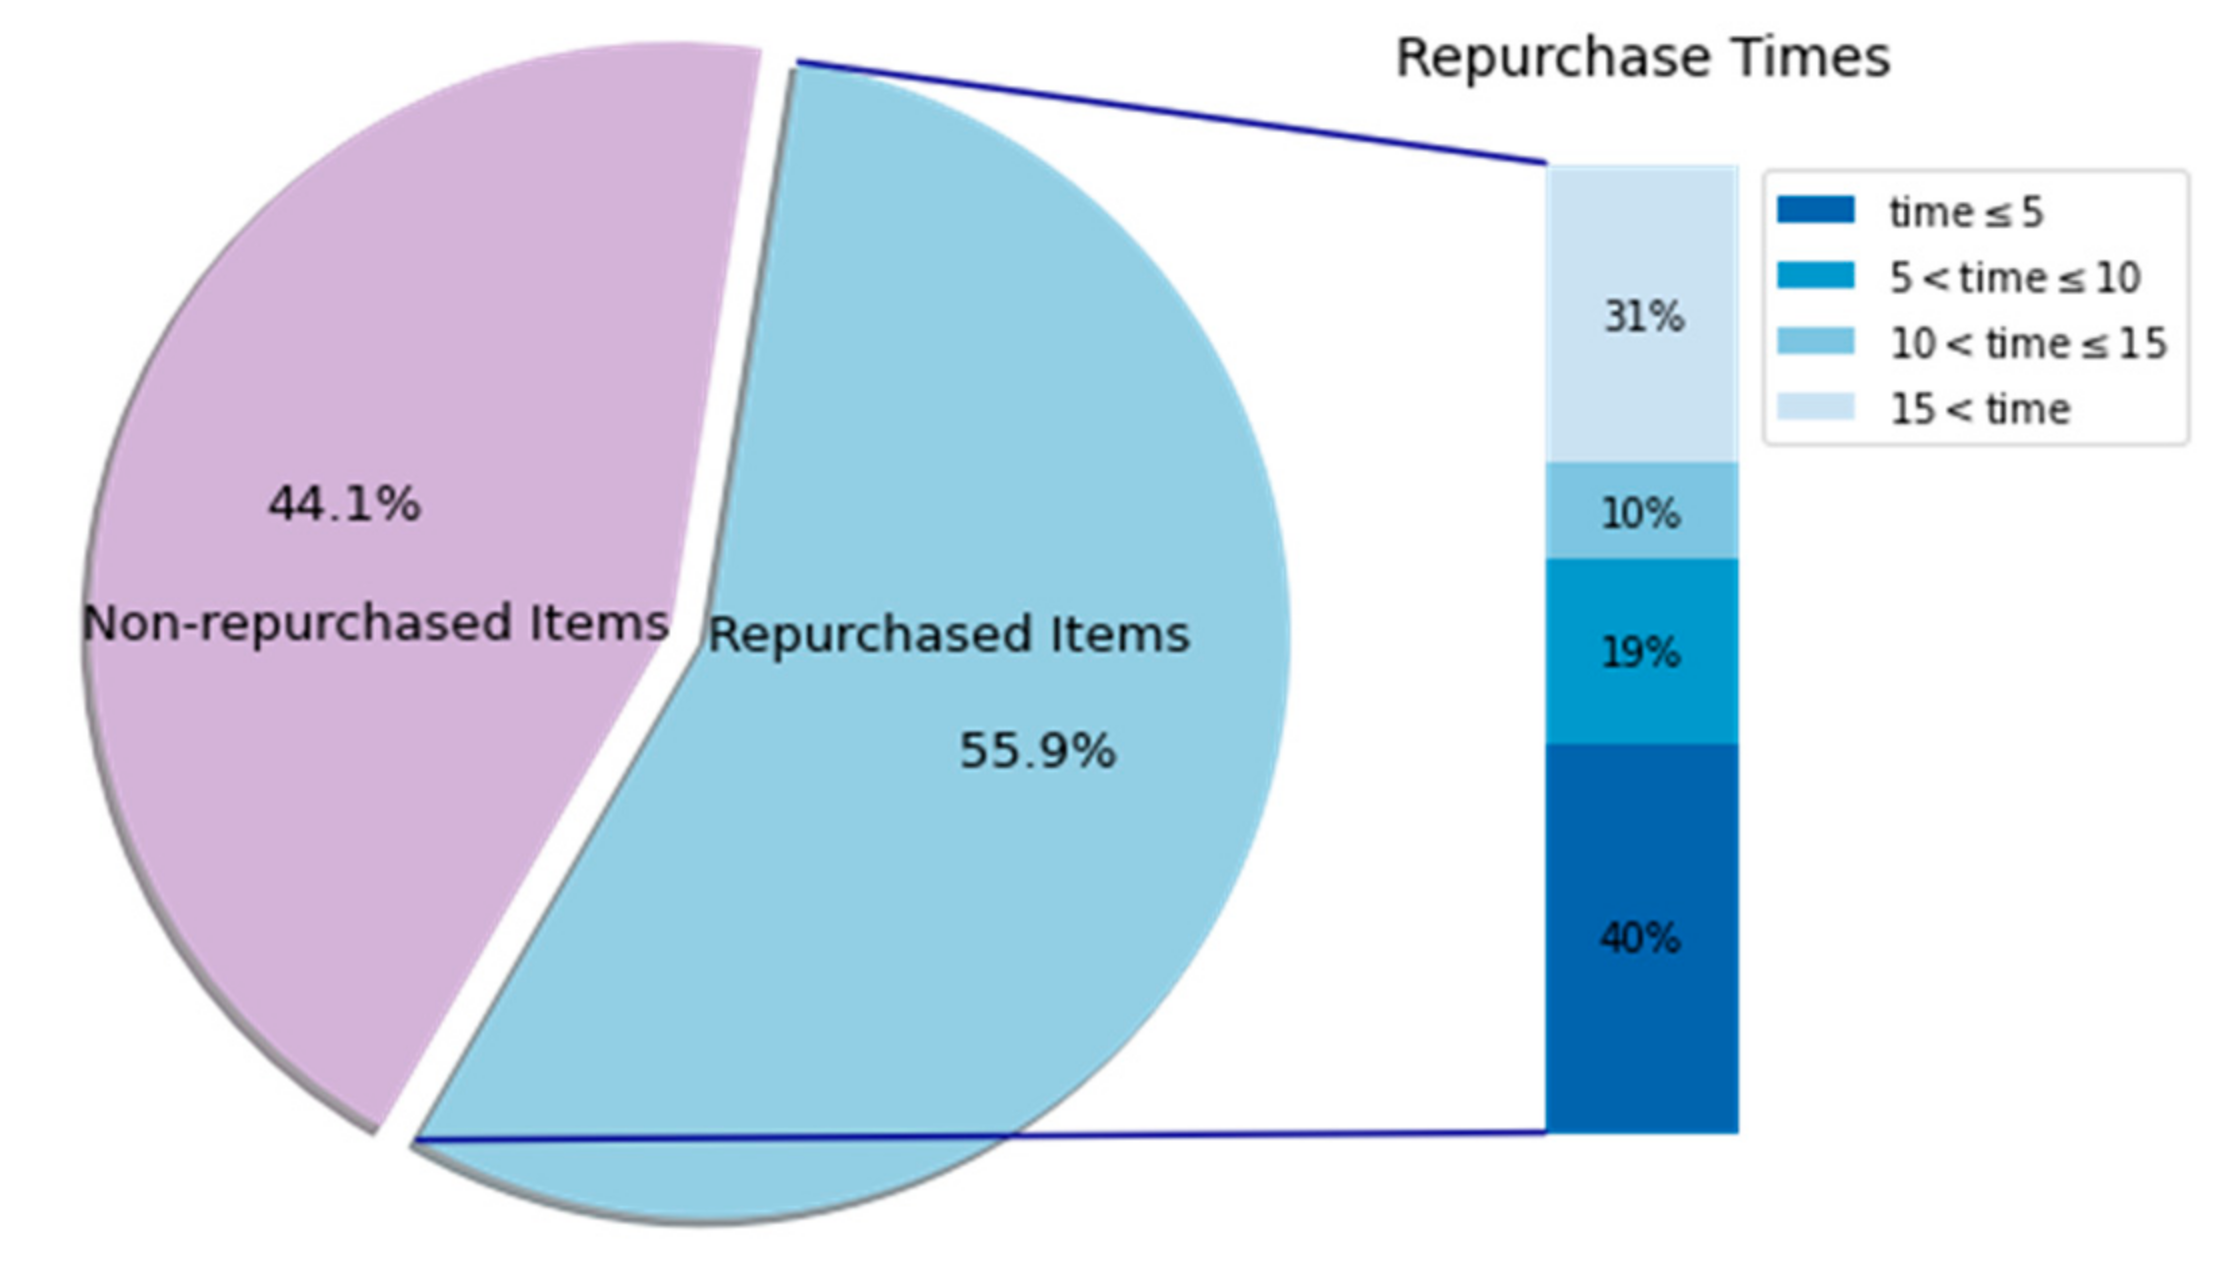
5.1. The Dataset
5.2. Experimental Setup
5.3. Evaluation Metrics
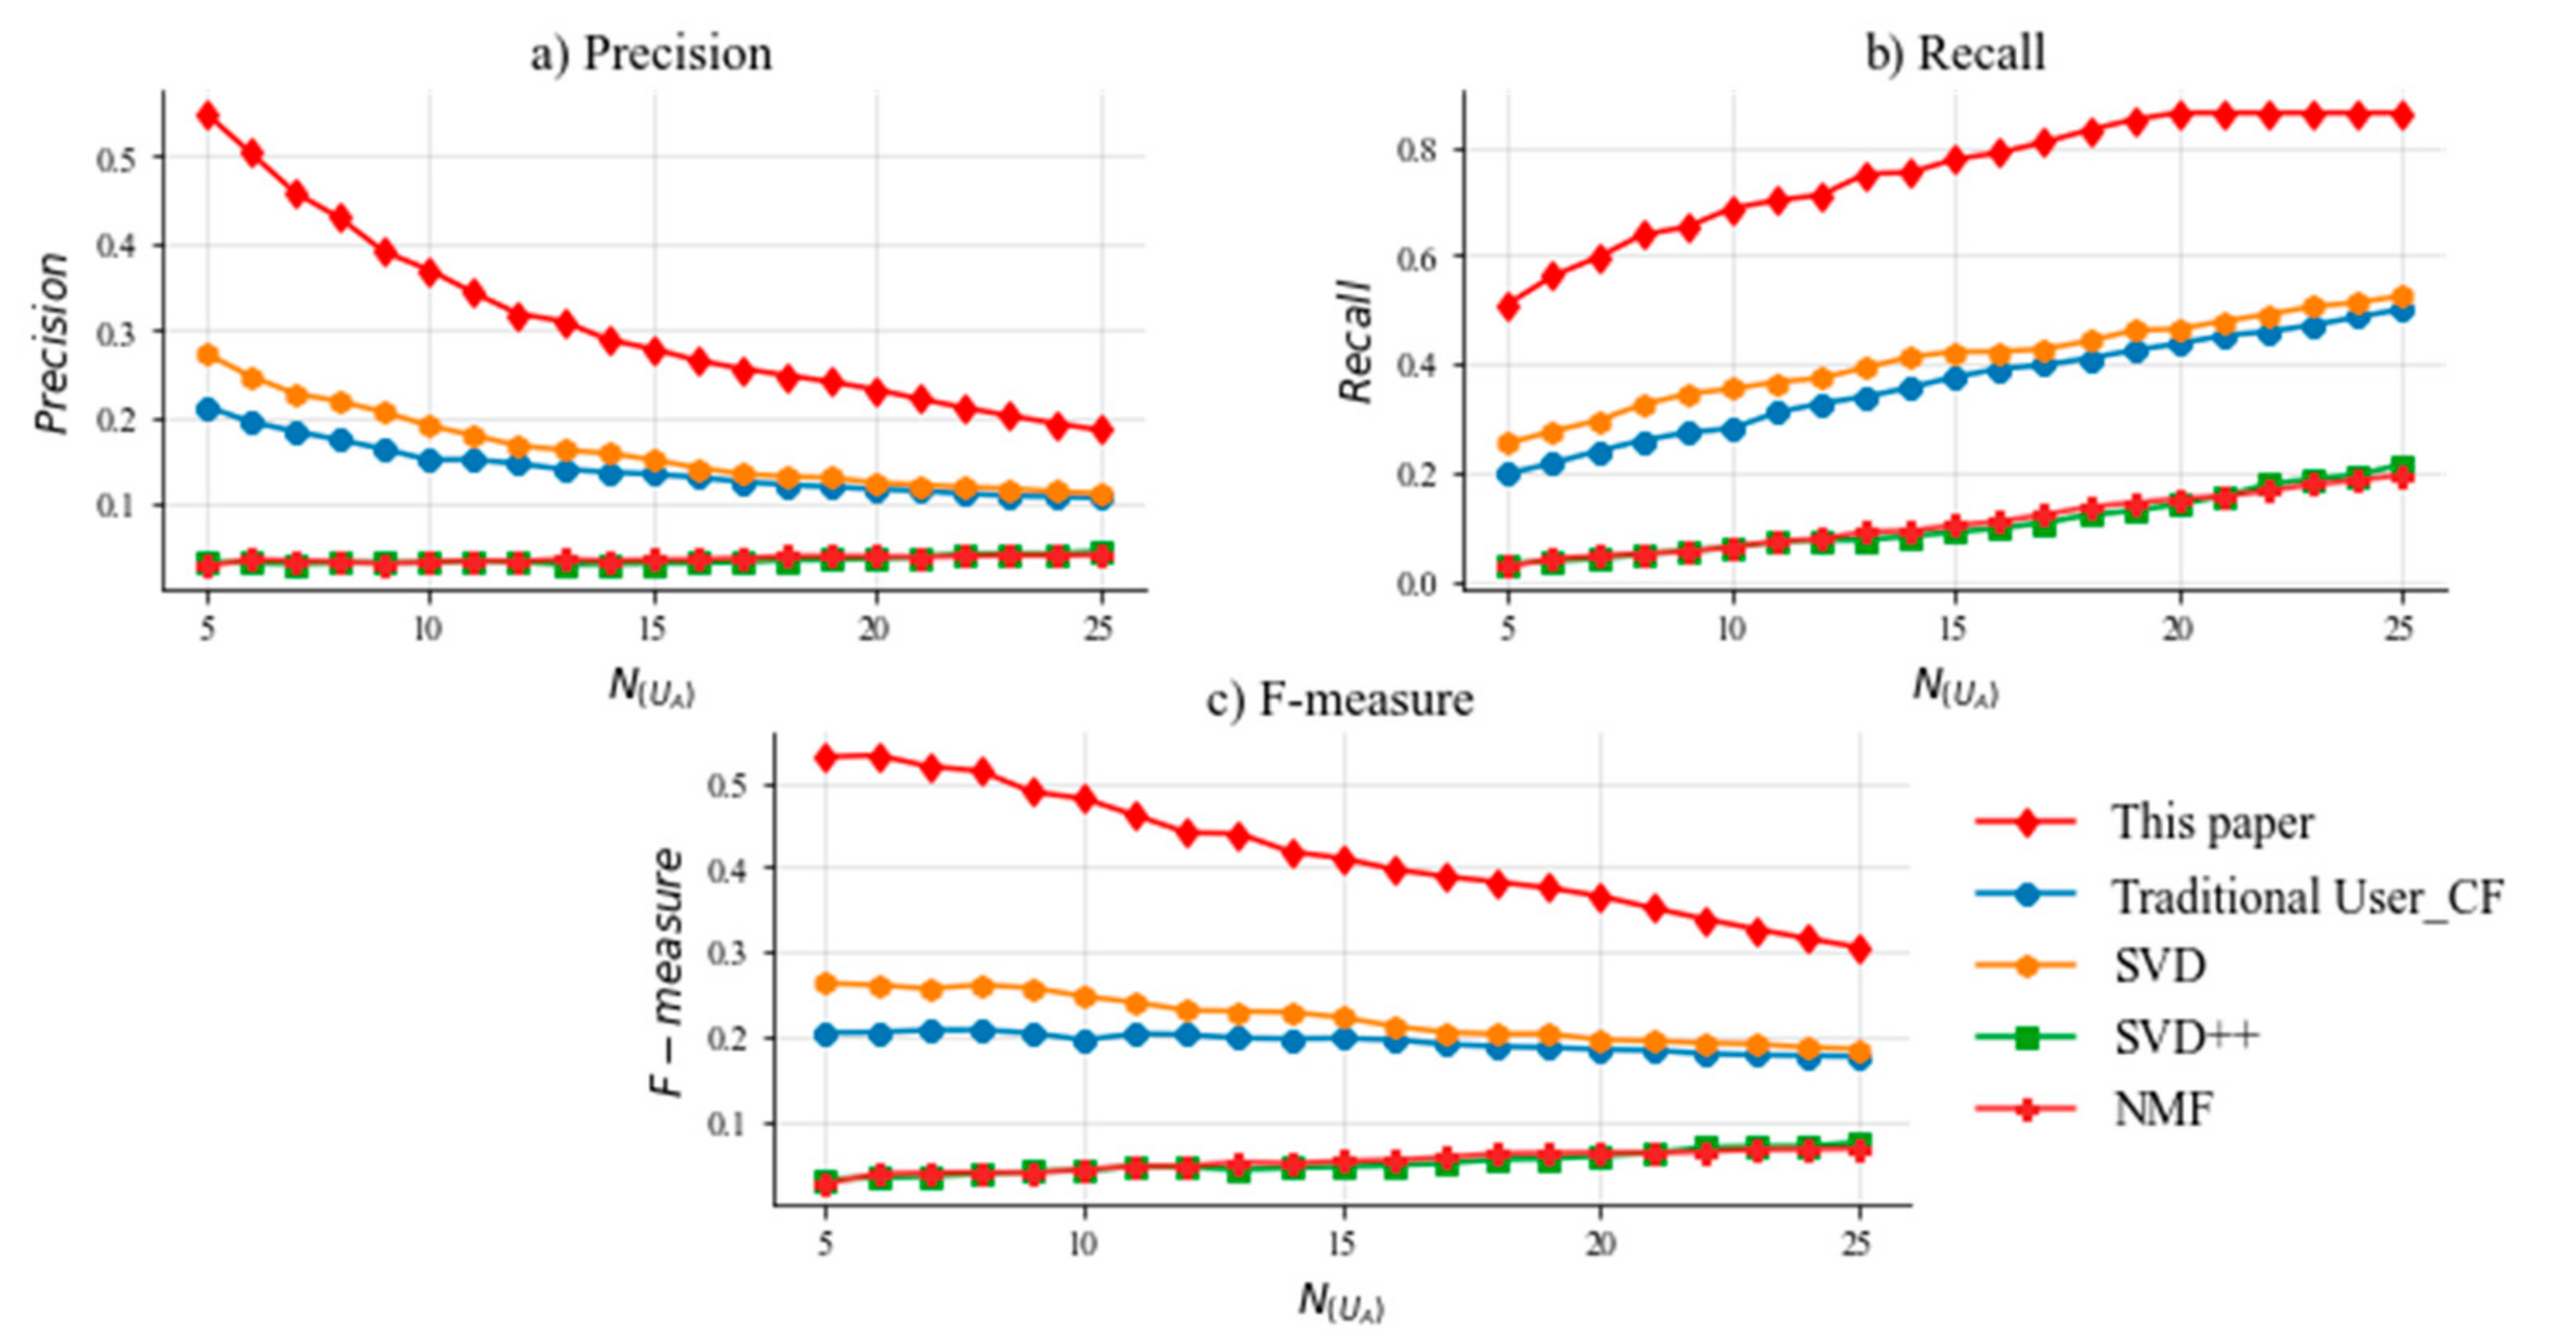
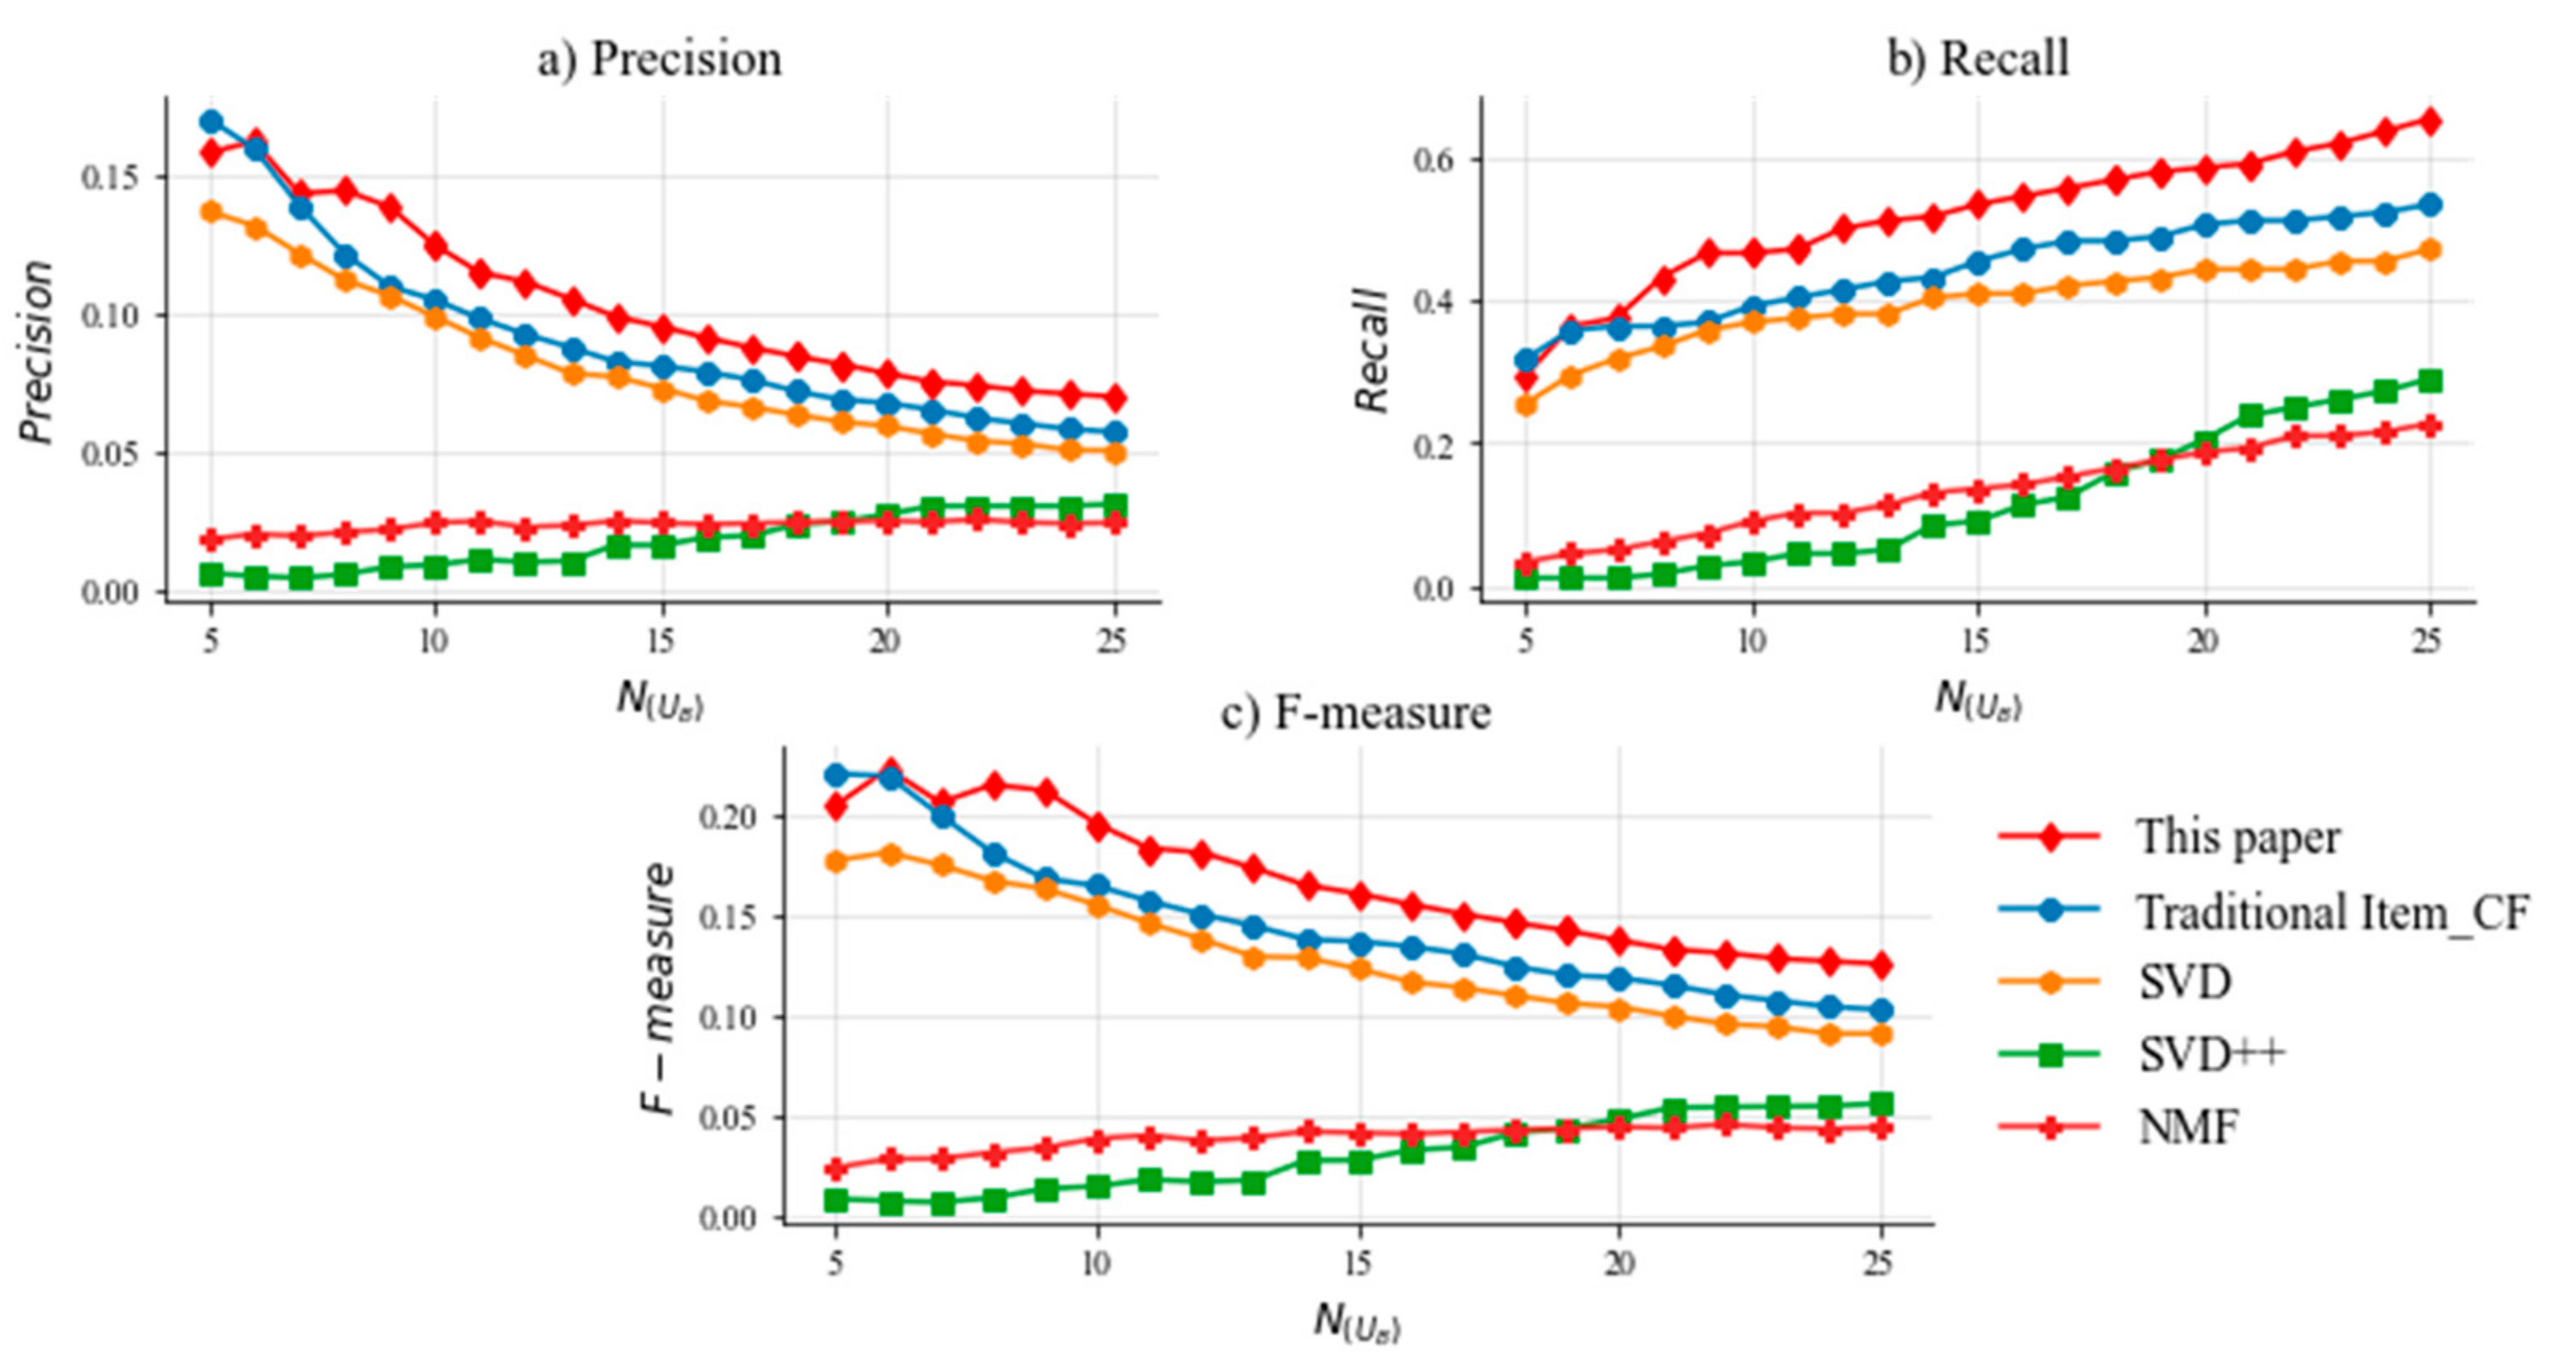
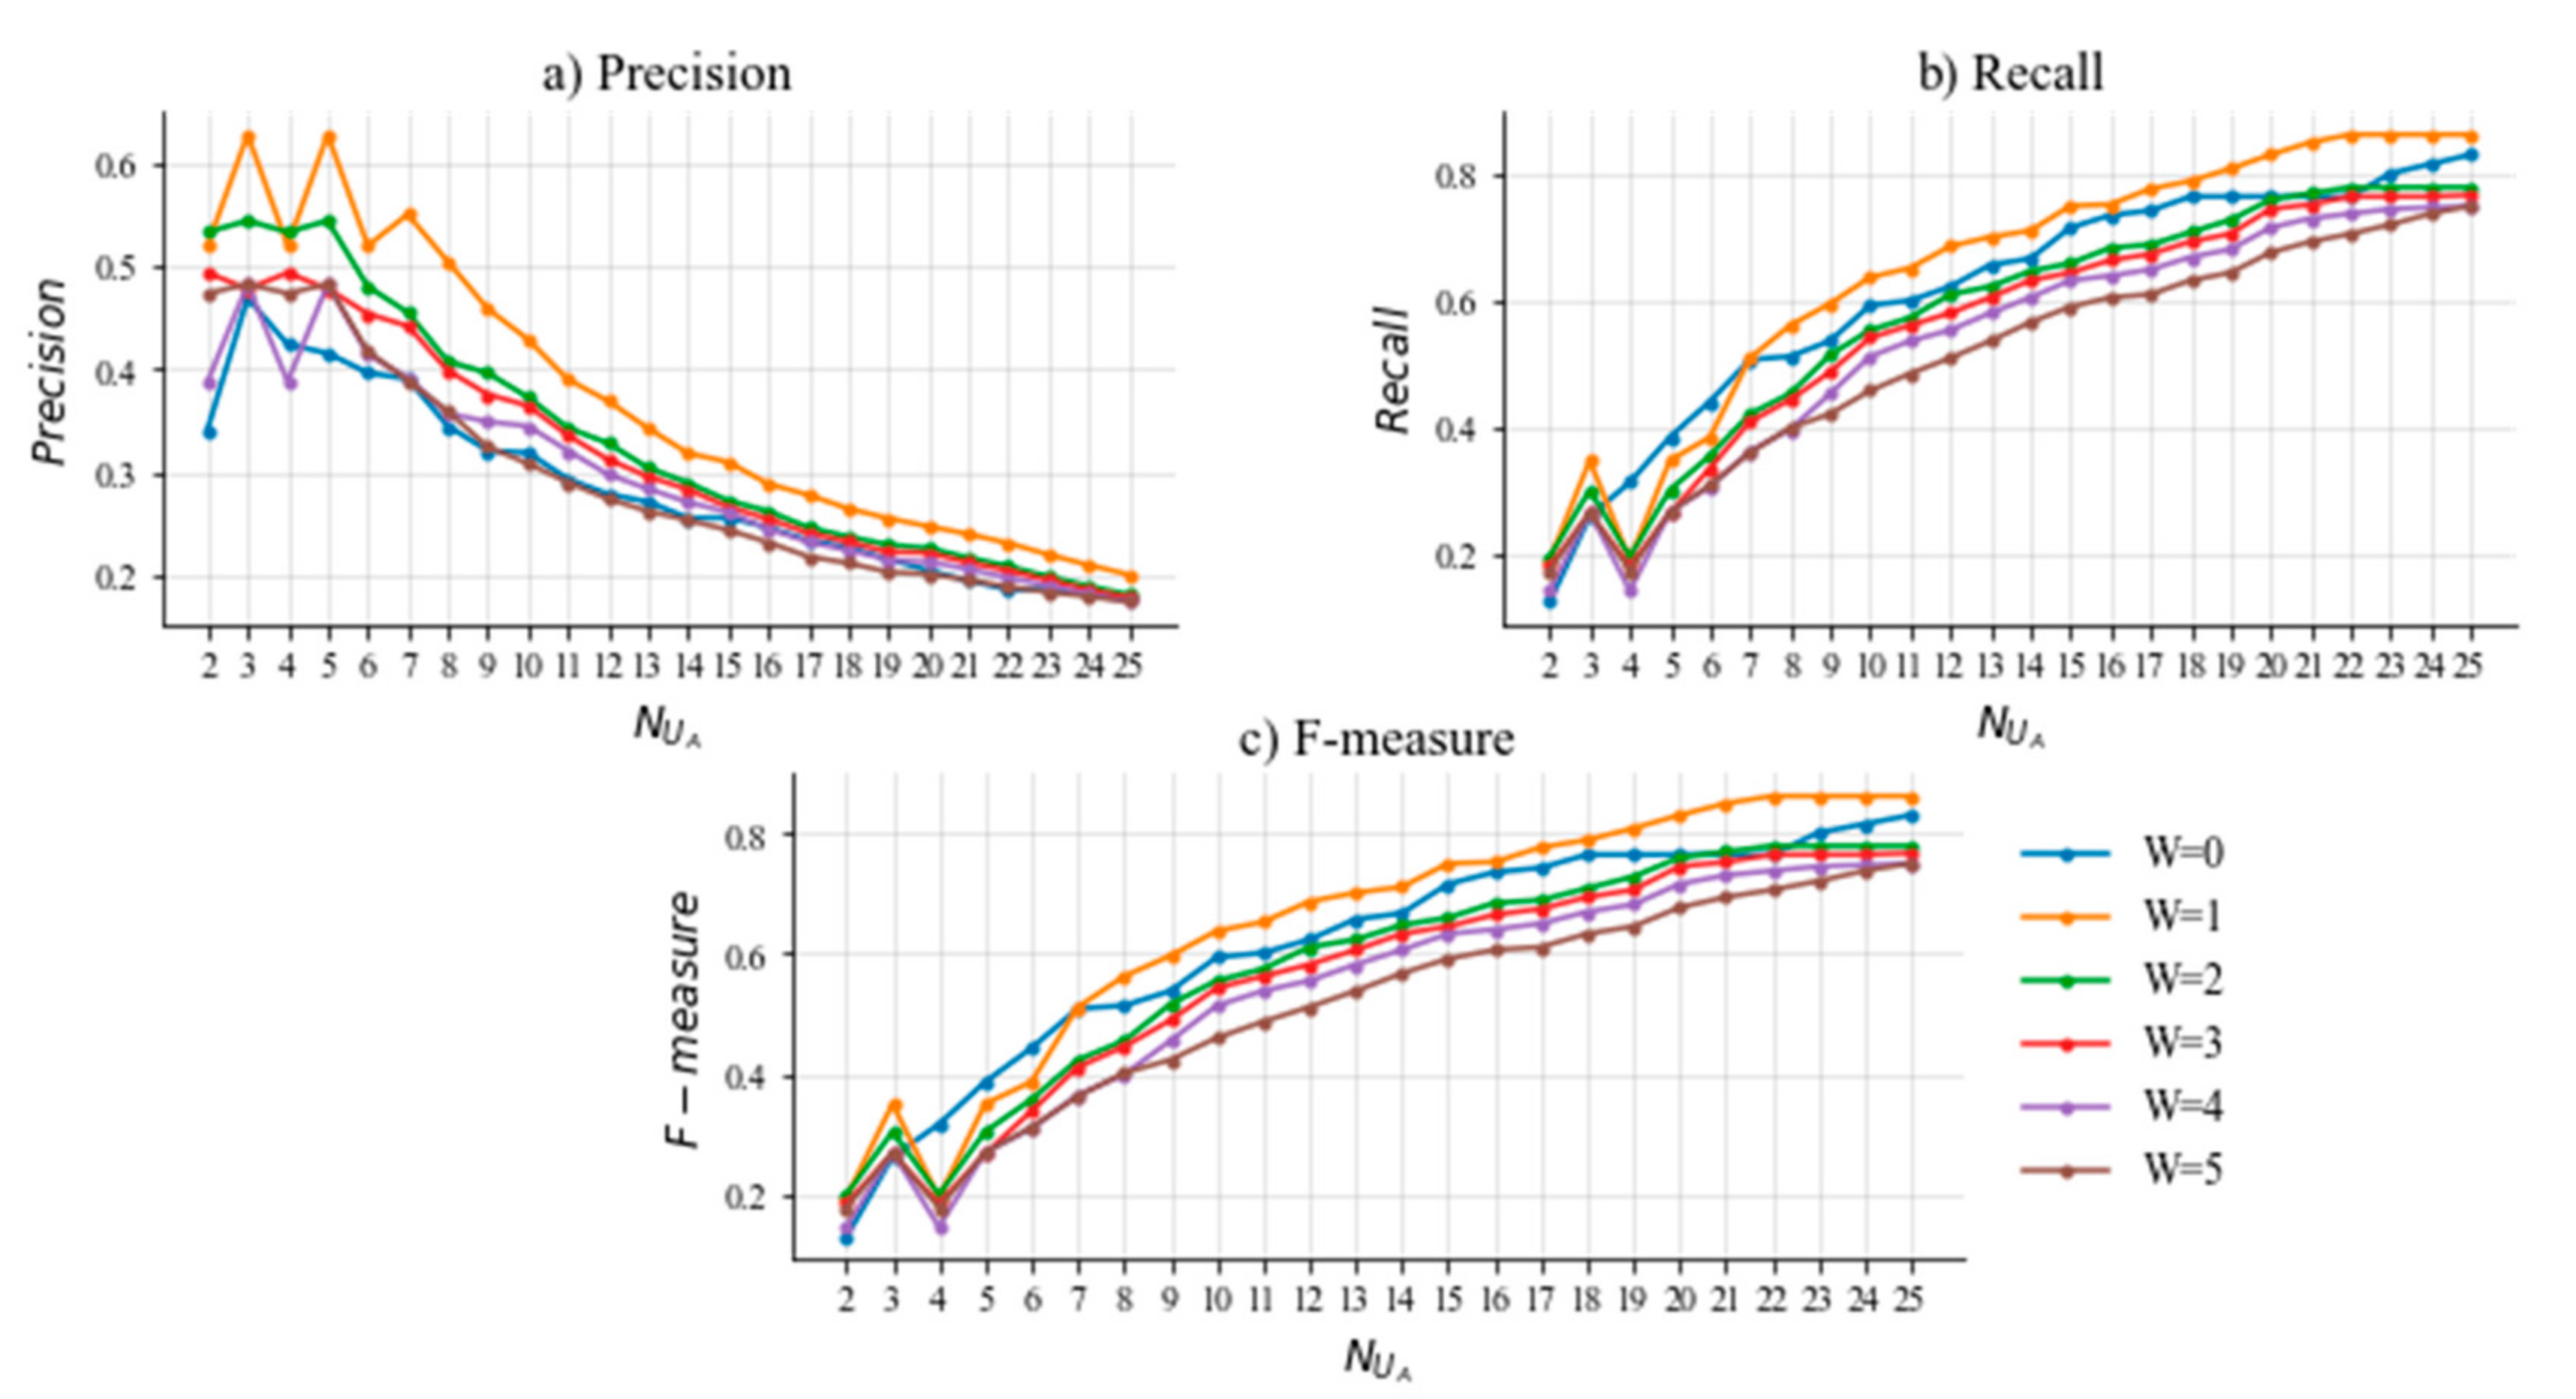
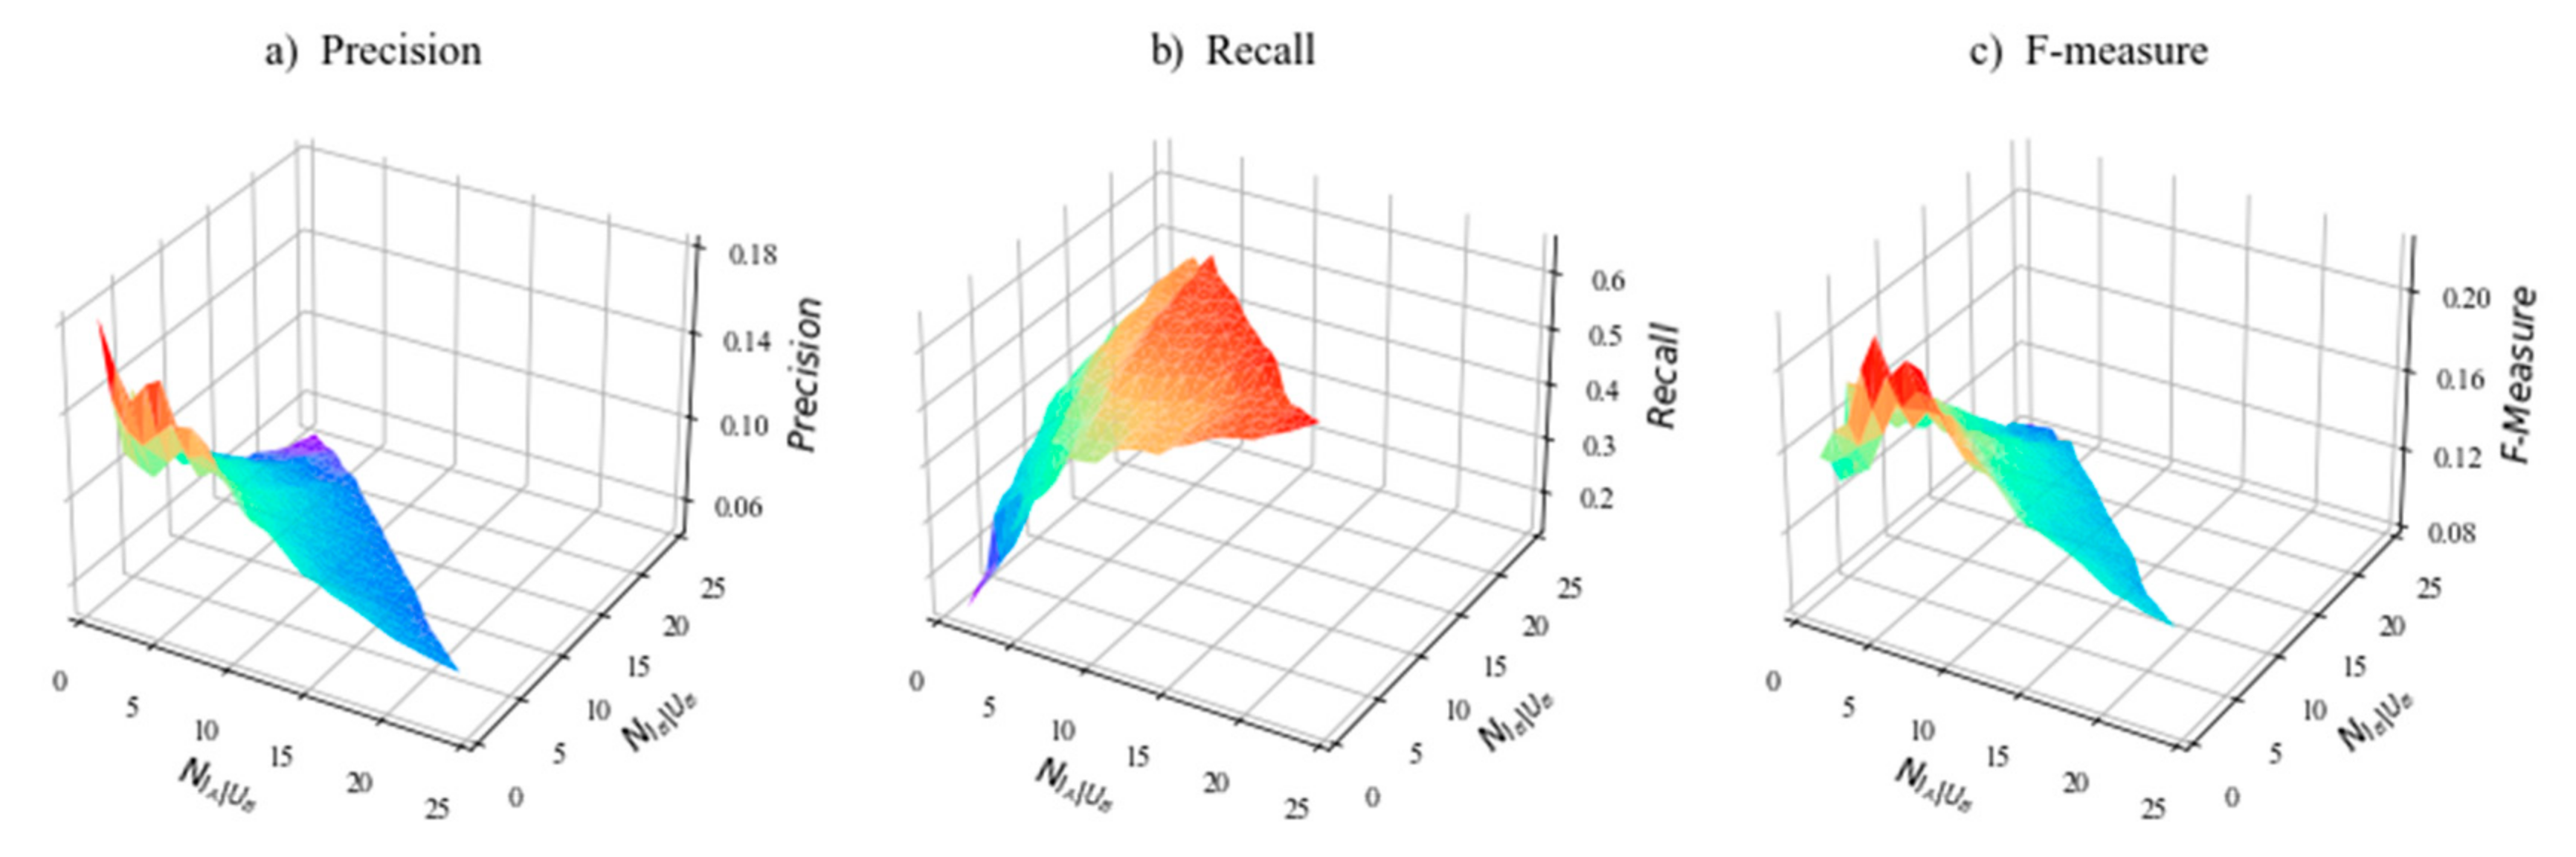
5.4. Experimental Results
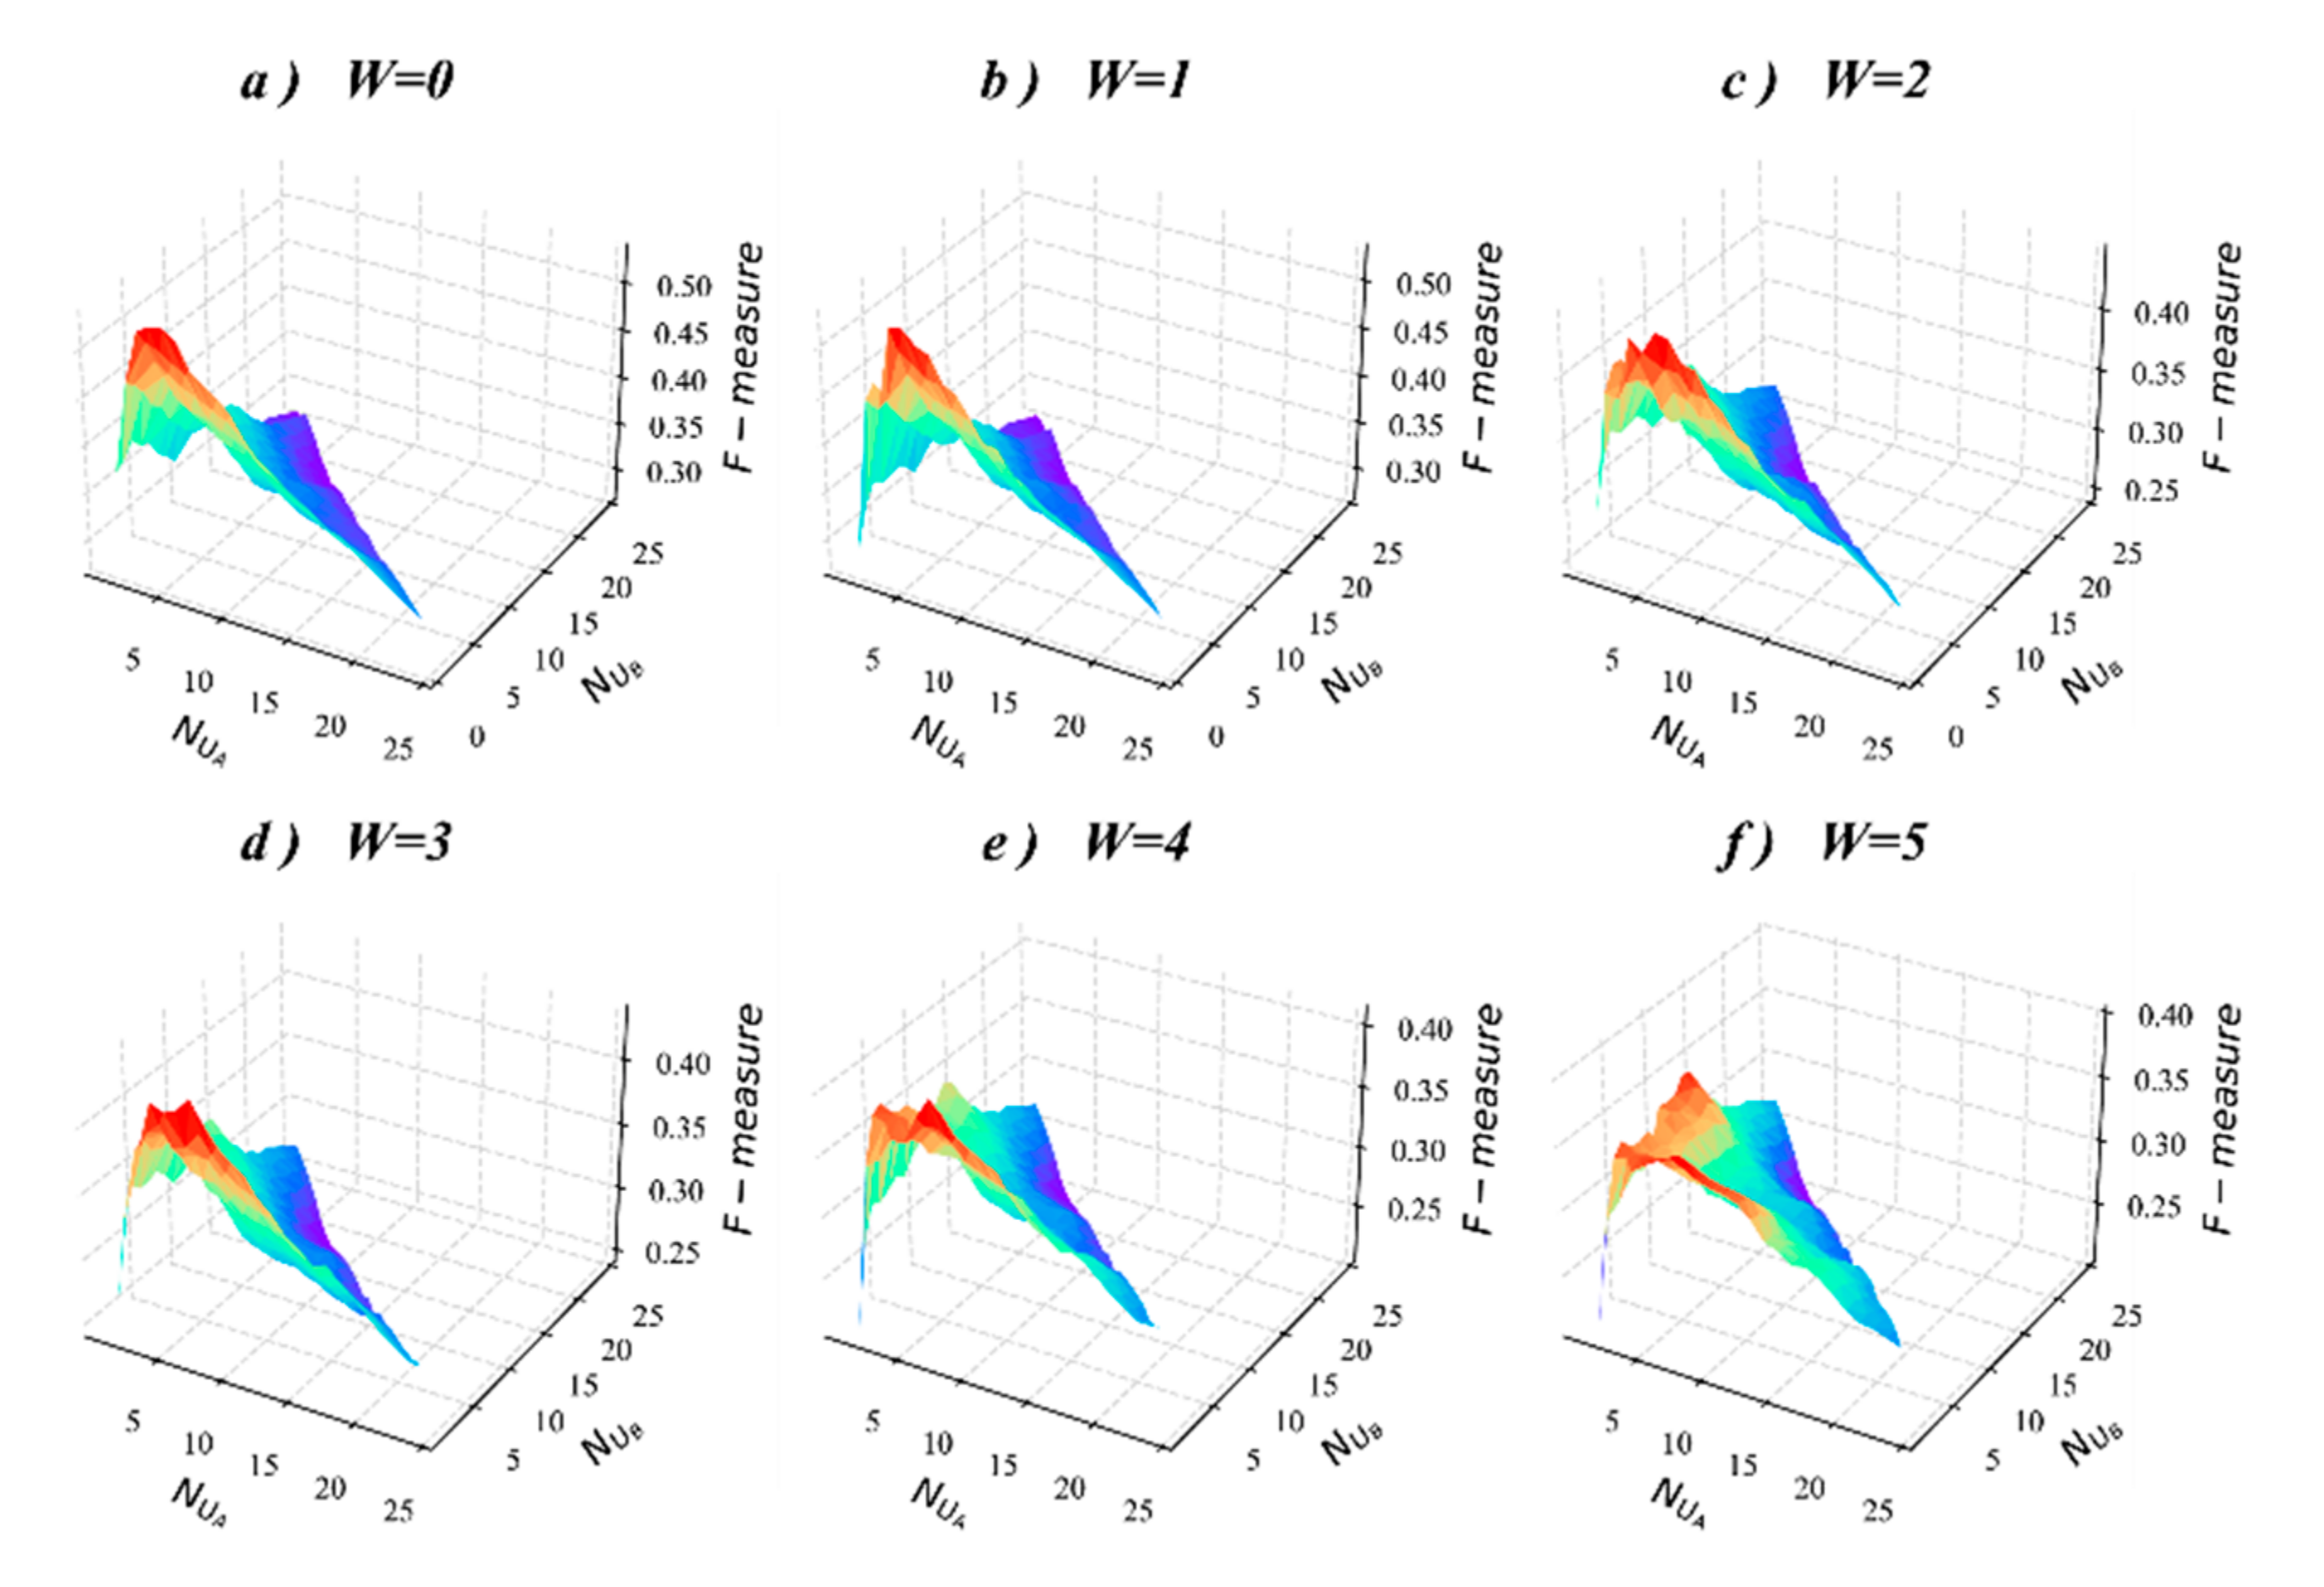
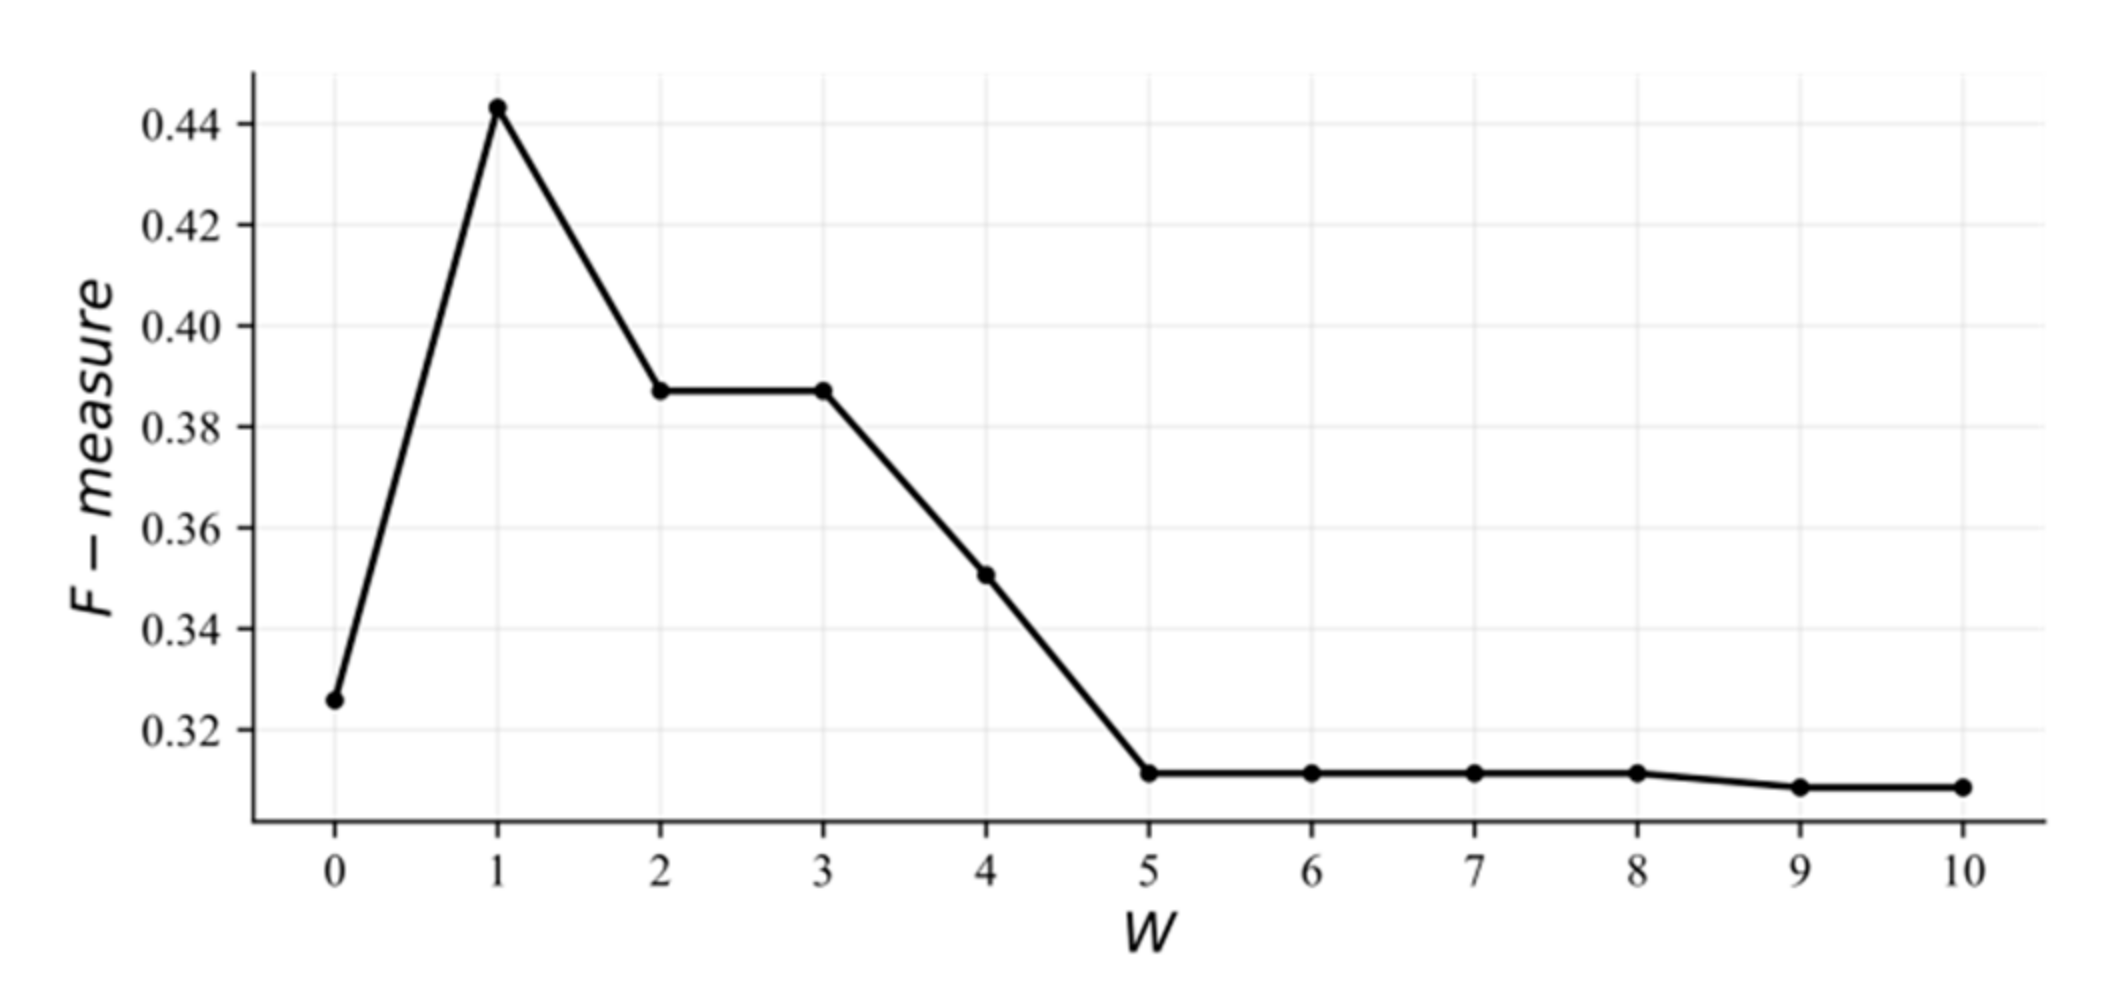
5.5. Sensitivity Analysis of Parameter
5.6. Discussion of Important Results
6. Concluding Remarks
Author Contributions
Funding
Institutional Review Board Statement
Informed Consent Statement
Data Availability Statement
Conflicts of Interest
References
- Zsolnai, L. Green business or community economy? Int. J. Soc. Econ. 2002, 29, 652–662. [Google Scholar] [CrossRef] [Green Version]
- Lao, J.; Zhong, Y.; Tan, Z. Study of community E-commerce model based on intelligent building. J. Intell. 2007, 26, 39–41. [Google Scholar]
- Kim, H.K.; Oh, H.Y.; Gu, J.C.; Kim, J.K. Commenders: A recommendation procedure for online book communities. Electron. Commer. Res. Appl. 2011, 10, 501–509. [Google Scholar] [CrossRef]
- Zhang, W.; Du, Y.; Yang, Y.; Yoshida, T. DeRec: A data-driven approach to accurate recommendation with deep learning and weighted loss function. Electron. Commer. Res. Appl. 2018, 31, 12–23. [Google Scholar] [CrossRef]
- Iwanaga, J.; Nishimura, N.; Sukegawa, N.; Takano, Y. Improving collaborative filtering recommendations by estimating user preferences from clickstream data. Electron. Commer. Res. Appl. 2019, 37, 100877. [Google Scholar] [CrossRef]
- Ghasemi, N.; Momtazi, S. Neural text similarity of user reviews for improving collaborative filtering recommender systems. Electron. Commer. Res. Appl. 2020, 45, 101019. [Google Scholar] [CrossRef]
- Riyahi, M.; Sohrabi, M.K. Providing effective recommendations in discussion groups using a new hybrid recommender system based on implicit ratings and semantic similarity. Electron. Commer. Res. Appl. 2020, 40, 100938. [Google Scholar] [CrossRef]
- Verstrepen, K.; Bhaduriy, K.; Cule, B.; Goethals, B. Collaborative filtering for binary, positive-only data. In Proceedings of the 23rd ACM SIGKDD Conference, Halifax, NS, Canada, 13–17 August 2017; pp. 1–21. [Google Scholar]
- Chen, J.; Wei, L.; Zhang, L. Dynamic evolutionary clustering approach based on time weight and latent attributes for collaborative filtering recommendation. Chaos Solitons Fractals 2018, 114, 8–18. [Google Scholar] [CrossRef]
- Verbert, K.; Manouselis, N.; Ochoa, X.; Wolpers, M.; Drachsler, H.; Bosnic, I.; Duval, E. Context-aware recommender sys-tems for learning: A survey and future challenges. IEEE Trans. Learn. Technol. 2012, 5, 318–335. [Google Scholar] [CrossRef]
- Mezni, H.; Benslimane, D.; Bellatreche, L. Context-aware service recommendation based on knowledge graph em-bedding. IEEE Trans. Knowl. Data Eng. 2021, 99, 1–14. [Google Scholar] [CrossRef]
- Nguyen, V.-D.; Sriboonchitta, S.; Huynh, V.-N. Using community preference for overcoming sparsity and cold-start problems in collaborative filtering system offering soft ratings. Electron. Commer. Res. Appl. 2017, 26, 101–108. [Google Scholar] [CrossRef]
- Resnick, P.; Iacovou, N.; Suchak, M.; Bergstrom, P. Group Lens: An open architecture for collaborative filtering of net news. In Proceedings of the ACM 1994Conference on Computer Supported Cooperative Work, Chapel Hill, NC, USA, 22–26 October 1994; pp. 175–186. [Google Scholar]
- Sarwar, B.; Karypis, G.; Konstan, J.; Riedl, J. Item-based collaborative filtering recommendation algorithms. In Proceedings of the 10th International Conference on World Wide Web, Hong Kong, China, 1–5 May 2001; pp. 285–295. [Google Scholar]
- Wang, C.; Zheng, Y.; Jiang, J.; Ren, K. Toward Privacy-Preserving Personalized Recommendation Services. Engineering 2018, 4, 21–28. [Google Scholar] [CrossRef]
- Brand, M. Fast online SVD revisions for lightweight recommender systems. In Proceedings of the Third SIAM International Conference on Data Mining, San Francisco, CA, USA, 1–3 May 2003; pp. 37–46. [Google Scholar]
- Koren, Y. Factorization meets the neighborhood: A multifaceted collaborative filtering model. In Proceedings of the 14th ACM SIGKDD International Conference on Knowledge Discovery and Data Mining, Las Vegas, NV, USA, 24–27 August 2008; pp. 426–434. [Google Scholar]
- Kim, J.; Park, H. Toward Faster Nonnegative Matrix Factorization: A New Algorithm and Comparisons. In Proceedings of the 2008 Eighth IEEE International Conference on Data Mining, Pisa, Italy, 15–19 December 2008; pp. 353–362. [Google Scholar] [CrossRef] [Green Version]
- Gorgoglione, M.; Panniello, U.; Tuzhilin, A. The effect of context-aware recommendations on customer purchasing behavior and trust. In Proceedings of the Fifth ACM Conference on Recommender Systems, Chicago, IL, USA, 23–27 October 2011; pp. 85–92. [Google Scholar] [CrossRef]
- Zimdars, A.; Chickering, D.M.; Meek, C. Using temporal data for making recommendations. In Proceedings of the Seventeenth Conference on Uncertainty in Artificial Intelligence, Seattle, WA, USA, 2–5 August 2001; pp. 580–588. [Google Scholar]
- Campos, P.G.; Díez, F.; Bellogín, A. Temporal rating habits: A valuable tool for rating discrimination. In Proceedings of the 2nd Challenge on Context-Aware Movie Recommendation, Chicago, IL, USA, 27 October 2011; pp. 29–35. [Google Scholar]
- Liang, X.; Yang, Q. Time-dependent models in collaborative filtering based recommender system. In Proceedings of the 2009 IEEE/WIC/ACM International Joint Conference on Web Intelligence and Intelligent Agent Technology, Milano, Italy, 15–18 September 2009; pp. 450–457. [Google Scholar]
- Qin, G.; Du, X. An efficient collaborative filtering algorithm with user hierarchy. Comput. Sci. 2004, 10, 138–140. [Google Scholar]
- Xing, C.; Gao, F.; Zhan, S.; Zhou, L. A collaborative filtering recommendation algorithm incorporated with user interest change. J. Comput. Res. Dev. 2007, 02, 296–301. [Google Scholar] [CrossRef]
- Zhang, Y.; Liu, Y. A Collaborative Filtering Algorithm Based on Time Period Partition. In Proceedings of the Third International Symposium on Intelligent Information Technology & Security Informatics, Washington, DC, USA, 2–4 April 2010; pp. 777–780. [Google Scholar]
- Chen, J.; Lu, Y.; Shang, F.; Zhu, T. A novel recommendation scheme with multifactorial weighted matrix decomposition strategies via forgetting rule. Eng. Appl. Artif. Intell. 2021, 101, 104191. [Google Scholar] [CrossRef]
- Wu, F.; Yu, L.; Feng, M. A collaborative filtering algorithm based on time effect. Comput. Eng. Sci. 2017, 39, 2095–2101. [Google Scholar]
- Fader, P.S.; Hardie, B.G.; Lee, K.L. RFM and CLV: Using iso-value curves for customer base analysis. J. Mark. Res. 2005, 42, 415–430. [Google Scholar] [CrossRef]
- Hermann, E. Memory: A Contribution to Experimental Psychology. Ann. Neurosci. 2013, 20, 155–156. [Google Scholar]


| Index | Symbols | Definition Description |
|---|---|---|
| 1 | ||
| 2 | ||
| 3 | The activeness of user (in using community e-commerce) at time t | |
| 4 | after standardization | |
| 5 | at time t | |
| 6 | in using community e-commerce | |
| 7 | purchased an item in using community e-commerce | |
| 8 | purchased an item in using community e-commerce | |
| 9 | after standardization | |
| 10 | ||
| 11 | The total number of item purchased by user before time t | |
| 12 | The time interval between the last purchase of user and the earliest purchase of item | |
| 13 | The last time user purchasing item | |
| 14 | ||
| 15 | ||
| 16 |
| Item ID | Repurchase Cycle (Days) | Name |
| 2 | 14.07 | ZY |
| 38 | 24.65 | TB-Mo |
| 61 | 21.25 | TB-Th |
| 68 | 14.84 | ZQB-F |
| 69 | 20.37 | ZYB-We |
| 73 | 15.51 | HB-We |
| Item ID | Repurchase Cycle (Days) | Name |
| 2 | 10 | ZY |
| 38 | 16 | TB-Mo |
| 61 | 24 | TB-Th |
| 68 | 12 | ZQB-Fr |
| 69 | 14 | ZYB-We |
| 73 | 11 | HB-We |
Publisher’s Note: MDPI stays neutral with regard to jurisdictional claims in published maps and institutional affiliations. |
© 2022 by the authors. Licensee MDPI, Basel, Switzerland. This article is an open access article distributed under the terms and conditions of the Creative Commons Attribution (CC BY) license (https://creativecommons.org/licenses/by/4.0/).
Share and Cite
Wu, J.; Li, Y.; Shi, L.; Yang, L.; Niu, X.; Zhang, W. ReRec: A Divide-and-Conquer Approach to Recommendation Based on Repeat Purchase Behaviors of Users in Community E-Commerce. Mathematics 2022, 10, 208. https://doi.org/10.3390/math10020208
Wu J, Li Y, Shi L, Yang L, Niu X, Zhang W. ReRec: A Divide-and-Conquer Approach to Recommendation Based on Repeat Purchase Behaviors of Users in Community E-Commerce. Mathematics. 2022; 10(2):208. https://doi.org/10.3390/math10020208
Chicago/Turabian StyleWu, Jun, Yuanyuan Li, Li Shi, Liping Yang, Xiaxia Niu, and Wen Zhang. 2022. "ReRec: A Divide-and-Conquer Approach to Recommendation Based on Repeat Purchase Behaviors of Users in Community E-Commerce" Mathematics 10, no. 2: 208. https://doi.org/10.3390/math10020208
APA StyleWu, J., Li, Y., Shi, L., Yang, L., Niu, X., & Zhang, W. (2022). ReRec: A Divide-and-Conquer Approach to Recommendation Based on Repeat Purchase Behaviors of Users in Community E-Commerce. Mathematics, 10(2), 208. https://doi.org/10.3390/math10020208