
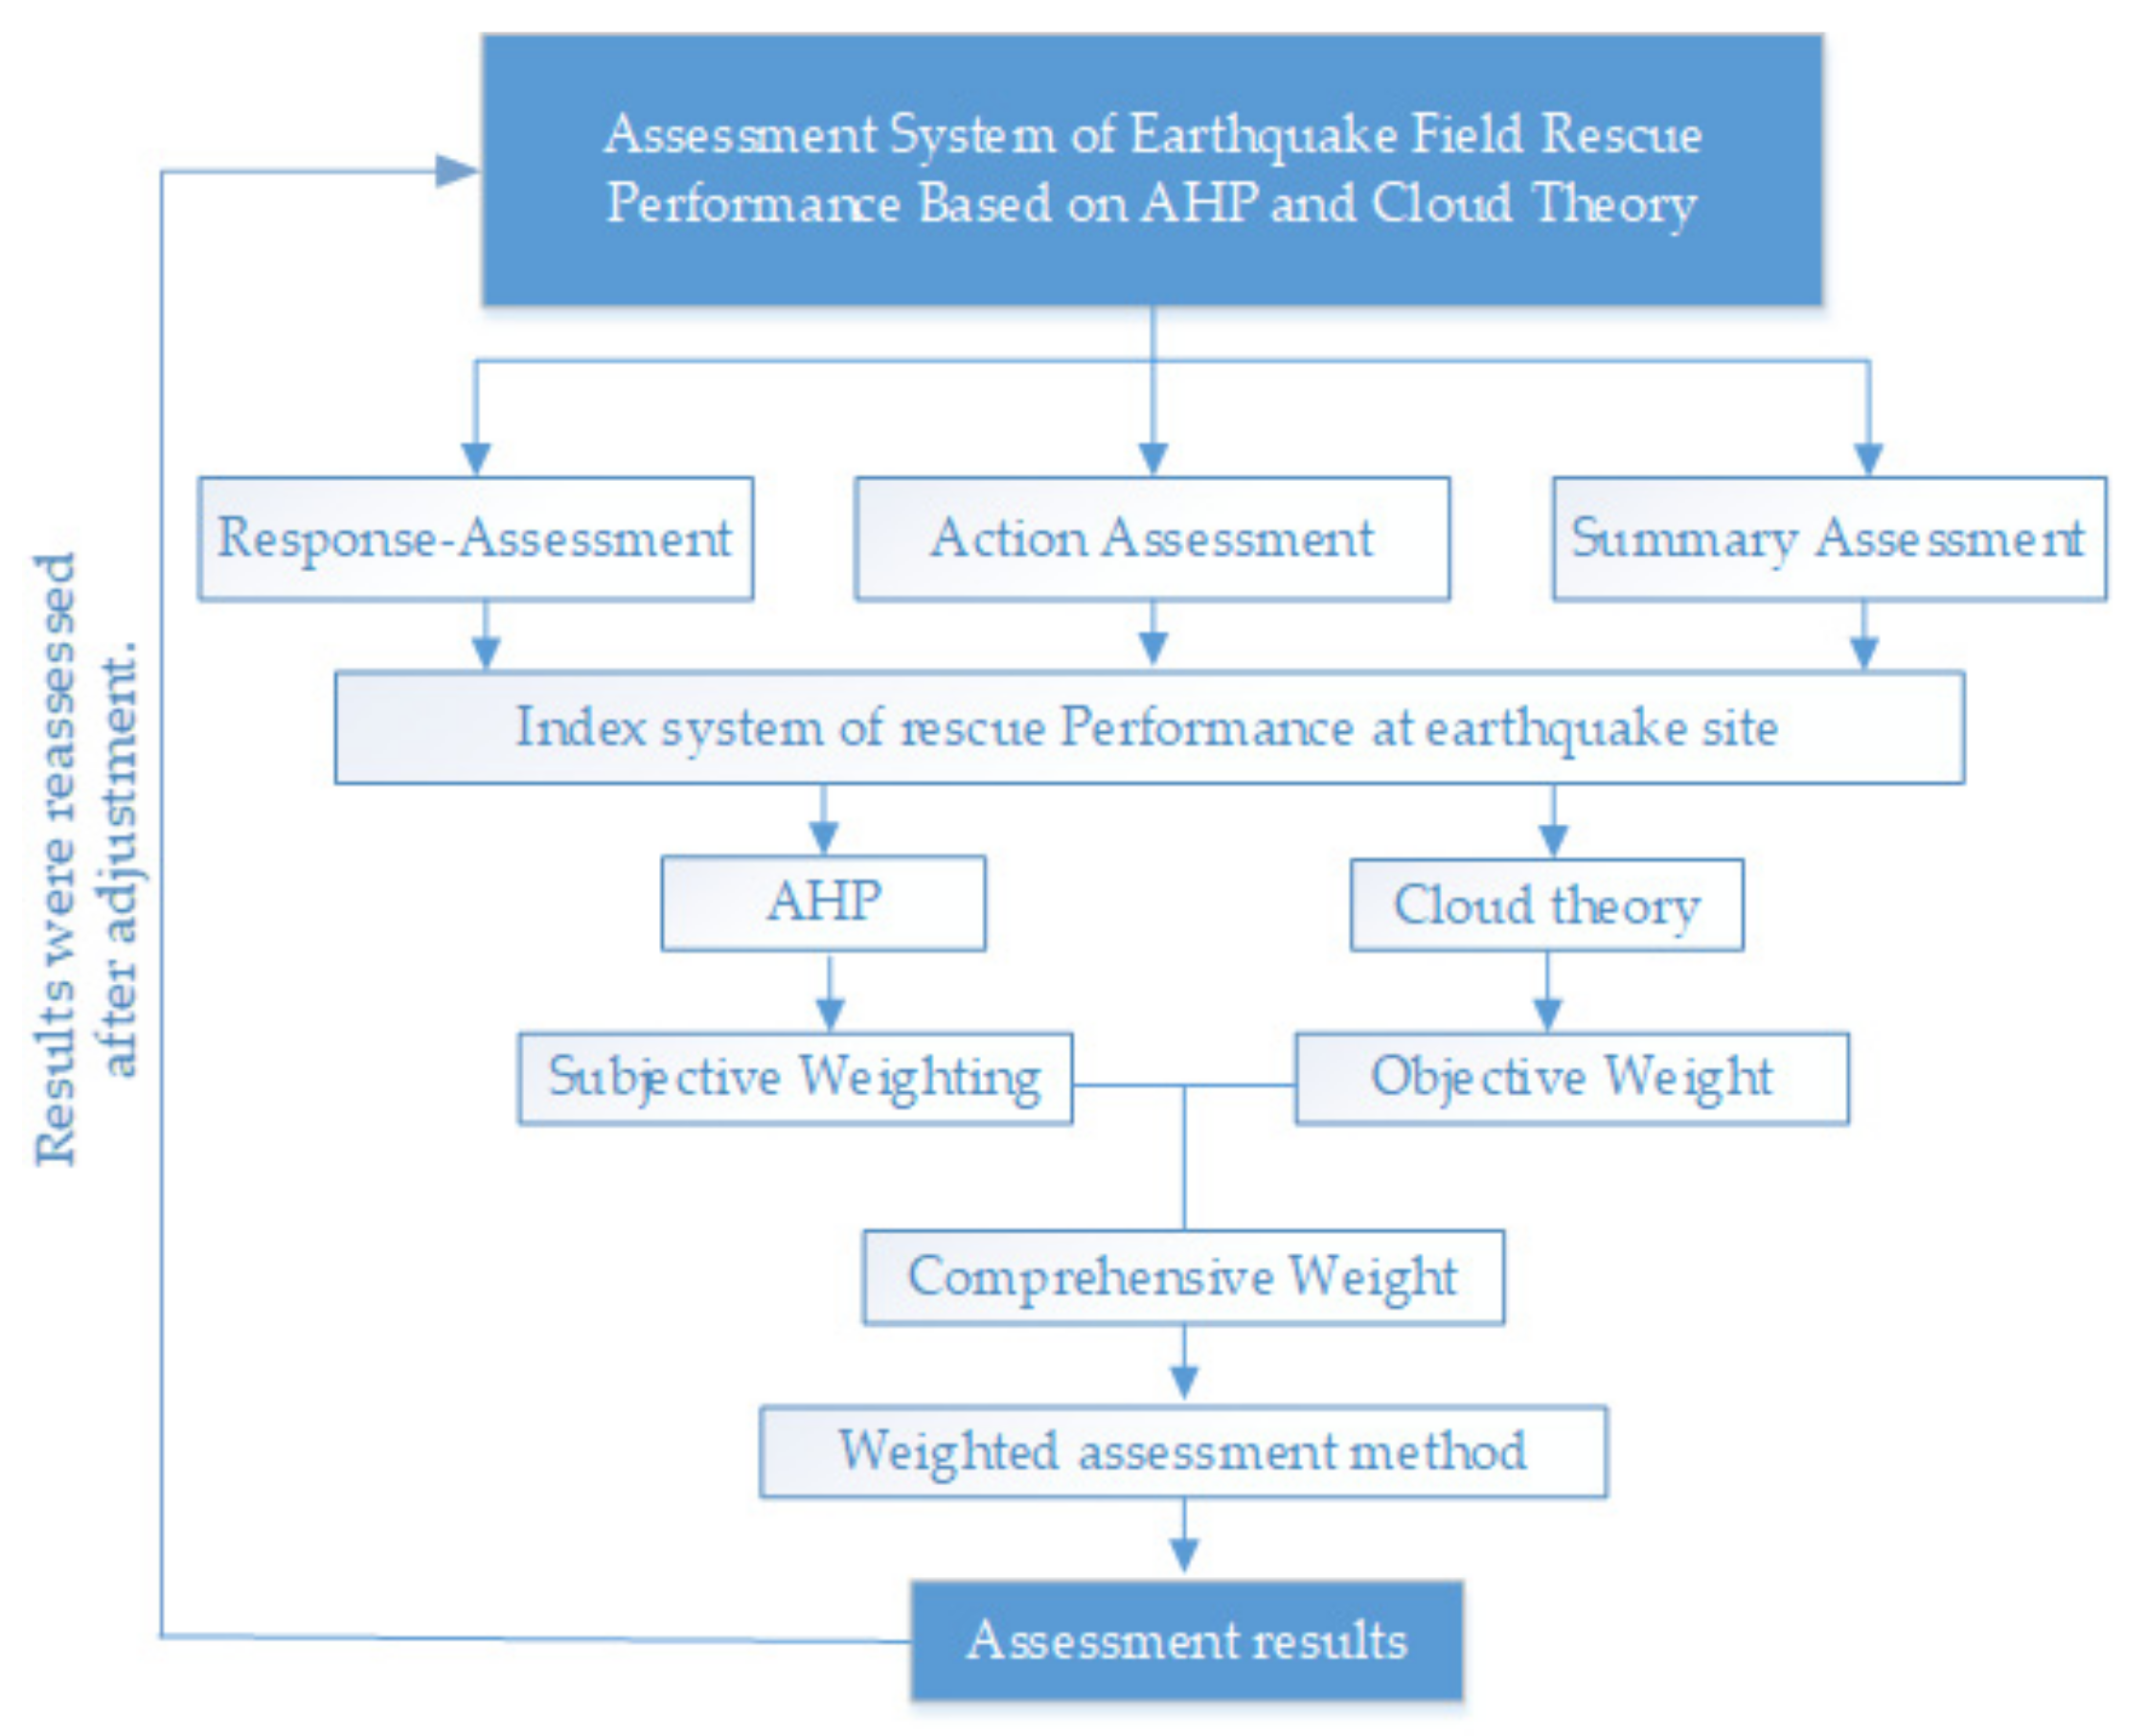
Research on Dynamic Assessment Method of Earthquake Scene Rescue Performance Based on AHP and Cloud Model

Abstract
:1. Introduction
2. Research Methodology
2.1. Analytic Hierarchy Process
- 1.
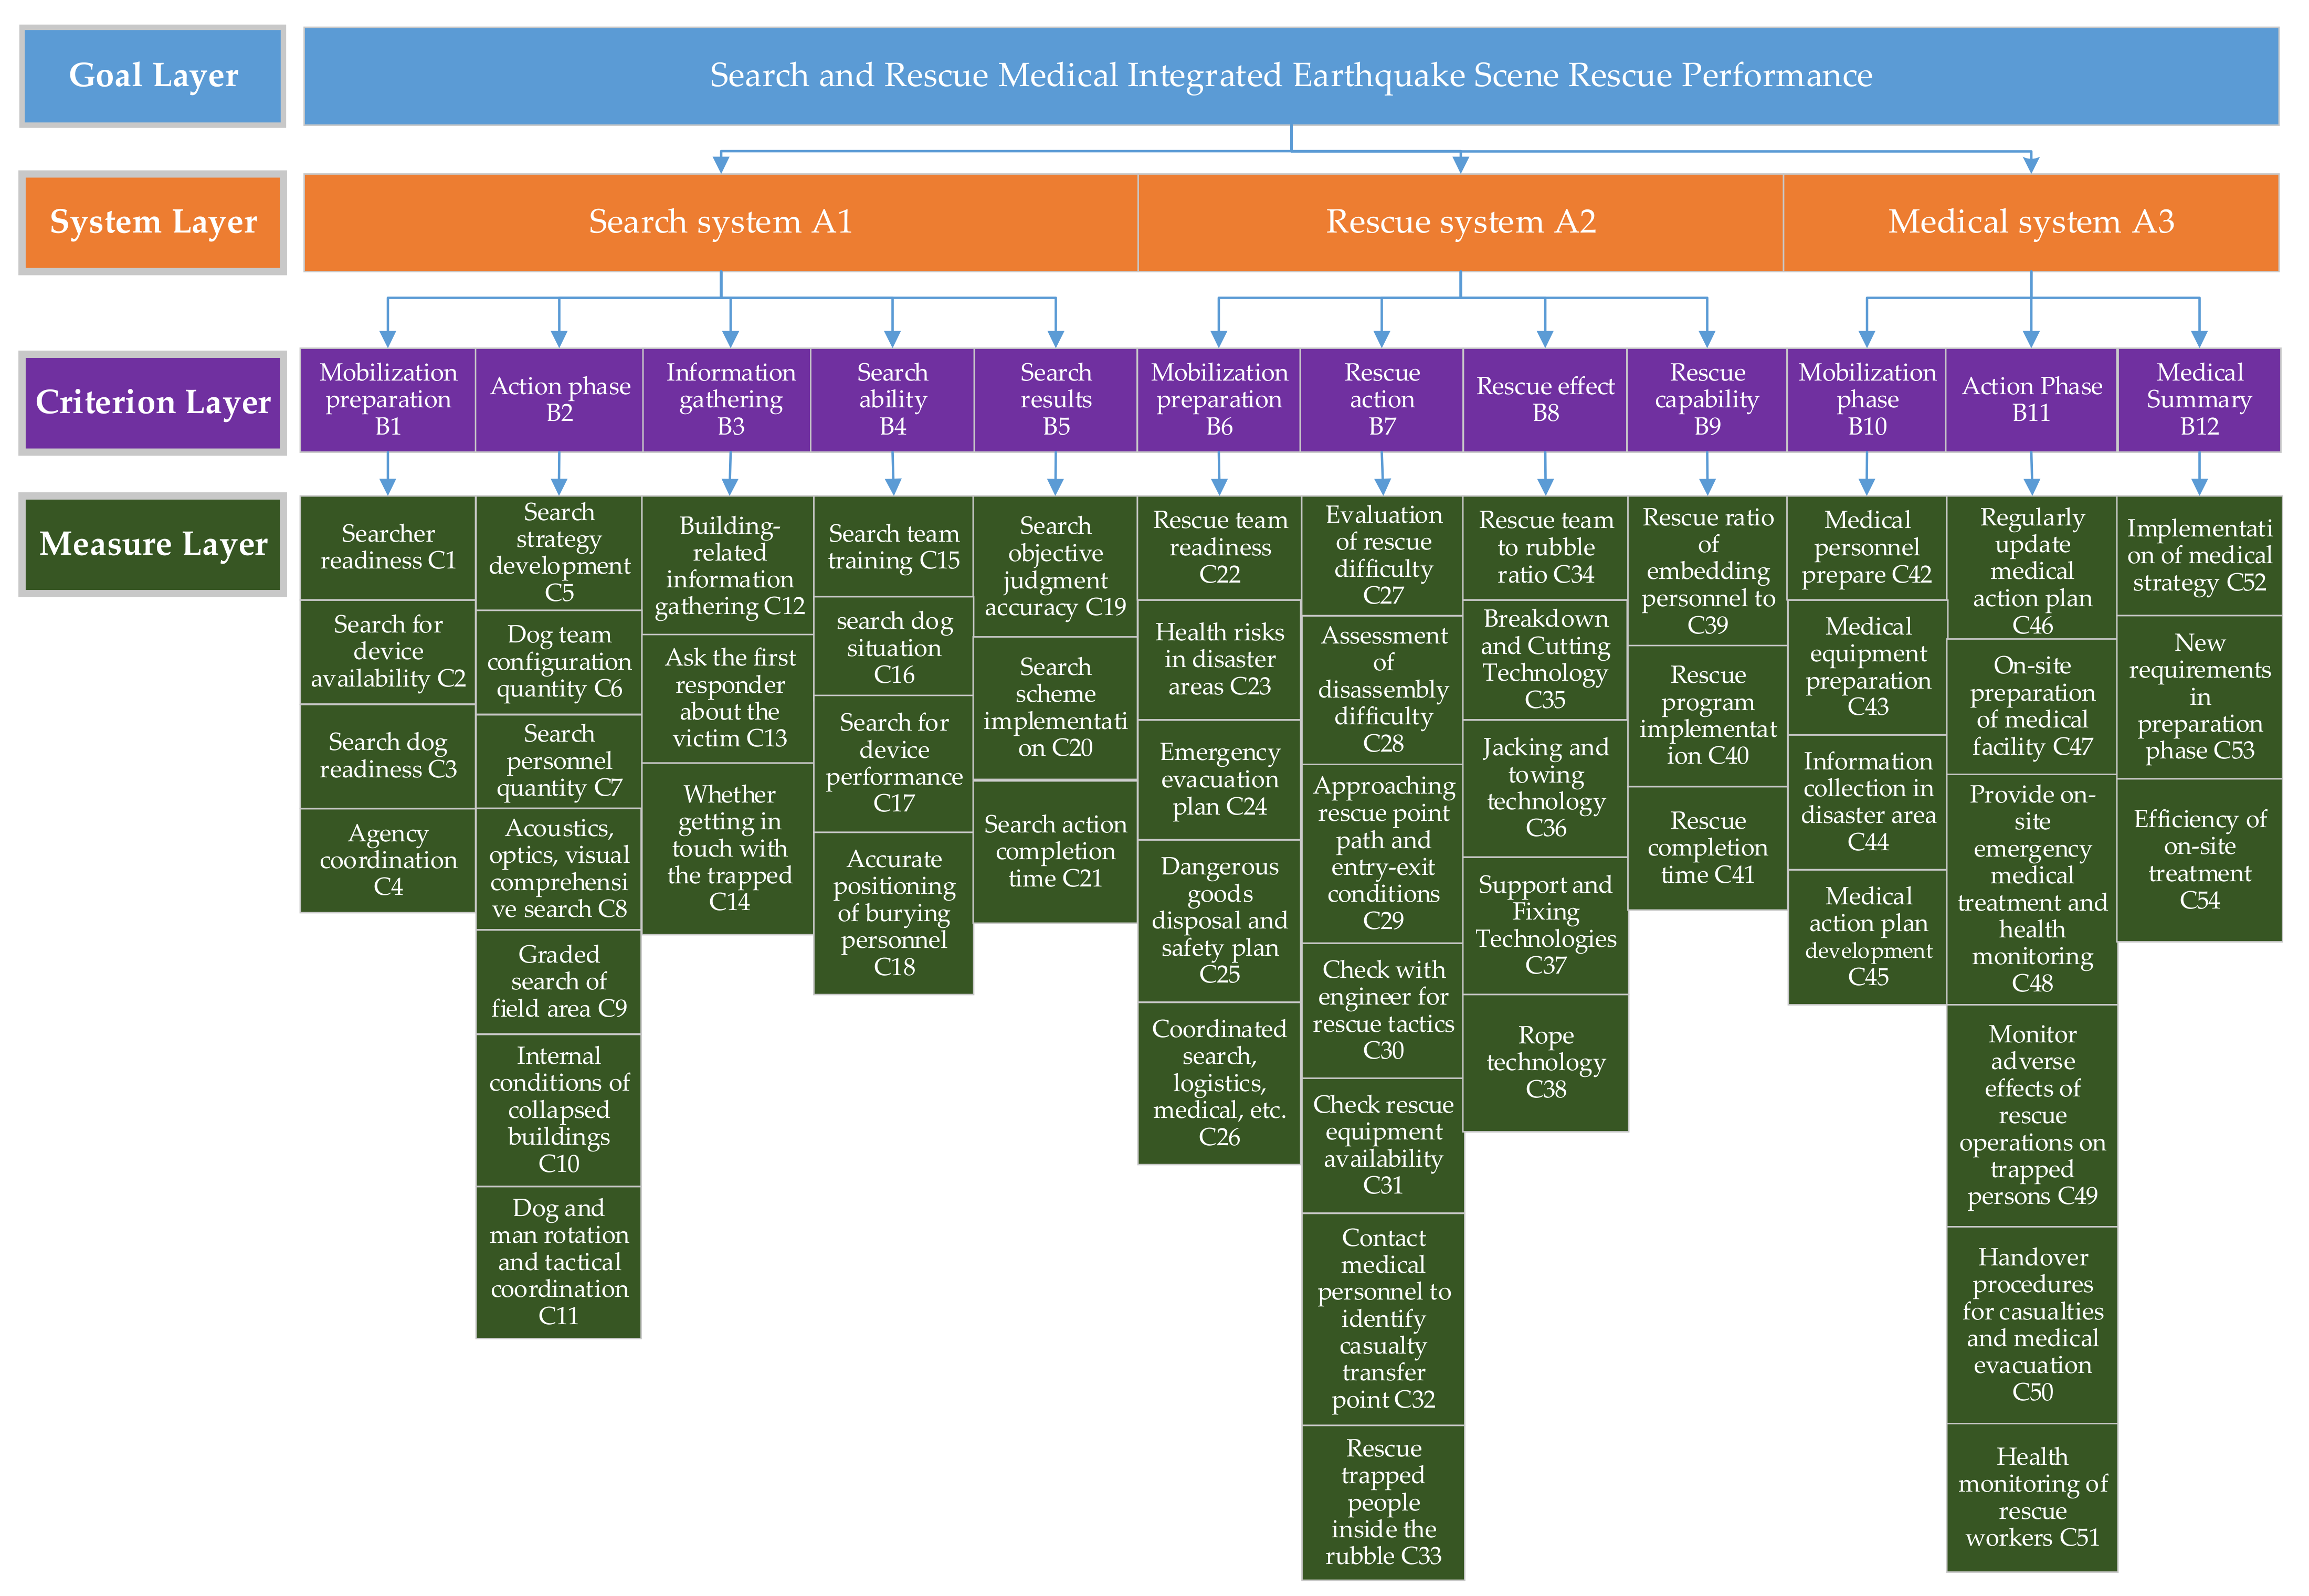
- Build a recursive hierarchy model. When applying AHP to analyze a decision problem, the problem is first organized and hierarchized. The decision problem is divided into a gradually refined hierarchy of goal layer, system layer, criterion layer and measure layer, and the factors influencing the decision goal and the internal links are modeled.
- 2.
- 3.
- Calculate the subjective weights [31]. Computing the product of elements of i-th row of judgment matrix , taking the n-th root of each product, and normalizing these roots to be the subjective weight component. The specific calculation is as followswhere represents the subjective weight of this layer relative to the previous layer.
- 4.
- Consistency test. The consistency test is used to verify the internal conflicts in the pairwise judgement matrix. According to the maximum eigenvalue of judgement matrix , the consistency index CI is obtained in Equation (2). Table 2 shows the random index RI. By Equation (3) the consistency ratio CR is calculated. When , the consistency of judgment matrix is accepted. Otherwise, the judgment matrix should be modified.where is the maximum eigenvalue of matrix .
2.2. Cloud Model
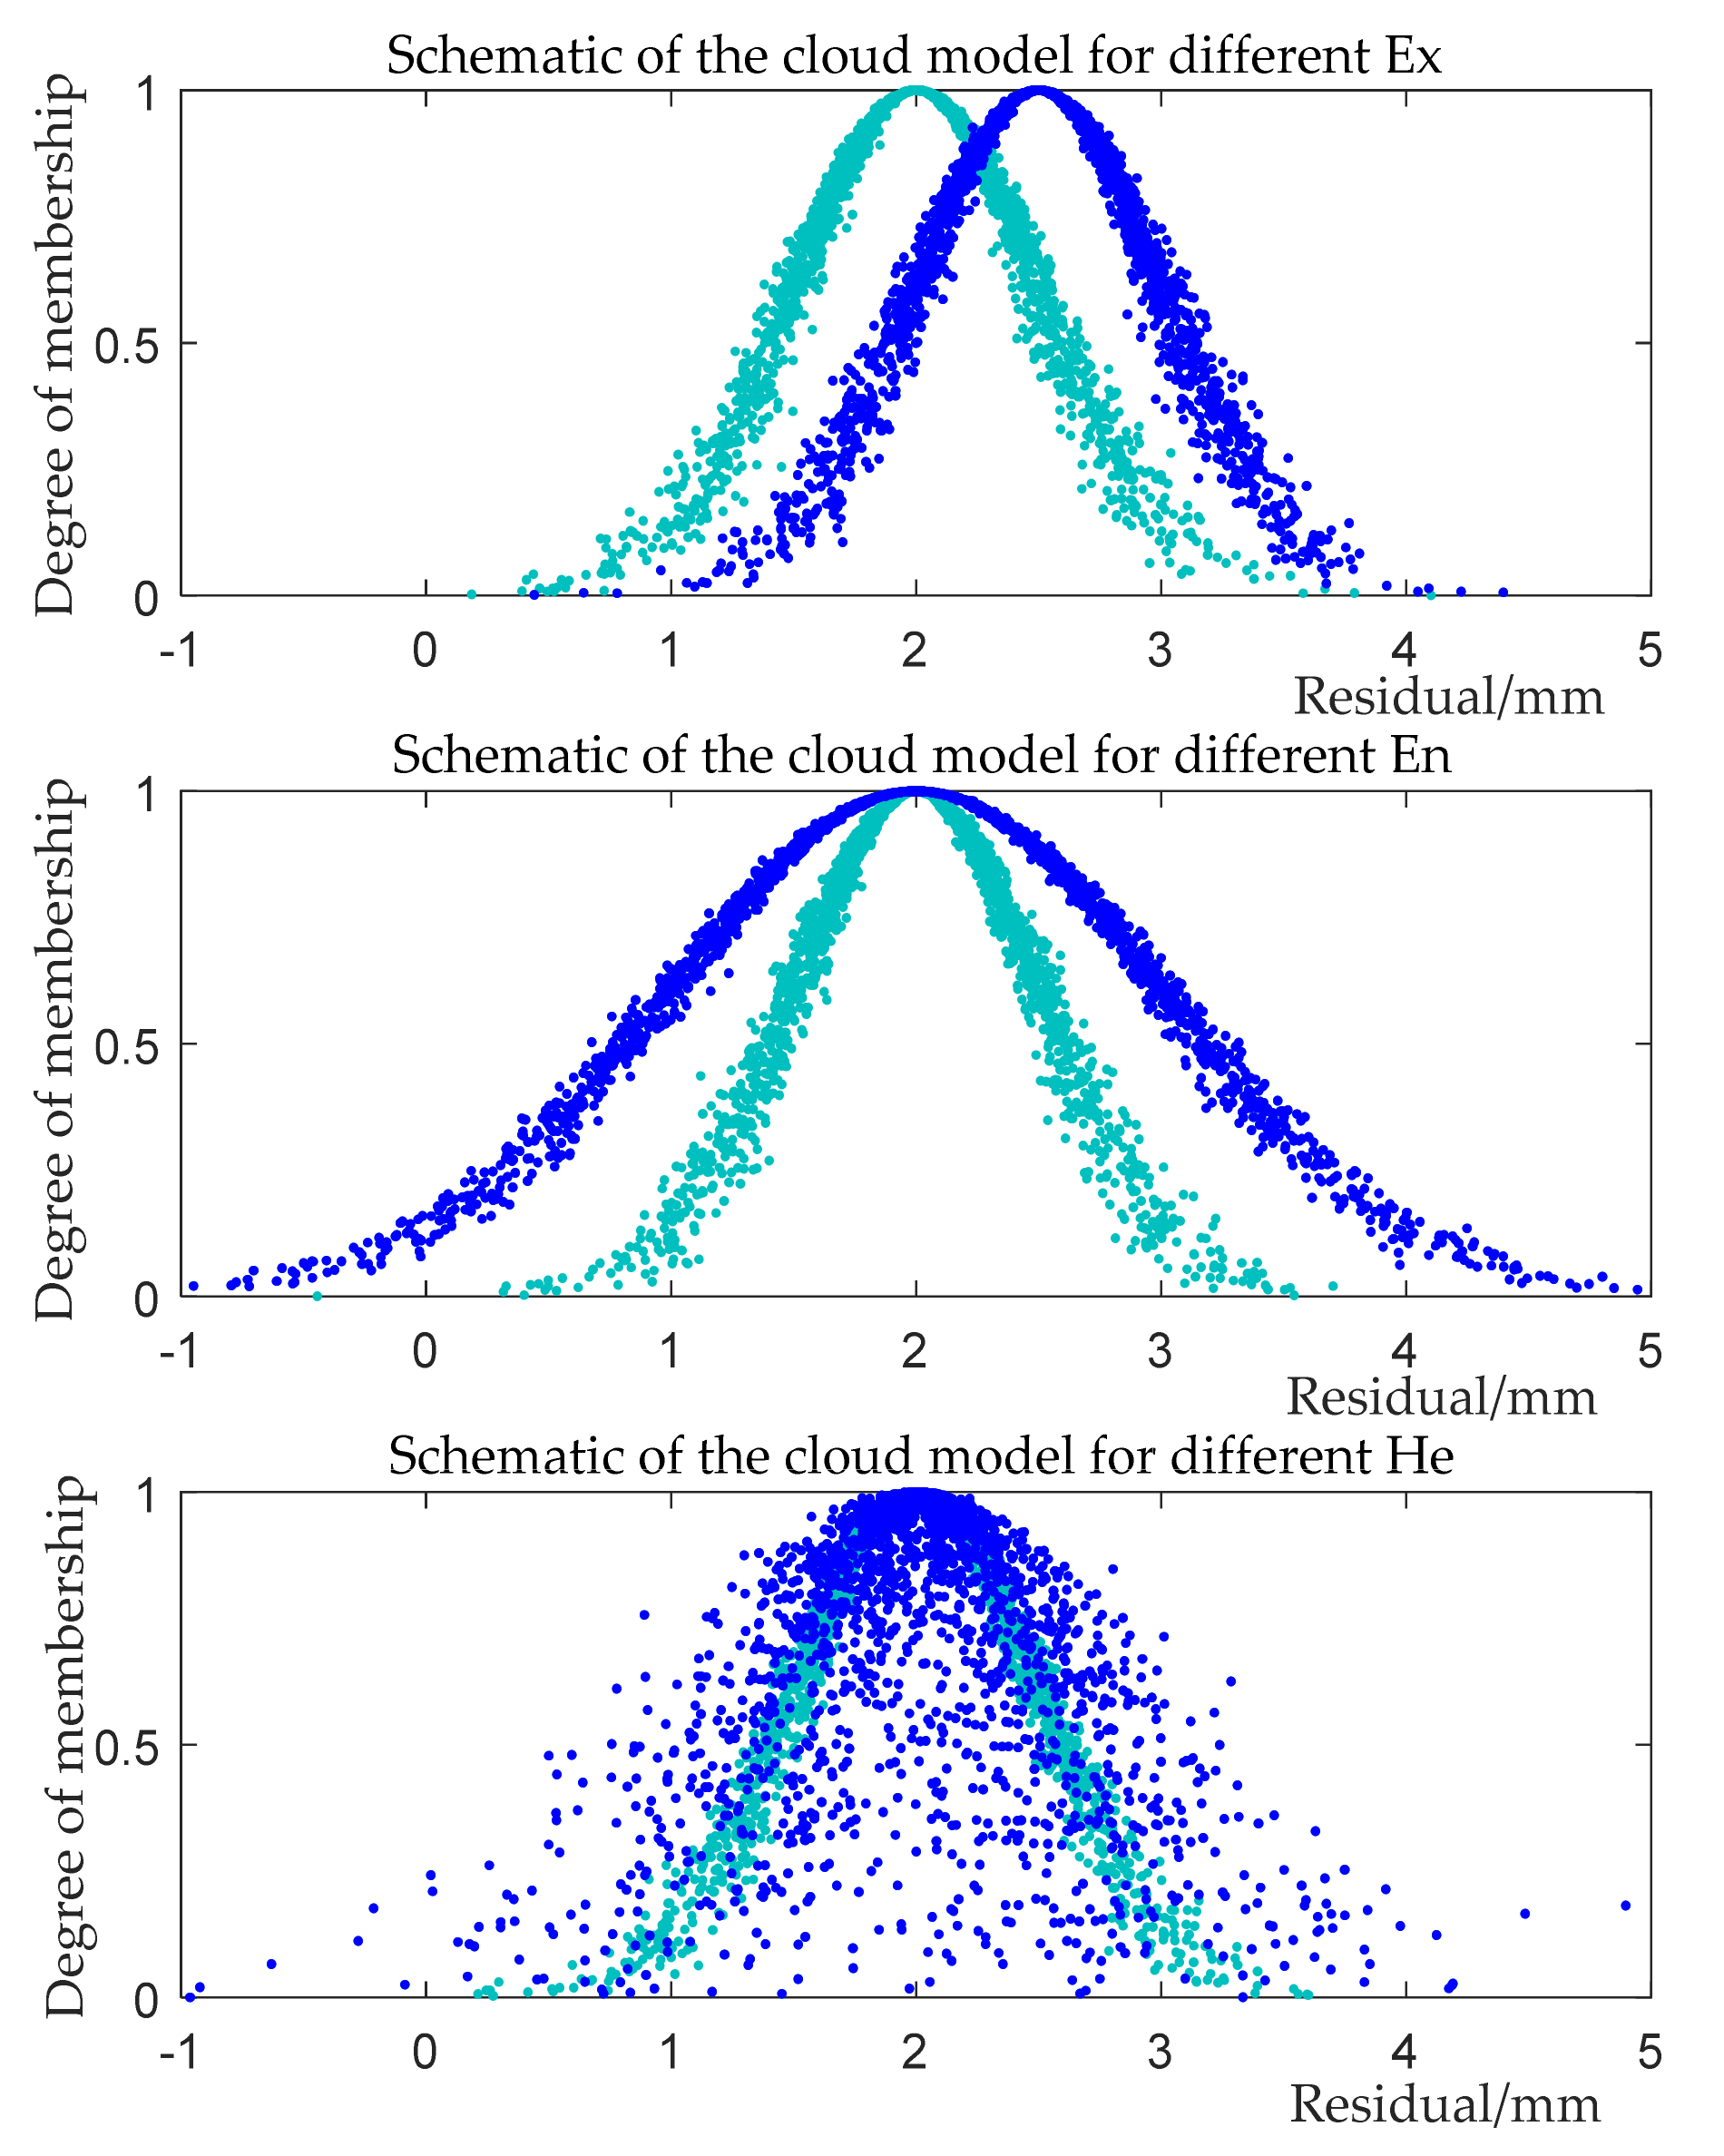
2.2.1. Definition of Cloud Model
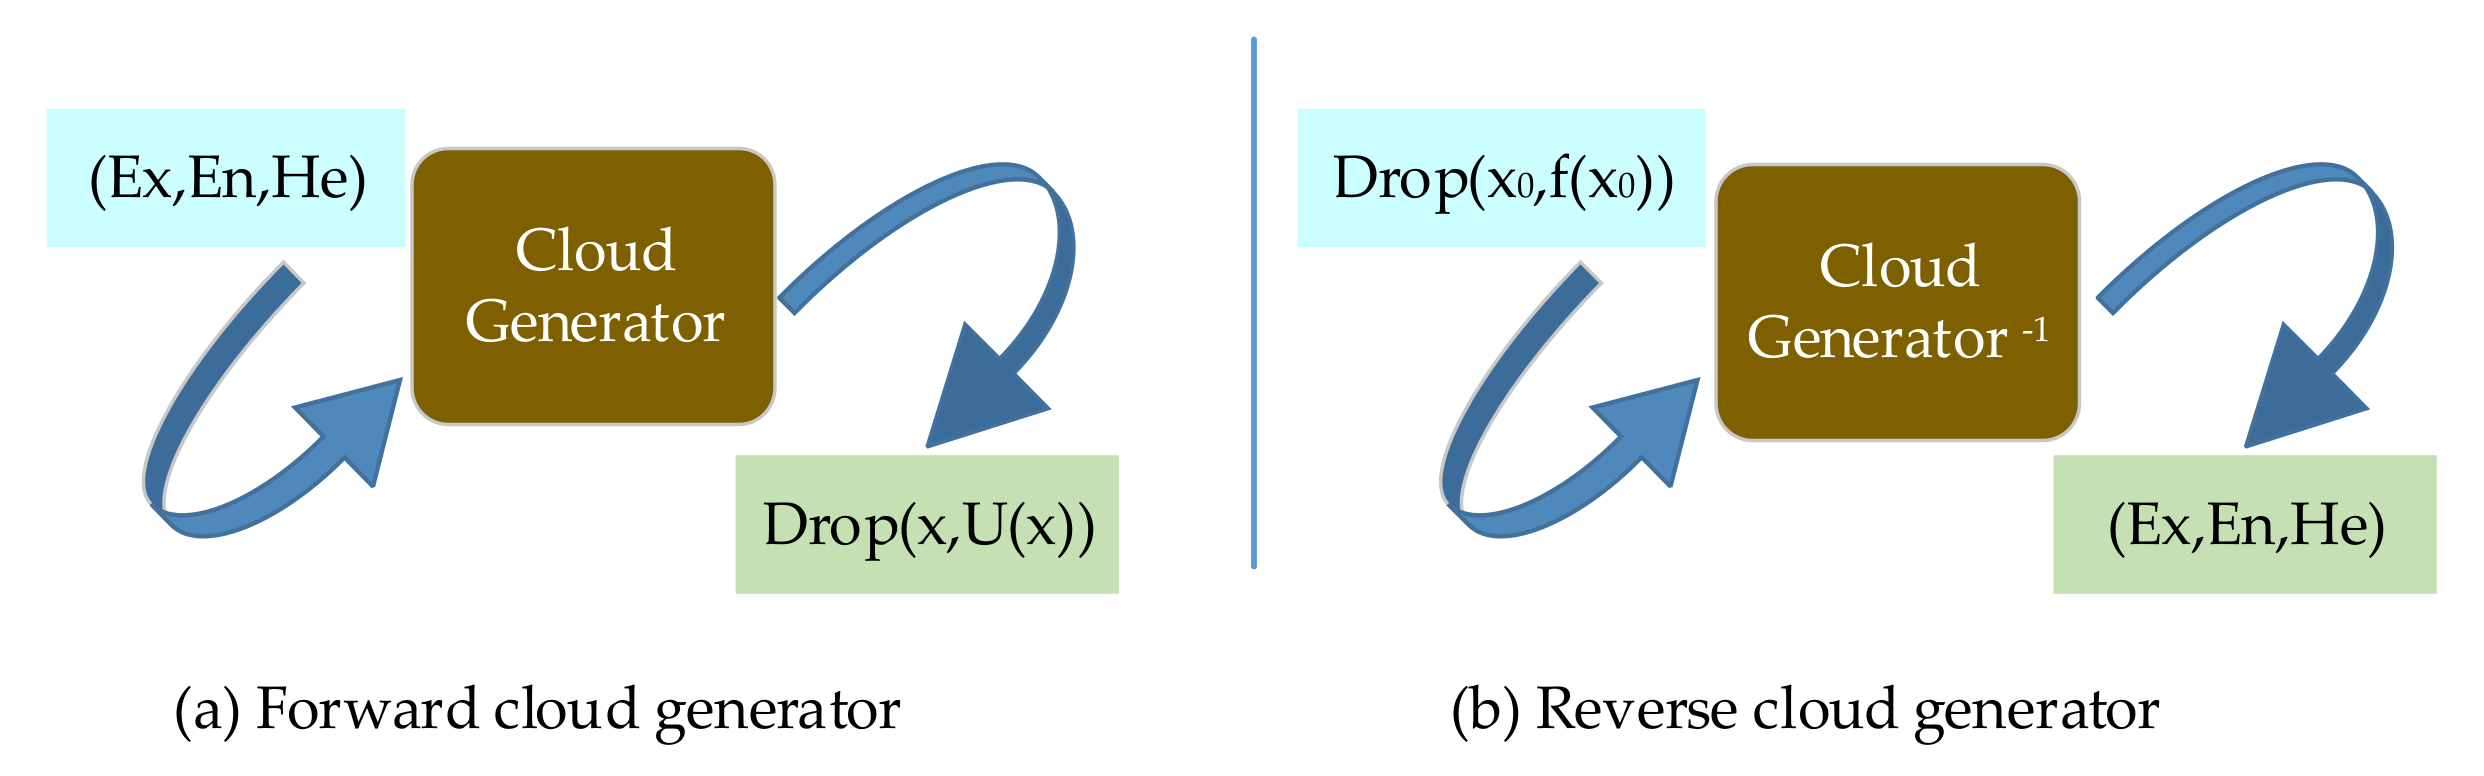
2.2.2. Cloud Generator
| Algorithm 1: Cloud Generator | ||
| Forward Cloud Generator | Reverse Cloud Generator | |
| Input | Digital feature and number of cloud drops . | , . |
| Output | , . | The 3 main parameters corresponding to the cloud drops. |
| 1. The normal random number satisfying with as expectation and as variance is calculated from Equation (9). | 1. Computing the expectation from Equation (11). | |
| 2. The Normal random number with as the expectitaion and as the variance is calculated from Equation (10). | 2. Computing the entropy from Equation (12). | |
| 3. The membership of corresponding to the qualitative concept is calculated from Equation (8). | 3. Computing corresponding to from Equation (13). | |
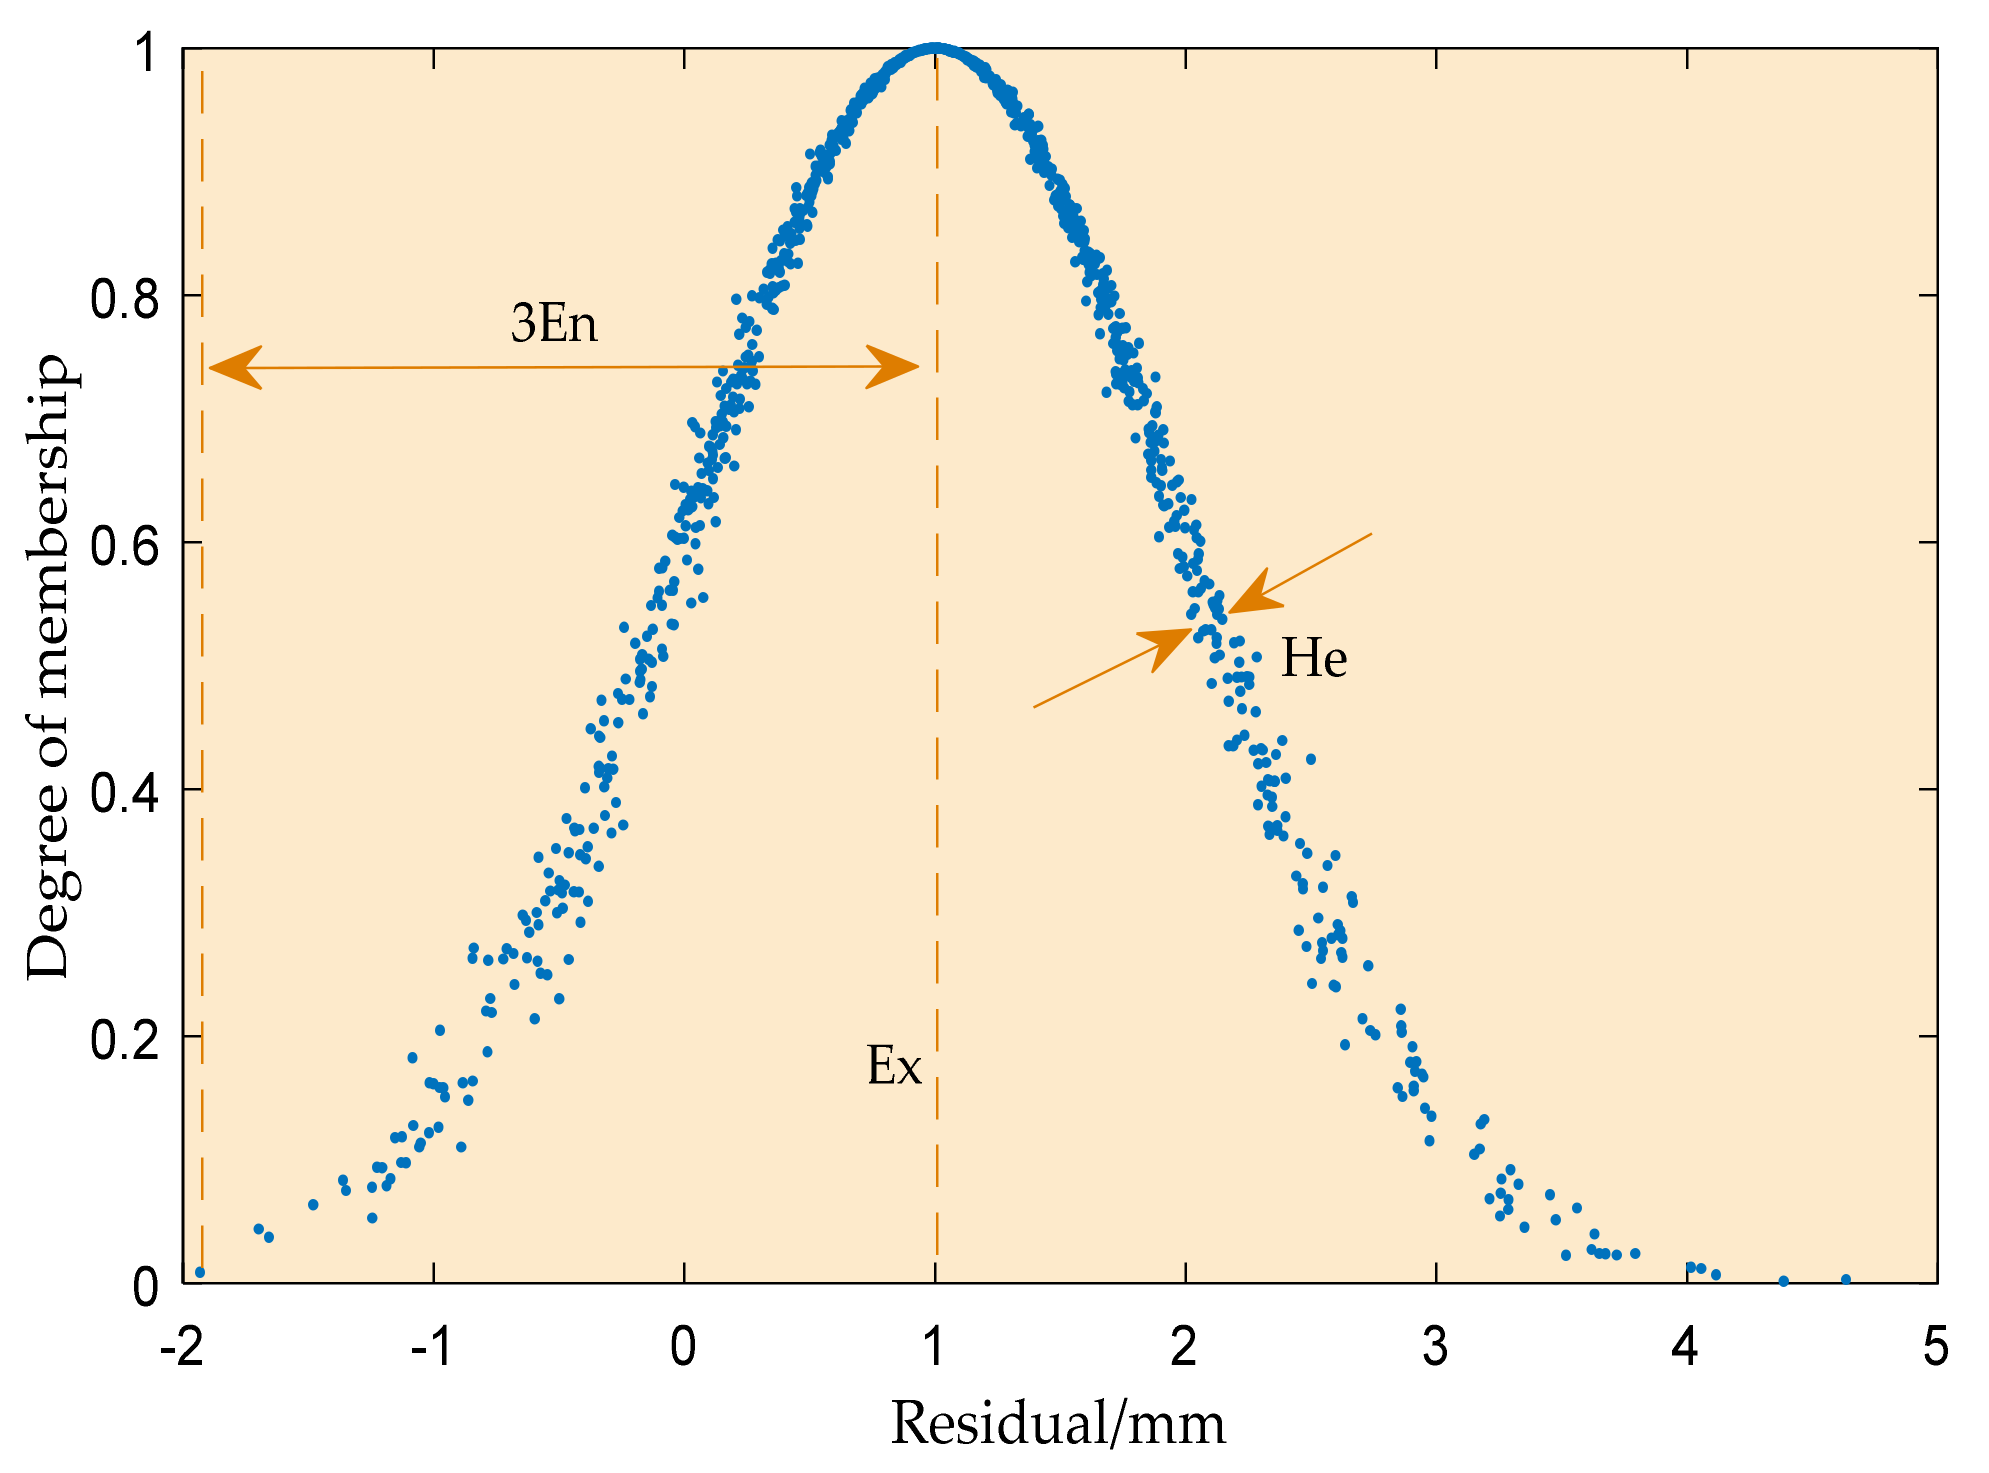
| 4. Get a cloud drop . | 4. Computing the hyper-entropy corresponding to from Equation (14) (see Figure 3). | |
| 5. Repeat steps until the set number of cloud drops are obtained (see Figure 3). | ||
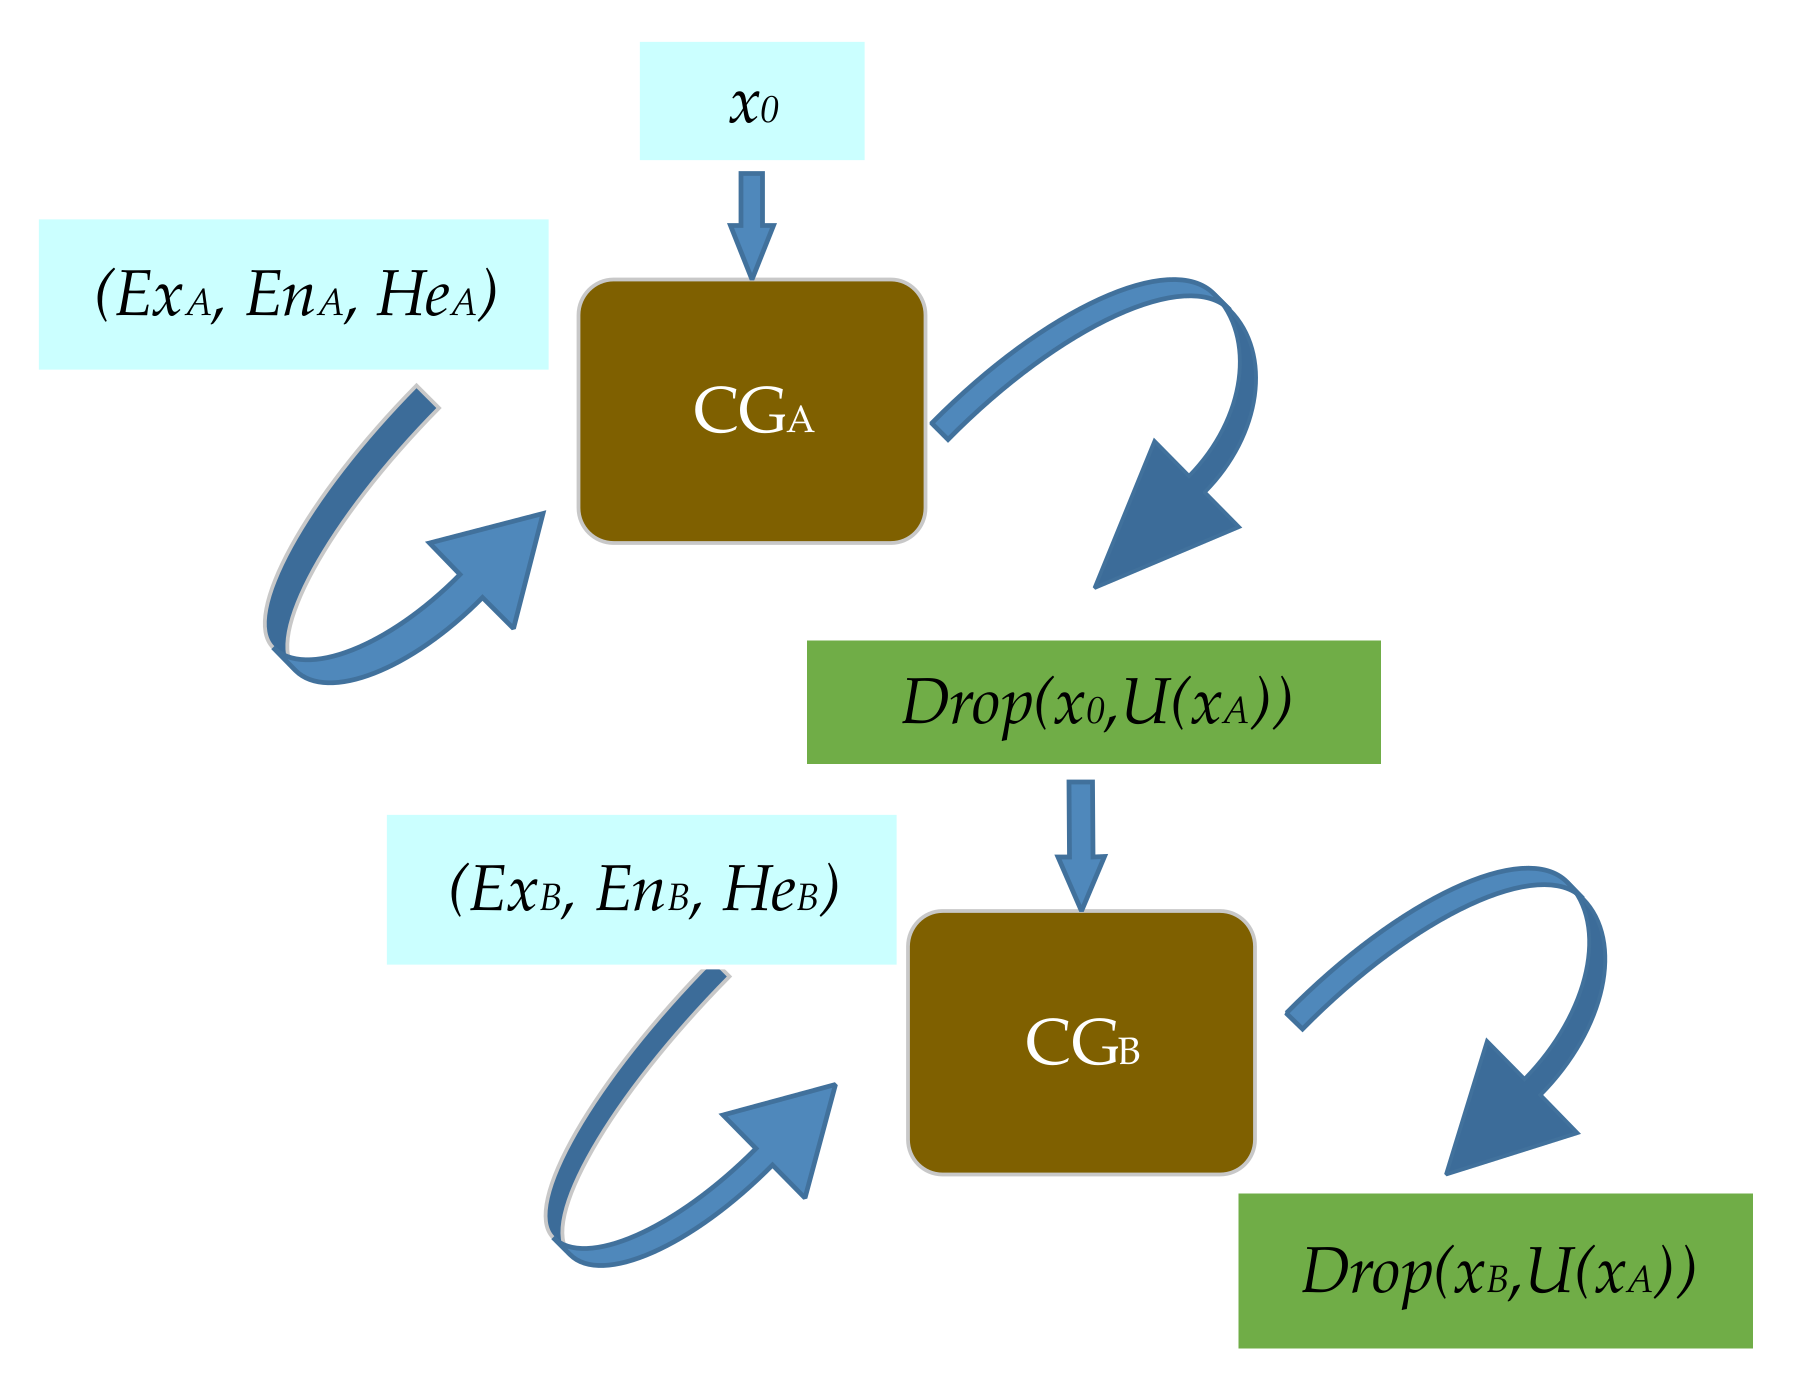
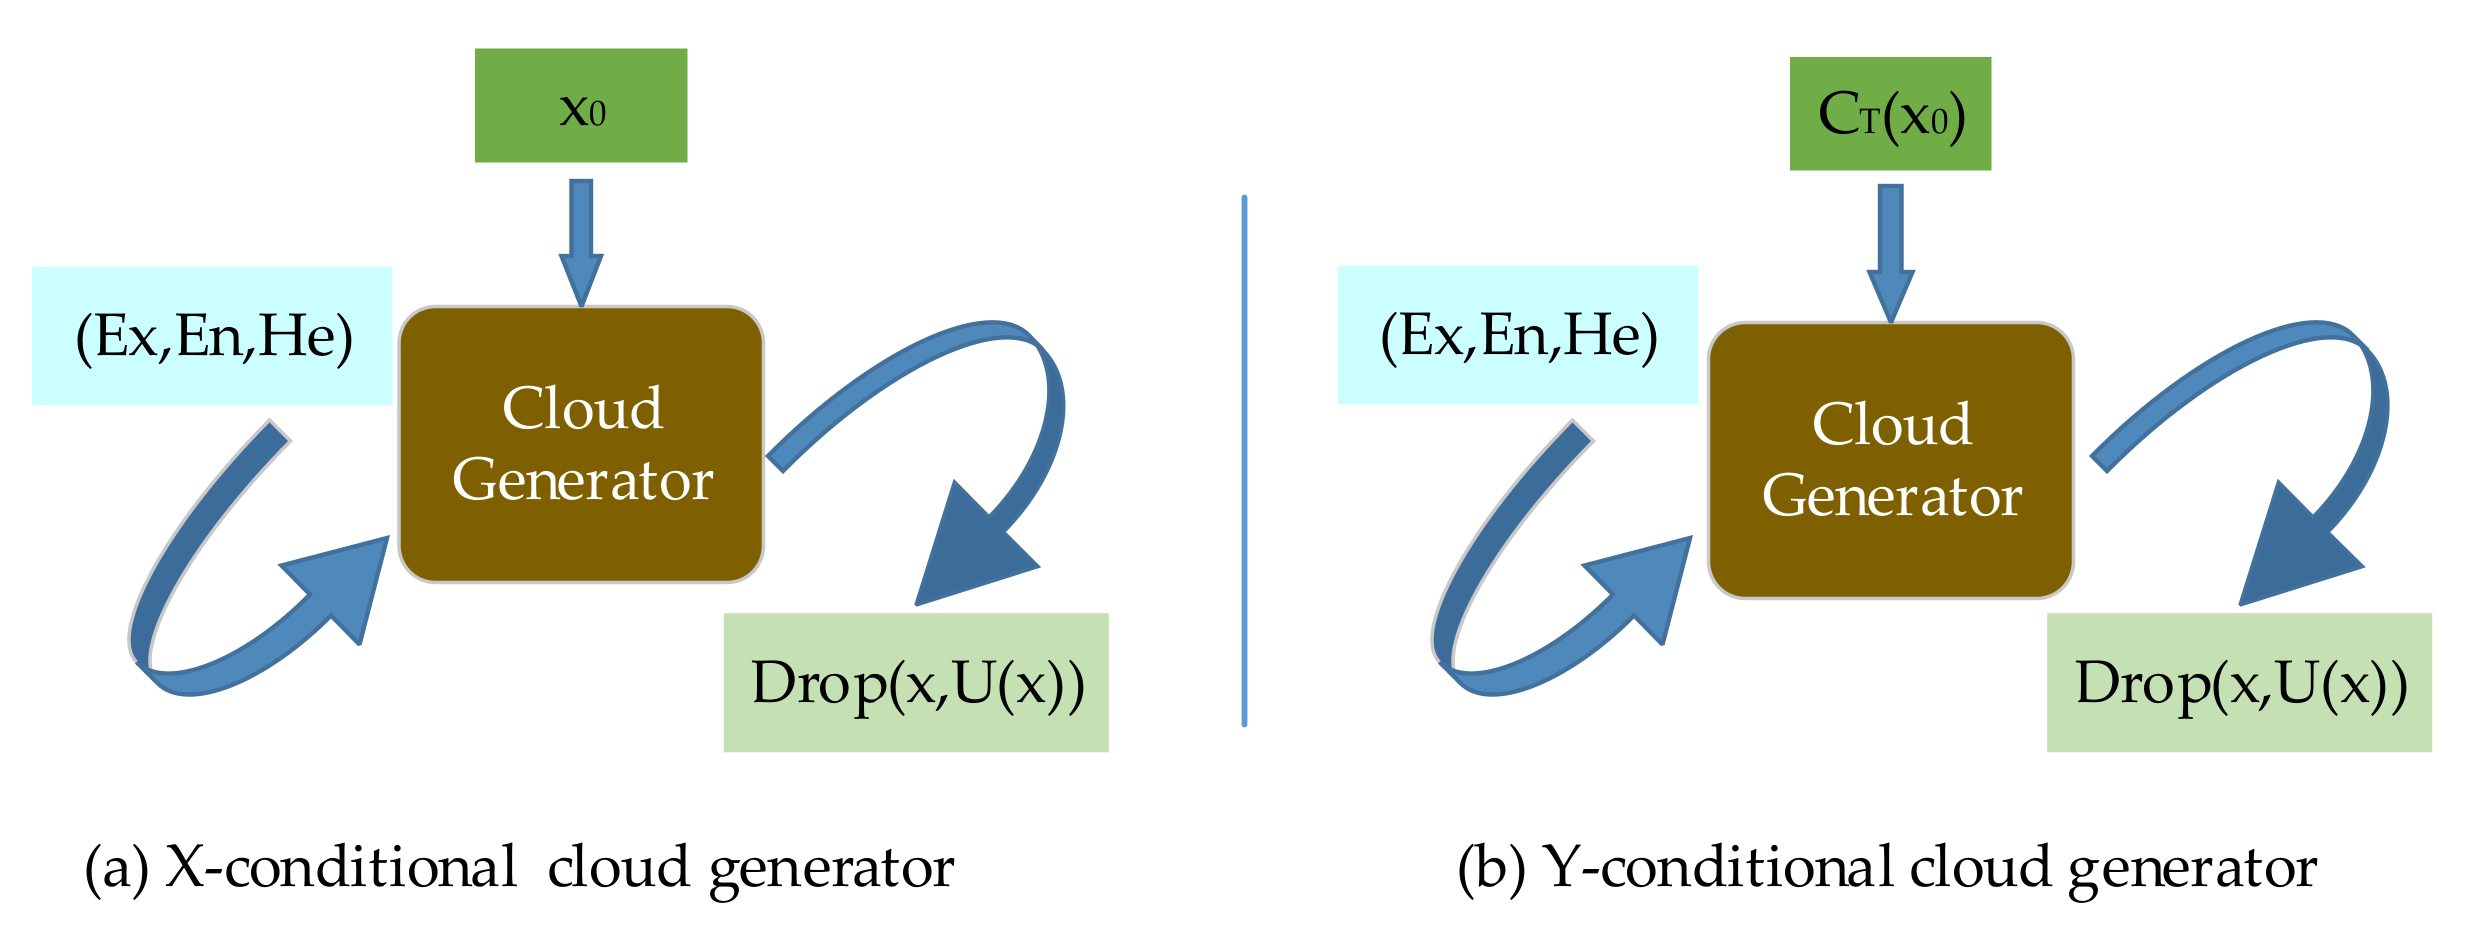
| Algorithm 2: Conditional Cloud Generator | ||
| X-Conditional Cloud Generator | Y-Conditional Cloud Generator | |
| Input | Digital feature , and number of cloud drops . | Digital feature , and number of cloud drops . |
| Output | , . | , . |
| 1. The normal random number satisfying as the expectation and as the variance is calculated from Equation (9). | 1. The normal random number satisfying as the expectation and as the variance is calculated from Equation (9). | |
| 2. Computing the membership from Equation (8) to generate a cloud drop. | 2. A cloud drop is obtained from Equation (15). | |
| 3. Repeat steps until the set number of cloud drops are obtained (see Figure 4). | 3. Repeat steps until the set number of cloud drops are obtained (see Figure 4). | |
2.2.3. Cloud Rule Generator
2.2.4. Objective Weight Calculation
2.3. Weighted Analysis Method
3. Case Analysis
3.1. Earthquake Rescue Performance Index System
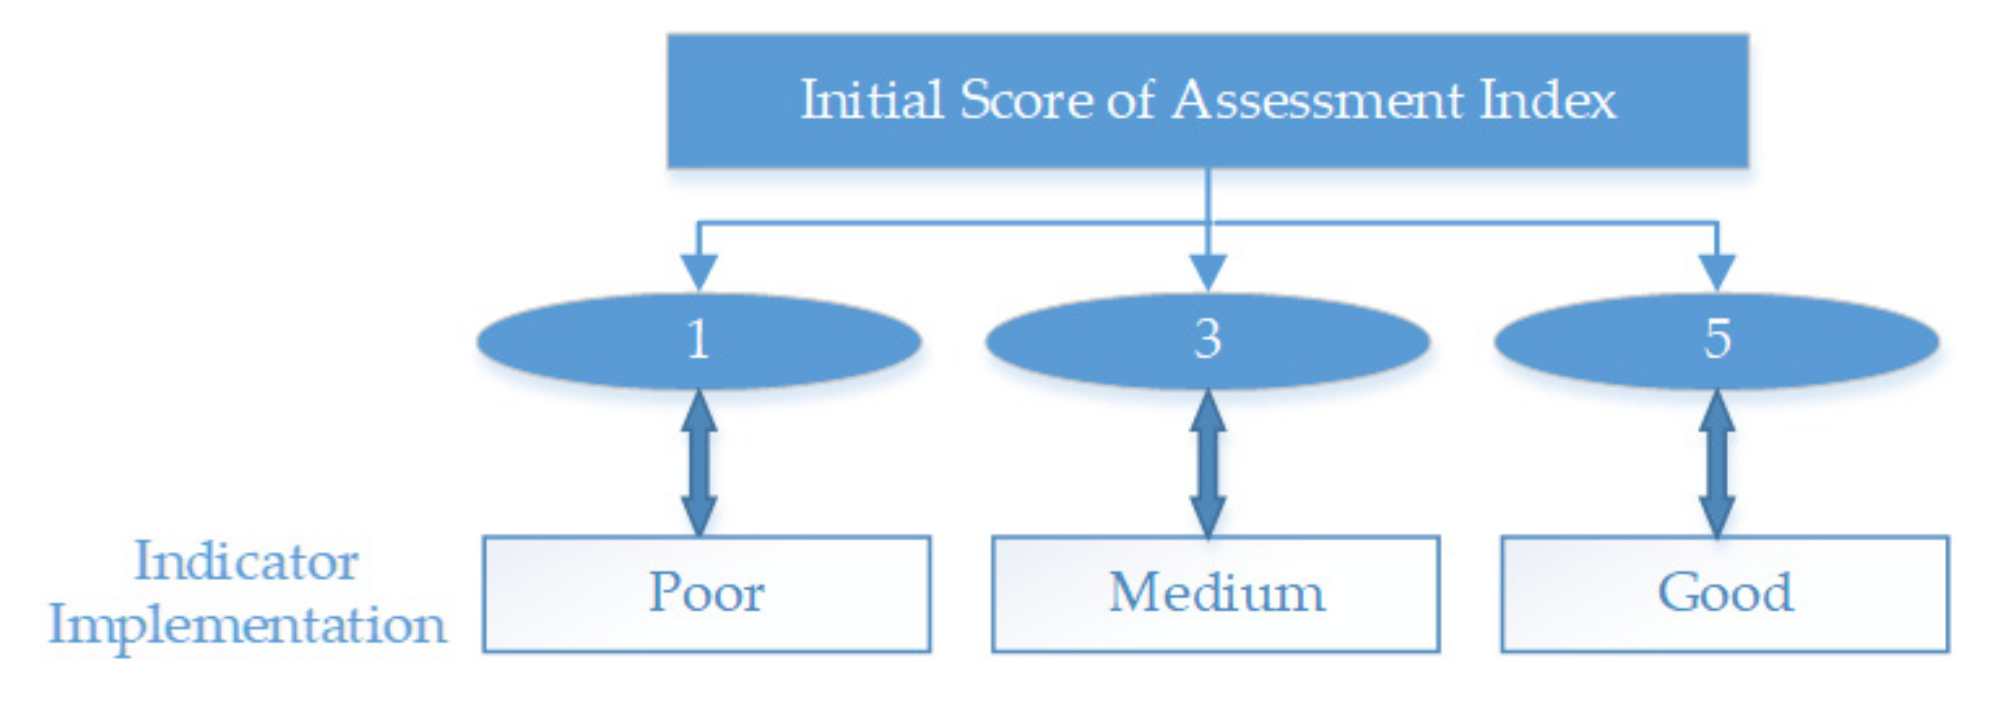
3.2. Quantitative Score of Rescue Performance
3.3. Determining the Weight of Each Earthquake Rescue Index
3.3.1. Computation of Subjective Weights of Indexes
3.3.2. Computation of Objective Weights of Indexes
3.4. Weighted Analysis of Rescue Performance Assessment
4. Conclusions
- On the basis of a large number of on-site research and expert consultation, a rescue performance assessment index system was constructed, setting up a total of 54 indexes that basically cover the specific requirements of scene rescue, taking into account the scientific nature, hierarchy, independence and evaluability each index needs to have.
- Based on the performance characteristics of different stages of earthquake scene rescue, the application of AHP and cloud model in the assessment of earthquake scene rescue performance is realized. Through the cloud model, the sample set of assessment candidates was reasonably filled with missing data values, data anomaly processing and optimal selection of the sample set to expand the sample set of the assessment cloud model, thus providing a more accurate assessment basis for rescue performance assessment. Combined with the results of the questionnaire given by the rescue experts, a judgment matrix was constructed to derive the index weight values, which realized the application of AHP and cloud model in the assessment of earthquake scene rescue performance.
- Take an earthquake rescue case to calculate. The weighted analysis method is used to integrate the weights calculated by the AHP and the cloud model to score each index at the measure layer and apply the method to calculate the rescue performance value, and optimize the assessment results of the example in two levels to derive a better rescue performance assessment value to provide an improvement reference for subsequent rescues. The results show that the method of assessing the performance of search and rescue medical integrated earthquake scene rescue offers good practicality, and can provide training guidance and assessment indexes for rescue teams and provide reference for further optimization of earthquake emergency rescue in the world.
5. Limitations and Future Research Directions
Author Contributions
Funding
Institutional Review Board Statement
Informed Consent Statement
Data Availability Statement
Acknowledgments
Conflicts of Interest
References
- Lin, J.-F.; Li, X.-Y.; Wang, J.; Wang, L.-X.; Hu, X.-X.; Liu, J.-X. Study of Building Safety Monitoring by Using Cost-Effective MEMS Accelerometers for Rapid After-Earthquake Assessment with Missing Data. Sensors 2021, 21, 7327. [Google Scholar] [CrossRef]
- Rastin, S.J.; Rhoades, D.A.; Christophersen, A. Space-Time Trade-off of Precursory Seismicity in New Zealand and California Revealed by a Medium-Term Earthquake Forecasting Model. Appl. Sci. 2021, 11, 10215. [Google Scholar] [CrossRef]
- Sun, B.-T.; Zang, G.-X. Study Seismic Disaster Risk Distribution of Buildings in Mainland China. China Civ. Eng. J. 2017, 50, 1–7. (In Chinese) [Google Scholar]
- Shi, L.; Zhang, F.; Xia, J.; Xie, J.; Zhang, Z.; Du, Z.; Liu, R. Identifying Damaged Buildings in Aerial Images Using the Object Detection Method. Remote Sens. 2021, 13, 4213. [Google Scholar] [CrossRef]
- Wang, W.; Chen, H.; Ma, L.-W.; Qu, M.-H. Construction of Evaluation Index System of Earthquake Emergency Response Capacity in China. Disaster Sci. 2020, 35, 167–170, 176. [Google Scholar]
- Xie, L.-L. Definition and Evaluation Method of Urban Earthquake Prevention and Disaster Reduction Capacity. J. Northwest Seismol. 2005, 296–304. [Google Scholar]
- Deng, Y.; Su, G.-W.; Gao, N.; Sun, L. Investigation and Analysis of the Importance Awareness of the Factors Affecting the Earthquake Emergency and Rescue in Different Areas: A Case Study of Yunnan and Jiangsu Provinces. Int. J. Disaster Risk Reduct. 2017, 25, 163–172. [Google Scholar] [CrossRef]
- FEMA; NEMA. State Capability Assessment for Readiness (CAR); FEMA: Washington, DC, USA, 2000. [Google Scholar]
- Huang, J.F.; Lu, M.; Chen, H.; INSARAG Secretariat. INSARAG Guidelines and Methodology; Seismological Press: Beijing, China, 2007; pp. 313–327. [Google Scholar]
- Gazi, M.D.; Ozden, T.; Elif, K.; Surendra, M.G. A Holistic Approach for Performance Evaluation Using Quantitative and Qualitative Data: A Food Industry Case Study. Expert Syst. Appl. 2017, 81, 410–422. [Google Scholar]
- Sylvain, K.; Jérémy, R.; William, D.; Voisin, A.; Yves, L.T. A State-of the-Art Survey & Testbed of Fuzzy AHP (FAHP) Applications. Expert Syst. Appl. 2016, 65, 398–422. [Google Scholar]
- Lin, G.; Wang, S.; Lin, C.; Bu, L.; Xu, H. Evaluating Performance of Public Transport Networks by Using Public Transport Criteria Matrix Analytic Hierarchy Process Models—Case Study of Stonnington, Bayswater, and Cockburn Public TransportNetwork. Sustainability 2021, 13, 6949. [Google Scholar] [CrossRef]
- Sun, C.-L.; Liu, Y.-N.; Zhang, T. Research on Operational Performance Evaluation System of Urban Waste Treatment PPP Project Based on AHP. IOP Conf. Ser. Earth Environ. Sci. 2019, 267, 042067. [Google Scholar] [CrossRef]
- Ding, D.; Wu, J.-Y.; Zhu, S.-W.; Mu, Y.; Li, Y.-Y. Research on AHP-based fuzzy evaluation of urban green building planning. Environ. Chall. 2021, 5, 100305. [Google Scholar] [CrossRef]
- Bigdeli, F.; Javidi, M.; Pakshir, M.; Khezrloo, A.; Tayebi, M. Risk Assessment of the Corrosion Resistance Performances for Epoxy Coatings under Drilling Environments Using AHP Method. Int. J. Press. Vessel. Pip. 2021, 193, 104470. [Google Scholar] [CrossRef]
- Gunduz, M.; Mohammad, K.O. Assessment of Change Order Impact Factors on Construction Project Performance Using Analytic Hierarchy Process (AHP). Technol. Econ. Dev. Econ. 2019, 26, 71–85. [Google Scholar] [CrossRef]
- Farhad, O.; Steven, T.B.; Ronald, D.W. Assessing the Performance of Residential Energy Management Control Algorithms: Multi-criteria Decision Making Using the Analytical Hierarchy Process. Energy Build. 2019, 199, 537–546. [Google Scholar]
- Sipahi, S.; Timor, M. The Analytic Hierarchy Process and Analytic Network Process: An Overview of Applications. Manag. Decis. 2010, 48, 775–808. [Google Scholar] [CrossRef]
- Sen, C.G.; Cinar, G. Evaluation and Pre-allocation of Operators with Multiple Skills: A Combined Fuzzy AHP and Max–min Approach. Expert Syst. Appl. 2010, 37, 2043–2053. [Google Scholar] [CrossRef]
- Qu, S.; Zheng, Y.; Yan, H.; Deng, W.-Q.; Liu, T.-Y. Operational Effectiveness Evaluation of Antimissile Early Warning Based on Combination Weighted TOPSIS. J. Phys. Conf. Ser. 2021, 1927, 012007. [Google Scholar] [CrossRef]
- Saeedpoor, M.; Vafadarnikjoo, A. A Comparison Between Fuzzy AHP and Fuzzy TOPSIS Methods to Supplier Selection. Appl. Soft Comput. 2014, 21, 194–209. [Google Scholar]
- Zhou, Y.; Cai, J.-M.; Xu, Y.-W.; Wang, Y.-H.; Jiang, C.; Zhang, Q.-Q. Operation Performance Evaluation of Green Public Buildings with AHP-fuzzy Synthetic Assessment Method Based on Cloud Model. J. Build. Eng. 2021, 42, 102775. [Google Scholar] [CrossRef]
- Qi, Z.-Y.; Zhang, Y.-Y.; Fang, L.-Q.; Jia, M.-S.; Li, Y.-N.; Lin, G.-Y. Research on Effectiveness Evaluation Method of Weapon System Based on Cloud Model. J. Phys. Conf. Ser. 2021, 1965, 012005. [Google Scholar] [CrossRef]
- Ayyildiz, E.; Gumus, A.T. Interval-valued Pythagorean Fuzzy AHP Method-based Supply Chain Performance Evaluation by A New Eextension of SCOR Model: SCOR 4.0. Complex Intell. Syst. 2021, 7, 559–576. [Google Scholar] [CrossRef]
- Xiong, Y.; Kong, D.; Cheng, Z.; Wu, G.; Zhang, Q. The Comprehensive Identification of Roof Risk in a Fully Mechanized Working Face Using the Cloud Model. Mathematics 2021, 9, 2072. [Google Scholar] [CrossRef]
- Dan, L.; Da, P.-F.; Chun, Y.-D. Ecological Environment Evaluation of Coal Mining Area Based on Cloud Model. Adv. Mater. Res. 2012, 1566, 1372–1376. [Google Scholar]
- Weng, C.; Fazhi, Q.-I.; Chen, G. Host Security Risk Assessment Based on Analytic Hierarchy Process and Cloud Model. Comput. Eng. 2016, 42, 1–6. [Google Scholar]
- Gu, X.; Wu, S.; Ji, X.; Zhu, Y. The Risk Assessment of Debris Flow Hazards in Banshanmen Gully Based on the Entropy Weight-Normal Cloud. Method. Adv. Civ. Eng. 2021, 2021, 8841310. [Google Scholar] [CrossRef]
- Tan, F.; Wang, J.; Jiao, Y.; Ma, B.; He, L. Suitability Evaluation of Underground Space Based on Finite Interval Cloud Model and Genetic Algorithm Combination Weighting. Tunn. Undergr. Space Technol. 2020, 108, 103743. [Google Scholar] [CrossRef]
- Saaty, R.W. The Analytic Hierarchy Process—What It is and How It is Used. Math. Model. 1987, 9, 161–176. [Google Scholar] [CrossRef] [Green Version]
- Varghese, B.; Karande, P. AHP-MARCOS, A Hybrid Model for Selecting Gears and Cutting Fluids. Mater. Today Proc. 2021, 11, 142. [Google Scholar]
- Li, D.-Y.; Liu, C.-Y. On the Universality of Normal Cloud Model. China Eng. Sci. 2004, 6, 28–34. [Google Scholar]
- Li, D.-Y.; Liu, C.-Y.; Gan, W.-Y. A New Cognitive Model: Cloud model. Int. J. Intell. Syst. 2009, 24, 357–375. [Google Scholar] [CrossRef]
- Li, D.-Y.; Han, J.; Shi, X.; Chan, M.-C. Knowledge Representation and Discovery Based on Linguistic Atoms. Knowl. Based Syst. 1998, 10, 431–440. [Google Scholar] [CrossRef]
- Lu, X.-H.; Zhang, Y.-W.; Zou, Y.-C. Evaluation the Effect of Cultivated Land Protection Policies Based on the Cloud Model: A case study of Xingning, China. Ecol. Indic. 2021, 131, 108247. [Google Scholar] [CrossRef]
- Wang, T.; Wang, X.; Wang, L.; Au-Yong, C.-P.; Ali, A.S. Assessment of the Development Level of Regional Industrialized Building Based on Cloud Model: A Case Study in Guangzhou, China. J. Build. Eng. 2021, 44, 102547. [Google Scholar] [CrossRef]
- Jin, Y.; Sun, Y.; Ma, H. A Developed Artificial Bee Colony Algorithm Based on Cloud Model. Mathematics 2018, 6, 61. [Google Scholar] [CrossRef] [Green Version]
- Liu, G.; Yu, J. Gray Correlation Analysis and Prediction Models of Living Refuse Generation in Shanghai City. Waste Manag. 2007, 27, 345–351. [Google Scholar] [CrossRef]


| Level of Importance | Assignment |
|---|---|
| Two elements of equal importance | 1 |
| The former is slightly more important than the latter | 3 |
| The former is obviously more important than the latter | 5 |
| The former is strongly more important than the latter | 7 |
| The former is extremely more important than the latter | 9 |
| The former is slightly unimportant compared to the latter | 1/3 |
| The former is obviously unimportant compared to the latter | 1/5 |
| The former is strongly unimportant compared to the latter | 1/7 |
| The former is extremely unimportant compared to the latter | 1/9 |
| n | 1 | 2 | 3 | 4 | 5 | 6 | 7 | 8 | 9 |
|---|---|---|---|---|---|---|---|---|---|
| RI | 0 | 0 | 0.58 | 0.90 | 1.12 | 1.24 | 1.32 | 1.41 | 1.45 |
| Importance of Criteria Layer Indexes | B1 | B2 | B3 | B4 | B5 | ||
|---|---|---|---|---|---|---|---|
| Search system A1 | B1 | 1 | 1/5 | 1/7 | 1/5 | 1/7 | 0.0329 |
| B2 | 5 | 1 | 1/3 | 1/3 | 1/6 | 0.0846 | |
| B3 | 7 | 3 | 1 | 1 | 1/5 | 0.1815 | |
| B4 | 5 | 3 | 1 | 1 | 1/4 | 0.1774 | |
| B5 | 7 | 6 | 5 | 4 | 1 | 0.5236 | |
| Importance of Criteria Layer Indexes | B6 | B7 | B8 | B9 | ||
|---|---|---|---|---|---|---|
| Rescue system A2 | B6 | 1 | 1/3 | 1/5 | 1/7 | 0.0592 |
| B7 | 3 | 1 | 2 | 1/3 | 0.2255 | |
| B8 | 5 | 1/2 | 1 | 1/3 | 0.1811 | |
| B9 | 7 | 3 | 3 | 1 | 0.5342 | |
| Importance of Criteria Layer Indexes | B10 | B11 | B12 | ||
|---|---|---|---|---|---|
| Medical system A3 | B10 | 1 | 1/2 | 1/3 | 0.1571 |
| B11 | 2 | 1 | 1/2 | 0.2493 | |
| B12 | 3 | 2 | 1 | 0.5936 | |
| System Layer | Characteristic Value | Consistency Ratio CR | Whether Conformity Is Met (CR < 0.1)? |
|---|---|---|---|
| Search system A1 | 5.3766 | 0.0841 | Y |
| Rescue system A2 | 4.1634 | 0.0612 | Y |
| Medical system A3 | 3.0536 | 0.0516 | Y |
| Importance of Measure Layer Indexes | C1 | C2 | C3 | C4 | ||
|---|---|---|---|---|---|---|
| Mobilization preparation B1 | C1 | 1 | 1 | 5 | 3 | 0.4199 |
| C2 | 1 | 1 | 2 | 3 | 0.3339 | |
| C3 | 1/5 | 1/2 | 1 | 2 | 0.1427 | |
| C4 | 1/3 | 1/3 | 1/2 | 1 | 0.1036 | |
| System Layer | Criteria Layer | Measure Layer | Index Score | Subjective Weight | Objective Weight | Comprehensive Weight |
| Search system A1 | Mobilization preparation B1 | C1 | 5 | 0.0046 | 0.0276 | 0.0161 |
| C2 | 3 | 0.0037 | 0.0138 | 0.0087 | ||
| C3 | 5 | 0.0016 | 0.0276 | 0.0146 | ||
| C4 | 1 | 0.0011 | 0.0092 | 0.0052 | ||
| Action phase B2 | C5 | 3 | 0.0067 | 0.0138 | 0.0103 | |
| C6 | 1 | 0.0061 | 0.0092 | 0.0076 | ||
| C7 | 3 | 0.0017 | 0.0138 | 0.0077 | ||
| C8 | 5 | 0.0044 | 0.0276 | 0.0160 | ||
| C9 | 5 | 0.0039 | 0.0276 | 0.0157 | ||
| C10 | 3 | 0.0024 | 0.0178 | 0.0081 | ||
| C11 | 5 | 0.0030 | 0.0276 | 0.0153 | ||
| Information collection B3 | C12 | 5 | 0.0063 | 0.0276 | 0.0170 | |
| C13 | 3 | 0.0156 | 0.0138 | 0.0147 | ||
| C14 | 1 | 0.0385 | 0.0092 | 0.0239 | ||
| Search capability B4 | C15 | 3 | 0.0256 | 0.0138 | 0.0202 | |
| C16 | 5 | 0.0074 | 0.0276 | 0.0175 | ||
| C17 | 5 | 0.0082 | 0.0276 | 0.0179 | ||
| C18 | 3 | 0.0169 | 0.0138 | 0.0154 | ||
| Search effect B5 | C19 | 5 | 0.0873 | 0.0118 | 0.0495 | |
| C20 | 3 | 0.0436 | 0.0138 | 0.0287 | ||
| C21 | 5 | 0.0436 | 0.276 | 0.0356 | ||
| Rescue system A2 | Mobilization preparation B6 | C22 | 1 | 0.0072 | 0.0092 | 0.0082 |
| C23 | 3 | 0.0046 | 0.0138 | 0.0092 | ||
| C24 | 5 | 0.0038 | 0.0276 | 0.0157 | ||
| C25 | 5 | 0.0020 | 0.0276 | 0.0148 | ||
| C26 | 1 | 0.0021 | 0.0092 | 0.0057 | ||
| Rescue action B7 | C27 | 5 | 0.0143 | 0.0276 | 0.0209 | |
| C28 | 3 | 0.0036 | 0.0138 | 0.0087 | ||
| C29 | 3 | 0.0111 | 0.0138 | 0.0124 | ||
| C30 | 1 | 0.0086 | 0.0092 | 0.0089 | ||
| C31 | 3 | 0.0082 | 0.0138 | 0.0110 | ||
| C32 | 5 | 0.0054 | 0.0276 | 0.0165 | ||
| C33 | 5 | 0.0240 | 0.0276 | 0.0258 | ||
| Rescue capability B8 | C34 | 3 | 0.0039 | 0.0138 | 0.0088 | |
| C35 | 5 | 0.0223 | 0.0276 | 0.0250 | ||
| C36 | 1 | 0.0111 | 0.0092 | 0.0102 | ||
| C37 | 3 | 0.0165 | 0.0138 | 0.0152 | ||
| C38 | 1 | 0.0065 | 0.0092 | 0.0078 | ||
| Rescue effect B9 | C39 | 5 | 0.1134 | 0.0276 | 0.0705 | |
| C40 | 3 | 0.0186 | 0.0138 | 0.0162 | ||
| C41 | 5 | 0.0460 | 0.0276 | 0.0368 | ||
| Medical system A3 | Mobilization phase B10 | C42 | 3 | 0.0182 | 0.0138 | 0.0160 |
| C43 | 5 | 0.0182 | 0.0276 | 0.0229 | ||
| C44 | 3 | 0.0051 | 0.0138 | 0.0094 | ||
| C45 | 3 | 0.0108 | 0.0138 | 0.0123 | ||
| Action phase B11 | C46 | 1 | 0.0061 | 0.0092 | 0.0076 | |
| C47 | 1 | 0.0044 | 0.0092 | 0.0068 | ||
| C48 | 5 | 0.0262 | 0.0276 | 0.0269 | ||
| C49 | 5 | 0.0247 | 0.0276 | 0.0261 | ||
| C50 | 3 | 0.0094 | 0.0138 | 0.0116 | ||
| C51 | 3 | 0.0124 | 0.0276 | 0.0200 | ||
| Medical summary B12 | C52 | 3 | 0.0454 | 0.0138 | 0.0296 | |
| C53 | 3 | 0.0241 | 0.0138 | 0.0190 | ||
| C54 | 5 | 0.1283 | 0.0276 | 0.0779 |
Publisher’s Note: MDPI stays neutral with regard to jurisdictional claims in published maps and institutional affiliations. |
© 2022 by the authors. Licensee MDPI, Basel, Switzerland. This article is an open access article distributed under the terms and conditions of the Creative Commons Attribution (CC BY) license (https://creativecommons.org/licenses/by/4.0/).
Share and Cite
Huang, S.; Chen, Y.; Feng, X.; Qiao, T.; Yu, D.; Yang, Y. Research on Dynamic Assessment Method of Earthquake Scene Rescue Performance Based on AHP and Cloud Model. Mathematics 2022, 10, 207. https://doi.org/10.3390/math10020207
Huang S, Chen Y, Feng X, Qiao T, Yu D, Yang Y. Research on Dynamic Assessment Method of Earthquake Scene Rescue Performance Based on AHP and Cloud Model. Mathematics. 2022; 10(2):207. https://doi.org/10.3390/math10020207
Chicago/Turabian StyleHuang, Sining, Yupeng Chen, Xusheng Feng, Tiantian Qiao, Dandan Yu, and Yongqiang Yang. 2022. "Research on Dynamic Assessment Method of Earthquake Scene Rescue Performance Based on AHP and Cloud Model" Mathematics 10, no. 2: 207. https://doi.org/10.3390/math10020207
APA StyleHuang, S., Chen, Y., Feng, X., Qiao, T., Yu, D., & Yang, Y. (2022). Research on Dynamic Assessment Method of Earthquake Scene Rescue Performance Based on AHP and Cloud Model. Mathematics, 10(2), 207. https://doi.org/10.3390/math10020207