Article

Dynamics of a Stochastic HIV Infection Model with Logistic Growth and CTLs Immune Response under Regime Switching

College of Mathematics and System Sciences, Xinjiang University, Urumqi 830017, China
*
Author to whom correspondence should be addressed.
These authors contributed equally to this work.
Mathematics 2022, 10(19), 3472; https://doi.org/10.3390/math10193472
Submission received: 17 August 2022 / Revised: 14 September 2022 / Accepted: 17 September 2022 / Published: 23 September 2022
(This article belongs to the Section E3: Mathematical Biology)

Abstract

:
Considering the influences of uncertain factors on the reproduction of virus in vivo, a stochastic HIV model with CTLs’ immune response and logistic growth was developed to research the dynamics of HIV, where uncertain factors are white noise and telegraph noise. which are described by Brownian motion and Markovian switching, respectively. We show, firstly, the existence of global positive solutions of this model. Further, by constructing suitable stochastic Lyapunov functions with regime switching, some sufficient conditions for the existence and uniqueness of the stationary distribution and the conditions for extinction are obtained. Finally, the main results are explained by some numerical examples. Theoretical analysis and numerical simulation show that low-intensity white noise can maintain the persistence of the virus, and high intensity white noise can make the virus extinct after a period of time with multi-states.

1. Introduction

Human immunodeficiency virus (HIV) is a lentivirus and belongs to the retrovirus family, which directly invades the human immune system, infects human immune cells and destroys the cellular and humoral immunity of the organism. HIV mainly exists in the body fluids and various organs of infected persons, and can be transmitted through the exchange of body fluids containing HIV or organ transplantation. In particular, HIV is transmitted mainly by sexual contact, blood transmission, mother-to-child transmission and so on. The World Health Organization (WHO) estimates that 37.7 million people are living with HIV in 2020, that more than 0.68 million people died from HIV-related diseases in the same year and that there were 1.5 million new infections [1]. Although the number of deaths has fallen from earlier years, the number of new cases remains high.
In order to better realize the spread and treatment of HIV in vivo, a lot of medical scientists and mathematicians have been performing studies recently. From the point of view of mathematical modeling, a large number of models described by ordinary differential equations have been developed to describe the evolution of viruses and to search the optimal strategies for elimination and control [2,3,4,5].
Actually, in the course of disease treatment, organisms are inevitably disturbed by some external and internal factors, including temperature, humidity, diet, emotion, etc. These disturbances have an extremely important impact on the metabolism of all kinds of cells in vivo. Based on this, a great deal of stochastic virus models have been established to describe the influences of uncertain factors [6,7,8,9,10]. More explicitly, Shi et al. [11] investigated a stochastic virus model with saturation functional responses, and obtained some sufficient conditions for the stochastic asymptotical stability of the infected equilibrium and uninfected equilibrium. Ji [12] considered a HIV-1 model with stochastic perturbation and Beddington–DeAngelis functional responses, and discussed the extinction of virus and the existence of a stationary distribution through constructing a suitable Lyapunov function. In additional, Khan et al. [13] also formulated a Hepatitis B model with the effect of a stochastic fluctuation environment, and established some sufficient conditions for the extinction and persistence of the virus.
On the other hand, it is well known that strong perturbation, that is, telegraph noise, can cause the system to switch from one state to another, and the transformation between different states is often memory-less. Therefore, this process can be accurately described by Markov switching, while in different states, organisms adhere to different evolutionary laws. From this perspective, the finite state Markov chain are used to model the regime-switching [14,15,16,17,18,19,20]. Particularly, Settati et al. [21] were concerned with a n-species model of facultative mutualism in random environments, established some sufficient conditions to ensure the positive recurrent and also showed the existence of a unique ergodic stationary distribution. Guo et al. [22] formulated a SIR model with a nonlinear incident rate and Markovian switching, and analyzed the extinction of disease and the ergodicity of solutions. Liu et al. [23] introduced the periodic DS-I-A model with Markovian switching, obtained the existence of the nontrivial positive periodic solution for this model and proved the existence of an ergodic stationary distribution and some sufficient conditions for extinction of disease.
Motivated by these facts, we propose a stochastic HIV infection model with logistic growth and a CTL immune response to discuss the effects of white noise and telephone noise. The rest of this paper is structured as follows. In Section 2, some definitions and known conclusions to be used in subsequent proofs are given. In Section 3, non-negative and stochastic boundedness of the solution of our model are investigated. In Section 4, by constructing a suitable Lyapunov function, the existence of a unique stationary distribution is proved. In Section 5, the sufficient conditions for the extinction of this model are obtained by theoretical analysis. Numerical simulations and a brief conclusion are presented in Section 6 and Section 7, respectively.

2. Model and Preliminaries

A general virus model made of nonlinear ordinary differential equations is proposed in reference [24]. The model is formulated as
d T ( t ) d t = λ d T ( t ) + r T 1 T ( t ) T max β T ( t ) V ( t ) , d T * ( t ) d t = β T ( t ) V ( t ) δ T * ( t ) q T * ( t ) E ( t ) , d V ( t ) d t = δ N T * ( t ) c V ( t ) , d E ( t ) d t = p T * ( t ) E ( t ) d E E ( t ) ,
where T ( t ) , T * ( t ) , V ( t ) and E ( t ) represent the concentrations of susceptible CD 4 + T cells, infected CD 4 + T cells, free HIV virus and cytotoxic T lymphocytes (CTLs; their action is to clear infected CD 4 + T cells) in vivo, respectively. The meanings and possible values of the other parameters of this model are shown in Table 1.
Considering the influences of uncertain factors, it is assumed that the mortality rates of cells are affected by white noise in model (1); that is, d d σ 1 dB 1 ( t ) , δ σ 2 dB 2 ( t ) , c c σ 3 dB 3 ( t ) and d E σ 4 dB 4 ( t ) . Further, assume that virus and cellular tissues in vivo are also affected by telegraph noise, which is proposed to describe the transform of viruses among different states. Now, a stochastic HIV infection model reads as
d T ( t ) = λ ( ξ ( t ) ) d ( ξ ( t ) ) T ( t ) + r ( ξ ( t ) ) T ( t ) 1 T ( t ) T max ( ξ ( t ) ) β ( ξ ( t ) ) T ( t ) V ( t ) d t + σ 1 ( ξ ( t ) ) T ( t ) d B 1 ( t ) , d T * ( t ) = β ( ξ ( t ) ) T ( t ) V ( t ) δ ( ξ ( t ) ) T * ( t ) q ( ξ ( t ) ) T * ( t ) E ( t ) d t + σ 2 ( ξ ( t ) ) T * ( t ) d B 2 ( t ) , d V ( t ) = N ( ξ ( t ) ) δ ( ξ ( t ) ) T * ( t ) c ( ξ ( t ) ) V ( t ) d t + σ 3 ( ξ ( t ) ) V ( t ) d B 3 ( t ) , d E ( t ) = p ( ξ ( t ) ) T * ( t ) E ( t ) d E ( ξ ( t ) ) E ( t ) d t + σ 4 ( ξ ( t ) ) E ( t ) d B 4 ( t ) ,
where ξ ( t ) , t > 0 , is a right-continuous Markovian chain with values in finite state space M = { 1 , 2 , , N ˜ } ; B 1 ( ξ ( t ) ) , B 2 ( ξ ( t ) ) , B 3 ( ξ ( t ) ) and B 4 ( ξ ( t ) ) are standard Brownian motions independent of each other, and defined on the probability space ( Ω , F , P ) ; σ i 2 is the intensity of white noise ( i = 1 , , 4 ) ; parameters λ ( k ) , d ( k ) , r ( k ) , T max ( k ) , β ( k ) , δ ( k ) , N ( k ) , c ( k ) , q ( k ) , p ( k ) , d E ( k ) and σ i ( k ) ( i = 1 , , 4 , k M ) are all positive constants. Further, based on the biological background of model (2), it may be assumed that q ( k ) p ( k ) , k M .
Denote R + n = { ( x 1 , , x n ) : x i > 0 } , and let ( Ω , F , { F t } t > 0 , P ) be a complete probability space with a filtration { F t } t > 0 satisfying the usual conditions; that is, it is increasing and right continuous while F 0 contains all P null sets. For any vector g = ( g ( 1 ) , , g ( N ˜ ) ) and f ( t ) L 1 ( [ 0 , ) ; R ) , denote g ^ = min k M { g ( k ) } , g ˇ = max k M { g ( k ) } and f = t 1 0 t f ( s ) d s , t > 0 .
Assume that the Markov chain ( ξ ( t ) ) t 0 is irreducible and has the generator Γ ˜ = ( γ i j ) N ˜ × N ˜
P { ξ ( t + ) = j | ξ ( t ) = i } = γ i j + o ( ) , if i j , 1 + γ i i + o ( ) , if i = j ,
where > 0 , γ i j > 0 is the transition rate from state i to j, if i j while i j γ i j = γ i i . It is well known that ( ξ ( t ) ) t 0 admits a unique stationary distribution π = ( π 1 , , π N ˜ ) which can be determined by π Γ ˜ = 0 , subject to Σ k = 1 N ˜ π k = 1 and π k > 0 for k M .
The following Lemma 1 is on the generalized Itô’s formula (see, e.g., ([27], p. 48) and ([28], p. 104), which will be used repeatedly in the following paragraphs.
Lemma 1.
Assume that x ( t ) is the Markovian process and satisfies the stochastic differential
d x ( t ) = b ( x ( t ) , ξ ( t ) ) d t + σ ( x ( t ) , ξ ( t ) ) dB ( t ) , x ( 0 ) = x 0 , ξ ( 0 ) = ξ ,
where b ( · , · ) L 1 ( R n × M ; R n ) , σ ( · , · ) L 2 ( R n × M ; R n × n ) , and
D ( x , ξ ( t ) ) = σ ( x , ξ ( t ) ) σ T ( x , ξ ( t ) ) = d i j ( x , ξ ( t ) ) .
Let V ˜ ( x ( t ) , ξ ( t ) ) be a function with a twice-continuous derivative for any ξ ( t ) M ; then, function V ˜ ( x ( t ) , ξ ( t ) ) is a real-valued Itô process, and its stochastic differential is given by
d V ˜ ( x ( t ) , ξ ( t ) ) = L V ˜ ( x ( t ) , ξ ( t ) ) d t + V ˜ x ( x ( t ) , ξ ( t ) ) σ ( x ( t ) , ξ ( t ) ) dB ( t ) ,
where the differential operator L V ˜ with (3) is defined by
L V ˜ ( x , ξ ( t ) ) = i = 1 n b i ( x , ξ ( t ) ) V ˜ ( x , ξ ( t ) ) x i + 1 2 i , j = 1 n d i j ( x , ξ ( t ) ) 2 V ˜ ( x , ξ ( t ) ) x i x j + l = 1 N ˜ ξ k l V ˜ ( x , l ) .
In order to prove the stationary distribution in the following paper, we introduce a useful lemma which comes from reference [29].
Lemma 2
(see Theorem 3.13 in reference [29]). If the following conditions hold:
( i )
for any i j , γ i j > 0 ;
( ii )
D ( x , k ) = ( d i j ( x , k ) ) is symmetric for each k M , and satisfies
λ | ζ | 2 ζ T D ( x , k ) ζ λ 1 | ζ | 2 f o r a n y ζ R n
with some constant λ ( 0 , 1 ] for all x R n ;
( iii )
there is a nonempty open set D with compact closure and a twice continuously differential function V ˜ ( · , k ) : D c R + such that, for positive constant α and k M ,
L V ˜ ( x , k ) α , ( x , k ) D c × M ;
then the solution ( X ( t ) , ξ ( t ) ) of model (3) is positive recurrent and ergodic. That is, there is a unique stationary distribution μ ( · , · ) such that for any Borel measurable function f ( · , · ) : R n × M R , the inequality
k = 1 N ˜ R n | f ( x , k ) | μ ( d x , k ) <
holds, and
P lim t 1 t 0 t f ( X ( s ) , ξ ( s ) ) d s = k = 1 N ˜ R n f ( x , k ) μ ( d x , k ) = 1 .

3. Global Positive Solutions and Boundedness

Before discussing the stochastic dynamics of model (2), the nonnegativity and global existence of its solutions are required. The proof of the following result analogy to the method of Theorem 2.1 is in reference [30].
Theorem 1.
For any initial value ( T ( 0 ) , T * ( 0 ) , V ( 0 ) , E ( 0 ) , ξ ( 0 ) ) R + 4 × M , model (2) admits a unique positive solution ( T ( t ) , T * ( t ) , V ( t ) , E ( t ) , ξ ( t ) ) on t 0 which remains in R + 4 with probability one. That is, ( T ( t ) , T * ( t ) , V ( t ) , E ( t ) , ξ ( t ) ) R + 4 × M for t 0 almost surely ( a . s . ) .
Proof. 
Note that the right end of model (2) is local Lipschitz continuous; then, for any initial value ( T ( 0 ) , T * ( 0 ) , V ( 0 ) , E ( 0 ) , ξ ( 0 ) ) R + 4 × M , there is a unique solution ( T ( t ) , T * ( t ) , V ( t ) , E ( t ) , ξ ( t ) ) on interval [ 0 , τ e ) a.s., where τ e is the explosion time. To demonstrate that the solution is global, it only requires proving that τ e = a.s. To do so, choose an integer n 0 large enough to make 1 / n 0 T ( 0 ) , T * ( 0 ) , V ( 0 ) , E ( 0 ) n 0 . For integer n n 0 , define the stopping time as Theorem 3.13 in reference [29]: τ n = inf { t [ 0 , τ e ] : min { T ( t ) , T * ( t ) , V ( t ) , E ( t ) } 1 / n or max { T ( t ) , T * ( t ) , V ( t ) , E ( t ) } n } . Here, set inf = , and ∅ represents the empty set. It follows from the definition of τ n that τ n is increasing as n . Now, let τ = lim t τ n ; then, τ τ e a.s. If one can get τ = a.s., then τ e = and T ( t ) , T * ( t ) , V ( t ) , E ( t ) , ξ ( t ) R + 4 × M for all t > 0 a.s. Therefore, it is only needed to show that τ = a.s. If the claim is invalid, then there is a pair of positive constants T ˜ and ϵ ( 0 , 1 ) such that P { τ T ˜ } > ϵ . Thus, there exists an integer n 1 n 0 such that
P τ n T ˜ ϵ f o r a n y n > n 1 .
Choose a function V ˜ : R + 4 × M R + as follows:
V ˜ = T a a ln T a + T * b b ln T * b + V 1 ln V N ˇ + 1 p ˇ E m m ln E m ,
where a, b and m are positive constants which are determined later. Applying the generalized Itô’s formula to V ˜ yields
d V ˜ ( T ( t ) , T * ( t ) , V ( t ) , E ( t ) ) = L V ˜ d t + 1 a T σ 1 ( ξ ( t ) ) T dB 1 ( t ) + 1 b T * σ 2 ( ξ ( t ) ) T * dB 2 ( t ) + 1 N ˇ 1 1 V σ 3 ( ξ ( t ) ) V dB 3 ( t ) + 1 p ˇ 1 m E σ 4 ( ξ ( t ) ) E dB 4 ( t ) ,
where L V ˜ : R + 4 R + is defined by
L V ˜ = λ ( ξ ( t ) ) d ( ξ ( t ) ) T + r ( ξ ( t ) ) T 1 T T max ( ξ ( t ) ) β ( ξ ( t ) ) T V a T λ ( ξ ( t ) ) d ( ξ ( t ) ) T + r ( ξ ( t ) ) T 1 T T max ( ξ ( t ) ) β ( ξ ( t ) ) T V + β ( ξ ( t ) ) T V q ( ξ ( t ) ) T * E b T * [ β ( ξ ( t ) ) T V q ( ξ ( t ) ) T * E δ ( ξ ( t ) ) T * ] + N ( ξ ( t ) ) δ ( ξ ( t ) ) T * c ( ξ ( t ) ) V + c ( ξ ( t ) ) N ˇ N ( ξ ( t ) ) δ ( ξ ( t ) ) T * N ˇ V + 1 p ˇ P ( ξ ( t ) ) T * E d E ( ξ ( t ) ) E m p ( ξ ( t ) ) T * + m d E ( ξ ( t ) ) + m σ 4 2 ( ξ ( t ) ) 2 δ ( ξ ( t ) ) T * + a σ 1 2 ( ξ ( t ) ) 2 + σ 3 2 ( ξ ( t ) ) 2 N ˇ + b σ 2 2 ( ξ ( t ) ) 2 = r ( ξ ( t ) ) T max ( ξ ( t ) ) T 2 + r ( ξ ( t ) ) + a r ( ξ ( t ) ) T max ( ξ ( t ) ) d ( ξ ( t ) ) T a λ ( ξ ( t ) ) T q ( ξ ( t ) ) T * E b β ( ξ ( t ) ) T * T V N ( ξ ( t ) ) δ ( ξ ( t ) ) T * N ˇ V + a β ( ξ ( t ) ) c ( ξ ( t ) ) N ˇ V + λ ( ξ ( t ) ) + a d ( ξ ( t ) ) a r ( ξ ( t ) ) + b q ( ξ ( t ) ) E + 1 2 a σ 1 2 ( ξ ( t ) ) δ ( ξ ( t ) ) T * + 1 N ˇ N ( ξ ( t ) ) δ ( ξ ( t ) ) T * + b δ ( ξ ( t ) ) + 1 2 b σ 2 2 ( ξ ( t ) ) + σ 3 2 ( ξ ( t ) ) 2 N ˇ + c ( ξ ( t ) ) N ˇ 1 p ˇ d E ( ξ ( t ) ) E + 1 p ˇ p ( ξ ( t ) ) T * E m p ˇ p ( ξ ( t ) ) T * + m p ˇ d E ( ξ ( t ) ) + 1 2 p ˇ m σ 4 2 ( ξ ( t ) ) r ^ T ˇ max T 2 + r ˇ d ^ + a r ˇ 1 T ^ max T + a β ˇ c ^ N ˇ V + b q ˇ d E ^ p ˇ E + p p ˇ q T * E + N N ˇ δ m p p ˇ T * + λ ˇ + a d ˇ + 1 2 a σ ˇ 1 2 + b δ ˇ + 1 2 b σ ˇ 2 2 + 1 2 N ˇ σ ˇ 3 2 + c ˇ N ˇ + m p ˇ d E + 1 2 p ˇ m σ 4 2 T ˇ max r ˇ d ^ + a r ˇ 1 T ^ max 2 4 r ^ + a β ˇ c ^ N ˇ V + b q ˇ d E ^ p ˇ E + δ ˇ m p ^ p ˇ T * + λ ˇ + a d ˇ + 1 2 a σ ˇ 1 2 + b δ ˇ + 1 2 b σ ˇ 2 2 + 1 2 N ˇ σ ˇ 3 2 + c ˇ N ˇ + m d E ˇ p ˇ + 1 2 p ˇ m σ ˇ 4 2 .
Choose a = c ^ / β ˇ N ˇ , b = d E ^ / q ˇ p ˇ and m = δ ˇ p ˇ / p ^ such that a β ˇ c ^ / N ˇ = 0 , b q ˇ d E ^ / p ˇ = 0 and δ ˇ m p ^ / p ˇ = 0 . Then,
L V ˜ T ˇ max ( r ˇ d ^ + a r ˇ T ^ max ) 2 4 r ^ + λ ˇ + a d ˇ + σ ˇ 1 2 a 2 + b δ ˇ + b σ ˇ 2 2 2 + σ ˇ 3 2 2 N ˇ + c ˇ N ˇ + d E ˇ m p ˇ + m σ ˇ 4 2 2 p ˇ : = K ,
where K is a positive constant. Therefore,
E V ˜ T ( τ k T ˜ ) , T * ( τ k T ˜ ) , V ( τ k T ˜ ) , E ( τ k T ˜ ) V ˜ T ( 0 ) , T * ( 0 ) , V ( 0 ) , E ( 0 ) + K E τ k T ˜ V ˜ T ( 0 ) , T * ( 0 ) , V ( 0 ) , E ( 0 ) + K T ˜ .
Set Ω n = { τ n T ˜ } for n n 1 . It yields from (4) that P ( Ω n ) ϵ . Note that for every ω Ω n , at least one of T ( τ n , ω ) , T * ( τ n , ω ) , V ( τ n , ω ) or E ( τ n , ω ) equals either n or 1 / n . Thus,
V ˜ T ( τ n , ω ) , T * ( τ n , ω ) , V ( τ n , ω ) , E ( τ n , ω ) n 1 ln n 1 / n 1 + ln n .
Consequently,
V ˜ T ( 0 ) , T * ( 0 ) , V ( 0 ) , E ( 0 ) + K T ˜ E I Ω n ( ω ) V ˜ T ( τ n , ω ) , T * ( τ n , ω ) , V ( τ n , ω ) , E ( τ n , ω ) ϵ n 1 ln n ( 1 / n 1 + ln n ) ,
where I Ω n ( ω ) is the indicator function of Ω n . By letting n , one can obtain that
> V ˜ ( T ( 0 ) , T * ( 0 ) , V ( 0 ) ) , E ( 0 ) ) + K T ˜ = .
This is a contradiction, so one has τ = . The proof is completed.  □
The next result is on the stochastic ultimately boundedness in the mean for stochastic model (2).
Lemma 3.
Assume that T ( t ) , T * ( t ) , V ( t ) , E ( t ) , ξ ( t ) is the solution of model (2) satisfying the initial value ( T ( 0 ) , T * ( 0 ) ,   V ( 0 ) , E ( 0 ) , ξ ( 0 ) ) R + 4 × M ; then,
lim sup t T ( t ) + T * ( t ) + 1 2 N ˇ V ( t ) + q ^ p ˇ E ( t ) < a . s .
Moreover,
lim sup t 1 t 0 t T ( s ) + T * ( s ) + 1 2 N ˇ V ( s ) + q ^ p ˇ E ( s ) d s M 0 m a . s . ,
where m = min { d ^ , δ ^ / 2 , c ^ , d E ^ } , M 0 = T ˇ max r ˇ 2 / 4 r ^ + λ ˇ .
Proof. 
By model (2), one has
d T ( t ) + T * ( t ) + 1 2 N ˇ V ( t ) + q ^ p ˇ E ( t ) = [ λ ( ξ ( t ) ) d ( ξ ( t ) ) T + r ( ξ ( t ) ) T 1 T T max ( ξ ( t ) ) δ ( ξ ( t ) ) T * q ( ξ ( t ) ) T * E + N ( ξ ( t ) ) δ ( ξ ( t ) ) T * 2 N ˇ V c ( ξ ( t ) ) 2 N ˇ + q ^ p ( ξ ( t ) ) T * E q ^ d E ( ξ ( t ) ) E p ˇ ] d t + σ 1 ( ξ ( t ) ) T dB 1 ( t ) + σ 2 ( ξ ( t ) ) T * dB 2 ( t ) + σ 3 ( ξ ( t ) ) V 2 N ˇ dB 3 ( t ) + q ^ p ˇ σ 4 ( ξ ( t ) ) E dB 4 ( t ) [ λ ( ξ ( t ) ) d ( ξ ( t ) ) T + r ( ξ ( t ) ) T r ( ξ ( t ) ) T max ( ξ ( t ) ) T 2 δ ( ξ ( t ) ) 2 T * c ( ξ ( t ) ) 2 N ˇ V q ^ p ˇ d E ξ ( t ) E ] d t + σ 1 ( ξ ( t ) ) T dB 1 ( t ) + σ 2 ( ξ ( t ) ) T * dB 2 ( t ) + 1 2 N ˇ σ 3 ( ξ ( t ) ) V dB 3 ( t ) + q ^ p ˇ σ 4 ( ξ ( t ) ) E dB 4 ( t ) d ^ T δ ^ 2 T * c ^ 2 N ˇ V + r ˇ T q ^ p ˇ d E ^ E r ^ T ˇ max T 2 + λ ˇ d t + σ 1 ( ξ ( t ) ) T dB 1 ( t ) + σ 2 ( ξ ( t ) ) T * dB 2 ( t ) + 1 2 N ˇ σ 3 ( ξ ( t ) ) V dB 3 ( t ) + q ^ p ˇ σ 4 ( ξ ( t ) ) E dB 4 ( t ) m T + T * + 1 2 N ˇ V + q ^ p ˇ E + M 0 d t + σ 1 ( ξ ( t ) ) T dB 1 ( t ) + σ 2 ( ξ ( t ) ) T * dB 2 ( t ) + 1 2 N ˇ σ 3 ( ξ ( t ) ) V dB 3 ( t ) + q ^ p ˇ σ 4 ( ξ ( t ) ) E dB 4 ( t ) ,
where m = min { d ^ , δ ^ / 2 , c ^ , d E ^ } , M 0 = T ˇ max r ˇ 2 / 4 r ^ + λ ˇ . The remainder of the proof is similar to Lemma 2.3 in reference [31]; hence, we omit it here. The proof is completed.  □

4. Existence of an Ergodic Stationary Distribution

Unlike deterministic model (1), stochastic model (2) has no the endemic equilibrium due to the effects of stochastic perturbation. Therefore, we consider the existence and uniqueness of the ergodic stationary distribution in this section, which implies that virus is persistent in vivo. To do so, we define a threshold value
R 0 s = k = 1 N ˜ π k λ ( k ) β ( k ) N ( k ) δ ( k ) p ( k ) 4 4 a b l k = 1 N ˜ π k λ ( k ) T ˜ 0 ( k ) + 1 2 σ 1 2 ( k ) ,
where
T ˜ 0 ( k ) = T max ( k ) 2 r ( k ) r ( k ) d ( k ) + ( r ( k ) d ( k ) ) 2 + 4 r ( k ) λ ( k ) T max ( k ) , k M ,
a = k = 1 N ˜ π k δ ( k ) + q ( k ) + σ 2 2 ( k ) , b = k = 1 N ˜ π k c ( k ) + σ 3 2 ( k ) 2 , l = k = 1 N ˜ π k d E ( k ) + σ 4 2 ( k ) 2 .
Theorem 2.
If R 0 s > 1 , 2 δ ^ > σ ˇ 2 2 , 2 c ^ > σ ˇ 3 2 and 2 d E ^ > σ ˇ 4 2 , then solution ( T ( t ) , T * ( t ) , V ( t ) , E ( t ) , ξ ( t ) ) of model (2) satisfying the initial value ( T ( 0 ) , T * ( 0 ) , V ( 0 ) , E ( 0 ) , ξ ( 0 ) ) R + 4 × M admits a unique, ergodic stationary distribution.
Proof. 
In order to complete the proof of Theorem 2, it is sufficient to verify all conditions of Lemma 2. Obviously, condition ( i ) is held from the preliminaries. Now, we prove the condition ( ii ) . For a sufficiently large number m, let
D = 1 m , m × 1 m , m × 1 m , m × 1 m , m R + 4 .
Then, D ¯ R + 4 . Note that D ( T , T * , V , E , k ) = d i a g ( σ 1 2 ( k ) T 2 , σ 2 2 ( k ) ( T * ) 2 , σ 3 2 ( k ) V 2 , σ 4 2 ( k ) E 2 ) , which is positive definite. Then, 0 < λ min D ( T , T * , V , E , k ) λ max D ( T , T * , V , E , k ) , and for all ζ D ,
λ min D ( T , T * , V , E , k ) | ζ | 2 ζ T D ( T , T * , V , E , k ) ζ λ max D ( T , T * , V , E , k ) | ζ | 2 .
It is easy to see that λ max D ( T , T * , V , E , k ) and λ min D ( T , T * , V , E , k ) are two continuous functions of T, T * , V and E; then,
λ ^ = min ( T , T * , V , E , k ) D ¯ × M λ min D ( T , T * , V , E , k ) > 0 , λ ˇ = max ( T , T * , V , E , k ) D ¯ × M { λ max D ( T , T * , V , E , k ) } > 0 .
Therefore,
λ | ζ | 2 ζ T D ( T , T * , V , E , k ) ζ λ 1 | ζ | 2 ,
where λ = min { λ ^ , λ ˇ 1 , 1 } . Therefore, the condition ( ii ) of Lemma 2 is valid.
Next, we turn to the ( iii ) . Choose a function W 1 : R + 4 R with
W 1 = ln T + c 1 1 T * c 2 ln V c 3 ln E .
By using the generalized Itô’s formula, it follows that
L W 1 = λ ( ξ ( t ) ) T c 1 β ( ξ ( t ) ) T V T * c 2 N ( ξ ( t ) ) δ ( ξ ( t ) ) V T * c 3 p ( ξ ( t ) ) T * + d ( ξ ( t ) ) r ( ξ ( t ) ) + r ( ξ ( t ) ) T T max ( ξ ( t ) ) + β ( ξ ( t ) ) V + c 1 δ ( ξ ( t ) ) + q ( ξ ( t ) ) E T * + 1 2 σ 1 2 ( ξ ( t ) ) + c 1 T * σ 2 2 ( ξ ( t ) ) + c 2 c ( ξ ( t ) ) + 1 2 c 2 σ 3 2 ( ξ ( t ) ) + c 3 d E ( ξ ( t ) ) + 1 2 c 3 σ 4 2 ( ξ ( t ) ) 4 c 1 c 2 c 3 λ ( ξ ( t ) ) β ( ξ ( t ) ) N ( ξ ( t ) ) δ ( ξ ( t ) ) p ( ξ ( t ) ) 4 + c 1 ( δ ( ξ ( t ) ) + q ( ξ ( t ) ) + σ 2 2 ( ξ ( t ) ) ) + c 2 c ( ξ ( t ) ) + 1 2 σ 3 2 ( ξ ( t ) ) + c 3 d E ( ξ ( t ) ) + 1 2 σ 4 2 ( ξ ( t ) ) + d ( ξ ( t ) ) r ( ξ ( t ) ) + r ( ξ ( t ) ) T T max ( ξ ( t ) ) + β ( ξ ( t ) ) V + 1 2 σ 1 2 ( ξ ( t ) ) .
Let
c 1 4 = k = 1 N ˜ π k ( λ ( k ) β ( k ) N ( k ) δ ( k ) p ( k ) ) 1 4 k = 1 N ˜ π k ( δ ( k ) + q ( k ) + σ 2 2 ( k ) ) 2 k = 1 N ˜ π k ( c ( k ) + 1 2 σ 3 2 ( k ) ) k = 1 N ˜ π k ( d E ( k ) + 1 2 σ 4 2 ( k ) ) 4 ,
c 2 4 = k = 1 N ˜ π k ( λ ( k ) β ( k ) N ( k ) δ ( k ) p ( k ) ) 1 4 k = 1 N ˜ π k ( δ ( k ) + q ( k ) + σ 2 2 ( k ) ) k = 1 N ˜ π k ( c ( k ) + 1 2 σ 3 2 ( k ) ) 2 k = 1 N ˜ π k ( d E ( k ) + 1 2 σ 4 2 ( k ) ) 4 , c 3 4 = k = 1 N ˜ π k ( λ ( k ) β ( k ) N ( k ) δ ( k ) p ( k ) ) 1 4 k = 1 N ˜ π k ( δ ( k ) + q ( k ) + σ 2 2 ( k ) ) k = 1 N ˜ π k ( c ( k ) + 1 2 σ 3 2 ( k ) ) k = 1 N ˜ π k ( d E ( k ) + 1 2 σ 4 2 ( k ) ) 2 4 ,
and then
L W 1 k = 1 N ˜ π k ( λ ( k ) β ( k ) N ( k ) δ ( k ) p ( k ) ) 1 4 4 k = 1 N ˜ π k ( δ ( k ) + q ( k ) + σ 2 2 ( k ) ) k = 1 N ˜ π k ( c ( k ) + 1 2 σ 3 2 ( k ) ) k = 1 N ˜ π k ( d E ( k ) + 1 2 σ 4 2 ( k ) ) r ( k ) + d ( k ) + r ( k ) T T max ( k ) + β ˇ V + 1 2 σ 1 2 ( k ) .
Choose that a W 2 : R + 4 R for W 2 = T / T ˜ 0 , where T ˜ 0 is a constant. Then,
L W 2 = 1 T ˜ 0 λ ( ξ ( t ) ) d ( ξ ( t ) ) T + r ( ξ ( t ) ) T r ( ξ ( t ) ) T 2 T max ( ξ ( t ) ) β ( ξ ( t ) ) T V λ ( k ) T ˜ 0 ( k ) + r ( k ) d ( k ) T ˜ 0 ( k ) T r ( k ) T ˜ 0 ( k ) T max ( k ) T 2 .
Define U 1 = W 1 + W 2 . It follows that
L U 1 k = 1 N ˜ π k ( λ ( k ) β ( k ) N ( k ) δ ( k ) p ( k ) ) 1 4 4 k = 1 N ˜ π k ( δ ( k ) + q ( k ) + σ 2 2 ( k ) ) k = 1 N ˜ π k ( c ( k ) + 1 2 σ 3 2 ( k ) ) k = 1 N ˜ π k ( d E ( k ) + 1 2 σ 4 2 ( k ) ) + d ( k ) r ( k ) + r ( k ) T T max ( k ) + β ˇ V + 1 2 σ 1 2 ( k ) + λ ( k ) T ˜ 0 ( k ) + r ( k ) d ( k ) T ˜ 0 ( k ) T r ( k ) T ˜ 0 T max ( k ) T 2 = k = 1 N ˜ π k ( λ ( k ) β ( k ) N ( k ) δ ( k ) p ( k ) ) 1 4 4 k = 1 N ˜ π k δ ( k ) + q ( k ) + σ 2 2 ( k ) k = 1 N ˜ π k c ( k ) + σ 3 2 ( k ) 2 k = 1 N ˜ π k d E ( k ) + σ 4 2 ( k ) 2 + β ˇ V + σ 1 2 ( k ) 2 + λ ( k ) T ˜ 0 ( k ) + f ( T ) ,
where
f ( T ) = r ( k ) T ˜ 0 T max ( k ) T 2 + r ( k ) d ( k ) T ˜ 0 ^ + r ( k ) T max ( k ) T + d ( k ) r ( k ) r ^ T ˜ 0 ^ T ˇ max T 2 + r ˇ d ^ T ˜ 0 ^ + r ˇ T ^ max T + d ˇ r ^ T ˇ max T ˜ 0 ^ 4 r ^ r ˇ d ^ T ˜ ^ 0 + r ˇ T ^ max 2 + d ˇ r ^ : = Q ,
and T ˜ 0 ^ = min k M { T ˜ 0 } . Thus, L U 1 R 0 ( k ) + β ˇ V + Q , where
R 0 ( k ) = k = 1 N ˜ π k ( λ ( k ) β ( k ) N ( k ) δ ( k ) p ( k ) ) 1 4 4 k = 1 N ˜ π k ( δ ( k ) + q ( k ) + σ 2 2 ( k ) ) k = 1 N ˜ π k ( c ( k ) + 1 2 σ 3 2 ( k ) ) k = 1 N ˜ π k ( d E ( k ) + 1 2 σ 4 2 ( k ) ) + 1 2 σ 1 2 ( k ) + λ ( k ) T ˜ 0 ( k ) .
Let ω = ( ω ( 1 ) , , ω ( N ˜ ) ) T be the solution of the Poisson system (see reference [32]):
Γ ω = h = 1 N ˜ π h R 0 ( h ) 1 1 R 0 ,
where R 0 = ( R 0 ( 1 ) , R 0 ( 2 ) , , R 0 ( N ˜ ) ) T . This implies
l = 1 N ˜ γ k l ω ( l ) + R 0 ( k ) = k = 1 N ˜ π k R 0 ( k ) .
Then, we can get
L ( U 1 + ω ( k ) ) k = 1 N ˜ π k R 0 ( k ) + β ˇ V + Q = B + β ˇ V + Q ,
where
B = k = 1 N ˜ π k 1 2 σ 1 2 ( k ) + λ ( k ) T ˜ ^ 0 ( R 0 s 1 ) .
Define a function U : R + 4 × M R , U = M U 1 + ω ( k ) + U 2 + U 3 + U 4 + U 5 + U 6 , where
U 2 = ln T , U 3 = ln V , U 4 = 1 2 T + T * + V 2 N ˇ 2 , U 5 = 1 N ˇ δ ˇ V , U 6 = ln E .
Choose a positive constant M such that M B + C 2 , where
C = sup ( T , T * , V , E ) R + 4 { M β ˇ V + M Q + d ˇ r ^ + r ˇ T T ^ max + β ˇ V + σ ˇ 1 2 2 + c ˇ + σ ˇ 3 2 2 + d E ˇ + σ ˇ 4 2 2 r ^ T 3 4 T ˇ max 1 4 δ ^ σ ˇ 2 2 ( T * ) 2 1 4 2 c ^ σ ˇ 3 2 V 2 N ˇ 2 + F } < , F = sup ( T , T * , V , E ) R + 4 { λ ˇ T + T * + V 2 N ˇ + r ˇ T T + T * + V 2 N ˇ r ^ T 3 2 T ˇ max 1 4 δ ^ σ ˇ 2 2 ( T * ) 2 1 4 2 c ^ σ ˇ 3 2 V 2 N ˇ 2 + 1 2 σ ˇ 1 2 T 2 } < .
Obviously,
lim inf ( T , T * , V , E ) R + 4 \ U n n U ( T , T * , V , E ) = + ,
in which U n = ( 1 / n , n ) × ( 1 / n , n ) × ( 1 / n , n ) × ( 1 / n , n ) . It is easy to see that U ( T , T * , V , E , k ) is a continuous function with respect to ( T , T * , V , E ) . Hence, there is a unique minimum value point ( T ¯ , T * ¯ , V ¯ , E ¯ , k ¯ ) of U ( T , T * , V , E , k ) in R + 4 × M . Define that function U ^ : R + 4 × M R + as
U ^ ( T , T * , V , E , k ) = U ( T , T * , V , E , k ) U ( T ¯ , T * ¯ , V ¯ , E ¯ , k ¯ ) ;
then one has
L U 2 = 1 T λ ( ξ ( t ) ) d ( ξ ( t ) ) T + r ( ξ ( t ) ) T 1 T T max ( ξ ( t ) ) β ( ξ ( t ) ) T V + σ 1 2 ( ξ ( t ) ) 2 λ ^ T + d ˇ r ^ + r ˇ T T ^ max + β ˇ V + 1 2 σ ˇ 1 2 , L U 3 = 1 V N ( ξ ( t ) ) δ ( ξ ( t ) ) T * c ( ξ ( t ) ) V + 1 2 σ 3 2 ( ξ ( t ) ) N ^ δ ^ V T * + c ˇ + 1 2 σ ˇ 3 2 , L U 4 = T + T * + V 2 N ˇ [ λ ( ξ ( t ) ) d ( ξ ( t ) ) T + r ( ξ ( t ) ) T 1 T T max ( ξ ( t ) ) δ ( ξ ( t ) ) T * q ( ξ ( t ) ) T * E + 1 2 N ˇ N ( ξ ( t ) ) δ ( ξ ( t ) ) T * 1 2 N ˇ c ( ξ ( t ) ) V ] + 1 2 σ 1 2 ( ξ ( t ) ) T 2 + 1 2 σ 2 2 ( ξ ( t ) ) T * 2 + 1 2 σ 3 2 ( ξ ( t ) ) V 2 N ˇ 2 λ ˇ T + T * + V 2 N ˇ + r ˇ T T + T * + V 2 N ˇ r ^ T 3 T ˇ max δ ^ 2 ( T * ) 2 c ^ V 2 N ˇ 2 + 1 2 σ ˇ 1 2 T 2 + 1 2 σ ˇ 2 2 T * 2 + 1 2 σ ˇ 3 2 V 2 N ˇ 2 = λ ˇ T + T * + V 2 N ˇ + r ˇ T T + T * + V 2 N ˇ r ^ T 3 T ˇ max 1 2 δ ^ σ ˇ 2 2 T * 2 1 2 2 c ^ σ ˇ 3 2 V 2 N ˇ 2 + 1 2 σ ˇ 1 2 T 2 r ^ T 3 2 T ˇ max 1 4 δ ^ σ ˇ 2 2 T * 2 1 4 2 c ^ σ ˇ 3 2 V 2 N ˇ 2 + F , L U 5 = 1 N ˇ δ ˇ N ( ξ ( t ) ) δ ( ξ ( t ) ) T * c ( ξ ( t ) ) V T * c ^ N ˇ δ ˇ V , L U 6 = 1 E p ( ξ ( t ) ) T * E d E ( ξ ( t ) ) E + 1 2 σ 4 2 ( ξ ( t ) ) p ^ T * + d E ˇ + 1 2 σ ˇ 4 2 .
To sum up, we get
L U ^ M B + M β ˇ V + M Q λ ^ T + d ˇ r ^ + r ˇ T T ^ max + β ˇ V + 1 2 σ ˇ 1 2 ( N ^ δ ^ V + p ^ ) T * + c ˇ + 1 2 σ ˇ 3 2 + d E ˇ + 1 2 σ ˇ 4 2 r ^ T 3 2 T ˇ max 1 4 δ ^ σ ˇ 2 2 T * 2 1 4 2 c ^ σ ˇ 3 2 V 2 N ˇ 2 + F + T * c ^ N ˇ δ ˇ V .
Define a bounded closed set as follows:
D ε = ( T , T * , V , E ) R + 4 : ε T 1 ε , ε T * 1 ε , ε 2 V 1 ε 2 , ε E 1 ε ,
where 0 < ε < 1 is small enough such that the following inequalities hold:
( i ) λ ^ ε + H 1 , ( i i ) M B + C + ε 1 , ( i i i ) N ^ δ ^ ε p ^ + H 1 , ( i v ) H r ^ 4 T ˇ max ε 3 1 ( v ) H δ ^ σ ˇ 2 2 8 ε 2 1 , ( v i ) H 2 c ^ σ ˇ 3 2 32 ε 4 N ˇ 2 c ^ N δ ˇ ˇ ε 2 1
for R + 4 \ D ε , where
H = sup ( T , T * , V , E ) R + 3 { M β ˇ V + M Q + d ˇ r ^ + r ˇ T T ^ max + β ˇ V + 1 2 σ ˇ 1 2 + c ˇ + 1 2 σ ˇ 3 2 + d E ˇ + 1 2 σ ˇ 4 2 r ^ T 3 4 T ˇ max 1 8 δ ^ σ ˇ 2 2 T * 2 1 8 2 c ^ σ ˇ 3 2 V 2 N ˇ 2 + F + T * } < .
For convenience, we can divide R + 4 \ D ε into the following eight domains:
D 1 = ( T , T * , V , E ) R + 4 , T < ε , D 2 = ( T , T * , V , E ) R + 4 , T * < ε , D 3 = ( T , T * , V , E ) R + 4 , E < ε , D 5 = ( T , T * , V , E ) R + 4 , T > 1 / ε , D 6 = ( T , T * , V , E ) R + 4 , T * > 1 / ε , D 7 = ( T , T * , V , E ) R + 4 , V > / ε 2 ,
and D 8 = ( T , T * , V , E ) R + 4 , E > 1 / ε ,
D 4 = ( T , T * , V , E ) R + 4 , T ε , T * ε , V < ε 2 , E ε ,
Therefore, this only requires proving that L U ^ ( T , T * , V , E , k ) 1 on the above eight domains. In addition, there is no E on the left-hand side of inequality (5), so we only prove it on D 1 , D 2 , D 4 , D 5 , D 6 and D 7 .
( i )
( T , T * , V , E , k ) D 1 × M
If ( T , T * , V , E , k ) D 1 × M , it then follows that
L U ^ λ ^ T + M β ˇ V + M Q + d ˇ r ^ + r ˇ T T ^ max + β ˇ V + 1 2 σ ˇ 1 2 + c ˇ + 1 2 σ ˇ 3 2 + d E ˇ + 1 2 σ ˇ 4 2 r ^ T 3 2 T ˇ max 1 4 δ ^ σ ˇ 2 2 T * 2 1 4 2 c ^ σ ˇ 3 2 V 2 N ˇ 2 + F + T * λ ^ T + H λ ^ ε + H .
In view ( i ) of (6), we arrive at L U ^ 1 for all ( T , T * , V , E , k ) D 1 × M .
( ii )
( T , T * , V , E , k ) D 2 × M
If ( T , T * , V , E , k ) D 2 × M , one has
L U ^ M B + M β ˇ V + M Q + d ˇ r ^ + r ˇ T T ^ max + β ˇ V + 1 2 σ ˇ 1 2 + c ˇ + 1 2 σ ˇ 3 2 + d E ˇ + 1 2 σ ˇ 4 2 r ^ T 3 2 T ˇ max 1 4 δ ^ σ ˇ 2 2 T * 2 1 4 2 c ^ σ ˇ 3 2 V 2 N ˇ 2 + F + T * M B + T * + C M B + ε + C .
By condition ( i i ) of (6), we can get L U ^ 1 for all ( T , T * , V , E , k ) D 2 × M .
( iii )
( T , T * , V , E , k ) D 4 × M
If ( T , T * , V , E , k ) D 4 × M , it can be easily obtained that
L U ^ M β ˇ V + M Q + d ˇ r ^ + r ˇ T T ^ max + β ˇ V + 1 2 σ ˇ 1 2 + c ˇ + 1 2 σ ˇ 3 2 + d E ˇ + 1 2 σ ˇ 4 2 r ^ T 3 2 T ˇ max 1 4 δ ^ σ ˇ 2 2 T * 2 1 4 2 c ^ σ ˇ 3 2 V 2 N ˇ 2 + F + T * ( N ^ δ ^ V + p ^ ) T * ( N ^ δ ^ V + p ^ ) T * + H ( N ^ δ ^ ε + p ^ ) + H .
According to ( i i i ) of (6), L U ^ 1 is implied for all ( T , T * , V , E , k ) D 4 × M .
( iv )
( T , T * , V , E , k ) D 5 × M
If ( T , T * , V , E , k ) D 5 × M , this shows that
L U ^ M β ˇ V + M Q + d ˇ r ^ + r ˇ T T ^ max + β ˇ V + 1 2 σ ˇ 1 2 + c ˇ + 1 2 σ ˇ 3 2 + d E ˇ + 1 2 σ ˇ 4 2 r ^ T 3 2 T ˇ max 1 4 δ ^ σ ˇ 2 2 T * 2 1 4 2 c ^ σ ˇ 3 2 V 2 N ˇ 2 + F + T * r ^ T 3 4 T ˇ max + H r ^ 4 T ˇ max ε 3 + H .
On the basis ( i v ) of (6), we achieve that L U ^ 1 for all ( T , T * , V , E , k ) D 5 × M .
( v )
( T , T * , V , E , k ) D 6 × M
If ( T , T * , V , E , k ) D 6 × M , we can get that
L U ^ M β ˇ V + M Q + d ˇ r ^ + r ˇ T T ^ max + β ˇ V + 1 2 σ ˇ 1 2 + c ˇ + 1 2 σ ˇ 3 2 + d E ˇ + 1 2 σ ˇ 4 2 r ^ T 3 2 T ˇ max 1 4 δ ^ σ ˇ 2 2 T * 2 1 4 2 c ^ σ ˇ 3 2 V 2 N ˇ 2 + F + T * 1 8 δ ^ σ ˇ 2 2 T * 2 + H δ ^ σ ˇ 2 2 8 ε 2 + H .
In line with ( v ) of (6), we have L U ^ 1 for all ( T , T * , V , E , k ) D 6 × M .
( vi )
If ( T , T * , V , E , k ) D 7 × M
If ( T , T * , V , E , k ) D 7 × M , we obtain
L U ^ M β ˇ V + M Q + d ˇ r ^ + r ˇ T T ^ max + β ˇ V + 1 2 σ ˇ 1 2 + c ˇ + 1 2 σ ˇ 3 2 + d E ˇ + 1 2 σ ˇ 4 2 r ^ T 3 2 T ˇ max 1 4 δ ^ σ ˇ 2 2 T * 2 1 4 2 c ^ σ ˇ 3 2 V 2 N ˇ 2 + F + T * c ^ N ˇ δ ˇ V 1 8 2 c ^ σ ˇ 3 2 V 2 N ˇ 2 c ^ N ˇ δ ˇ V + H 2 c ^ σ ˇ 3 2 32 ε 4 N ˇ 2 c ^ N δ ˇ ˇ ε 2 + H .
Combine with ( vi ) of (6) that L U ^ 1 for all ( T , T * , V , E , k ) D 7 × M .
Therefore, we have the proof that L U ^ 1 for all ( T , T * , V , E , k ) ( R + 4 \ D ε ) × M . Thus, the condition ( iii ) in Lemma 2 is held, and model (2) has a unique stationary distribution which is ergodic. This proof is completed.  □
Remark 1.
What needs to be pointed out here is that model (2) with white noise, and without regime switching or the CTL immune response, admits a unique ergodic stationary distribution for
R 0 s = λ β N δ p λ T ˜ ^ 0 + 1 2 σ 1 2 δ + 1 2 q σ 2 2 c + 1 2 σ 3 2 d E + 1 2 σ 4 2 > 1 .
The expression of R 0 s in this case coincides with the threshold value of Theorem 3.1 in reference [33]. This shows that we generalize the results in the related literature. Of course, the expression of R 0 s coincides with the threshold value R 0 of the corresponding deterministic model (1) if the white noise and regime switching are not taken into account. This also implies that Theorem 2 extends the theoretical results of the deterministic model.

5. Extinction

There is no disease-free equilibrium in model (2) due to the effects of white noise, so we study the stochastic extinction of the virus. Consider a stochastic differential equation under regime switching:
d Y ( t ) = λ ( ξ ( t ) ) d ( ξ ( t ) ) Y ( t ) + r ( ξ ( t ) ) Y ( t ) 1 Y ( t ) Y max ( ξ ( t ) ) d t + σ 1 ( ξ ( t ) ) Y ( t ) dB 1 ( t )
with the initial value ( Y ( 0 ) , ξ ( 0 ) ) R + × M .
Lemma 4.
The process ( Y ( t ) , ξ ( t ) ) of Equation (7) has a unique ergodic stationary distribution μ ( Y ) which satisfies
lim t 1 t 0 t Y ( s ) d s = 0 Y μ ( Y ) d Y a . s .
Proof. 
Define a function V 1 ( Y , k ) = Y 1 ln Y . By using the generalized Itô’s formula, we can get
L V 1 ( Y , k ) = 1 1 Y λ ( k ) d ( k ) Y + r ( k ) Y 1 Y Y max ( k ) + 1 2 σ 1 2 ( k ) = λ ( k ) + d ( k ) r ( k ) + 1 2 σ 1 2 ( k ) d ( k ) Y + r ( k ) Y + r ( k ) Y Y max ( k ) r ( k ) Y 2 Y max ( k ) λ ( k ) Y : = φ ( Y , k ) .
Clearly, for every fixed k M , φ ( Y , k ) as Y 0 or Y + . Thus, there is a sufficiently large ρ > 0 such that L V 1 ( Y , k ) 1 for any ( Y , k ) D ρ c × M , where D ρ = ( 1 / ρ , ρ ) . By Lemma 2, it yields that (7) has a unique stationary distribution μ ( · ) which is ergodic. It then follows that Equation (8) is held. This completes the proof.  □
Theorem 3.
If
R 0 * = 2 β ˇ N ˇ 0 Y μ ( Y ) d Y k = 1 N ˜ π k 1 2 σ 2 2 ( k ) c ( k ) + 1 2 σ 3 2 ( k ) d E ( k ) + 1 2 σ 4 2 ( k ) < 1 ,
then solution ( T ( t ) , T * ( t ) , V ( t ) , E ( t ) , ξ ( t ) ) of model (2) satisfies
lim sup t ln N ˇ T * ( t ) + V ( t ) + E ( t ) t k = 1 N ˜ π k 2 1 2 σ 2 2 ( k ) c ( k ) + 1 2 σ 3 2 ( k ) d E ( k ) + 1 2 σ 4 2 ( k ) R 0 * 1 < 0 a . s .
Further, lim t ( T ( t ) Y ( t ) ) = 0 a.s., where ( T ( t ) , T * ( t ) , V ( t ) , E ( t ) , ξ ( t ) ) and ( Y ( t ) , ξ ( t ) ) are solutions of models (2) and (7) with ( T ( 0 ) , ξ ( 0 ) ) = ( Y ( 0 ) , ξ ( 0 ) ) , respectively.
Proof. 
Choosing that G ( t ) = N ˇ T * ( t ) + V ( t ) + E ( t ) and then applying the generalized Itô’s formula yields
d ( ln G ) = 1 N ˇ T * + V + E [ N ˇ β ( ξ ( t ) ) T V N ˇ q ( ξ ( t ) ) T * E + N ( ξ ( t ) ) δ ( ξ ( t ) ) T * N ˇ δ ( ξ ( t ) ) T * c ( ξ ( t ) ) V + p ( ξ ( t ) ) T * E d E ( ξ ( t ) ) E ] d t 1 2 ( N ˇ T * + V + E ) 2 [ ( N ˇ σ 2 ( ξ ( t ) ) T * ) 2 + σ 3 2 ( ξ ( t ) ) V 2 + σ 4 2 ( ξ ( t ) ) E 2 ] d t + N ˇ σ 2 ( ξ ( t ) ) T * N ˇ T * + V + E dB 2 ( t ) + σ 3 ( ξ ( t ) ) V N ˇ T * + V + E dB 3 ( t ) + σ 4 ( ξ ( t ) ) E N ˇ T * + V + E dB 4 ( t ) N ˇ β ( ξ ( t ) ) T V N ˇ T * + V + E d t c ( ξ ( t ) ) V N ˇ T * + V + E d t d E ( ξ ( t ) ) E N ˇ T * + V + E d t N ˇ 2 σ 2 2 ( ξ ( t ) ) ( T * ) 2 + σ 3 2 ( ξ ( t ) ) V 2 + σ 4 2 ( ξ ( t ) ) E 2 2 ( N ˇ T * + V + E ) 2 d t + N ˇ σ 2 ( ξ ( t ) ) T * N ˇ T * + V + E dB 2 ( t ) + σ 3 ( ξ ( t ) ) V N ˇ T * + V + E dB 3 ( t ) + σ 4 ( ξ ( t ) ) E N ˇ T * + V + E dB 4 ( t ) N ˇ β ( ξ ( t ) ) T V N ˇ T * + V + E d t 1 ( N ˇ T * + V + E ) 2 [ 1 2 N ˇ 2 σ 2 2 ( ξ ( t ) ) ( T * ) 2 + c ( ξ ( t ) ) + 1 2 σ 3 2 ( ξ ( t ) ) V 2 + d E ( ξ ( t ) ) + 1 2 σ 4 2 ( ξ ( t ) ) E 2 ] d t + N ˇ σ 2 ( ξ ( t ) ) T * N ˇ T * + V + E dB 2 ( t ) + σ 3 ( ξ ( t ) ) V N ˇ T * + V + E dB 3 ( t ) + σ 4 ( ξ ( t ) ) E N ˇ T * + V + E dB 4 ( t ) N ˇ β ˇ T d t 1 2 1 2 σ 2 2 ( ξ ( t ) ) c ( ξ ( t ) ) + 1 2 σ 3 2 ( ξ ( t ) ) d E ( ξ ( t ) ) + 1 2 σ 4 2 ( ξ ( t ) ) d t + N ˇ σ 2 ( ξ ( t ) ) T * N ˇ T * + V + E dB 2 ( t ) + σ 3 ( ξ ( t ) ) V N ˇ T * + V + E dB 3 ( t ) + σ 4 ( ξ ( t ) ) E N ˇ T * + V + E dB 4 ( t ) .
By integrating both sides of the above inequality from 0 to t, and dividing by t on both sides, one has
ln G ( t ) t ln G ( 0 ) t N ˇ β ˇ 1 t 0 t T ( s ) d s 1 2 t 0 t 1 2 σ 2 2 ( ξ ( s ) ) c ( ξ ( s ) ) + 1 2 σ 3 2 ( ξ ( s ) ) d E ( ξ ( s ) ) + 1 2 σ 4 2 ( ξ ( s ) ) d s + 1 t 0 t N ˇ σ 2 ( ξ ( s ) ) T * N ˇ T * + V + E dB 2 ( s ) + 1 t 0 t σ 3 ( ξ ( s ) ) V N ˇ T * + V + E dB 3 ( s ) + 1 t 0 t σ 4 ( ξ ( t ) ) E N ˇ T * + V + E dB 4 ( s ) N ˇ β ˇ 1 t 0 t Y ( s ) d s 1 2 t 0 t 1 2 σ 2 2 ( ξ ( s ) ) c ( ξ ( s ) ) + 1 2 σ 3 2 ( ξ ( s ) ) d E ( ξ ( s ) ) + 1 2 σ 4 2 ( ξ ( s ) ) d s + 1 t 0 t N ˇ σ 2 ( ξ ( s ) ) T * N ˇ T * + V + E dB 2 ( s ) + 1 t 0 t σ 3 ( ξ ( s ) ) V N ˇ T * + V + E dB 3 ( s ) + 1 t 0 t σ 4 ( ξ ( s ) ) E N ˇ T * + V + E dB 4 ( s ) .
Here we use the fact that T ( t ) Y ( t ) a.s., which is obtained by the comparison theorem of stochastic differential equation (see reference [34]). By taking the superior limit for the both sides of inequality (9), and by using (8) and the strong law of large numbers of local martingales (see reference [35]), we further get
lim sup t ln G ( t ) t N ˇ β ˇ 0 Y μ ( Y ) d Y 1 2 t 0 t 1 2 σ 2 2 ( ξ ( s ) ) c ( ξ ( s ) ) + 1 2 σ 3 2 ( ξ ( s ) ) d E ( ξ ( s ) ) + 1 2 σ 4 2 ( ξ ( s ) ) d s .
As ergodic properties of ξ ( t ) , we directly have
lim sup t 1 t 0 t 1 2 σ 2 2 ( ξ ( s ) ) c ( ξ ( s ) ) + 1 2 σ 3 2 ( ξ ( s ) ) d E ( ξ ( s ) ) + 1 2 σ 4 2 ( ξ ( s ) ) d s = k = 1 N ˜ π k 1 2 σ 2 2 ( k ) c ( k ) + 1 2 σ 3 2 ( k ) d E ( ξ ( k ) ) + 1 2 σ 4 2 ( ξ ( k ) ) .
From (10) and the condition R 0 * < 1 , we get
lim sup t ln G ( t ) t N ˇ β ˇ 0 Y μ ( Y ) d Y k = 1 N ˜ π k 2 × 1 2 σ 2 2 ( k ) c ( k ) + 1 2 σ 3 2 ( k ) d E ( ξ ( k ) ) + 1 2 σ 4 2 ( ξ ( k ) ) k = 1 N ˜ π k 2 1 2 σ 2 2 ( k ) c ( k ) + 1 2 σ 3 2 ( k ) d E ( ξ ( k ) ) + 1 2 σ 4 2 ( ξ ( k ) ) R 0 * 1 < 0 ,
which implies lim t T * ( t ) = 0 , lim t V ( t ) = 0 and lim t E ( t ) = 0 a.s.
For any small positive constant ε > 0 , there are a t 0 > 0 and a set Ω ε Ω such that P ( Ω ε ) > 1 ε , V ( t ) < ε and E ( t ) < ε , for ω Ω ε and t > t 0 . Now from the first equation in model (2), we obtain that for t > t 0 and ω Ω ε :
d T ( t ) = λ ( ξ ( t ) ) d ( ξ ( t ) ) T + r ( ξ ( t ) ) T 1 T T max ( ξ ( t ) ) β ( ξ ( t ) ) T V d t + σ 1 ( ξ ( t ) ) T dB 1 ( t ) λ ( ξ ( t ) ) d ( ξ ( t ) ) T + r ( ξ ( t ) ) T 1 T T max ( ξ ( t ) ) ε β ( ξ ( t ) ) T d t + σ 1 ( ξ ( t ) ) T dB 1 ( t ) .
Next, we consider the comparison equation
d X ( t ) = λ ( ξ ( t ) ) d ( ξ ( t ) ) X ( t ) + r ( ξ ( t ) ) X ( t ) 1 X ( t ) X max ( ξ ( t ) ) ε β ( ξ ( t ) ) X ( t ) d t + σ 1 ( ξ ( t ) ) X ( t ) dB 1 ( t )
with X ( 0 ) = T ( 0 ) . From the stochastic comparison theorem, we can get that X ( t ) T ( t ) Y ( t ) , for ω Ω ε and t > t 0 . Let ε 0 ; then, lim t | X ( t ) Y ( t ) | = 0 , a.s., where Y ( t ) and X ( t ) are the solutions of (7) and (11), respectively. Thus, we conclude that lim t | T ( t ) Y ( t ) | = 0 , a.s. The proof is completed.  □

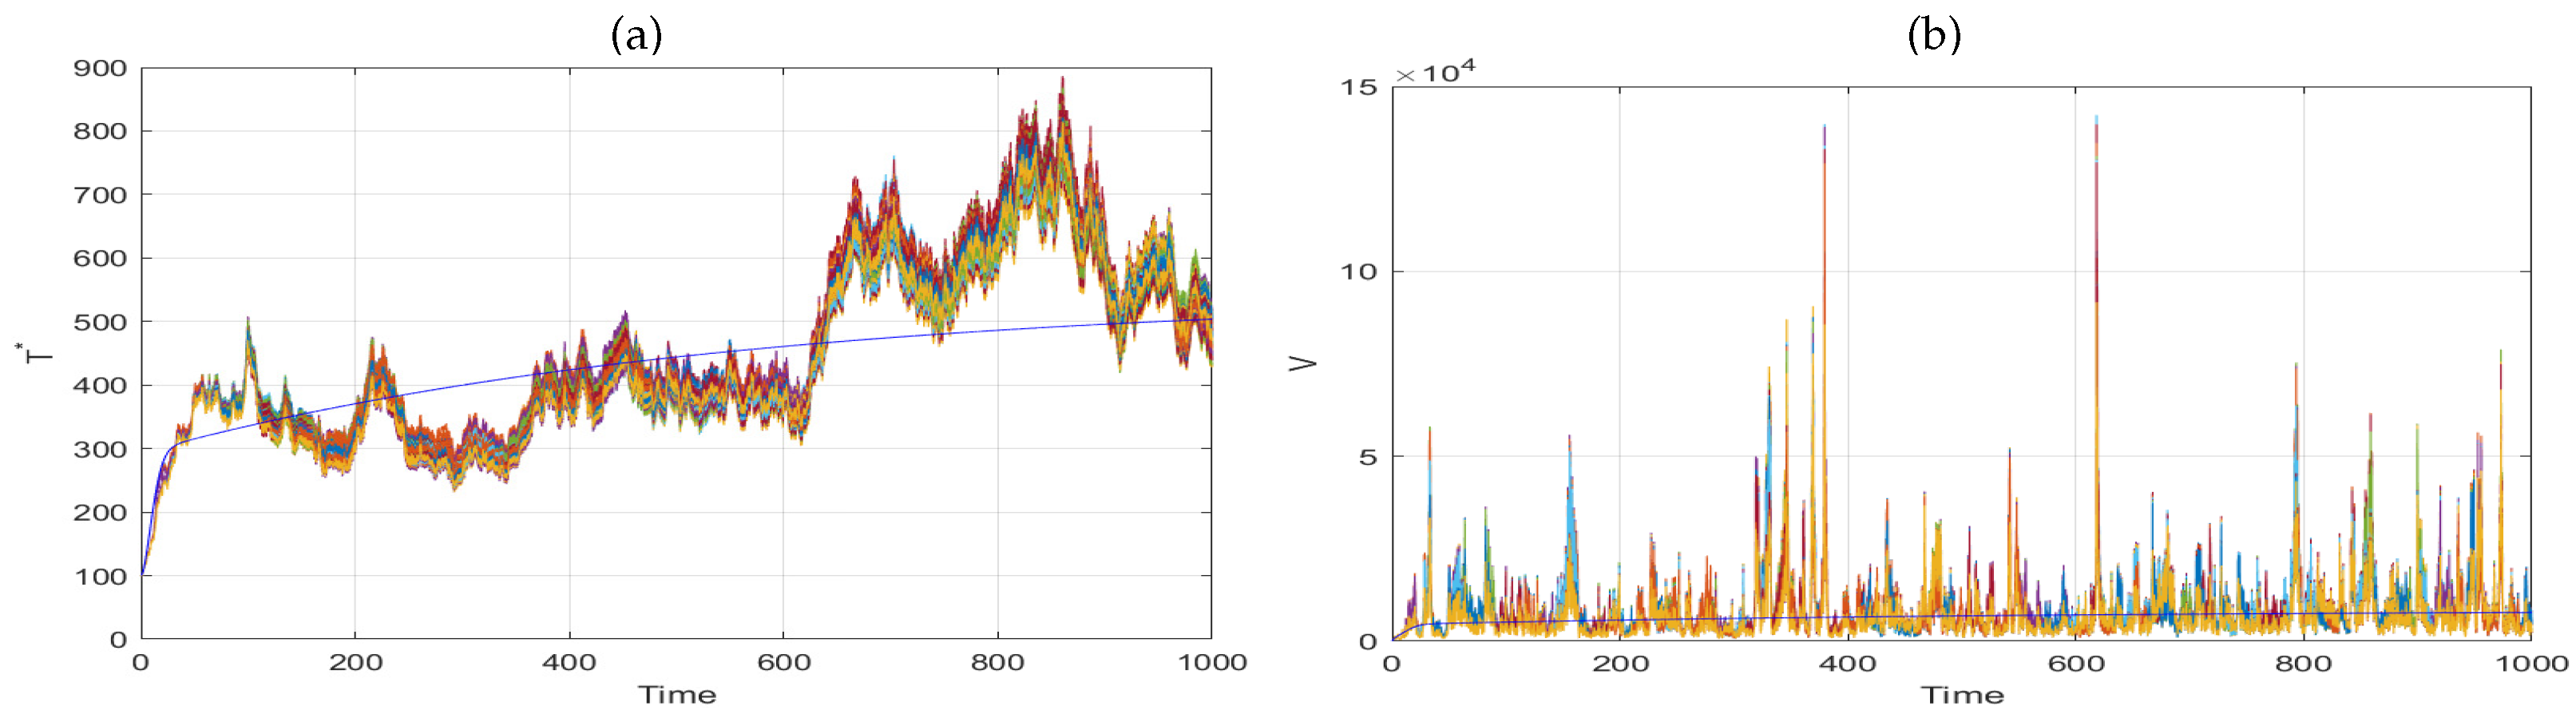
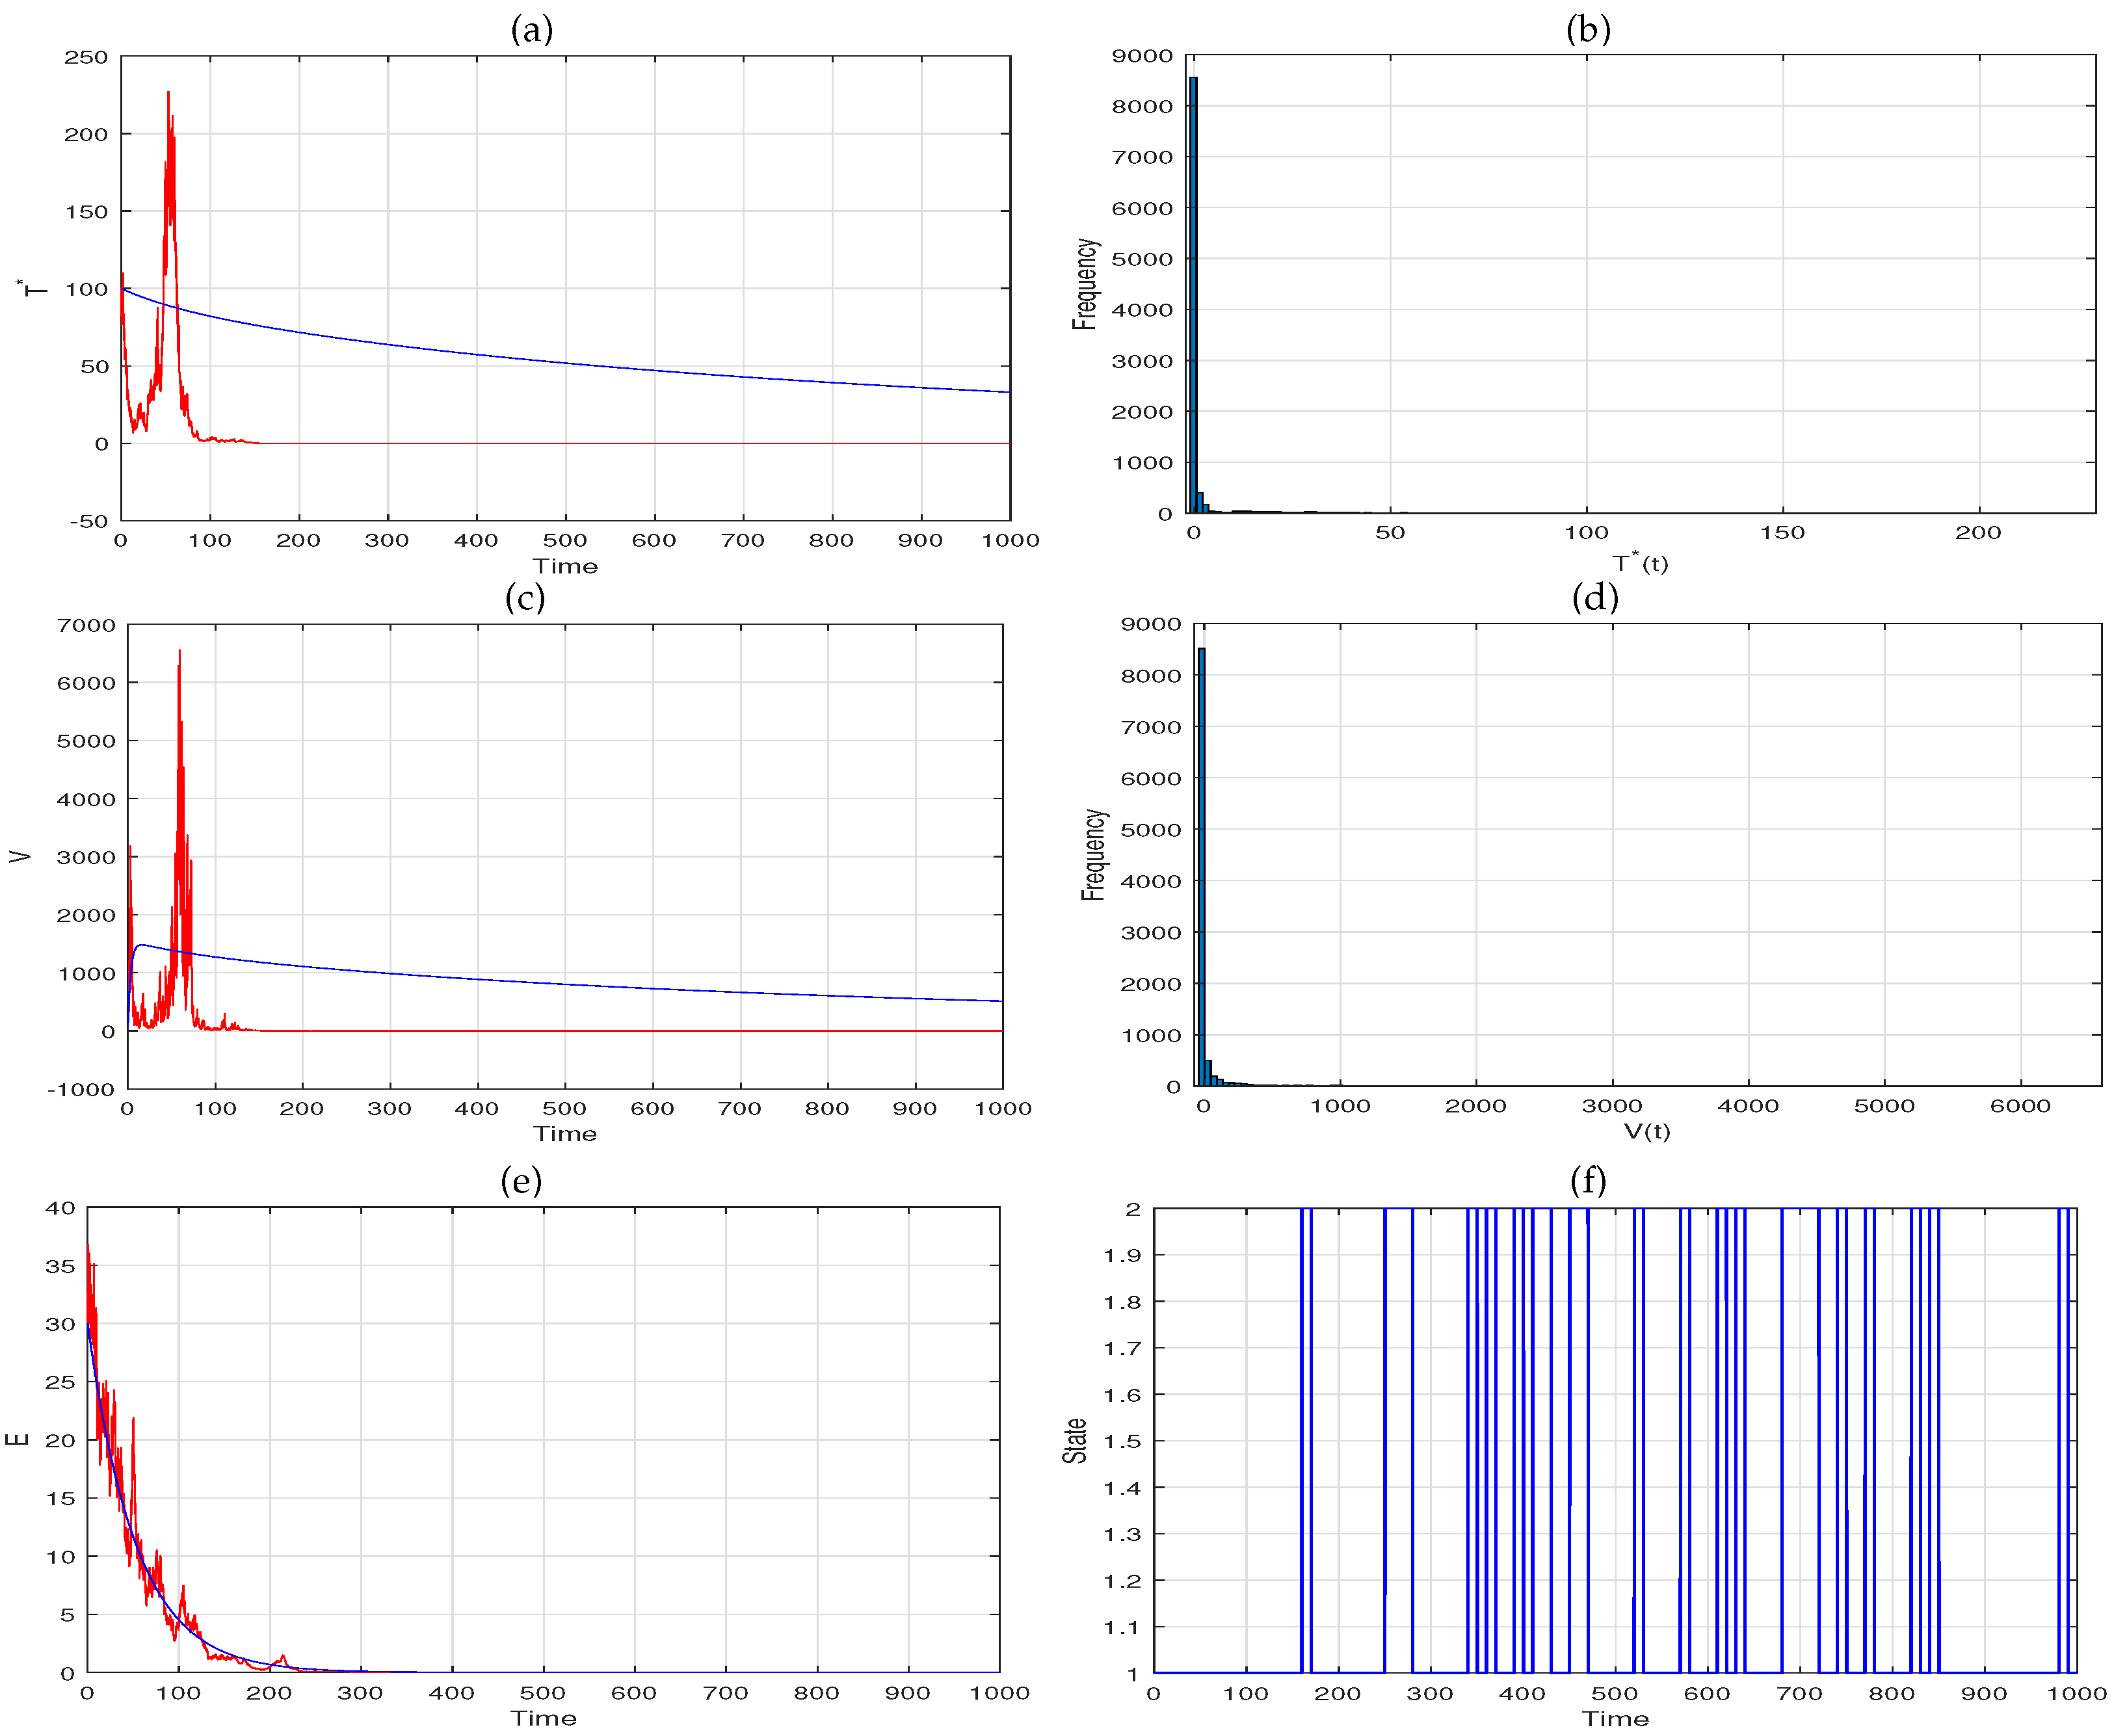
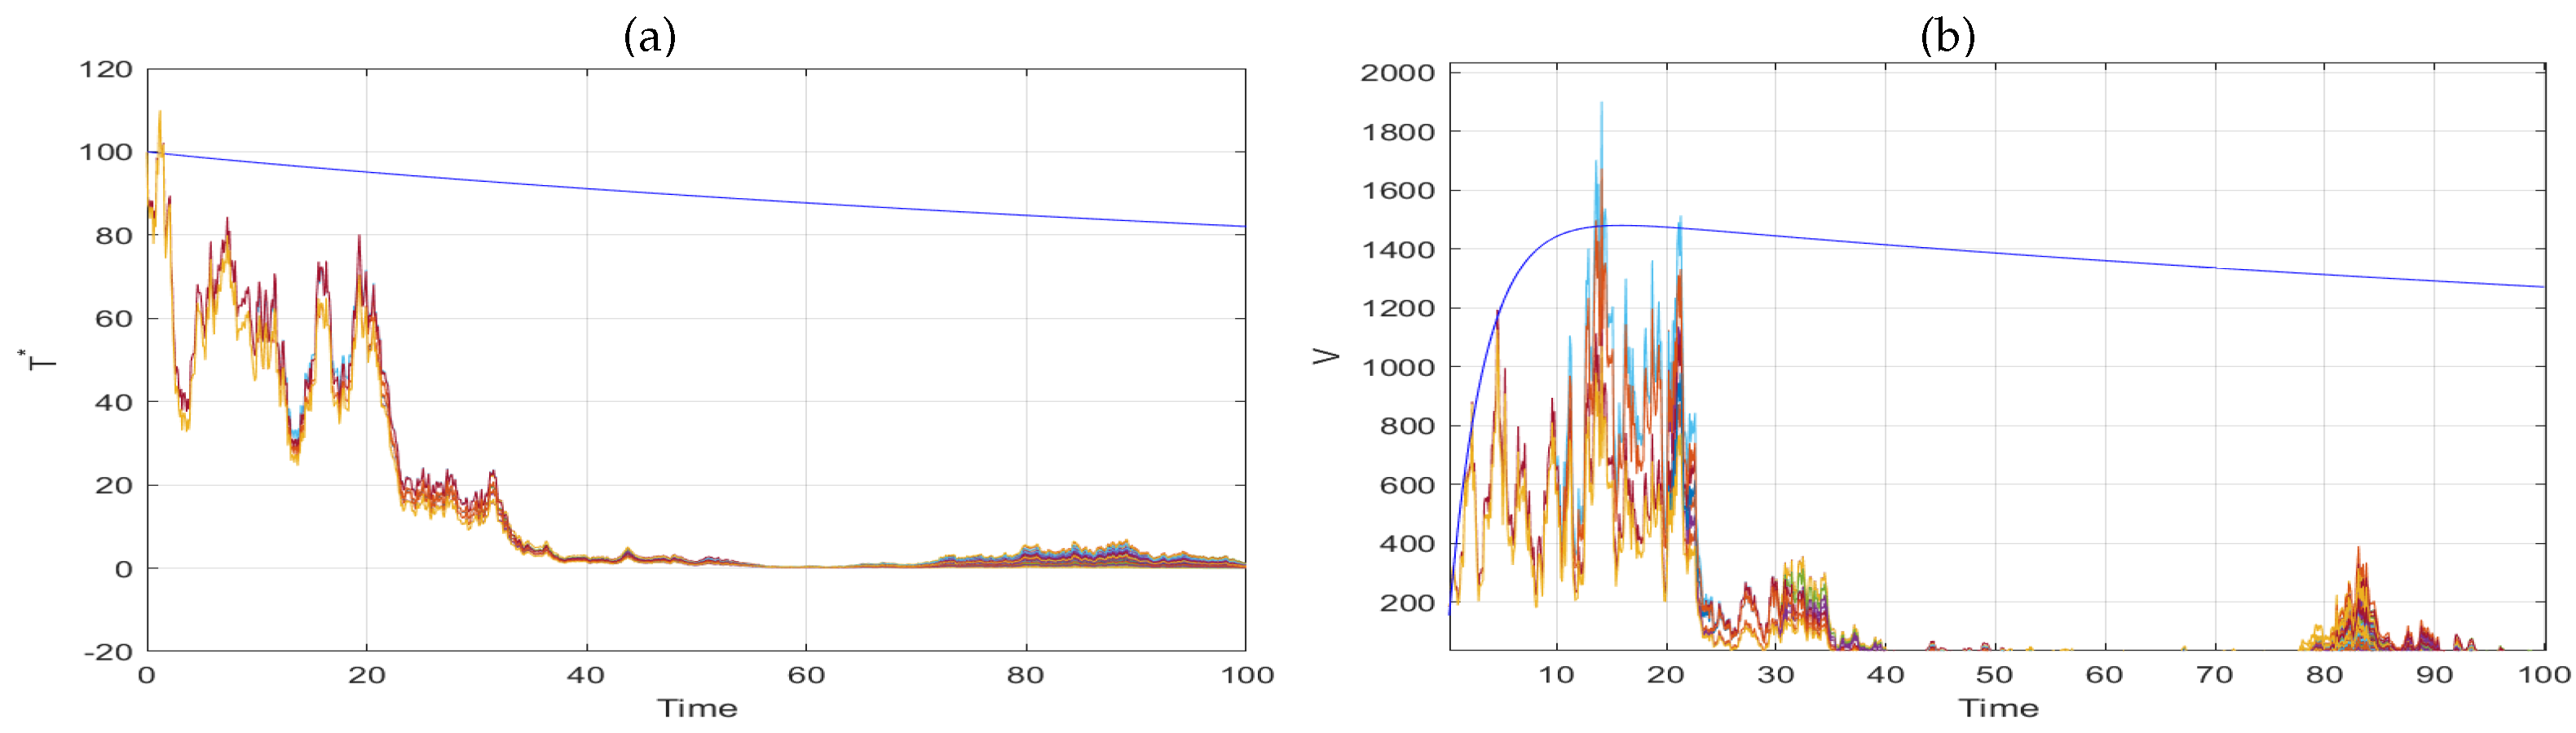
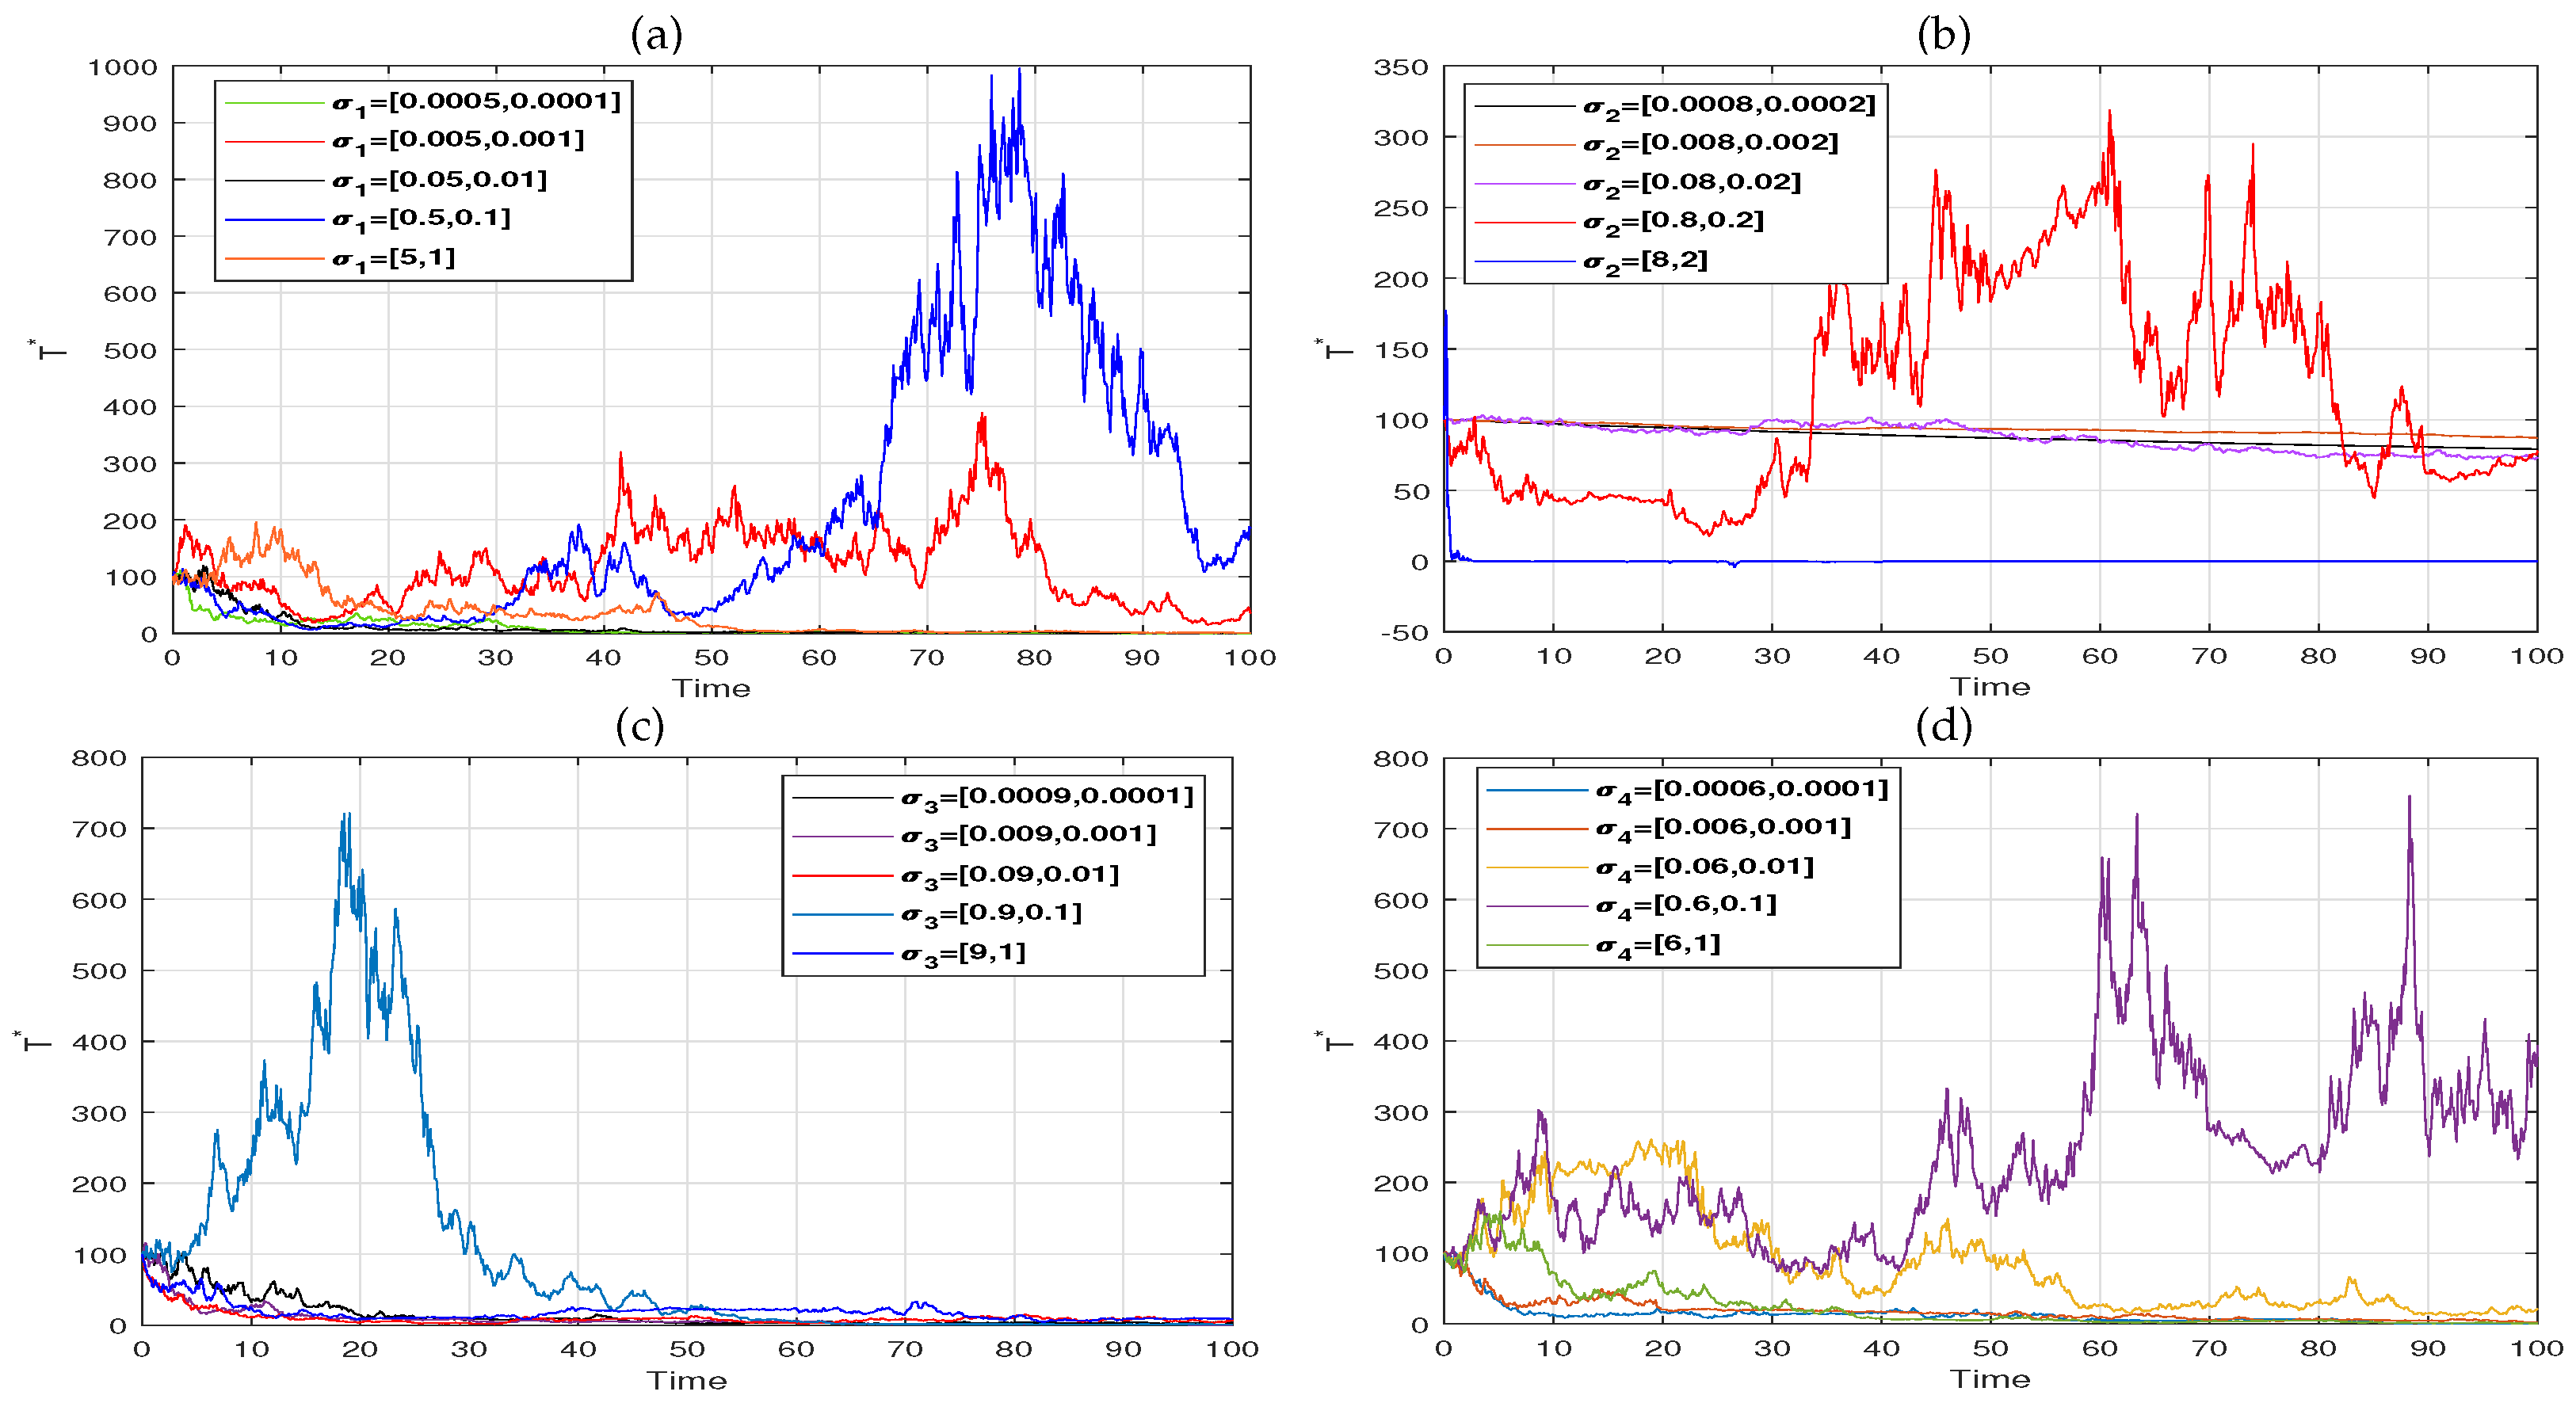
6. Numerical Simulation

Some numerical simulations are introduced to validate the main results by using the Milstein’s higher-order method (see reference [36]). Here, we consider the case of N ˜ = 2 , and the generator Γ ˜ = ( γ i j ) 2 × 2 of the Markov chain ξ ( t ) is
Γ ˜ = 1 1 3 3 .
By π Γ ˜ = 0 , we get the unique stationary distribution π = ( π 1 , π 2 ) = ( 3 / 4 , 1 / 4 ) . According to Table 1, the values of the main parameters of model (2) are fixed to those in Table 2.
We chose, firstly, β = [ 4.5 × 10 4 , 4.8 × 10 4 ] , σ 1 = [ 0.25 , 0.2 ] , σ 2 = [ 0.09 , 0.08 ] , σ 3 = [ 2.2 , 2 ] , σ 4 = [ 0.45 , 0.2 ] . It easy to verify that δ ^ = 0.0185 > 0.0081 = σ ˇ 2 2 , 2 c ^ = 5 > 4.84 = σ ˇ 3 2 , 2 d ^ E = 0.4 > 0.2025 = σ ˇ 4 2 and R 0 s 23.6278 . Obviously, Theorem 2 implies that the stochastic HIV model (2) has a unique ergodic stationary distribution. The plots in Figure 1a,c,e show the trajectories of T * ( t ) , V ( t ) and E ( t ) of model (2), respectively. Further, the plots in Figure 1b,d,f give the relative frequency densities of T * ( t ) , V ( t ) and E ( t ) . In addition, the plots in Figure 2a,b show the trajectories of model (2) for T * ( t ) and V ( t ) . Five-hundred trajectories were obtained under the same initial values. Numerical simulations show that under the perturbation of white noise, the solution trajectories of model (2) show variability, even though the initial values are the same. In addition, the trajectories can randomly jump from one state to another due to the perturbation of the telegraph noise. This coincides with the fact that for the same disease and the same treatment, different patients will have different treatment outcomes.
However, if we change β and σ 2 as β = [ 1.5 × 10 6 , 1.8 × 10 6 ] and σ 2 = [ 0.9 , 0.8 ] , respectively, and other parameters are fixed as in Figure 1, a direct calculation gives that R 0 * 0.7278 . Therefore, from Theorem 3, it is clear that virus is suppressed with high probability, which is shown in Figure 3a–f. Further, the trajectories of T * ( t ) and V ( t ) for model (2) are shown in Figure 4a,b, which trajectories were plotted by 500 simulations of white noise and regime switching under the same initial value, respectively. These mean that the virus in vivo is suppressed at a low level with a high probability. In addition, we note that uncertainty plays a non-negligible role in the replication of virus.
Finally, we consider the effect of the intensity of uncertainty on the replication of virus, where β = [ 1.5 × 10 6 , 1.8 × 10 6 ] . For Figure 5a, we fixed σ 2 = [ 0.9 , 0.8 ] , σ 3 = [ 2.2 , 2 ] and σ 4 = [ 0.45 , 0.2 ] , and chose σ 1 = [ 0.0005 , 0.0001 ] , [ 0.005 , 0.001 ] , [ 0.05 , 0.01 ] , [ 0.5 , 0.1 ] and [ 5 , 1 ] , respectively. For Figure 5b, we let σ 1 = [ 0.5 , 0.1 ] , σ 3 = [ 2.2 , 2 ] and σ 4 = [ 0.45 , 0.2 ] ; and selected σ 2 = [ 0.0008 , 0.0002 ] , [ 0.008 , 0.002 ] , [ 0.08 , 0.02 ] , [ 0.8 , 0.2 ] and [ 8 , 2 ] . For Figure 5c, we set σ 1 = [ 0.5 , 0.1 ] , σ 2 = [ 0.8 , 0.2 ] and σ 4 = [ 0.45 , 0.2 ] ; and chose σ 3 = [ 0.0009 , 0.0003 ] , [ 0.009 , 0.003 ] , [ 0.09 , 0.03 ] , [ 0.9 , 0.3 ] and [ 9 , 3 ] . For Figure 5d, we fixed σ 1 = [ 0.5 , 0.1 ] , σ 2 = [ 0.8 , 0.2 ] and σ 3 = [ 0.9 , 0.3 ] ; and chose σ 4 = [ 0.0006 , 0.0001 ] , [ 0.006 , 0.001 ] , [ 0.06 , 0.01 ] , [ 0.6 , 0.1 ] and [ 6 , 1 ] . Numerical simulations show that medium intensity uncertainties can cause frequent fluctuations in infected CDT 4 + T cells, and the virus exists in the biological body. The small intensity and large intensity of uncertain factors can make the virus’s number be within a very low range. In addition, we also note that the intensities of σ 1 and σ 2 have greater effects on virus replication, and σ 3 and σ 4 have smaller effects.

7. Conclusions

It is well known that in the treatment of a disease, even with the same treatment, different patients will have different results. The reason for this is that environmental factors, dietary structure, subconsciousness and other uncertainties have non-negligible influences on the patient. Therefore, viral dynamical models described by stochastic differential equations are more accurate in portraying these phenomena compared to deterministic models. In this paper, a stochastic HIV model with logistic growth has been developed, where stochastic perturbations are described by the Brownian motion and Markovian switching. Firstly, the global positivity and uniqueness of solutions for this model were proved by using the generalized Itô’s formula and Liapunov function. Further, the boundedness of solutions of our model was also obtained by the comparison principle of stochastic differential equations. Nextly, the existence of the ergodic property was obtained, which implies that the solution of this model converges to the unique stationary distribution. In addition, the sufficient condition of extinction for the virus was introduced. Finally, some numerical simulations were given to explain the main results and to discuss the impacts of the stochastic perturbations.
Although we found some sufficient conditions for the extinction of virus and the existence of a stationary distribution for our model, the threshold condition for the stochastic persistence and extinction of the virus were not obtained due to the limitations of our study methods. For example, we chose β = [ 2.5 × 10 6 , 2.8 × 10 6 ] , σ 1 = [ 0.05 , 0.01 ] , σ 2 = [ 0.8 , 0.2 ] , σ 3 = [ 0.9 , 0.3 ] and σ 4 = [ 0.06 , 0.01 ] , and other parameters were fixed to the values in Table 2. By direct calculation, we can obtain that R 0 * 2.1248 > 1 , R 0 s 2.3873 > 1 , 2 δ ^ < σ ˇ 2 2 , 2 c ^ > σ ˇ 3 2 and 2 d E ^ > σ ˇ 4 2 . That is, the conditions of both Theorem 2 and Theorem 3 are not valid. However, the plots in Figure 6a,b show that the trajectories of T * ( t ) and V ( t ) tend to 0 as t a . s . , where 500 trajectories have the same initial value. There is no doubt that uncertainties are not to be ignored in the treatment of diseases. How to obtain threshold conditions for stochastic viral models and how to avoid or rationalize the use of these uncertainties in the course of disease treatment are worthy of further study.

Author Contributions

Conceptualization, L.H. and L.-F.N.; methodology, L.H.; software, L.H.; validation, L.H. and L.-F.N.; formal analysis, L.H.; writing—original draft preparation, L.H.; writing—review and editing, L.H. and L.-F.N. All authors have read and agreed to the published version of the manuscript.

Funding

This research was funded by the Natural Science Foundation of Xinjiang Uygur Autonomous Region grant number 2021D01C070, and the APC was funded by 2021D01C070.

Institutional Review Board Statement

Not applicable.

Informed Consent Statement

Not applicable.

Data Availability Statement

Not applicable.

Acknowledgments

The authors are thankful to the anonymous reviewers for their careful reading, useful comments and constructive suggestions for the improvement of the present research work. We are also thankful to the editor for his speed and cooperation.

Conflicts of Interest

The authors declare no conflict of interest.

References

  1. World Health Organization. HIV/AIDS. Available online: https://www.who.int/news-room/fact-sheets/detail/hiv-aids (accessed on 30 November 2021).
  2. Nowak, M.; Bonhoeffer, S.; Shaw, G.; May, R. Anti-viral drug treatment: Dynamics of resistance in free virus and infected cell populations. J. Theor. Biol. 1997, 184, 203–217. [Google Scholar] [CrossRef] [PubMed]
  3. d’Onofrio, A. A note on the global behaviour of the network-based SIS epidemic model. Nonlinear Anal.-Real 2008, 9, 1567–1572. [Google Scholar] [CrossRef]
  4. Qi, H.; Zhang, S.; Meng, X.; Dong, H. Periodic solution and ergodic stationary distribution of two stochastic SIQS epidemic systems. Physica A 2018, 508, 223–241. [Google Scholar] [CrossRef]
  5. Culshaw, R.; Ruan, S. A delay-differential equation model of HIV infection of CD4+ T-cells. Math. Biosci. 2000, 165, 27–39. [Google Scholar] [CrossRef]
  6. Dalal, N.; Greenhalgh, D.; Mao, X. A stochastic model for internal HIV dynamics. J. Math. Anal. Appl. 2008, 341, 1084–1101. [Google Scholar] [CrossRef]
  7. Hui, H.; Nie, L.F. Analysis of a stochastic HBV infection model nonlinear incidence rate. J. Biol. Syst. 2019, 27, 399–421. [Google Scholar] [CrossRef]
  8. Liu, J.; Wang, Y.; Liu, L.; Zhao, T. A stochastic HIV infection model with latent infection and antiretroviral therapy. Discrete Dyn. Nat. Soc. 2018, 2018, 5175383. [Google Scholar] [CrossRef]
  9. Yves, E.; Bongor, D.; Rodoumta, K. Mathematical analysis of HIV/AIDS stochastic dynamic models. Appl. Math. Model. 2016, 40, 9131–9151. [Google Scholar]
  10. Zhang, C.; Hoffmann, A. A stochastic spatio-temporal (SST) model to study cell-to-cell variability in HIV-1 infection. J. Theor. Biol. 2016, 395, 87–96. [Google Scholar]
  11. Shi, P.; Dong, L. Dynamical behaviors of stochastic virus dynamic models with saturation responses. Math. Biosci. 2019, 308, 20–26. [Google Scholar] [CrossRef]
  12. Ji, C. The threshold for a stochastic HIV-1 infection model with Beddington-DeAngelis incidence rate. Appl. Math. Model. 2018, 64, 168–184. [Google Scholar] [CrossRef]
  13. Khan, T.; Jung, I.H.; Zaman, G. A stochastic model for the transmission dynamics of hepatitis B virus. J. Biol. Dynam. 2019, 13, 328–344. [Google Scholar] [CrossRef] [PubMed]
  14. Lahrouz, A.; Settati, A. Asymptotic properties of switching diffusion epidemic model with varying population size. Appl. Math. Comput. 2013, 219, 11134–11148. [Google Scholar] [CrossRef]
  15. Zou, X.; Wang, K. Optimal harvesting for a stochastic regime-switching logistic diffusion system with jumps. Nonlinear Anal.-Hybri. 2014, 13, 32–44. [Google Scholar] [CrossRef]
  16. Ji, C. Permanence of a regime-switching malaria transmission model. Physica A 2019, 523, 222–233. [Google Scholar] [CrossRef]
  17. Gray, A.; Greenhalgh, D.; Mao, X.; Pan, J. The SIS epidemic model with Markovian switching. J. Math. Anal. Appl. 2012, 394, 496–516. [Google Scholar] [CrossRef]
  18. Greenhalgh, D.; Liang, Y.; Mao, X. Modelling the effect of telegraph noise in the SIRS epidemic model using markovian switching. Physica A 2016, 462, 684–704. [Google Scholar] [CrossRef]
  19. Zhang, X.; Jiang, D.; Alsaedi, A.; Hayat, T. Stationary distribution of stochastic SIS epidemic model with vaccination under regime switching. Appl. Math. Lett. 2016, 59, 87–93. [Google Scholar] [CrossRef]
  20. Omame, A.; Abbas, M.; Din, A. Global asymptotic stability, extinction and ergodic stationary distribution in a stochastic model for dual variants of SARS-CoV-2. Math. Comput. Simulat. 2023, 204, 302–336. [Google Scholar] [CrossRef]
  21. Settati, A.; Lahrouz, A. Stationary distribution of stochastic population systems under regime switching. Appl. Math. Comput. 2014, 244, 235–243. [Google Scholar] [CrossRef]
  22. Guo, X.; Luo, J. Stationary distribution and extinction of SIR model with nonlinear incident rate under Markovian switching. Physica A 2018, 505, 471–481. [Google Scholar] [CrossRef]
  23. Liu, S.; Xu, X.; Jiang, D.; Hayat, T.; Ahmad, B. Stationary distribution and extinction of the DS-I-A model disease with periodic parameter function and Markovian switching. Appl. Math. Comput. 2017, 311, 66–84. [Google Scholar] [CrossRef]
  24. Shu, H.; Wang, L.; Watmough, J. Global stability of a nonlinear viral infection model with inifinitely distributed intracellular delays and CTL immune response. SIAM J. Appl. Math. 2013, 73, 1280–1302. [Google Scholar] [CrossRef]
  25. Burg, D.; Rong, L.; Neumann, A.U.; Dahari, H. Mathematical modeling of viral kinetics under immune control during primary HIV-1 infection. J. Theor. Biol. 2009, 259, 751–759. [Google Scholar] [CrossRef]
  26. Arnaout, R.; Nowak, M.; Wodarz, D. HIV-1 dynamics revisited: Biphasic decay by cytotoxic lymphocyte killing? Proc. R. Soc. Lond. B 2000, 265, 1347–1354. [Google Scholar] [CrossRef]
  27. Mao, X.; Yuan, C. Stochastic Differential Equation with Markovian Switching; Imperial College Press: London, UK, 2006. [Google Scholar]
  28. Skorokhod, A.V. Asymptotic Methods in the Theory of Stochastic Differential Equations; American Mathematical Society: Providence, RI, USA, 1989. [Google Scholar]
  29. Zhu, C.; Yin, G. Asymptotic properties of hybrid diffusion systems. SIAM J. Control. Optim. 2007, 46, 1155–1179. [Google Scholar] [CrossRef]
  30. Mao, X.; Marion, G.; Renshaw, E. Environmental Brownian noise suppresses explosions in population dynamics. Stoch. Proc. Appl. 2002, 97, 95–110. [Google Scholar] [CrossRef]
  31. Chen, Y.; Wen, B.; Teng, Z. The global dynamics for a stochastic SIS epidemic model with isolation. Physica A 2018, 492, 1604–1624. [Google Scholar] [CrossRef]
  32. Khasminskii, R.; Zhu, C.; Yin, C. Stability of regime-switching diffusions. Stoch. Proc. Appl. 2007, 117, 1037–1051. [Google Scholar] [CrossRef]
  33. Jiang, D.; Liu, Q.; Shi, N.; Hayat, T.; Alsaedi, A.; Xia, P. Dynamics of a stochastic HIV-1 infection model with logistic growth. Physica A 2017, 469, 706–717. [Google Scholar] [CrossRef]
  34. Ikeda, N.; Watanabe, S. A comparison theorem for solutions of stochastic differential equations and its applications. Osaka J. Math. 1977, 14, 619–633. [Google Scholar]
  35. Mao, X. Stochastic Differential Equations and Applications, 2nd ed.; Woodhead Publishing: Cambridge, UK, 2007. [Google Scholar]
  36. Higham, D. An algorithmic introduction to numerical simulation of stochastic differential equations. SIAM Rev. 2001, 43, 525–546. [Google Scholar] [CrossRef]
Figure 1. The existence of ergodic stationary distribution of model (2) with R 0 s 23.6278 > 1 , which means that the virus will persist in vivo for a long time: (a) trajectory T * ( t ) , where, blue is without stochastic perturbation and red is with stochastic perturbation; (b) relative frequency density of T * ; (c) trajectory of V ( t ) , where, blue is without stochastic perturbation and red is with stochastic perturbation; (d) relative frequency density of V; (e) trajectory of E ( t ) , where, blue is without stochastic perturbation and red is with stochastic perturbation; (f) status distribution of ξ ( t ) .
Mathematics 10 03472 g001
Figure 2. The effects of white noise and telegraphic noise on virus evolution in model (2) with R 0 s 23.6278 > 1 , where 500 trajectories have the same initial value: (a) trajectories of T * ( t ) ; (b) trajectories of V ( t ) . Here, blue curve is without stochastic perturbation, other color oscillation curves are with stochastic perturbation.
Mathematics 10 03472 g002
Figure 3. The extinction of virus of model (2) with R 0 * 0.7278 < 1 : (a) trajectory T * ( t ) , where, blue is without stochastic perturbation and red is with stochastic perturbation; (b) relative frequency density of T * ; (c) trajectory of V ( t ) , where, blue is without stochastic perturbation and red is with stochastic perturbation; (d) relative frequency density of V; (e) trajectory of E ( t ) , where, blue is without stochastic perturbation and red is with stochastic perturbation; (f) status distribution of ξ ( t ) .
Mathematics 10 03472 g003
Figure 4. The trajectories distribution of model (2) with R 0 s 0.7278 < 1 , where 500 trajectories have the same initial value: (a) trajectories of T * ( t ) ; (b) trajectories of V ( t ) . Here, blue curve is without stochastic perturbation, other color oscillation curves are with stochastic perturbation. This implies that that even with the perturbation of uncertainties, the virus remains extinct with high probability and the R 0 s < 1 can be used as a basis for carving out the extinction of the virus.
Mathematics 10 03472 g004
Figure 5. The effect of noise intensity σ i 2 ( i = 1 , , 4 ) on the evolution of infected cells T * ( t ) of model (2): (a) the effect of σ 1 ; (b) the effect of σ 2 ; (c) the effect of σ 3 ; (d) the effect of σ 4 . The intensities of σ 3 and σ 4 have very important impacts on the evolution of the virus; they lead to the elimination of the virus. The other perturbations ( σ 1 and σ 2 ) have a relatively small impact.
Mathematics 10 03472 g005
Figure 6. The dynamics of model (2) when the conditions of Theorems 2 and 3 do not hold, where R 0 * 2.1248 > 1 , R 0 s 2.3873 > 1 and 2 δ ^ < σ ˇ 2 2 : (a) trajectories of T * ( t ) ; (b) trajectories of V ( t ) . The 500 trajectories of the same initial value indicate that the evolution of the virus shows irregularities under the perturbation of uncertainties.
Mathematics 10 03472 g006
Table 1. The meaning and possible values of model parameters.
Param.DescriptionRangeSource
λ Rate of creation of new CD 4 +   T cells (cells/mm3/day) 1 × 10 2 ∼50[25]
dNatural mortality rate of uninfected cell (day−1) 1 × 10 4 ∼0.2[25]
rProliferation rate of uninfected cell (cells/mm3/day)0.03∼3[5]
T m a x Maximal level of CD 4 + T-cells (cells/mm3/day) 1.5 × 10 3 [5]
β Viral infection rate (virions mm3/day) 1 × 10 7 1 × 10 3 [25]
δ Natural mortality rate of infected cell (day−1)0.1∼1[25]
qRate at which infected cells are killed by CTLs (day−1)0.001∼1[26]
NBurst size of the infected cell (virions/cell)1∼ 2 × 10 3 [25]
cNatural death rate of virus (day−1) 1 × 10 1 ∼1[25]
pImmune response activation rate (day−1)0.001∼1[26]
d E Natural death rate of CTLs (day−1)0.05∼0.15[26]
Table 2. The values of the main parameters of model (2).
λ dr T max N δ cqqp d E
state 1100.020.118025000.01853.00.000200.000120.000120.20
state 2150.0350.0516035000.01952.50.000150.000100.000100.25
Publisher’s Note: MDPI stays neutral with regard to jurisdictional claims in published maps and institutional affiliations.

