

Planning, Execution, and Control of Operations in SC Activities—Baja California Manufacturing Case Study

 ,
,  ,
,  ,
,  ,
,  and
and 
Abstract
1. Introduction
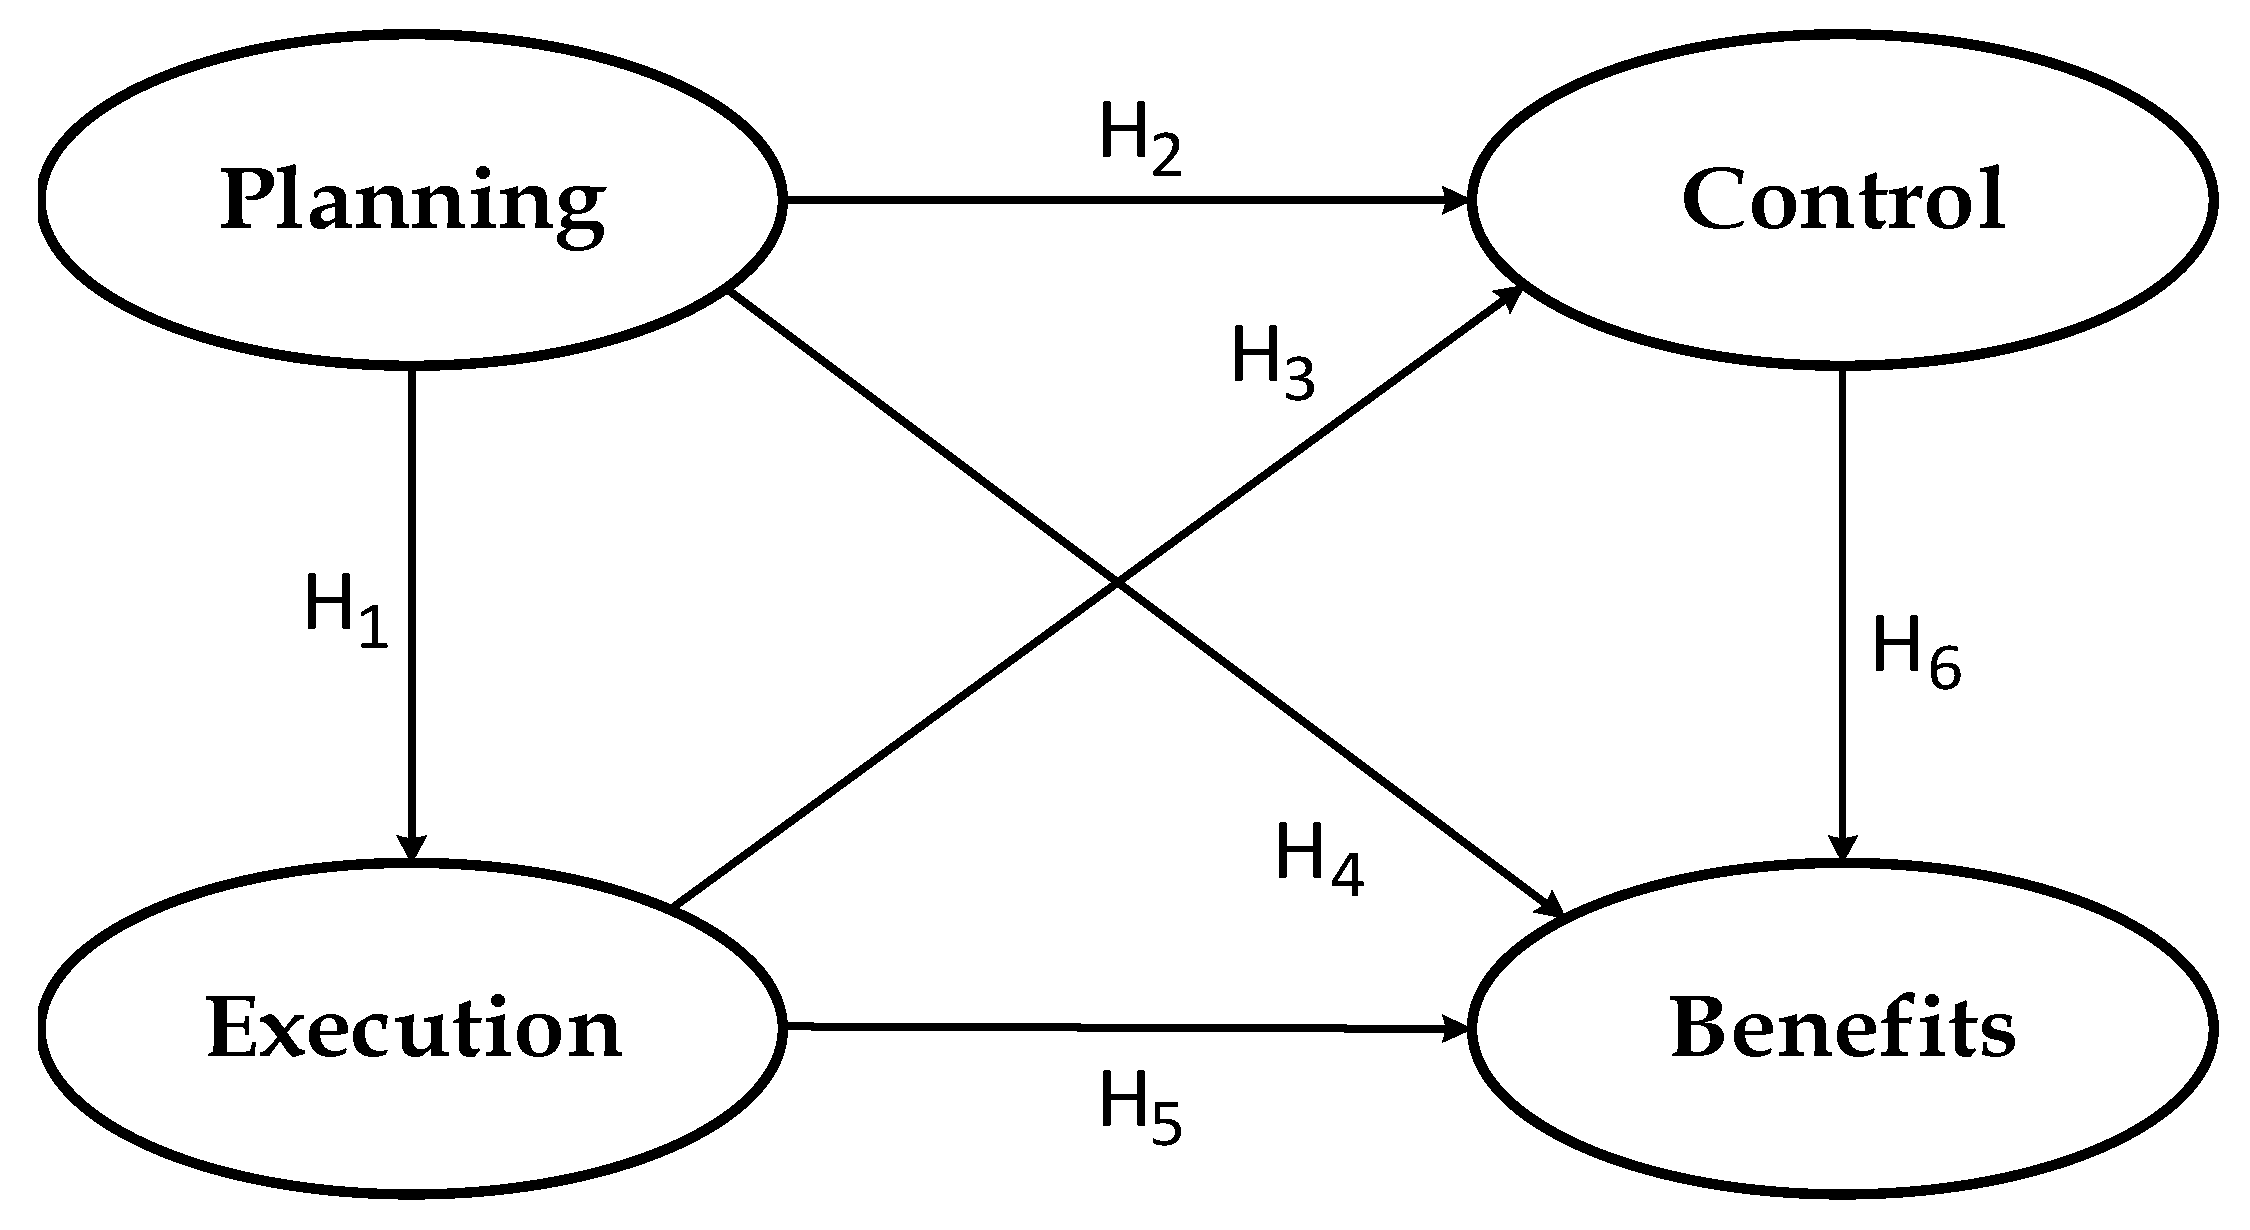
2. Research Context and Hypothesis
2.1. ICT in Planning
2.2. ICT in Execution
2.3. Control
2.4. Benefits
3. Methodology
3.1. Questionnaire Construction
- ICT integration
- Investment in ICT
- Training in ICT
- Exchange of information
- Operations management
- Production Control
- Distribution Activities
- Technological innovation
- Availability of information
- Information management
- Customer benefits
- Company benefits
3.2. Survey Application for Obtain Data
3.3. Information Debugging
3.4. Validation of Variables
- For predictive validity, R-squared and adjusted R-squared are used and values greater than 0.2 are accepted;
- For non-parametric predictive validity, Q-squared is used and positive values and similar to R-squared are accepted;
- For internal validity, Cronbach’s alpha and composite reliability are used, looking values greater than 0.7;
- For convergent validity, average variance extracted is used, looking for values greater than 0.5;
- For collinearity, the variance inflation index is used and values lower than 5 are acceptable.
3.5. Descriptive Analysis of the Sample
3.6. Descriptive Item Analysis
3.7. Structural Equation Modeling (SEM)
3.7.1. Model Efficiency Indices
- The Average Path Coefficient (APC) is used to measure the model efficient and predictive validity, looking to obtain a p-value lower than 0.05;
- Average R-squared (ARS) and average adjusted R-squared (AARS) measure how well a model explains things, and a p-value less than 0.05 is used to test it;
- The block average variance inflation factor (AVIF) and full collinearity index VIF (AFVIF) measures how similar the underlying variables are to each other, and the best value should be less than 5 [66];
- The Tenenhaus Index (GoF) is a way to measure how well the model fits the data, and the right value should be higher than 0.36.
3.7.2. Model Effects
- Indirect effects that occur through mediating variables and require two or more segments [65]. Since there may be more than one indirect effect, only the sums of these are reported in this paper;
- The total effects are the arithmetical sum of the direct effects and the sum of the indirect effects of each of the relationships that exist between the variables [68].
3.7.3. Sensibility Analysis
- That the variables occur independently at their high and low levels;
- The independent and dependent variables occur simultaneously in any combination of its scenarios, such as P(Zi) > 1∩P(Zd) > 1, P(Zi) > 1∩P(Zd) < −1, P(Zi) < −1∩P(Zd) > 1, P(Zi) < −1∩P(Zd) < −1, where Zd represents a standardized dependent variable and Zi represents a standardized independent variable;
- The conditional probability of the dependent variable occurring given that the independent variable has occurred in any combination of scenarios; that is, the following probabilities: P(Zd) > 1/P(Zi) > 1, P(Zd) > 1/P(Zi) < −1, P(Zd) < −1/P(Zi) > 1, P(Zd) < −1/P(Zi) < −1.
4. Results
4.1. Descriptive Analysis of the Sample
4.2. Validation of Variables
4.3. Descriptive Item Analysis
4.4. Model Efficiency Index
4.5. Model Effects
4.5.1. Direct Effects
4.5.2. Sum of Indirect Effects
4.5.3. Total Effects
4.5.4. Sensitivity Analysis
5. Discussion of Results
5.1. From the SEM
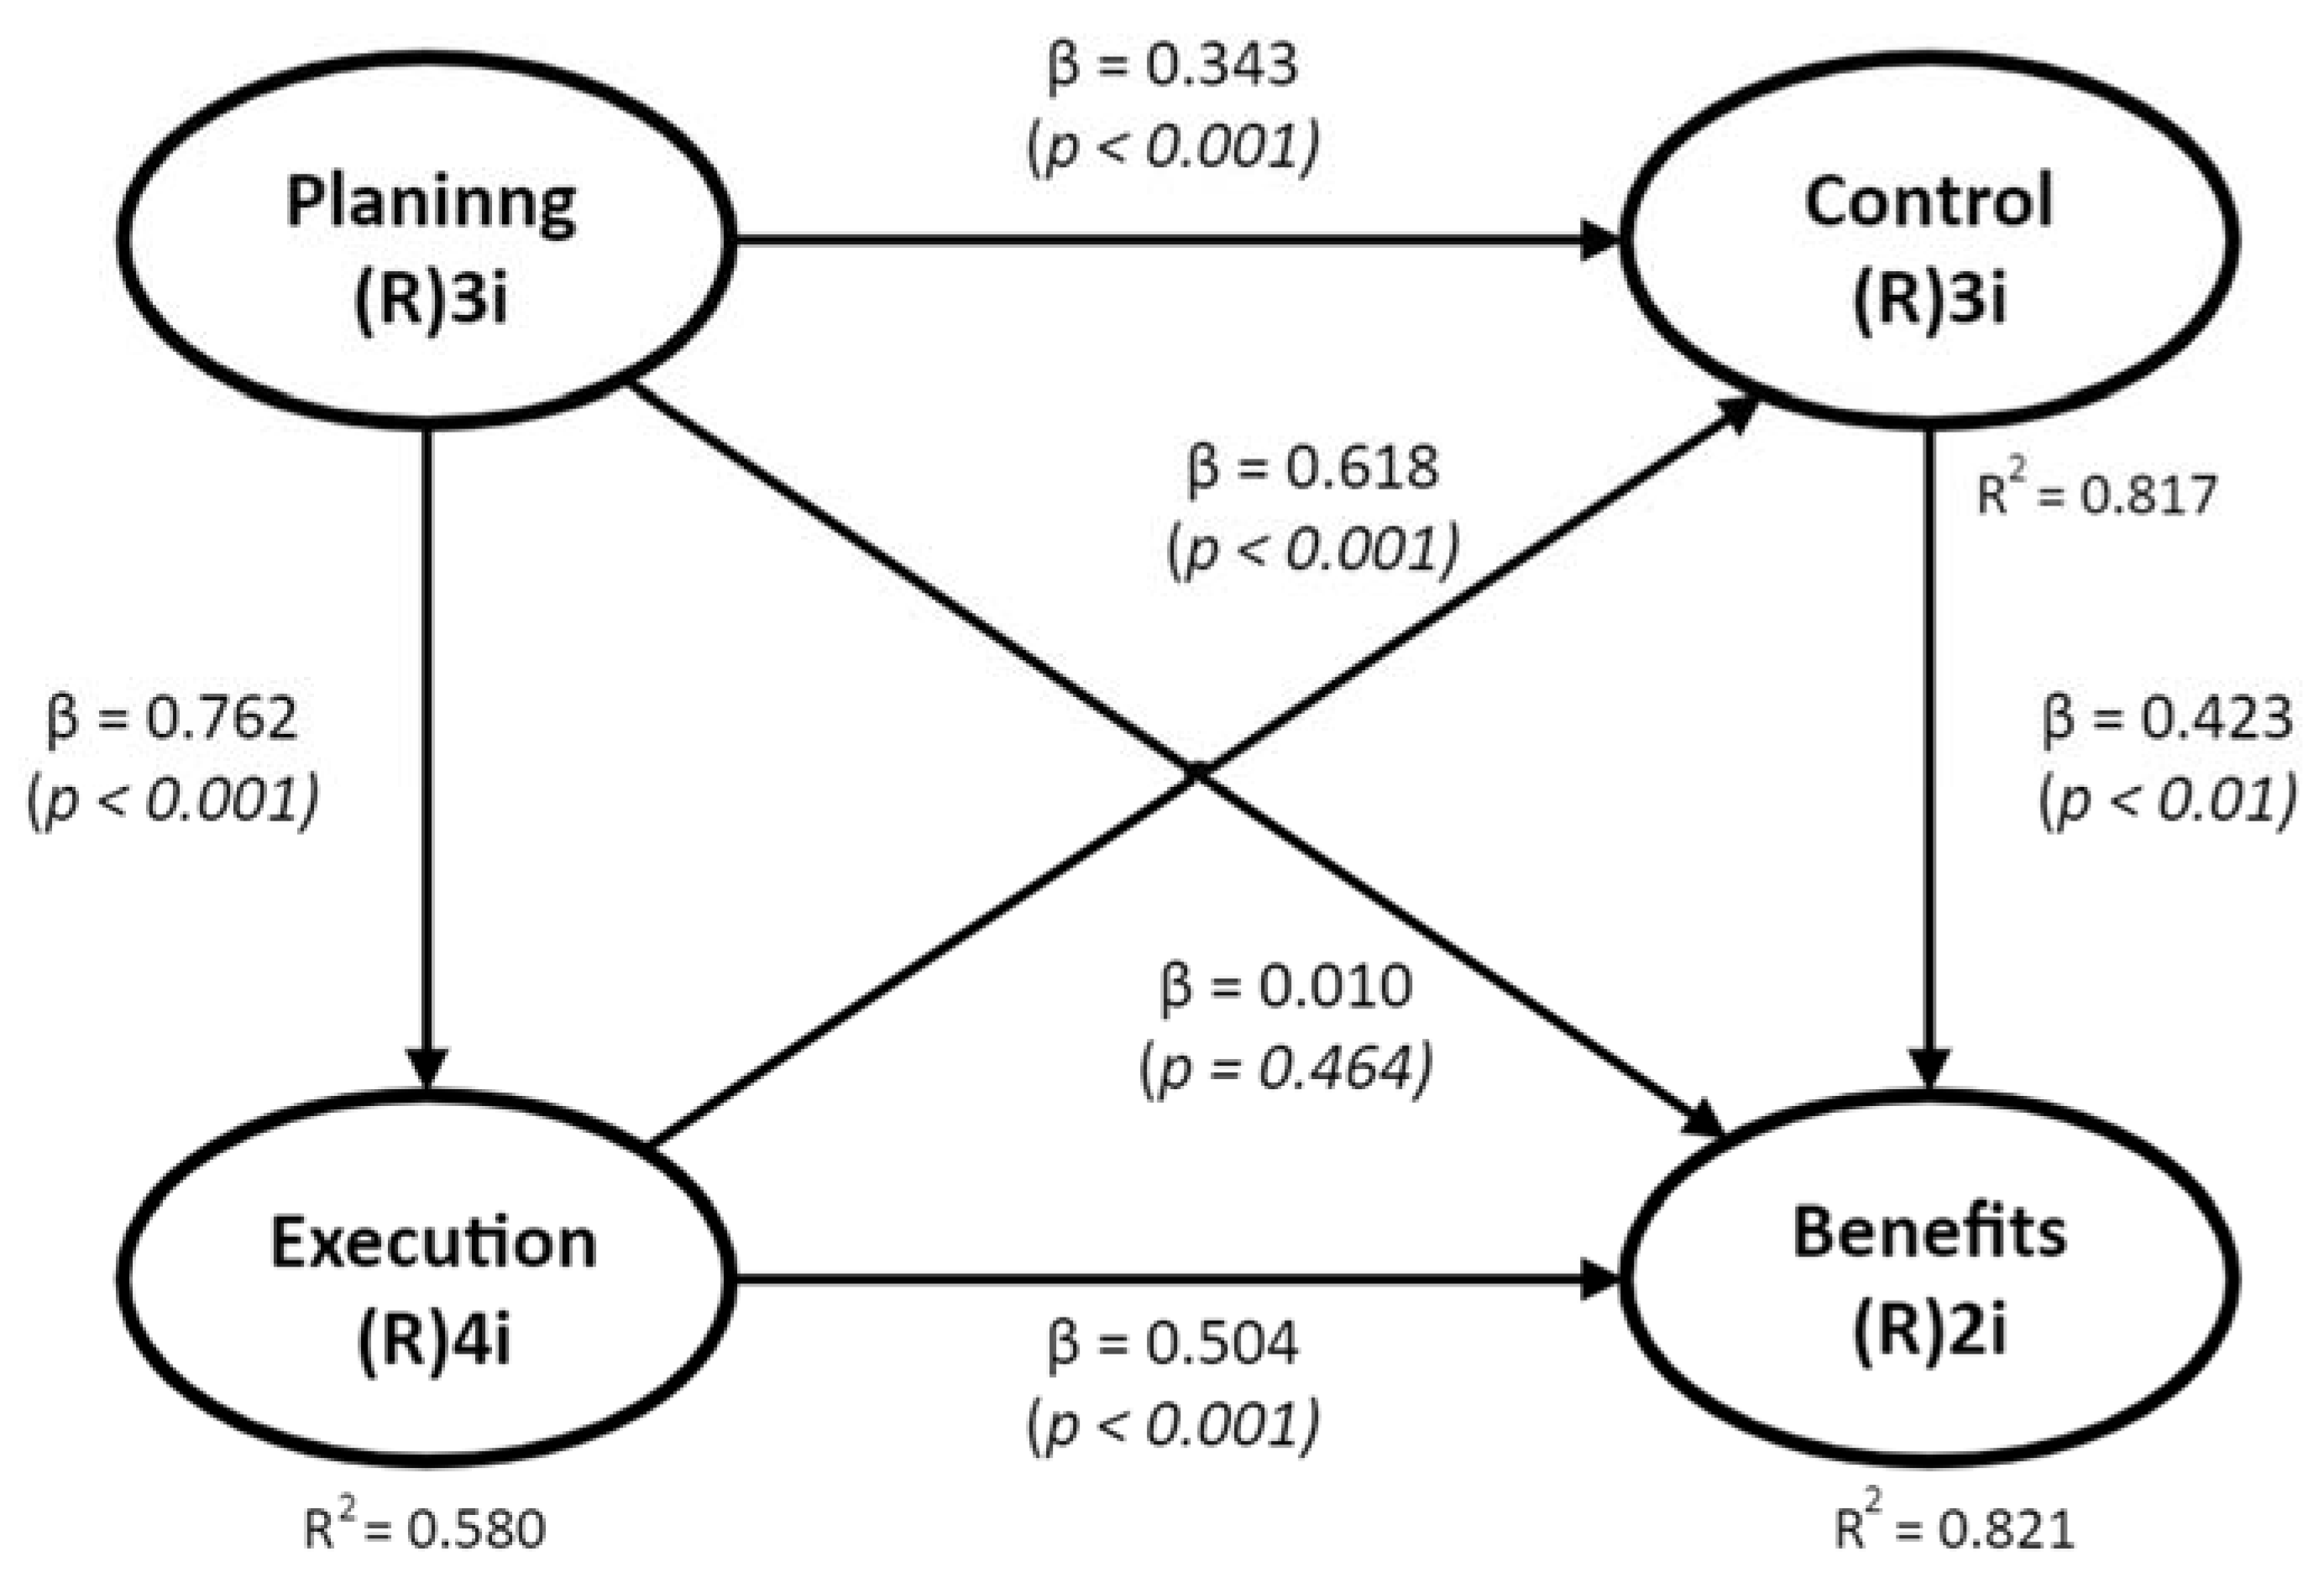
- For the Planning → Execution relationship in H1, it is concluded that there is sufficient evidence to state that the Planning stage has a direct and positive effect on the Execution stage since when the first variable increases its standard deviation by one unit, the second increases it by 0.76 units and can explain 58% of its variability. The above indicates that the investment and training in ICT in the SC favors the operations management, information exchange, production control, and activities associated with product distribution, which agrees with Dallasega et al. [67]. That finding indicates that managers should plan the ICT implementation processes in the SC, in order to understand the activities to be carried out, the dates, and who is responsible for the execution;
- In the Planning→Control relationship in H2, it is concluded that there is sufficient statistical evidence to state that the Planning stage has a direct and positive effect on the Control stage of the SC since when the first variable increases its standard deviation by one unit, the second increases it by 0.34 units and can explain 27.6% of its variability. This finding indicates that the investment and training in ICT for SC facilitates technological innovation, availability and information management, giving flexibility and agility to managers. These results agree with those reported by Zhou et al. [68], who state that in a contemporary smart manufacturing environment, production and operations control is almost impossible without the implementation of ICT;
- For the Execution→Control relationship in H3, there is enough statistical evidence to state that the Execution stage has a direct and positive effect on the Control stage, since when the former variable increases its standard deviation by one unit, the latter increases it by 0.62 units and can explain 61.8% of its variability. This indicates that the exchange of information, operations management, production control, and distribution activities in which ICTs are used facilitate technological innovation and the availability and information management generated in these processes. These results coincide with Böes, J. S. and J. O. Patzlaff [69] and Nair, P. R. and S. P. Anbuudayasankar [70] and, who state that using ICT in the SC facilitates communications, decision-making among members, and allow to control every relevant task;
- In the Planning→Benefits relationship in H4, there is sufficient statistical evidence to state that the Planning stage in a SC does not have a direct and positive effect on the Benefits obtained since the associated p-value is greater than 0.05. However, it can be concluded that the effect between these variables is indirect since it is given using Control and Execution as mediating variables, which has a value of 0.529 and is statistically positive, explaining 39.5% of its variability;
- That finding indicates that ICT investment plans and programs in the SC do not directly benefit the company but that this benefit appears when ICTs are used in the Execution and Control stages; in other word, plans must be executed and controlled first. That is, a plan is useless if it is not properly executed, and these results differ from the report of Nair, P. R. and S. P. Anbuudayasankar [70], who directly related these two variables in companies established in India, so it is possible that these differences are due to cultural aspects and to the nature of the maquiladora industry analyzed in our study, which are foreign investments;
- For the relationship between Execution→Benefits in H5, it is concluded that there is sufficient statistical evidence to state that the use of ICT in the Execution stage of SC operations has a direct and positive effect on the Benefits obtained, since when the first variable increases its standard deviation by one unit, the second increases it by 0.504 units and can explain up to 44.4 of its variability. This finding indicates that technological innovation, availability, and information management make it possible to obtain Benefits for the company and the client, with greater flexibility, agility, and lower cost for the managers;
- Finally, for the relationship between Control→Benefits, it is concluded that there is sufficient statistical evidence to state that the use of ICT controlling SC operations has a direct and positive effect on the Benefits obtained since when the first variable increases its standard deviation by one unit, the second increases it by 0.423 units and explains 36.9% of its variability. Managers can be sure that information exchange and operations management in the production and distribution process allows Benefits for the company and the customer. These results coincide with Mihardjo, L. W. W., Sasmoko, F. Alamsjah and Elidjen [71], who indicate that ICTs provide greater agility to the SC and facilitate inventory management and Control, as well as with Mihardjo et al. [71], who indicate that ICTs allow a quick response to customers and expedite decision making.
5.2. From the Sensitivity Analysis
- Managers should strive for Planning+, as this favors the attainment of Execution+ in H1, Control+ in H2, and Benefits+ in H4 with a conditional probability of 0.583, 0.417, and 0.500, respectively. Moreover, Planning+ is never associated with Execution−, Control−, and Benefits− since the conditional probabilities are zero. However, Planning− is a risk since it favors Execution−, Control−, and Benefits− with a probability of 0.769, 0.769, and 0.615, respectively. Furthermore, Planning+ is not associated with Execution+, Control+, and Benefits+;
- It is also observed that these plans must be properly executed to ensure better Control of SC operations and to obtain the Benefits since Execution+ favors Control+ in H3 and Benefits+ in H5 with a conditional probability of 0.714 and 0.643, respectively. Furthermore, Execution+ is not associated with Control− and Benefits−, as the probabilities are zero, justifying the investments and training in ICT. Similarly, Execution− is a risk, as it favors Control− and Benefits− with conditional probabilities of 0.667 and 0.800, respectively, and Execution− never favors Control+ and Benefits+, as the probabilities are zero;
- Finally, it is important to note that Control+ favors the occurrence of Benefits+ in H6 with a probability of 0.563 and does not favor Benefits−; however, Control− is a risk for Benefits− since it favors it by 0.643, but does not favor Benefits+, since the probability is zero.
6. Conclusions and Industrial Implications
7. Limitations and Future Research
Supplementary Materials
Author Contributions
Funding
Institutional Review Board Statement
Informed Consent Statement
Data Availability Statement
Acknowledgments
Conflicts of Interest
References
- Stoldt, J.; Trapp, T.U.; Toussaint, S.; Süße, M.; Schlegel, A.; Putz, M. Planning for digitalisation in SMEs using tools of the digital factory. Procedia CIRP 2018, 72, 179–184. [Google Scholar] [CrossRef]
- Avelar-Sosa, L.; García-Alcaraz, J.L.; Cedillo-Campos, M.G.; Adarme-Jaimes, W. Effects of regional infrastructure and offered services in the supply chains performance: Case Ciudad Juarez. Dyna 2014, 81, 208–217. [Google Scholar] [CrossRef]
- Montejano García, S.; Hernández Castorena, O.; Leija Escamilla, G.; Maldonado Guzmán, G.; Vivanco Florido, S. La influencia de la Administración de Operaciones en el rendimiento de la PyME. Investig. Cienc. 2010, 18, 66–74. [Google Scholar]
- Pal, K. Semantic Approach to Data Integration for an Internet of Things Supporting Apparel Supply Chain Management. Procedia Comput. Sci. 2020, 175, 197–204. [Google Scholar] [CrossRef]
- Hallikas, J.; Korpela, K.; Vilko, J.; Multaharju, S. Assessing Benefits of Information Process Integration in Supply Chains. In Proceedings of the 25th International Conference on Production Research Manufacturing Innovation: Cyber Physical Manufacturing, Chicago, IL, USA, 9–14 August 2019; pp. 1530–1537. [Google Scholar] [CrossRef]
- Hvolby, H.H.; Trienekens, J. Supply chain planning opportunities for small and medium sized companies. Comput. Ind. 2002, 49, 3–8. [Google Scholar] [CrossRef]
- Volpato, G.; Stocchetti, A. The role of ICT in the strategic integration of the automotive supply-chain. Int. J. Automot. Technol. Manag. 2002, 2, 239–260. [Google Scholar] [CrossRef]
- Shuhui, Y.; Zhang, Y.; Umar, M.; Shah, A. Empirical Investigation to assess the impact of ICT deployment in Supply Chain Management. J. Adv. Manuf. Syst. 2020, 1–17. [Google Scholar] [CrossRef]
- Schilling, L.; Seuring, S. The Role of Information and Communication Technology in Managing Supply Chains in Base-of-the-Pyramid Markets. IEEE Trans. Eng. Manag. 2022, 1–13. [Google Scholar] [CrossRef]
- Wijewickrama, M.K.C.S.; Chileshe, N.; Rameezdeen, R.; Ochoa, J.J. Information sharing in reverse logistics supply chain of demolition waste: A systematic literature review. J. Clean. Prod. 2021, 280, 124359. [Google Scholar] [CrossRef]
- Li, S.; Lin, B. Accessing information sharing and information quality in supply chain management. Decis. Support Syst. 2006, 42, 1641–1656. [Google Scholar] [CrossRef]
- Pérez-López, R.J.; Olguín-Tiznado, J.E.; García-Alcaraz, J.L.; Camargo-Wilson, C.; López-Barreras, J.A. The role of planning and implementation of ICT in operational benefits. Sustainability 2018, 10, 2261. [Google Scholar] [CrossRef]
- Pérez-López, R.J.; Olguín-Tiznado, J.E.; García-Alcaraz, J.L.; Mojarro-Magaña, M.; Camargo-Wilson, C.; López-Barreras, J.A. Integrating and controlling ict implementation in the supply chain: The SME experience from baja california. Mathematics 2021, 9, 1234. [Google Scholar] [CrossRef]
- Yadav, S.; Singh, S.P. Blockchain critical success factors for sustainable supply chain. Resour. Conserv. Recycl. 2020, 152, 104505. [Google Scholar] [CrossRef]
- Mabrouk, N.; Omri, A.; Jarraya, B. Factors influencing the performance of supply chain management in Saudi SMEs. Uncertain Supply Chain. Manag. 2020, 8, 569–578. [Google Scholar] [CrossRef]
- Rieckhof, R.; Guenther, E. Integrating life cycle assessment and material flow cost accounting to account for resource productivity and economic-environmental performance. Int. J. Life Cycle Assess. 2018, 23, 1491–1506. [Google Scholar] [CrossRef]
- Bag, S.; Pretorius, J.H.C. Relationships between industry 4.0, sustainable manufacturing and circular economy: Proposal of a research framework. Int. J. Organ. Anal. 2022, 30, 864–898. [Google Scholar] [CrossRef]
- Taddei, E.; Sassanelli, C.; Rosa, P.; Terzi, S. Circular supply chains in the era of industry 4.0: A systematic literature review. Comput. Ind. Eng. 2022, 170, 108268. [Google Scholar] [CrossRef]
- Allaoui, H.; Guo, Y.; Sarkis, J. Decision support for collaboration planning in sustainable supply chains. J. Clean. Prod. 2019, 229, 761–774. [Google Scholar] [CrossRef]
- Jaimes, W.A.; Serna, M.D.A.; Balcázar, D.A. Modelo para la coordinación de agentes en un sistema logístico de la industria astillera colombiana. Ing. Investig. 2011, 31, 102–111. [Google Scholar]
- Kiisler, A.; Solakivi, T.; Hilmola, O.-P. Supply Chain and ICT Issues of Estonia: Survey Findings. Procedia Comput. Sci. 2020, 176, 828–837. [Google Scholar] [CrossRef]
- Chopra, S.; Peter, M. Administración de la Cadena de Suministro; Pearson Educación: London, UK, 2008. [Google Scholar]
- Hellingrath, B.; Lechtenberg, S. Applications of artificial intelligence in supply chain management and logistics: Focusing onto recognition for supply chain execution. In The Art of Structuring; Springer: Cham, Switzerland, 2019; pp. 283–296. [Google Scholar] [CrossRef]
- Frazelle, E. Supply Chain Strategy: The Logistics of Supply Chain Management; McGraw-Hill: New York, NY, USA, 2020. [Google Scholar]
- Chiavenato, I. Introducción a la Teoría General de la Administración: Una Visión Integral de la Moderna Administración de las Organizaciones; McGraw-Hill: Mexico, Mexico, 2019. [Google Scholar]
- Bohórquez, L.E. Sistemas de control estratégico y organizacional. Críticas y desafíos. Rev. Cienc. Estratégicas 2011, 19, 307–322. [Google Scholar]
- Martín, E.R.R.; Llanes, A.A.; de Valdivia, L.M.P. Aportes sobre el control de gestión de la cadena de suministro a la asignatura logística. Pedagog. Soc. 2016, 19, 93–114. [Google Scholar]
- Scheller, C.; Blömeke, S.; Nippraschk, M.; Schmidt, K.; Mennenga, M.; Spengler, T.S.; Herrmann, C.; Goldmann, D. Coordinated Planning in Closed-loop Supply Chains and its Implications on the Production and Recycling of Lithium-ion Batteries. Procedia CIRP 2021, 98, 464–469. [Google Scholar] [CrossRef]
- Dutta, G.; Kumar, R.; Sindhwani, R.; Singh, R.K. Digital transformation priorities of India’s discrete manufacturing SMEs–a conceptual study in perspective of Industry 4.0. Compet. Rev. Int. Bus. J. 2020, 30, 289–314. [Google Scholar] [CrossRef]
- Vendrell-Herrero, F.; Bustinza, O.F.; Opazo-Basaez, M. Information technologies and product-service innovation: The moderating role of service R&D team structure. J. Bus. Res. 2020, 128, 673–687. [Google Scholar] [CrossRef]
- Kumar, A.; Singh, R.K.; Modgil, S. Exploring the relationship between ICT, SCM practices and organizational performance in agri-food supply chain. Benchmarking: Int. J. 2020, 27, 1003–1041. [Google Scholar] [CrossRef]
- Calabria, J.; Leonor, L.; Nigrinis, M.; Margarita, K.; Blanco, S.; Alejandra, M. Evolución de las Tics Aplicadas en la Actividad de la Cadena de Suministros y de Transporte; Universidad Cooperativa de Colombia: Santa Marta, Colombia, 2021. [Google Scholar]
- Koech, S.K.; Ayoyi, I.R.; Mugambi, F. Factors Influencing Adoption of E-Procurement in Kenya’s Public Sector. Eur. J. Logist. Purch. Supply Chain. Manag. 2016, 4, 19–25. [Google Scholar]
- Mora-Ochomogo, E.I.; Mora-Vargas, J.; Serrato, M. A qualitative analysis of inventory management strategies in humanitarian logistics operations. Int. J. Comb. Optim. Probl. Inform. 2016, 7, 40–53. [Google Scholar]
- Petrick, I.; Maitland, C.; Pogrebnyakov, N. Unpacking Coordination Benefits in Supply Networks: Findings from Manufacturing SMEs. J. Small Bus. Manag. 2016, 54, 582–597. [Google Scholar] [CrossRef]
- González Torres, L.A.; Ibarra Cisneros, M.A.; Cervantes Collado, K.E. El impacto de las tecnologías de la información y comunicación en la industria manufacturera de Baja California. Región Soc. 2017, 29, 153–183. [Google Scholar] [CrossRef]
- Castiblanco Jiménez, J.C.; Díaz Romero, E.F. Las TIC en la Administración de la Cadena de Suministro y su Incidencia en el Desempeño Operacional; Universidad del Rosario: Bogota, Colombia, 2015. [Google Scholar]
- Denolf, J.M.; Trienekens, J.H.; Wognum, P.N.; van der Vorst, J.G.; Omta, S.O. Towards a framework of critical success factors for implementing supply chain information systems. Comput. Ind. 2015, 68, 16–26. [Google Scholar] [CrossRef]
- Kumar, R.; Singh, R.K.; Shankar, R. Critical success factors for implementation of supply chain management in Indian small and medium enterprises and their impact on performance. IIMB Manag. Rev. 2015, 27, 92–104. [Google Scholar] [CrossRef]
- Hwang, D.; Yang, M.G.M.; Hong, P. Mediating effect of IT-enabled capabilities on competitive performance outcomes: An empirical investigation of ERP implementation. J. Eng. Technol. Manag. 2015, 36, 1–23. [Google Scholar] [CrossRef]
- Hudnurkar, M.; Jakhar, S.; Rathod, U. Factors affecting collaboration in supply chain: A literature review. Procedia-Soc. Behav. Sci. 2014, 133, 189–202. [Google Scholar] [CrossRef]
- dos Reis, R.A.; Freitas, M.d.C.D. Critical factors on information technology acceptance and use: An analysis on small and medium Brazilian clothing industries. Procedia Comput. Sci. 2014, 31, 105–114. [Google Scholar] [CrossRef]
- Devaraj, S.; Krajewski, L.; Wei, J.C. Impact of eBusiness technologies on operational performance: The role of production information integration in the supply chain. J. Oper. Manag. 2007, 25, 1199–1216. [Google Scholar] [CrossRef]
- Zailani, S.; Jeyaraman, K.; Vengadasan, G.; Premkumar, R. Sustainable supply chain management (SSCM) in Malaysia: A survey. Int. J. Prod. Econ. 2012, 140, 330–340. [Google Scholar] [CrossRef]
- Ruiz Chávez, B.M.; Trinidad Cerda, Y.E. Efecto de las Tecnologías de Información y Comunicación (TIC) en la Competitividad Internacional de las Pymes Agroexportadoras de Espárragos Frescos en Lima Metropolitana y C; Universidad San Ignacio de Loyola: La Molina, Peru, 2017. [Google Scholar]
- Alfalla-Luque, R.; Marin-Garcia, J.A.; Medina-Lopez, C. An analysis of the direct and mediated effects of employee commitment and supply chain integration on organisational performance. Int. J. Prod. Econ. 2015, 162, 242–257. [Google Scholar] [CrossRef]
- Milesi, D.; Petelski, N.; Verre, V. Innovación y Uso de Patentes en la Industria Manufacturera Argentina. In La Encuesta Nacional de Dinámica de Empleo e Innovación (ENDEI) Como Herramienta de Análisis: La Innovación y el Empleo en la Industria Manufacturera Argentina; LC/TS. 2017/102; CEPAL: Santiago, Chile, 2017; pp. 231–254. [Google Scholar]
- Pérez-López, R.J.; Olguín Tiznado, J.E.; Mojarro Magaña, M.; Camargo Wilson, C.; López Barreras, J.A.; García-Alcaraz, J.L. Information Sharing with ICT in Production Systems and Operational Performance. Sustainability 2019, 11, 3640. [Google Scholar] [CrossRef]
- Haj, K.A.; Dhiaf, M.M. Do information and communication technologies affect the performance of a supply chain? Pieces of evidence from the Tunisian food sector. Yugosl. J. Oper. Res. 2019, 29, 539–552. [Google Scholar] [CrossRef]
- Cheng, J.-H. Inter-organizational relationships and knowledge sharing in green supply chains—Moderating by relational benefits and guanxi. Transp. Res. Part E Logist. Transp. Rev. 2011, 47, 837–849. [Google Scholar] [CrossRef]
- Orji, I.J.; Kusi-Sarpong, S.; Gupta, H. The critical success factors of using social media for supply chain social sustainability in the freight logistics industry. Int. J. Prod. Res. 2020, 58, 1522–1539. [Google Scholar] [CrossRef]
- Madonsela, N.S. Integration of the Management Information System for Competitive Positioning. Procedia Manuf. 2020, 43, 375–382. [Google Scholar] [CrossRef]
- O’Connor, N.; Lowry, P.B.; Treiblmaier, H. Interorganizational cooperation and supplier performance in high-technology supply chains. Heliyon 2020, 6, e03434. [Google Scholar] [CrossRef]
- Partanen, J.; Kohtamäki, M.; Patel, P.C.; Parida, V. Supply chain ambidexterity and manufacturing SME performance: The moderating roles of network capability and strategic information flow. Int. J. Prod. Econ. 2020, 221, 107470. [Google Scholar] [CrossRef]
- Apiyo, R.; Kiarie, D. Role of ict tools in supply chain performance. Int. J. Supply Chain. Manag. 2018, 3, 17–26. [Google Scholar]
- Likert, R. A technique for the measurement of attitudes. Arch. Psychol. 1932, 22, 55. [Google Scholar]
- AL-Tahat, M.D.; Bataineh, K.M. Statistical analyses and modeling of the implementation of agile manufacturing tactics in industrial firms. Math. Probl. Eng. 2012, 2012, 731092. [Google Scholar] [CrossRef]
- García-Alcaraz, J.L.; Martínez-Loya, V.; Reza, J.R.D.; Fong, J.R.M. EL Rol de la gerencia y black belts en el éxito de seis sigma. In Proceedings of the Congreso Internacional Academia Journals, Ciudad Juárez, Mexico, 4 April 2017. [Google Scholar]
- García-Alcaraz, J.L.; Oropesa-Vento, M.; Maldonado-Macías, A.A. Kaizen Planning, Implementing and Controlling; Springer: Ciudad Juárez, Chihuahua, Mexico, 2016. [Google Scholar]
- Alcaraz, J.L.G. Modelos Multivariables Para la Toma de Decisiones en Sistemas Productivos: Estudios de Caso en la Industria Vitivinícola (España) y Maquiladora (México). Ph.D. Thesis, Universidad de La Rioja, Logroño, Spain, 2016. [Google Scholar]
- Manenti, F.; Buzzi-Ferraris, G. Criteria for outliers detection in nonlinear regression problems. In Computer Aided Chemical Engineering; Elsevier: Amsterdam, The Netherlands, 2009; Volume 26, pp. 913–917. [Google Scholar] [CrossRef]
- Lindell, M.K.; Whitney, D.J. Accounting for common method variance in cross-sectional research designs. J. Appl. Psychol. 2001, 86, 114. [Google Scholar] [CrossRef]
- Kock, N. WarpPLS 5.0 User Manual; ScriptWarp Systems: Laredo, TX, USA, 2015. [Google Scholar]
- Castañeda, M.B. Procesamiento de Datos y Análisis Estadísticos Utilizando SPSS: Un Libro Práctico para Investigadores y Administradores Educativos; Edipucrs: Aeroporto de Porto Alegre, Brazil, 2010. [Google Scholar]
- Iacobucci, D.; Posavac, S.S.; Kardes, F.R.; Schneider, M.J.; Popovich, D.L. Toward a more nuanced understanding of the statistical properties of a median split. J. Consum. Psychol. 2015, 25, 652–665. [Google Scholar] [CrossRef]
- Ketchen, D.J. A primer on partial least squares structural equation modeling. Long Range Plan. 2013, 46, 184–185. [Google Scholar] [CrossRef]
- Dallasega, P.; Rojas, R.A.; Rauch, E.; Matt, D.T. Simulation Based Validation of Supply Chain Effects through ICTenabled Real-time-capability in ETO Production Planning. Procedia Manuf. 2017, 11, 846–853. [Google Scholar] [CrossRef]
- Zhou, L.; Jiang, Z.; Geng, N.; Niu, Y.; Cui, F.; Liu, K.; Qi, N. Production and operations management for intelligent manufacturing: A systematic literature review. Int. J. Prod. Res. 2022, 60, 808–846. [Google Scholar] [CrossRef]
- Böes, J.S.; Patzlaff, J.O. Information and communication technology (ICT) applied to quality control to secure performance and compliance in project lifespan. J. Build. Rehabil. 2016, 1, 1–14. [Google Scholar] [CrossRef][Green Version]
- Nair, P.R.; Anbuudayasankar, S.P. An investigation on the benefits of ict deployment in supply chain management (SCM). Ind. J. Sci. Technol. 2016, 9, 1–17. [Google Scholar] [CrossRef]
- Mihardjo, L.W.W.; Sasmoko; Alamsjah, F.; Elidjen. The influence of digital customer experience and electronic word of mouth on brand image and supply chain sustainable performance. Uncertain Supply Chain. Manag. 2019, 7, 691–702. [Google Scholar] [CrossRef]
- Toudert, D. Digital Divide, Frequently Use of Internet and Benefits in Mexico. Converg.-Rev. Cienc. Soc. 2019, 79, 1–27. [Google Scholar] [CrossRef]
- Caro Soto, F.G. Las Tecnologías de la Información y la Gestión Administrativa de la Facultad de Ciencias Empresariales de la Universidad Nacional José Faustino Sánchez Carrión-2016. Ph.D. Thesis, Universidad Nacional José Faustino Sánchez Carrión, Huancho, Peru, 2018. [Google Scholar]
- García-Alcaraz, J.L.; Avelar-Sosa, L.; Latorre-Biel, J.I.; Jiménez-Macías, E.; Alor-Hernández, G. Role of human knowledge and communication on operational benefits gained from six sigma. Sustainability 2017, 9, 1721. [Google Scholar] [CrossRef]


| Industrial Sector | Manager/Assistant Manager | Department Head | Supervisor | Total |
|---|---|---|---|---|
| Manufacturing industries | 8 | 11 | 17 | 36 |
| Food industry | 4 | 1 | 2 | 7 |
| Garment manufacturing | 2 | 5 | 0 | 7 |
| Manufacture of computer equipment | 1 | 1 | 5 | 7 |
| Manufacture of electronic accessories | 2 | 1 | 4 | 7 |
| Plastics industry | 1 | 2 | 3 | 6 |
| Manufacture of metal products | 2 | 0 | 3 | 5 |
| Printing and related industries | 2 | 0 | 1 | 3 |
| Manufacture of non-metallic mineral products | 1 | 0 | 0 | 1 |
| Manufacture of furniture, mattresses, and blinds | 1 | 0 | 0 | 1 |
| Total | 24 | 21 | 35 | 80 |
| Gender | Years in Position | ||||
|---|---|---|---|---|---|
| 1–2 | 2–5 | 5–10 | >10 | Total | |
| Male | 18 | 21 | 7 | 8 | 54 |
| Female | 12 | 6 | 3 | 5 | 26 |
| Total | 30 | 27 | 10 | 13 | 80 |
| Indices | Latent Variables | |||
|---|---|---|---|---|
| Planning | Execution | Control | Benefits | |
| R-squared | 0.580 | 0.817 | 0.821 | |
| Adjusted R-squared | 0.575 | 0.812 | 0.814 | |
| Reliability index | 0.914 | 0.906 | 0.921 | 0.956 |
| Cronbach’s alpha | 0.859 | 0.861 | 0.872 | 0.908 |
| Average variance extracted | 0.781 | 0.707 | 0.796 | 0.915 |
| Variance inflation index | 2.922 | 5.847 | 5.924 | 5.236 |
| Q-squared | 0.582 | 0.816 | 0.820 | |
| Items Planning | Median | Interquartile Range | |
|---|---|---|---|
| ICT integration | |||
| 1 | Utilizing ICT in routine meetings. | 3.51 | 1.836 |
| 2 | Utilization of ICT in the company’s operations. | 4.088 | 1.5 |
| 3 | Utilization of ICT in the essential adjustments to the company’s internal collaboration. | 3.788 | 1.565 |
| 4 | Utilization of ICT in company operations. | 4.036 | 1.539 |
| 5 | Utilization of ICT in decision-making. | 4.182 | 1.656 |
| 6 | Utilization of ICT while investing in new goods. | 4.107 | 1.65 |
| ICT investment | |||
| 1 | Your organization’s computer equipment is adequate. | 4.035 | 1.509 |
| 2 | Sufficient number of ICT experts within your firm. | 3.2 | 1.631 |
| 3 | Knowledge required for the utilization of ICT. | 3.462 | 1.707 |
| 4 | Software assistance is available from the developer. | 3.316 | 2.252 |
| 5 | Retrieve details regarding suppliers, customers, and rivals. | 3.56 | 1.765 |
| 6 | Gather and analyze data to understand consumer requirements. | 3.778 | 1.769 |
| ICT training | |||
| 1 | Training users of information technology on changes, skills, the significance of data accuracy, and their respective duties. | 3.5 | 1.834 |
| 2 | Training users of the information system by periodic attendance at a structured training session that satisfies the necessary criteria. | 3.318 | 1.953 |
| 3 | Training the users of the information system using job-specific training teams. | 3.468 | 1.878 |
| 4 | Operational Advantages | ||
| 5 | The adaptability of systems to satisfy client requirements. | 4.091 | 1.63 |
| 6 | Enhance your customer relationships. | 4 | 1.629 |
| 7 | Cost-effectiveness. | 4.038 | 1.745 |
| 8 | Reduced order cycle times. | 3.878 | 1.82 |
| 9 | Increased delivery capacity to customers. | 4.123 | 1.609 |
| ItemsExecution | |||
| Technological innovation | |||
| 1 | Find and update the most advanced information technologies. | 3.533 | 1.921 |
| 2 | Effective data interchange use. | 3.714 | 1.695 |
| 3 | Maintain the system of information. | 3.558 | 1.705 |
| 4 | Maintain a robust data network with suppliers and clients to monitor and assess the information exchange. | 3.745 | 1.748 |
| Availability of information | |||
| 1 | Suppliers. | 3.694 | 1.71 |
| 2 | Commercial clients. | 3.904 | 1.507 |
| 3 | Customers and suppliers are involved in the product development process. | 3.745 | 1.621 |
| 4 | Supplier activity and relationship management. | 3.569 | 1.526 |
| 5 | Customer demand management. | 3.887 | 1.502 |
| 6 | Inventory control supplies. | 3.83 | 1.49 |
| 7 | Fulfillment and delivery order management. | 4.018 | 1.478 |
| 8 | Order follow-up for the customer. | 4.164 | 1.413 |
| Information management | |||
| 1 | Multiple internal information systems | 3.745 | 1.483 |
| 2 | The capacity of the organization’s Internet connection. | 3.977 | 1.62 |
| 3 | To deliver superior services. | 3.92 | 1.553 |
| 4 | The internal computer network system. | 3.83 | 1.637 |
| 5 | Trends in electronic markets. | 3.634 | 1.967 |
| 6 | Systems for sales and purchasing. | 3.863 | 1.575 |
| 7 | The planning and programming of the activities of the organization. | 3.808 | 1.567 |
| 8 | The application utilized by the information system. | 3.725 | 1.635 |
| 9 | Warehouse management systems. | 3.609 | 1.85 |
| Cost and flexibility | |||
| 1 | The adaptability of systems to satisfy client requirements. | 4.091 | 1.63 |
| 2 | Enhance your customer relationships. | 4 | 1.629 |
| 3 | Cost-effectiveness. | 4.038 | 1.745 |
| 4 | Reduced order cycle times. | 3.878 | 1.82 |
| 5 | Adaptability in reaction to consumer needs. | 4.123 | 1.609 |
| ItemsControl | |||
| Exchange of information | |||
| 1 | Relationship with vendors. | 3.792 | 1.501 |
| 2 | The logistical operation. | 3.873 | 1.447 |
| 3 | Meet the client’s need and enhance customer service. | 4.213 | 1.492 |
| 4 | Management of inventory with suppliers and customers. | 4.143 | 1.616 |
| 5 | Relationship with vendors. | 4.07 | 1.518 |
| Operations management | |||
| 1 | Production processes. | 3.769 | 1.54 |
| 2 | Maintenance management. | 3.407 | 1.652 |
| 3 | Strategic manufacturing process management. | 3.755 | 1.511 |
| 4 | Production preparation. | 4.05 | 1.397 |
| 5 | Enhance the manufacturing decision-making process. | 3.957 | 1.565 |
| Production | |||
| 1 | Maintenance planning | 3.455 | 1.67 |
| 2 | The Execution of duties in the work environment. | 3.7 | 1.68 |
| 3 | Delays in the method. | 3.679 | 1.514 |
| 4 | Introduce innovative goods and services. | 3.824 | 1.561 |
| 5 | Respond to changes in the market | 3.936 | 1.58 |
| Distribution | |||
| 1 | Production control management. | 3.98 | 1.51 |
| 2 | Material requirements planning management. | 3.83 | 1.649 |
| 3 | Coordination of suppliers with production lines. | 3.681 | 1.786 |
| ItemsBenefits | |||
| Customer benefit | |||
| 1 | System adaptability to fulfill the demands of customers. | 4.091 | 1.63 |
| 2 | Improve customer connections. | 4 | 1.629 |
| 3 | Cost effectiveness. | 4.038 | 1.745 |
| 4 | Order cycles are shorter. | 3.878 | 1.82 |
| 5 | Customer reaction flexibility. | 4.123 | 1.609 |
| 6 | From vendors. | 3.633 | 1.74 |
| 7 | From opponents. | 3.581 | 1.927 |
| 8 | To offer high-quality services. | 3.955 | 1.651 |
| 9 | To meet the demands of customers. | 4.2 | 1.545 |
| 10 | The customer’s information is correct. | 4.153 | 1.531 |
| 11 | In terms of information security. | 4.105 | 1.542 |
| 12 | Based on credible data (depending on capacity, trustworthiness, solvency). | 4.036 | 1.57 |
| 13 | Information that is current (relevance, recession). | 4.018 | 1.611 |
| Company profit | |||
| 1 | On-time. | 4.233 | 1.514 |
| 2 | In terms of quality. | 4.089 | 1.597 |
| 3 | In the right quantity. | 4.193 | 1.617 |
| 4 | In the appropriate product. | 4.237 | 1.544 |
| 5 | Stock replacement. | 3.787 | 1.686 |
| 6 | Time spent cycling (from raw material to delivery). | 3.773 | 1.819 |
| 7 | Inventory control strategy. | 3.97 | 2.086 |
| 8 | The acquisition of materials is being planned. | 3.857 | 1.838 |
| 9 | Periodic inventory review. | 3.902 | 1.796 |
| 10 | Improve customer delivery time. | 4.073 | 1.598 |
| 11 | Increase the online availability of raw resources. | 3.692 | 2.098 |
| 12 | Productivity has increased. | 3.76 | 1.617 |
| 13 | Cut inventory expenses. | 3.848 | 1.659 |
| 14 | Our final items’ performance. | 3.782 | 1.497 |
| 15 | The rate of delivery. | 4.018 | 1.592 |
| 16 | Volume or adaptable capacity. | 3.714 | 1.698 |
| 17 | The extent to which products differ. | 3.8 | 1.58 |
| 18 | Reduced production costs. | 3.667 | 1.951 |
| 19 | Planning efficiency is increased. | 4.019 | 1.674 |
| Indices | Value |
|---|---|
| Average Path Coefficient (APC) | 0.443, p < 0.001 |
| Average R-squared (ARS) | 0.739, p < 0.001 |
| Average adjusted R-squared (AARS) | 0.733, p < 0.001 |
| Average block VIF (AVIF) | 3.552 |
| Average full collinearity VIF (AFVIF) | 4.982 |
| Tenenhaus GoF | 0.769 |
| Hypothesis | Relationship | β Value | p-Value | Conclusion |
|---|---|---|---|---|
| H1 | Planning → Execution | 0.762 | <0.001 | Accept |
| H2 | Planning → Control | 0.343 | <0.001 | Accept |
| H3 | Execution → Control | 0.618 | <0.001 | Accept |
| H4 | Planning → Benefits | 0.010 | =0.464 | Reject |
| H5 | Execution → Benefits | 0.504 | <0.001 | Accept |
| H6 | Control → Benefits | 0.423 | <0.001 | Accept |
| To | From | |
|---|---|---|
| Planning | Execution | |
| Control | 0.471 (p < 0.001) ES = 0.379 | |
| Benefits | 0.529 (p < 0.001) ES = 0.395 | 0.262 (p < 0.001) ES = 0.231 |
| To | From | ||
|---|---|---|---|
| Planning | Execution | Control | |
| Execution | 0.762 (p < 0.001) ES = 0.580 | ||
| Control | 0.814 (p < 0.001) ES = 0.655 | 0.618 (p < 0.001) ES = 0.541 | |
| Benefits | 0.739 (p < 0.001) ES = 0.551 | 0.766 (p < 0.001) ES = 0.675 | 0.423 (p < 0.001) ES = 0.369 |
| MODEL | From | Planning | Execution | Control | ||||||||||
|---|---|---|---|---|---|---|---|---|---|---|---|---|---|---|
| Level | + | − | + | − | + | − | ||||||||
| To | Level | 0.152 | 0.165 | 0.177 | 0.19 | 0.203 | 0.177 | |||||||
| Execution | + | 0.177 | & | 0.089 | & | 0.000 | ||||||||
| If | 0.583 | If | 0.000 | |||||||||||
| − | 0.190 | & | 0.000 | & | 0.127 | |||||||||
| If | 0.000 | If | 0.769 | |||||||||||
| Control | + | 0.203 | & | 0.063 | & | 0.203 | & | 0.127 | & | 0.000 | ||||
| If | 0.417 | If | 0.242 | If | 0.714 | If | 0.000 | |||||||
| − | 0.177 | & | 0.000 | & | 0.127 | & | 0.000 | & | 0.127 | |||||
| If | 0.000 | If | 0.769 | If | 0.000 | If | 0.667 | |||||||
| Benefits | + | 0.177 | & | 0.076 | & | 0.000 | & | 0.114 | & | 0.000 | & | 0.114 | & | 0.000 |
| If | 0.500 | If | 0.000 | If | 0.643 | If | 0.000 | If | 0.563 | If | 0.000 | |||
| − | 0.177 | & | 0.000 | & | 0.101 | & | 0.000 | & | 0.152 | & | 0.000 | & | 0.114 | |
| If | 0.000 | If | 0.615 | If | 0.000 | If | 0.800 | If | 0.000 | If | 0.643 | |||
Publisher’s Note: MDPI stays neutral with regard to jurisdictional claims in published maps and institutional affiliations. |
© 2022 by the authors. Licensee MDPI, Basel, Switzerland. This article is an open access article distributed under the terms and conditions of the Creative Commons Attribution (CC BY) license (https://creativecommons.org/licenses/by/4.0/).
Share and Cite
Pérez-López, R.J.; Mojarro-Magaña, M.; Olguín-Tiznado, J.E.; Camargo-Wilson, C.; López-Barreras, J.A.; Cano Gutiérrez, J.C.; Garcia-Alcaraz, J.L. Planning, Execution, and Control of Operations in SC Activities—Baja California Manufacturing Case Study. Mathematics 2022, 10, 3468. https://doi.org/10.3390/math10193468
Pérez-López RJ, Mojarro-Magaña M, Olguín-Tiznado JE, Camargo-Wilson C, López-Barreras JA, Cano Gutiérrez JC, Garcia-Alcaraz JL. Planning, Execution, and Control of Operations in SC Activities—Baja California Manufacturing Case Study. Mathematics. 2022; 10(19):3468. https://doi.org/10.3390/math10193468
Chicago/Turabian StylePérez-López, Rubén Jesús, María Mojarro-Magaña, Jesús Everardo Olguín-Tiznado, Claudia Camargo-Wilson, Juan Andrés López-Barreras, Julio Cesar Cano Gutiérrez, and Jorge Luis Garcia-Alcaraz. 2022. "Planning, Execution, and Control of Operations in SC Activities—Baja California Manufacturing Case Study" Mathematics 10, no. 19: 3468. https://doi.org/10.3390/math10193468
APA StylePérez-López, R. J., Mojarro-Magaña, M., Olguín-Tiznado, J. E., Camargo-Wilson, C., López-Barreras, J. A., Cano Gutiérrez, J. C., & Garcia-Alcaraz, J. L. (2022). Planning, Execution, and Control of Operations in SC Activities—Baja California Manufacturing Case Study. Mathematics, 10(19), 3468. https://doi.org/10.3390/math10193468