Article

A Vehicular Edge Computing-Based Architecture and Task Scheduling Scheme for Cooperative Perception in Autonomous Driving

The School of Information Science and Engineering, Yunnan University, Kunming 650500, China
*
Author to whom correspondence should be addressed.
Mathematics 2022, 10(18), 3328; https://doi.org/10.3390/math10183328
Submission received: 18 July 2022 / Revised: 8 September 2022 / Accepted: 9 September 2022 / Published: 14 September 2022
(This article belongs to the Special Issue Optimisation Algorithms and Their Applications)

Abstract

:
Cooperative perception is an important domain of autonomous driving that helps to improve road safety and traffic efficiency. Nevertheless, the large amount of sensed data and complicated algorithms make storage and computation for autonomous vehicles (AVs) challenging. Furthermore, not every AV needs to individually process all sensed data from other AVs because the environmental information is the same in a small region. Inspired by vehicular edge computing (VEC), where AVs are interconnected with the help of roadside units (RSUs) for better storage and computation capabilities, we propose a VEC-based architecture for cooperative perception and design a key task scheduling algorithm for the above challenges. Specifically, a time slot-based VEC architecture with the help of an RSU is designed, and the task scheduling problem in the proposed architecture is formulated as a multitask multitarget scheduling problem with assignment restrictions. A two-stage heuristic scheme (TSHS) is designed for the problem. Finally, extensive simulations indicate that the proposed architecture with the TSHS can enable cooperative perception, with a fast running speed and advanced performance, that is superior to that of the benchmarks, especially when most AVs face limitations in terms of storage and computation.

1. Introduction

Cooperative perception is a promising and important domain of autonomous driving that has received more and more attention from academia and industry. In cooperative perception, autonomous vehicles (AVs) are interconnected via communication sensors, and individual information is shared among connected and autonomous vehicles (CAVs), which extends the line of sight and field of view of each CAV. Communication sensors include dedicated short-range communication (DSRC) and 5G cellular networks, which could help to establish vehicle-to-vehicle (V2V) and vehicle-to-infrastructure (V2I) communication [1]. In addition, there are several different V2V communication technologies, e.g., millimeter wave and visible light communication, but these technologies are under research and are not widely deployed in autonomous driving [2]. In contrast, DSRC is widely used, and many studies related to cooperative perception are based on DSRC. DSRC is based on 802.11p, which is amended according to 802.11 for supporting mobility and the IEEE 1609 family of standards [3]; it allows short-range communication over hundreds of meters via the dedicatedly allocated spectrum in the 5.9 GHz band. In this way, each CAV can improve its safety over a short range and increase traffic flow efficiency over a long range. For example, a vehicle can receive detected perception data of preceding vehicles via DSRC, and then the vehicle can build a map of the surrounding environment over a larger range. The map can help to know obstacles in front of the preceding vehicle or accidents on another road to help to make decisions to avoid obstacles and change routes.
A typical architecture for cooperative perception is illustrated in Figure 1, which is constructed from the perspective of communication and computation. There are mainly two participants in the architecture, including roadside units (RSUs) and AVs. An RSU can be regarded as an edge node with computing and communication capabilities that can serve AVs within its communication range. Meanwhile, every AV is equipped with computing devices, onboard sensors and communication sensors. Onboard sensors include LiDAR, radar, camera, etc. [4], and each AV can perceive its surrounding environment using a different sensor. After that, an AV can transmit detected information to other AVs and RSUs via wireless communication technologies. The advantages of the architecture are twofold [5]: (1) AVs can obtain road information that is out of sight, which can help to make better decisions. (2) The RSU can collect different perception results to broadcast to other vehicles; meanwhile, the RSU can also evaluate the “global” optimization of vehicle trajectories for improved traffic efficiency.
From previous studies [6,7,8], there are three basic tasks in cooperative perception, i.e., location, detection and tracking, and mapping. All these tasks are computation-intensive, especially when deep learning-based algorithms are involved. Furthermore, detected sensing data can rapidly exhaust the storage of AVs. These facts will pose a major challenge to AVs because of the individual execution of tasks on the ego vehicle. However, sensing data are typically high spatial and of temporal locality, i.e., the sensed data are the same in a section and are only important to AVs in that section during a particular period, which indicates that not every AV needs to individually process all sensed data received from other AVs. In this paper, we consider the inherent spatial and temporal locality and propose a VEC-based infrastructure for the storage and computation challenges of AVs in cooperative perception. For the effective utilization of resources from AVs in the architecture, we investigate the key task scheduling problem among participating AVs. The main contributions are listed below.
  • We propose a hybrid time slot-based VEC architecture consisting of AVs and RSUs for cooperative perception, in which some real conditions of AVs are considered, e.g., the involvement of multiple types of resources, heterogeneity of tasks and AV resources and transmission constraint of every participating AV.
  • We formulate the task scheduling problem in the proposed architecture as a multitask multitarget scheduling problem with assignment restrictions. We show that the problem is a multidimensional multiple knapsack problem with assignment restrictions, and its NP-hardness is proven in the paper.
  • We design a two-stage heuristic scheme (TSHS) for the formulated scheduling problem, which aims at better utilization of the resources of AVs for a better cooperative perception. We compare the result of TSHS with optimum results and the results of some basic benchmarks, and its effectiveness is validated after extensive simulations.
The remainder of this paper is organized as follows. In Section 2, we detail related works. In Section 3, we first illustrate the VEC-based architecture for cooperative perception and present the model formulation. Then, we analyze the optimal solution of the formulated problem. In Section 4, we provide insight into the TSHS. In Section 5, we present our experiment and results. Finally, in Section 6, we conclude the paper by discussing some important topics that need further research. We summarize the used acronyms in Table 1 for better reading.

2. Related Works

2.1. Vehicular Edge Computing and Cooperative Perception

Research on the combination of edge computing (EC) and AVs has recently attracted considerable attention because vehicle-based applications’ characteristics are naturally consistent with those of EC. EC can provide ultralow latency and enable location awareness by deploying edge servers near end users [9]. Vehicle applications, especially autonomous driving services, e.g., real-time traffic information and parking guidance, are location dependent, delay-constrained and computation-intensive [10]. Therefore, the combination of EC and AVs can fulfill the requirements of vehicle applications and can alleviate the pressure of the backbone network. In addition to AVs serviced by edge nodes, i.e., vehicles utilize the resources provided by edge nodes to execute their applications, vehicles can be regarded as edge nodes to provide services to other users. This kind of architecture is called vehicular edge computing (VEC) [11], which can help to facilitate some vehicle-based applications, e.g., vehicle-based crowdsourcing and cooperative perception.
Vehicle-based crowdsourcing is a novel resource sharing technology in which vehicles with the capability of sensing, computing and communicating are recruited to execute tasks of interest, e.g., environment sensing. After completing tasks, vehicles will be paid. Different aspects of this domain have been researched. Zhu et al. [12] proposed a deep Q-network-based algorithm for improving the quality of information and processing latency in vehicle-based visual crowdsourcing. Lai et al. [13] solved the maximal weighted sensing paths problem in vehicular crowdsourcing by a heuristic method, in which the selection of participating vehicles and path computing are the main concerns and the aim is to better benefit from vehicular crowdsourcing. Hui et al. [14] considered the privacy of AVs and security of edge computing devices and proposed a coalition game algorithm based on blockchain to minimize the task execution cost. We do not thoroughly review the related researches because it is not the main concern of this paper. One difference between vehicle-based crowdsourcing and cooperative perception is that an incentive mechanism is needed in vehicle-based crowdsourcing to encourage more participating vehicles, but this is not needed in cooperative perception. This is because every participating vehicle can benefit from cooperative perception.
Cooperative perception refers to vehicles mutually sharing individual perception information for a better line of sight and field of view, and consequently improving road safety over a short range and increasing traffic flow efficiency over a long range [1]. The safety of AVs is critical for AV computing system design [15]. In [7], Kim et al. proposed a creative system for cooperative perception, in which a multimodal cooperative perception system for all-around views of drivers is built in reality and cooperative driving is realized by see-through forward collision warning, overtaking/lane-changing assistance and automated hidden obstacle avoidance. In paper [16], the authors proposed a cooperative-based method for bottleneck detection on motorways. In paper [17], Shan et al. addressed the handling of cooperative perception messages and demonstrated in experiments that CAVs can perceive pedestrians around the corner. Because the realization of cooperative perception is based on vehicle-to-everything communication, in which valuable exchange information about the surrounding environment is transmitted, the message format and generation rules for cooperative perception have been standardized by some standardization bodies, e.g., the European Telecommunications Standards Institute (ETSI) [17]. Meanwhile, what contents should be included in the exchanged messages has been researched by many researchers. In [18], after evaluating the performances of different congestion and content control schemes, Gani et al. determined that message content that is farther away from the sensor is more valuable and should be concentrated on mapped objects but not near the edge of the local sensor range. In addition to the exchanged messages, the condition of communication in cooperative perception is critical because heavy channel loads can degrade the performance of cooperative perception. In [19], the authors considered the value of detected objects, and these can be included in the message only if they are valuable for receivers. In this way, channel loads can be reduced because fewer messages are transmitted. In [20], the authors evaluated the impact of sensor characteristics, the market penetration rate and congestion control schemes on the operation and the performance of cooperative perception. They proposed that the combination of congestion control functions at the access and facility layers can improve the cooperative perception. Although communication is a very important domain, the main focus of the paper is the pressure of computation induced by tasks in cooperative perception
The main three tasks of cooperative perception, i.e., localization, detection and tracking, and mapping, are researched from many perspectives. For localization, the acquisition of a vehicle’s position in the environment is the main concern, and GPS-based multilateration [21] with errors ranging from 3.3 m to 6.75 m or an advanced refining method based on the Extended Kalman Filter (EKF) [22] with a standard deviation of 0.02 m are used. For detection and tracking, the detection of obstacles in the scene and tracking them are the main concerns, and most related methods are neural network-based, e.g., YOLOv3 [23]. For mapping, the goal is to build a map by aggregating data from the previous two stages and to optimize routes and adapt vehicle navigation [2]. All these tasks, especially neural network-related tasks, put large pressure on vehicle resources, which needs to be solved. Furthermore, we note that most of these tasks are executed locally, and a cooperative perception with more collaboration among AVs is a promising approach in the future.

2.2. Task Scheduling among CAVs

Task scheduling, or resource allocation, is a critical issue in traditional cloud computing (CC) and VEC because it determines the profit of the service provider and the efficiency of resource utilization. In CC, Liu et al. [24] proposed an efficient approximation algorithm to perform task scheduling in a multimapping manner under a heterogeneous physical machine environment that aimed to improve social welfare and allocation efficiency. Zhang et al. studied different scheduling scenarios in cloud computing. In [25], focusing on the challenges of multidimensional resources in clouds, they proposed an online truthful mechanism for time-varying resource allocation in an interprogramming model. In [26], a dynamic priority-based online strategy-proof mechanism was proposed that allows jobs to be scheduled in a preemptive-restart mode, which can improve the social welfare and resource utilization of clouds. In [27], a dominant-resource-based allocation algorithm was proposed for batch virtual machine allocation in clouds, which has high social welfare and a high served user ratio. In [28], they proposed a truthful online auction mechanism based on user evaluation and cost for a multirequirement, single-minded scenario in which a user can submit multiple requirements but only one can be satisfied. They also investigated machine learning-based allocation algorithms in [29] and extended the above methodology to collaboration between clouds and edges. In [30], an online strategy-proof allocation mechanism for live video webcast services, which includes individual rationality and truthfulness and has high social welfare, was proposed. In [31], considering the combination of the Internet of Vehicles and blockchain, an auction mechanism was proposed to encourage users to undertake mining computing.
In VEC, task scheduling has been researched considering specific vehicular features. Liwang et al. [32] presented a game theory-based method to conduct opportunistic computation allocation to achieve efficient utilization of vehicles’ resources. Chen et al. [33] proposed a hybrid dynamic scheduling scheme that combines queue-based dynamic scheduling and time-based dynamic scheduling to realize adaptive scheduling. Wan et al. [34] considered EC scheduling for CAVs in 5G networks and proposed a computation offloading algorithm to solve the multiobjective optimization problem for appropriate allocation decisions. Liu et al. [35] proposed a deep Q-learning-based algorithm that considers allocation target servers and vehicle data transmission modes to realize optimal allocation. Zhou et al. [36] proposed an alternating direction method of a multiplier-based distributed algorithm with low complexity to realize energy-efficient workload allocation. Xu et al. [37] considered the privacy protection of task scheduling to EC devices among CAVs and proposed a multiobjective optimization algorithm to reduce energy consumption and prevent privacy conflicts. The above studies conducted scheduling among CAVs to satisfy the requirements of computation-intensive and response-constrained applications. However, the formulated problems do not consider multiple types of resources and the differences in connectivity of each vehicle in the network, which are included in our formulated problem. Furthermore, the vehicles in these studies can only be service providers or requestors, whereas vehicles can be both in our model.
In our paper, we comprehensively consider the design of the VEC-based architecture for cooperative perception and propose a task scheduling algorithm to realize the efficient utilization of AV resources to process more detected sensing data, thereby improving road safety.

3. System Model and Problem Formulation

In this section, we first present a VEC-based architecture for cooperative perception. Then, the formulation of task scheduling in the architecture is presented in detail. Finally, we discuss the optimal solution of the formulated problem and prove its NP-hardness.

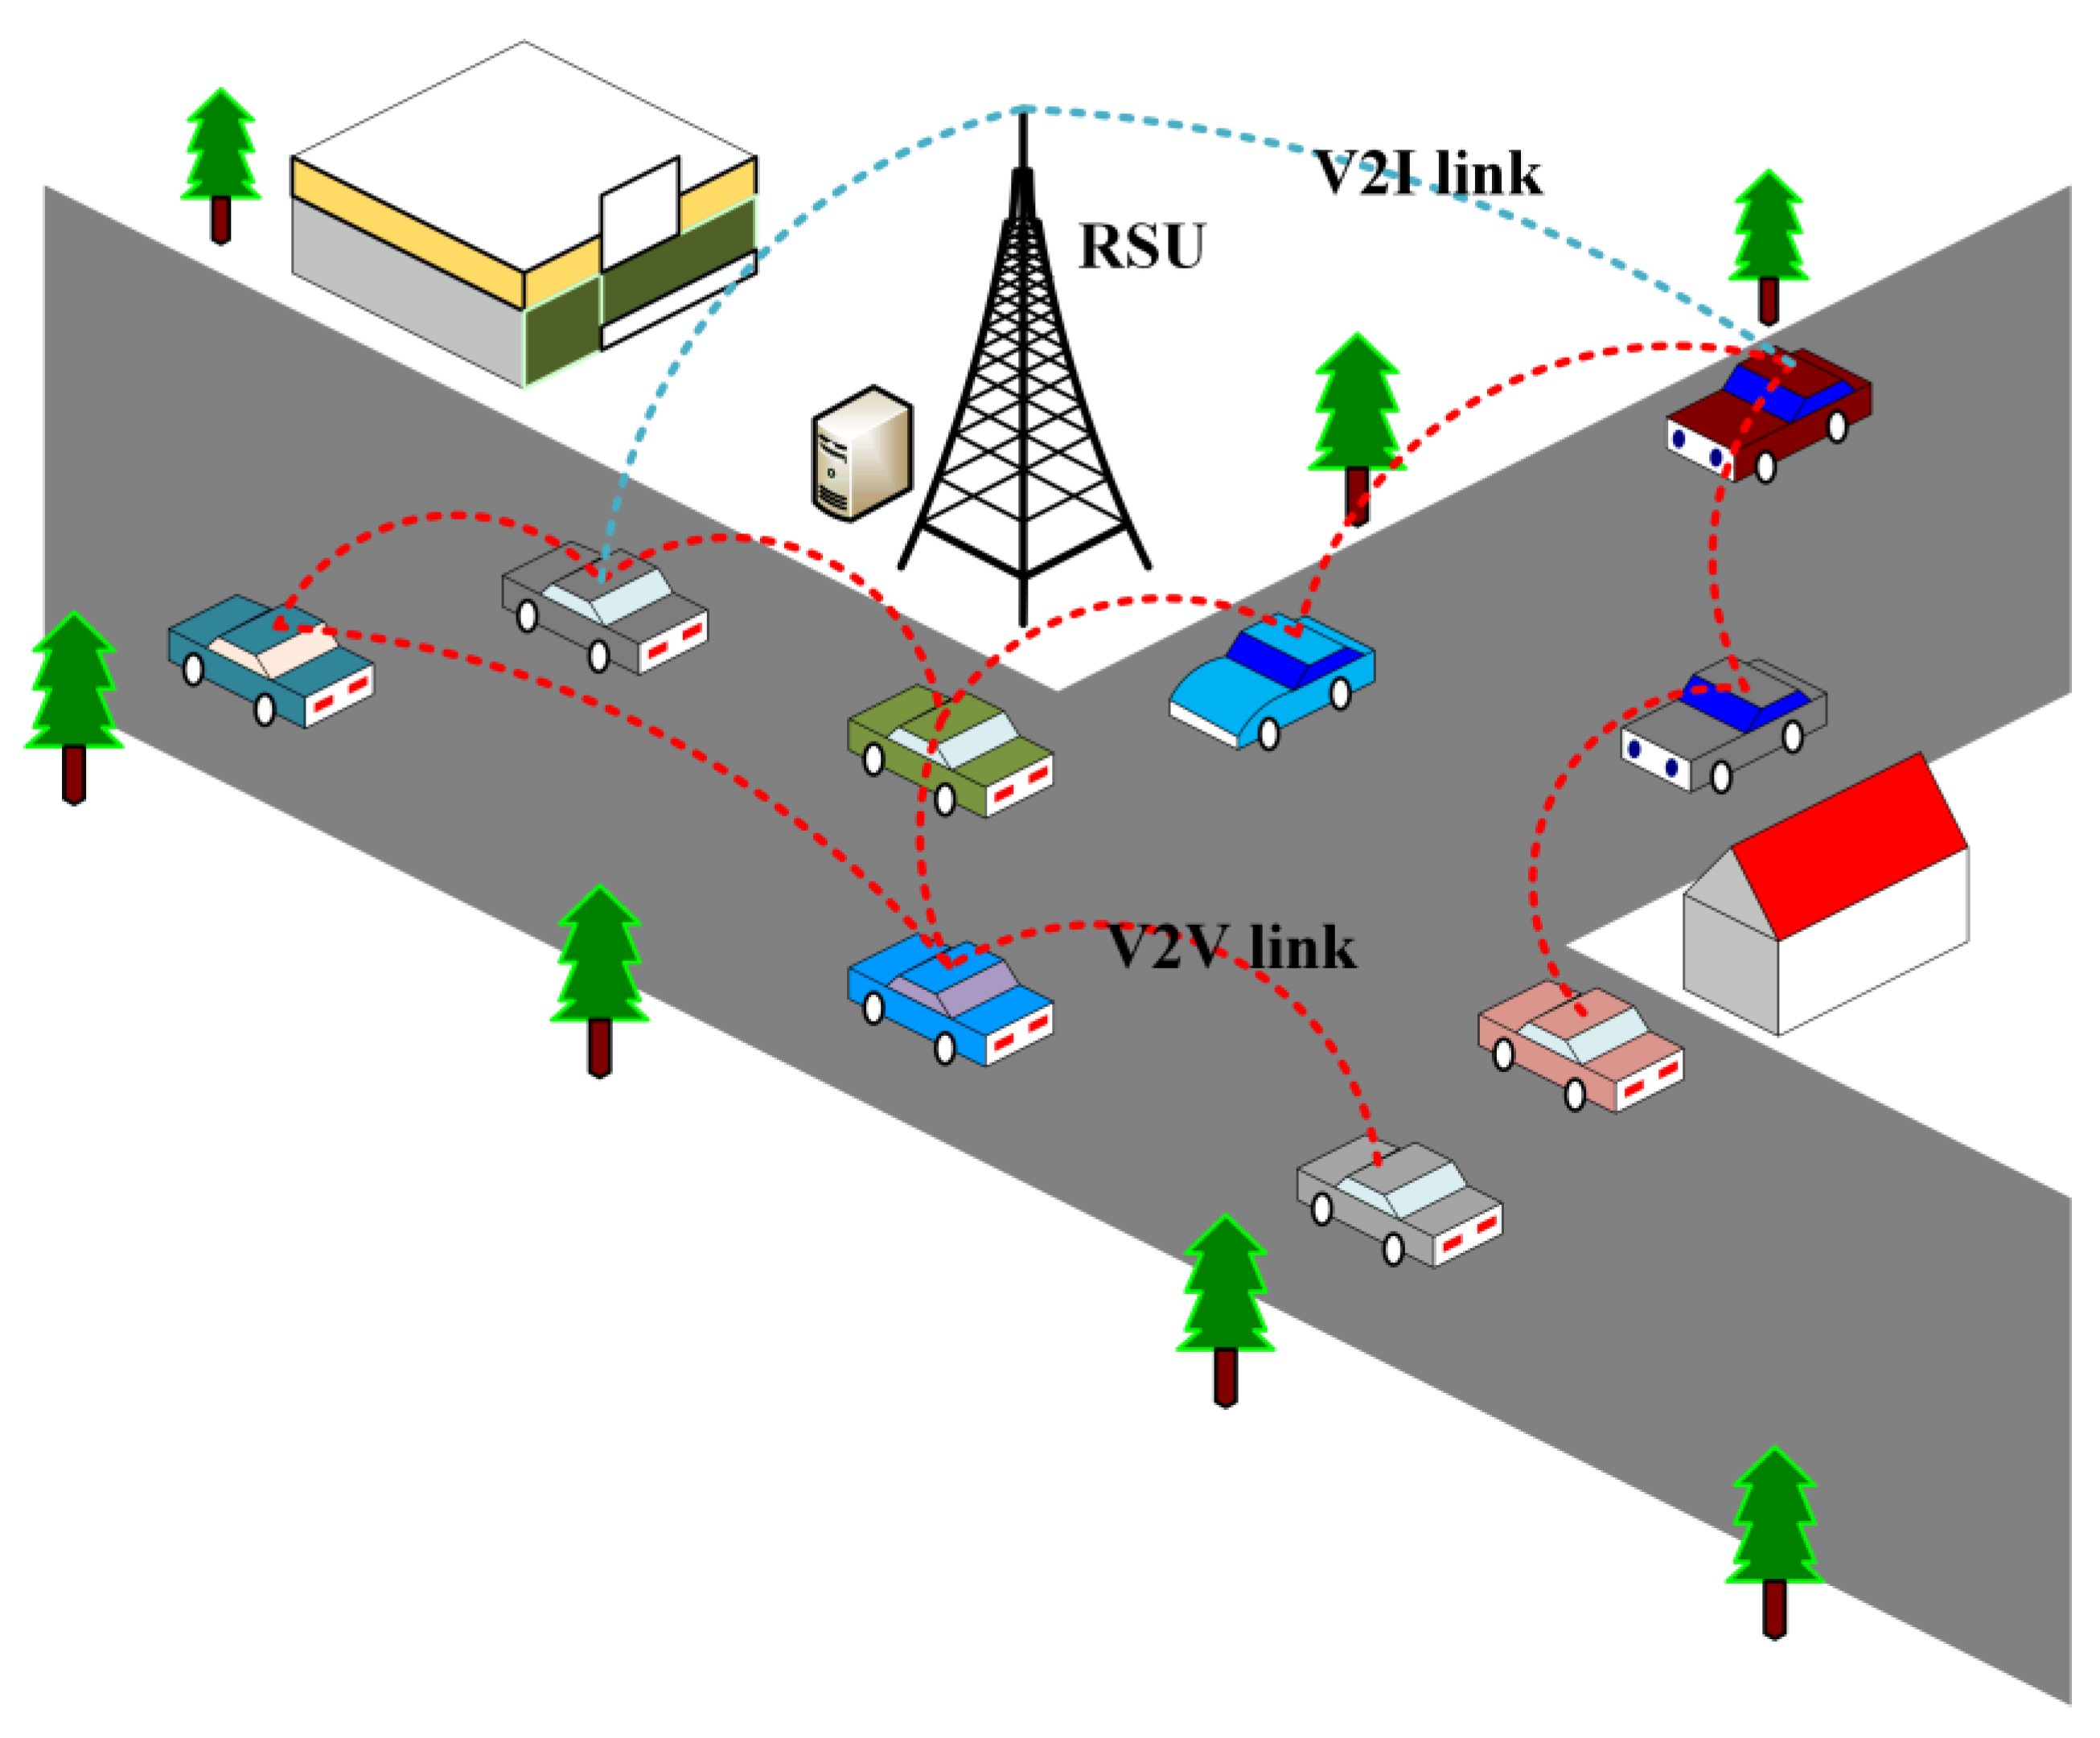
3.1. Hybrid VEC-Based Architecture for Cooperative Perception

Figure 2 shows a hybrid VEC-based architecture for cooperative perception. In our research, urban areas are divided into several small regions, and there is one RSU located in the center of the region. The region size is determined by the communication capability of the RSU, and a wide region size implies that more AVs could participate in cooperative perception. Therefore, the number of participating AVs is a key parameter behind the region size. We focus on one of these regions, and the research results of the region can be applied to the others. The RSU is equipped with communication devices and connected to edge servers; it acts as a scheduler to provide services to AVs in the region. In a region, assuming that there are M AVs that are participating in cooperative perception, we use = { 1 ,   2 ,   ,   M } to denote the AV set. AVs can connect to the RSU via V2I links and can connect to each other via V2V links. We assume that an AV or RSU can communicate with several AVs simultaneously, and there is no interference in these communication links.
AVs are equipped with communication and computation devices and can be regarded as small servers with radio ability. There are R types of resources, denoted as = { 1 ,   2 ,   ,   R } , e.g., CPU, RAM and disk size. AVs can possess different amounts of different types of resources due to many factors, e.g., the price of vehicles and software carried on vehicles. We use c i = ( c i 1 , c i 2 , , c i R ) T to denote the amount of different resources possessed by AV i , i and use C = ( c 1 ,   ,   c M ) to denote the resource matrix of all AVs in the region. AVs can not only execute tasks on themselves but also tasks from other connected vehicles in a virtualized manner, e.g., virtual machines.
The role of the RSU is as a scheduler in the region, and the role of AVs that form the VEC is undertaking the computation of tasks. In reference [5], there were two architectures for communication and computation in CAVs, i.e., centralized and decentralized architectures. Centralized architectures refer to the RSU acting as a scheduler to provide service to CAVs. Its advantages are twofold: (1) The communication coverage of the RSU is larger, and different communication technologies can coexist. (2) The necessary information of all CAVs can be acquired, and “global” optimization can be performed. However, its disadvantages are that it is costly, and the connection between the RSU and CAVs can be unstable because of the distance and mobility of vehicles. Decentralized architectures refer to vehicles mutually transmitting necessary information and complete computational tasks by themselves. Its advantages are less of a transmission delay and more stable V2V communication. Its disadvantage is that the negotiation between vehicles is not “global”. A hybrid architecture is promising; for cooperative maneuvers, such an architecture would mean that vehicles can coordinate among themselves, and centralized entities (such as mobile edge computing (MEC) servers) are also capable of sending proposals to (groups of) vehicles [5]. Inspired by these ideas, we propose a hybrid VEC-based architecture for cooperative perception. Tasks of cooperative perception are time constrained and of high spatial and temporal locality, and these tasks are offloaded among CAVs. The scheduling of tasks, in which information of all participating vehicles is needed, is global, and RSUs with wide coverage act as schedulers to schedule tasks.
In cooperative perception, environmental information is derived from processing data of different types of sensors, e.g., camera, LiDAR and radar. Different sensors have different data production rates, e.g., 10–70 MB per second for LiDAR and 10–100 KB per second for radar. Each type of sensor corresponds to a type of task, and we assume that there are K types of tasks denoted as K = { 1 ,   2 ,   ,   K } . A specific task can be represented by a vector ω k = ( ω k 1 ,   ω k 2 ,   ,   ω k R ) T , where ω k R denotes the amount of R type resources needed by a task of type K . We use W = ( ω 1 , ω 2 , , ω K ) to denote the resource requirement matrix of all task types. Vehicles can produce different numbers of tasks of different types, and these tasks can be executed on ego AVs or offloaded to connected AVs for partial or full execution via V2V links. We assume that tasks can only be transmitted in a one-hop manner, i.e., tasks cannot be transmitted to other AVs by a multihop relay.
Task scheduling and offloading are based on time slots, as shown in Figure 2. The block diagram shows the implementation procedure of the central RSU and an AV in time slot t . Vehicles synchronize their time slots and report necessary information with the RSU after entering the region. When a vehicle establishes a connection with the RSU during the RSU’s time slot t , the vehicle will attend the next scheduling decision at the RSU’s time slot t + 1 , which means that the reported information will be utilized for task scheduling in the next time slot. Here, the length of the RSU’s time slot should be the same as every vehicle’s time slot. The whole cooperative perception procedure can be divided into three steps:
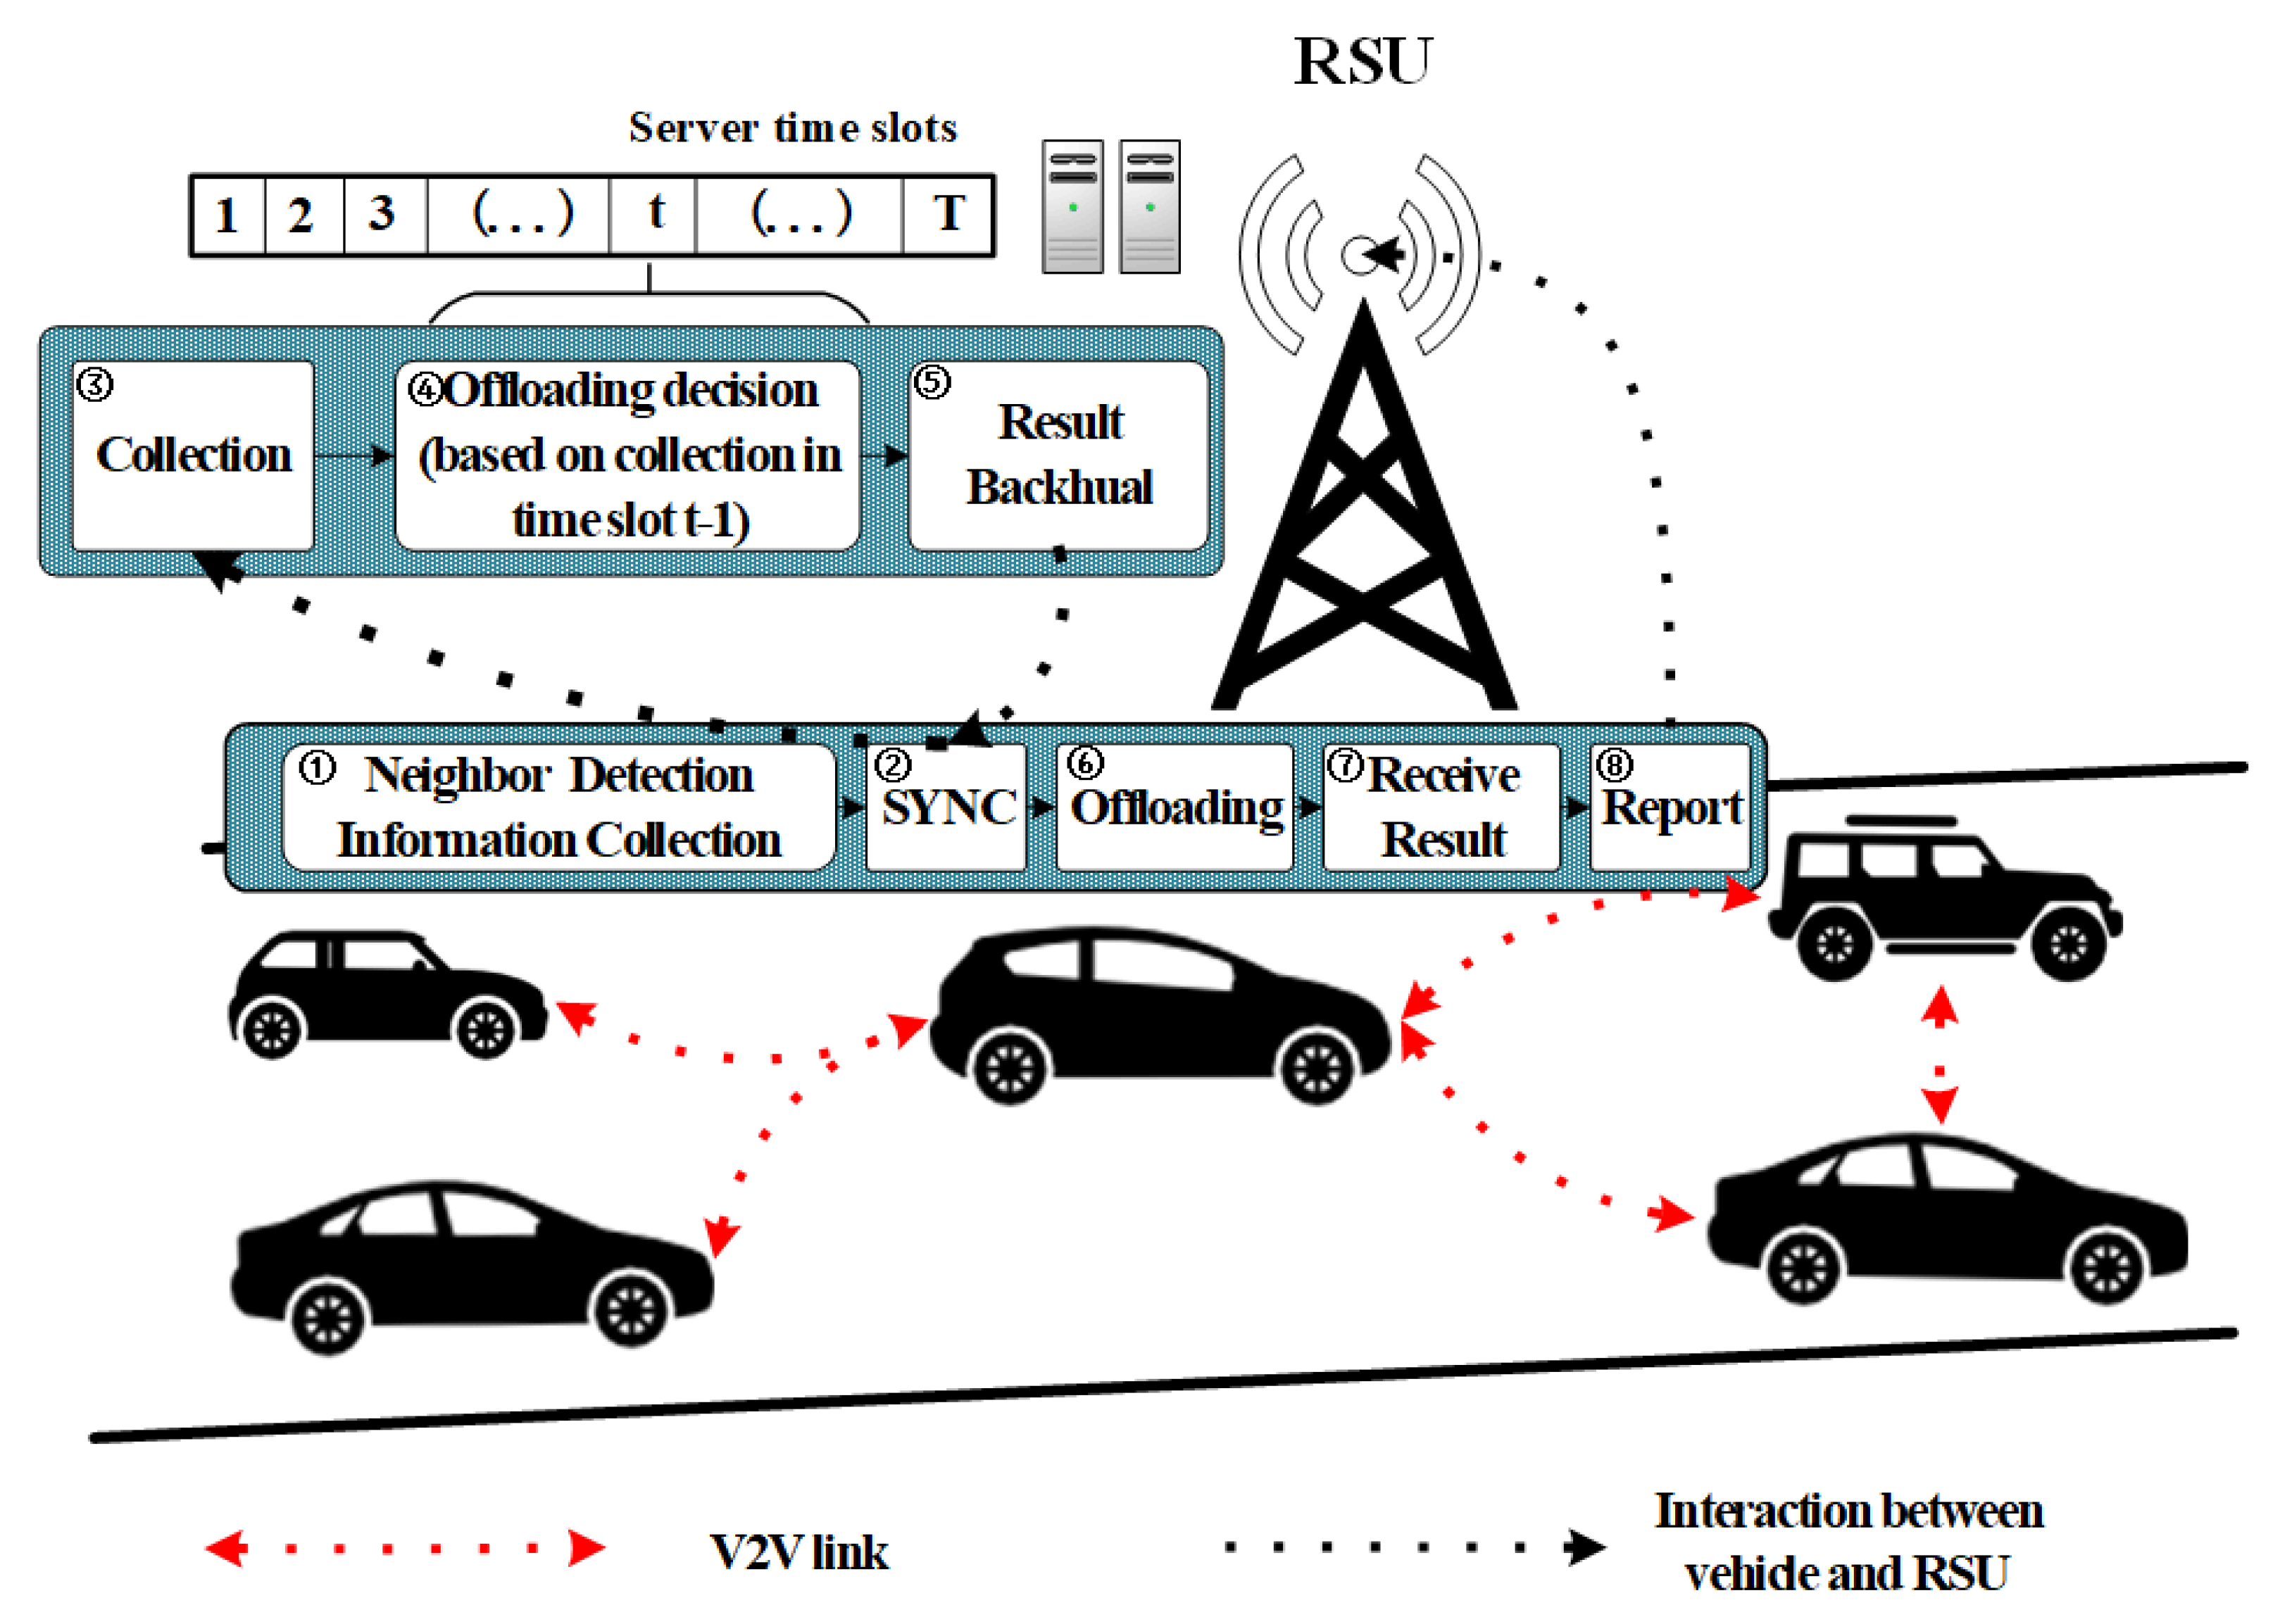
  • First, vehicles conduct neighbor detection via V2V links. A vehicle sends detection packets to other vehicles, and vehicles without packet loss and with low round-trip time are regarded as neighbors. We assume that the neighbors detected in a time slot will not change because of the short length of the time slot, but neighbors in different time slots can change because of vehicle mobility. For vehicle i M ,   j M \ { i } ; δ i j = δ j i = 1 means that vehicles are mutual neighbors; otherwise, δ i j = δ j i = 0 . We use δ i = ( δ i 1 ,   , δ i M ) T to denote the neighbor vector of AV i and Δ = ( δ 1 ,   ,   δ M ) to denote the neighbor matrix of all vehicles in the region in a time slot. In addition to the neighbor vector, the available resources c i possessed by AVs and the task vector s i produced by vehicles need to be reported to the RSU in every time slot. Here, s i = ( s i 1 , , s i K ) T ; s i K denotes the number of K -type tasks produced by AV i , and S = ( s 1 , , s M ) denotes the task matrix of all vehicles in the region. These correspond to procedures 1–2 in the block diagram.
  • Second, the RSU makes scheduling decisions according to the collected information ( S ,   C ,   Δ ) in a time slot and sends the results back to vehicles in the region. These correspond to procedures 3–5 in the block diagram.
  • Finally, AVs conduct task offloading according to the decision result and report the task results to the RSU after completion for further acquisition of other vehicles. These correspond to procedures 6–8 in the block diagram.
Table 2 summarizes the main annotations used in the paper.

3.2. Problem Formulation

Under the context of better resource utilization and achieving road safety improvement in our model, the more vehicles that accomplish sensing data processing tasks in a time slot, the more environmental information is acquired, and road safety is improved. However, because of the high spatial and temporal locality of environmental information, if most AVs can accomplish their tasks, the remaining AVs can still perceive the environment by the accomplished tasks in the proposed architecture. Therefore, we use the number of AVs that accomplish their tasks in a time slot to represent the degree of sensed environment information that can be obtained, and our aim is to maximize the number.
In a given time slot, for decision variable x i ,   i is used to denote whether tasks of AV i can complete, x i = 1 represents that tasks of the AV i are accomplished with assistance from neighbor vehicles or by itself. The latent variable y i j k denotes the number of k -type tasks that need to be offloaded by AV j for execution on AV i .
The scheduling problem in a particular time slot is represented as follows.
max i : i x i
s . t .   s i k x i = j : j y j i k δ i j ,   i , k K
j : j j : j K δ i j y i j k ω k r c i r ,   r R , i M
x i { 0 , 1 } ,   y i j k Z + { 0 }
Formula (1b) represents the number of each type of task of AV i ,   i , whose tasks can be successfully accomplished with the assistance of other vehicles, and is equal to the number of tasks actually executed by its corresponding neighbors. Formula (1c) indicates that the resources’ occupation of all tasks executed on every AV cannot exceed the AV’s capacity for any type of resource. Formula (1d) indicates that the value of x i is 0 or 1 and that y i j k is a nonnegative integer.
Here, we give an example of task scheduling in the proposed model to illustrate the effectiveness induced by task offloading in the architecture, as shown in Figure 3. There are three participating AVs, and the resources possessed by the three are c 1 = ( 8 ,   11 ,   16 ) T , c 2 = ( 2 ,   3 ,   4 ) T and c 3 = ( 2 ,   4 ,   5 ) T . There are two types of tasks, and the resource requirements of each type of task are ω 1 = ( 2 ,   3 ,   4 ) T and ω 2 = ( 3 ,   4 ,   5 ) T . The numbers of the two types of tasks produced by the three vehicles are s 1 = ( 1 ,   0 ) T , s 2 = ( 1 ,   1 ) T and s 3 = ( 1 ,   1 ) T . If no task scheduling is performed, the number of AVs whose produced tasks can be completed is one, i.e., AV 1. Data sensed by other vehicles cannot be processed in a timely manner, so valuable environmental information cannot be obtained by AV 1 from other AVs, which decreases road safety. With task scheduling in cooperative perception, task 2 of vehicles 2 and 3 can be assigned to vehicle 1 to execute so that all vehicles’ tasks can be accomplished in a timely manner; thus, road safety is improved.

3.3. Optimal Solution

Here, we give a brief discussion about the optimal solution. In fact, when there is only one type of resource and we ignore the difference in connectivity, the scheduling problem can be considered a multiple knapsack problem. It is strongly NP-hard according to paper [38]. We prove that the problem presented in Formula (1a) is NP-hard.
Proposition 1.
The multidimensional multitask multitarget task scheduling problem listed in Formula (1a) is NP-hard.
Proof. 
When there is only one type of resource in the architecture, the problem in Formula (1a) can be regarded as a multiple knapsack problem with assignment restriction (MKAS), i.e., participating AVs can be regarded as knapsacks in which resources possessed by AVs are the capacity of the knapsack; tasks produced by AVs are the items in which tasks produced by the same vehicle have the same assignment restriction and not for diverse vehicles. In the paper [38] by M. Dawande et al., the NP-hardness of MKAS was proven. In our research, we consider multidimensional resources, and MKAS can be reduced to our problem in Formula (1a). If there is a polynomial algorithm for our problem, MKAS can be solved in polynomial time. Therefore, the problem in Formula (1a) is NP-hard. □
It is very difficult to acquire an optimal result in an acceptable time, especially in the autonomous driving domain, because of its strict response time constraint when the number of participating AVs becomes large. Therefore, we design a heuristic algorithm to conduct task scheduling decisions. However, for small-scale simulation experiments, e.g., the number of AVs is relatively small, we can use some optimization tools, e.g., ILOG-CPLEX [39], to obtain the optimal result of the task scheduling decision with the purpose of maximizing the total number of vehicles whose tasks can be accomplished. ILOG-CPLEX is a tool to solve problems such as linear programming and constraint programming.

4. Two-Stage Heuristic Scheme (TSHS)

For the NP-hardness of the problem in Formula (1a), i.e., there has not yet been a polynomial algorithm, we instead propose a TSHS, which will be detailed in this section.
Two stages are included in the TSHS:
  • Determination of the priority of participating AVs in cooperative perception. In this stage, the priority of AVs that need task scheduling is determined based on the status of the vehicles, e.g., produced tasks, available resources and neighbors.
  • Determination of execution target vehicles of tasks produced by participating AVs. In this stage, target vehicles of tasks are determined, i.e., which neighbors hold that task is confirmed.
We introduce the highlighted ideas in the algorithm, detail the algorithm and finally present the proof of the algorithm approximation ratio and time complexity.

4.1. Highlighted Ideas

In the scheduling problem of Formula (1a), whether the vehicle accomplishes its tasks via other AVs should be determined. In addition, the target vehicle of each task should be determined. We design the TSHS as a two-stage algorithm based on the two goals. We introduce the highlighted ideas of the two stages in the TSHS.

4.1.1. Stage of Determination of AV Priorities

In this stage, the sequence of AVs to be scheduled is considered, i.e., the priority. In the problem in Formula (1a), the goal is maximizing the number of AVs that can complete their tasks. We start by analyzing the status of AVs and construct the criteria for determining the scheduling priority of AVs. We introduce the number of neighbors, the balance degree of the task and their impacts on the vehicle’s priority and then construct the formula of priority determination.
The number of neighbors (NoN): As mentioned above, the definition of a vehicle’s neighbors is a set of AVs with stable connections detected by vehicles at the beginning of a certain time slot. For AV i ,   i , we denote h i = j \ i   δ i j as its number of neighbors. The number is a property of a certain AV in a time slot, and it can determine the priority to a certain degree. Specifically, for two AVs i ,   j ,   i j with the same task requests, i.e., s i = s j if h i < h j , vehicle i should have higher priority than j because the selectivity of neighbors of vehicle i is small.
Here, we give an example to explain this. The tasks’ target vehicle is determined according to the fitness resource proposed in stage two. There are three Avs, 1, 2 and 3, and their resources are c 1 = ( 2 ,   3 ,   4 ) T , c 2 = ( 3 ,   4 ,   5 ) T and c 3 = ( 5 ,   7 ,   9 ) T , respectively. AVs generate two types of tasks. The resource requirements of the tasks are ω 1 = ( 2 ,   3 ,   4 ) T and ω 2 = ( 3 ,   4 ,   5 ) T , and the task requests of the three are s 1 = ( 1 ,   1 ) T , s 2 = ( 1 ,   1 ) T and s 3 = ( 0 ,   0 ) T . Vehicles 1 and 3 only possess one neighbor, i.e., vehicle 2, and vehicle 2 possesses two neighbors, i.e., vehicles 1 and 3. If vehicle 2 offloads its tasks first, as shown in Figure 4a, the tasks of vehicle 2 will be partly offloaded to vehicle 1; finally, only vehicle 2 can complete its tasks. If vehicle 1, which possesses fewer neighbors, offloads its tasks first, as shown in Figure 4b, the tasks of vehicle 1 are partly offloaded to vehicle 2, and the tasks of vehicle 2 can be offloaded to vehicle 3. The number of vehicles whose tasks can be completed is two. Obviously, vehicles that possess fewer neighbors should have higher priority, and it is beneficial to improve the number of vehicles whose tasks can be completed.
Balance degree of resources (BDR): Different sensors in AVs generate diverse data, and the resource requirements of different data processing tasks are different. The resource requirements of tasks also impact the goal in Formula (1a). For a task of type k ,   k K , BDR is denoted as
B k = max r R ω k r min r R ω k r / min r R ω k r
It is the maximal difference in dimensional resource requirements for a k-type task after normalization; a larger value indicates a greater imbalance. If there are many unbalanced tasks generated by a vehicle, the successful offloading of these tasks results in rapid exhaustion of a particular type of resource in the target vehicle. Finally, no more tasks can be completed, and the number of vehicles whose tasks can be completed declines.
We now provide an example to explain this. There are three AVs, AVs 1, 2 and 3. The resources they possess are c 1 = ( 2 ,   2 ,   2 ) T , c 2 = ( 2 ,   3 ,   5 ) T and c 3 = ( 2 ,   3 ,   5 ) T , and they are connected to each other. There are two types of tasks produced by the vehicle, i.e., ω 1 = ( 1 ,   1 ,   1 ) T and ω 2 = ( 1 ,   1 ,   5 ) T , and the task requests of the three vehicles are s 1 = ( 0 ,   2 ) T , s 2 = ( 2 ,   0 ) T and s 3 = ( 2 ,   0 ) T . If vehicle 1 has higher B ( k ) offloading first, its two tasks will execute on vehicles 2 and 3, which will exhaust the resources of type 3 possessed by vehicles 2 and 3, so the tasks of vehicles 2 and 3 cannot be completed. Then, the number of vehicles whose tasks can be completed is one. If vehicles 2 or 3, which possess relatively balanced tasks, offload first, their tasks can be completed. Then, the final number of vehicles whose tasks can be completed is two, which helps to improve road safety.
Vehicle priority determination: In addition to the above two factors, the total resource requirements of all tasks (RRAT) generated by an AV are also an important factor that influences the number of vehicles whose tasks can be completed. Under the condition that the total amount of resources owned by AVs in the region remains unchanged, the fewer the resources required by the task, the greater the number of completed tasks.
We design a formula of priority determination based on RRAT and BDR of the task and NoN, as shown in Formula (3),
d i = 1 q ( h i ) k K ( g ( B ( k ) ) s i k r ω k r ) , i  
where q ( h i ) is the contribution function of the NoN, and h i is the number of neighbors of AV i . g ( B ( k ) ) is the contribution function of the BDR, and B ( k ) is the BDR of the k -type task. The two functions are defined in Section 5, and they are both monotonically increasing functions. Formula (3) is a method of vehicle priority determination based on BDR, NoN and RRAT; the smaller d i is, the lower the priority.

4.1.2. Determination of the Target Vehicle of Tasks

We use resource fitness between tasks and vehicles for target vehicle determination. In the proposed model, an AV possesses R types of resources and generates K types of tasks that represent data processing from different sensors. Different task types k ,   k K require different amounts of R -type resources, denoted by ω k = ( ω k 1 ,   ω k 2 ,   ,   ω k R ) T . An AV i ,   i that needs task offloading, similar to paper [24], determines the target vehicle for its tasks based on the resource fitness of the task and vehicle. For a task of type k K and candidate of the target vehicle j { s | s ,   δ i j = 1 } , resource fitness f ( k , j ) is denoted as
f ( k , j ) = c j / c j 1 ω k / ω k 1 1   = r | c j r / c j 1 ω k r / ω k 1 |
A task of type k will choose a vehicle with the smallest f ( k , j ) from its neighbor set. The smaller f ( k , j ) is, the higher the degree of consistency between the resource requirements of the task to be offloaded and the resources currently available on the target vehicle. This helps to reduce the resource fraction and waste.

4.2. Algorithm

In the proposed TSHS, there are two stages, as shown in Algorithm 1. (a) Determination of the priority of the vehicles that need task scheduling and formation of a priority list that will be used in stage two. (b) According to the input vehicles’ priority list, assess whether the vehicle can offload all its tasks to neighbors in turn. If so, the task selects the target vehicle according to the resource fitness based on the remaining resources of vehicles in the neighbor set, and the result is returned when all the vehicles are tested.
Algorithm 1   TSHS   ( S , W , Δ , C )
1: x , y , list   Vehicle _ determination   ( ( S , W , Δ , C ) )
2: x , y Task _ schedule   ( ( S , W , Δ , C , x , y , list ) )
3:/* schedule tasks from origin vehicle to target vehicle for execution */
4:/* integrate results and transmit them to RSU */
Finally, every participating vehicle conducts offloading according to the decision result and sends the acquired environment information to the RSU for the acquisition of other vehicles after task completion. We detail the two algorithms in this section.
Vehicle_determination in TSHS is shown in Algorithm 2. There are four inputs, i.e., the task matrix of all vehicles S , resource requirement matrix of all task types W , neighbor matrix of all vehicles Δ and available resource matrix C , and three outputs, i.e., decision variables x , y and the sorted list of vehicles that need task offloading based on priority. First, decision variables x , y are initialized: vehicles whose tasks can be completed by themselves directly execute their tasks, and vehicles whose tasks cannot be completed by themselves are stored in set m i d (lines 1–7). Then, the algorithm sorts vehicles in m i d in ascending order based on priority, which is calculated by Formula (3). A vehicle at the front of m i d is higher in d i , which means the vehicle has higher priority considering NoN, BDR and RRAT, and it will offload its tasks prior to other vehicles with lower priority in the Task_schedule algorithm. Finally, the algorithm returns the decision vector x , y , which is a partly modified and sorted list of AVs that need task scheduling.
Algorithm 2   Vehicle _ determination   ( ( S , W , Δ , C ) )
1: x 0 , y 0
2: for   each   i :
3: if   k K s k i ω k r c i r , r :
4:   c i r c i r k K s i k ω k r , r
5: x i 1
6: y ijk s ik
7: M mid M \ { i }
8: for   each   i m i d :
9: d i = 1 q ( h i ) k K ( g ( B ( k ) ) s i k r ω k r )
10:sort M mid in decreasing order of di
11:return x , y , M mid
Task_schedule is shown in Algorithm 3. In addition to inputs S, W, Δ, C, which are the same as those for Vehicle_determination, the outputs of Vehicle_determination are input into Task_schedule. The outputs of the algorithm are a list of AVs and whether their tasks can be completed, i.e., decision vector x, and the target vehicles of tasks, i.e., latent decision vector y. First, the algorithm selects vehicles from list one by one, sets a success_flag and backs up the decision vector y and available resource matrix C, which are utilized for restoration when offloading fails (lines 1–4). For tasks of type k, the algorithm calculates the resource fitness of other AVs and sorts the AVs in ascending order of resource fitness. Then, for every task of the same type, the algorithm chooses the vehicle with the lowest resource fitness and checks whether the available resources of the vehicle are sufficient for the task and whether the vehicles are mutual neighbors. If these conditions are satisfied, the latent decision vector y and available resource matrix C of the target vehicle are modified, the resource fitness between the type and target vehicle is recalculated, and the vehicle is inserted into the vehicle list according to the new resource fitness. This process is iterated until all tasks are scheduled (lines 5–16). If there is a task that cannot be assigned to any vehicle, y and C are restored using backups (lines 17–19). In the algorithm, we set success_flag to examine the failure of any task scheduling decision: it is set as False when a task is starting, which denotes that no target vehicle is appropriate for the task. If an appropriate target vehicle is available, success_flag is set to True. All decision loops are aborted for a vehicle if any task cannot be offloaded to another vehicle (line 5, lines 17–22). Finally, decision variable x is also modified according to the value of success_flag, and decision variable x corresponding to a vehicle is set to 1 if success_flag is True; otherwise, it is set to 0.
Algorithm 3 Task _ schedule   ( ( S , W , Δ , C , x , y , list ) )
1: for   each   i list :
2: success _ flag   True
3: y y
4: C C
5: for   each   k K :
6:   sort   j   in   increasing   order   of   f k j
7:  for each m 1 , , s i k :
8:    success _ flag   False
9:   for each j :
10:      if c j r ω k r   and   δ i j = 1 , r :
11:       y j i k y j i k + 1
12:       c j r c j r ω k r , r
13:       recalculate   f ( k , j )
14:       resort     in   increasing   order   of   recalculate   f ( k , j )
15:      success_flag ← True
16:      break
17:   if success_flag = False:
18:      y y
19:      C C
20:     break
21:  if success_flag = False:
22:   break
23: if success_flag = True:
24:   x i = 1
25: else:
26:   x i = 0
27: return x , y

4.3. Properties

We now detail some properties of the TSHS.
Theorem 1.
The TSHS algorithm is a p min / ( p max M ) approximate algorithm, in which p min = min i p i , p max = max i p i and M is the number of participating vehicles in cooperative perception. p i = q h i · k K g B k · s ik r R ω k r .
Proof. 
Let W o p t be the set of AVs whose tasks can be completely generated by the optimal algorithm; let O P T denote the number of vehicles in the set, O P T = i W O P T 1 . Let W T S H S be the set of AVs whose tasks can be completely generated by the TSHS algorithm, and let T S denote the number of vehicles in the set, T S = i W T S H S 1 . We need to prove α O P T T S , where α is the approximate ratio of TSHS. If the same vehicles are in sets W o p t and W T S H S , we can remove these vehicles from both sets, and the proof of the approximate ratio of the TSHS is not affected.
First, we consider T S ,
T S = i W T S H S 1 = i W T S H S p i d i p min i W T S H S i d i
where the second equality follows from vehicle priority Formula (3), and it is obvious that the third inequality holds.
Second, for O P T ,
O P T = i W O P T 1 = i W O P T p i d i p max i W O P T d i
where, similar to Formula (5), the second equality follows from vehicle priority Formula (3), and it is also obvious that the third inequality holds.
Notably, there are no common vehicles in the sets W o p t and W T S H S . Thus, for any vehicle i , i W O P T that acquires resources from its neighbors, some parts of the resources are allocated to vehicle j , j W T S H S , and we have d j d i in the TSHS; otherwise, vehicle should be in W T S H S .
Let OP j be a subset of W o p t that includes vehicles whose requested resources are partly assigned to vehicle j , j W T S H S , and d j d i , i OP j . OP j is a subset of W o p t relating to vehicle j , in which the requested resources of these vehicles can be assigned to at most M other vehicles. Therefore:
i OP j d i i OP j d j d j OP j Md j
Because OP j is a part of W o p t and W o p t = j W T S H S OP j , we have:
i W O P T d i j W T S H S i OP j d i M i W T S H S d j
Thus, we have
O P T p max i W O P T d i p max M j W T S H S d j T S ( p max / p min ) M T S ( p min / p max M ) O P T
where the first inequality follows from Formula (6), the second formula follows from Formula (8) and the third follows from Formula (5). Therefore, TSHS is a ( p min / p max M ) algorithm. □
Theorem 2.
The time complexity of TSHS is polynomial.
Proof. 
The TSHS algorithm consists of Vehicle_determination and Task_schedule. In our analysis, we regard the number of task types K and resource types R as constants whose values are unknown, and we analyze the impact of the number of participating vehicles on the time complexity. For the Vehicle_determination algorithm, the process of excluding vehicles whose tasks can be completed by themselves involves search and delete operations; it consumes O ( log M ) by binary search, and the whole process consumes O ( M log M ) . The calculation of vehicle priority and sorting consumes at least O ( M log M ) ; therefore, the time complexity of Vehicle_determination is O ( M log M ) . For Task_schedule, although there are four-layer loops, only two of the four loops involve the number of vehicles (innermost and outermost loops). In the innermost loop, insertion consumes O ( log M ) (binary insertion algorithm), and all four loops consume O ( M 2 log M ) , which is the same as the time complexity O ( M 2 log M ) of sorting in line 6; therefore, the time complexity of Task_schedule is O ( M 2 log M ) . Thus, the TSHS consumes O ( M 2 log M ) , and the time complexity of the TSHS is polynomial. □

5. Experiment and Discussion

In this section, we use a generated dataset to simulate task scheduling in the proposed architecture for cooperative perception and compare the results with FirstMatch and the optimal algorithm. The optimal algorithm is designed with CPLEX tools, which can be used to solve the constraint optimization problem. The simulation platform environment uses Python in PyCharm. The code is run on a machine with a 2.90 GHz Intel (R) Core (TM) i5-9400 CPU and 16 GB RAM.

5.1. Experimental Setup

Due to the lack of a standard dataset for task scheduling in cooperative perception, we generate a dataset for simulation. According to the proposed model in Section 3 and the proposed architecture in Section 4, four types of data need to be generated, i.e., the task request matrix of all AVs S , the resource requirement matrix of all types of tasks W , the available resources of all AVs C and the neighbor vector of all vehicles Δ . Because the proposed architecture is time slot-based, we need to generate the data used for task scheduling in a time slot. We can regard the participating AVs as a cluster. For simplicity, we refer to the number of participating AVs as the cluster scale, and we use these two terms interchangeably.
To make the generated dataset more convincing, we analyze some real conditions in cooperative perception and VEC and set rules to generate the dataset according to the analysis. Because AVs need to process tasks related to cooperative perception, there are three types of resources possessed by participating AVs. We can assign different units for these resources, i.e., 1 core for CPU, 128 MB for RAM and 256 MB for DISK capability, which are used to quantify the number of generated resources. This is only one of the possible assignments of the unit.
  • For all participating AVs, three types of resources are needed. Although some mainstream AVs can possess 30 CPU cores or more, utilizing parts of cores to conduct cooperative perception is more rational because of the unreliability of communication and the demands of other users’ and AV applications. The available resources of different vehicles should be diverse because of price differences. We can divide participating vehicles into high-level vehicles and medium-level vehicles. Furthermore, the available number of CPU cores of AVs at the same level could be slightly different due to different users’ habits. We set the resource domains of the three types of resources to (7–10, 37–43, 58–64) for high-level vehicles and (4–6, 18–23, 28–32) for medium-level vehicles: an AVs’ possessed available resources are randomly generated from the domain’s scope based on its level. The randomness reflects the fact that the available resources of different vehicles of the same level can still be slightly different. Meanwhile, the fact that the number of high-level vehicles is less than the number of medium-level vehicles needs to be considered, and the ratio is set to 30%.
  • As stated in Section 1, cameras, LiDAR and radar can be installed on AVs for environmental perception, and the resource requirements corresponding to the LiDAR, camera and radar data processing tasks are different. We can regard them as different tasks. For a more realistic scenario, we consider three types of tasks that can be profiled by a triple tuple. The needed CPU cores of a task are determined according to its corresponding sensors’ data production rate in our paper, i.e., the larger the data production rate is, the more CPU cores used to process those data are needed. The resource requirements corresponding to the LiDAR, camera and radar data processing tasks are ω 1 = ( 3 ,   16 ,   10 ) T , ω 2 = ( 2 ,   10 ,   8 ) T and ω 3 = ( 1 ,   3 ,   4 ) T , respectively. The settings of the three types of profiles mainly consider the relationship of the resource requirements among the tasks from LiDAR, cameras and radar and the maximum number of CPU cores of an AV. The absolute resource requirement of each task is related to the specific machine and the length of the time slot, which are not considered in this paper. There are indeed more specific and scientific descriptions for tasks’ computation intensity, e.g., the amount of computation, latency/energy consumption for finishing a workload or needed instruction cycles of CPU. For simplicity and ease of calculation, we define the resource requirement of tasks (computationally intensive) as a triple tuple that includes the number of CPU cores. We assume that every CPU core needed by a task runs with full loads in our model.
  • Neighbors are determined by sending detection packets by V2V links (DSRC). The results of neighbor detection can be represented by a neighbor vector. We can generate these neighbor vectors. Two facts should be considered. First, a vehicle cannot connect to too many other vehicles. Second, the distribution of AV numbers of neighbors is almost normal distribution. We set the generating rules as follows: An AV should have at least two neighbors. The number of participating vehicles is referred to as the cluster scale, and the two terms are used interchangeably. When the scale is 5–10, an AV can have up to five neighbors; when the scale is 10–20, the maximum number of neighbors of the AV is half of the scale; and when the scale exceeds 20, the maximum number of neighbors is 10. The number of neighbors of each vehicle is randomly chosen between the maximum and minimum values according to a normal distribution.
  • Determining the number of every vehicle’s generated tasks is slightly complex. For participating vehicles, the distribution of the proportion of the number of AVs whose available resources cannot meet the requirement of tasks generated by themselves to the total number of participating vehicles is unknown. We assume that the probability of every proportion is the same. We use the resource satisfaction degree (RSD), i.e., the proportion of vehicles whose tasks can be completed by themselves, in the cluster to denote the distribution in a discrete manner. The value of RSD ranges from 90% to 10%. For a particular value of RSD, we randomly generate task requests of each AV, which guarantees that the proportion of vehicles whose tasks can be completed by itself in the cluster is equal to the value of RSD. Each RSD value of each cluster scale generates 25 groups of data, and each group contains the task requests of each participating vehicle in cooperative perception.
Based on the above rules, we generate a dataset that contains the needed data of task scheduling determination in the cluster scale from 5 to 50. Theoretically, in a particular region, the minimum number of participating vehicles is 0, and the maximum number of participating vehicles depends on many factors, e.g., the size of vehicles and the capability of communication devices. The size of vehicles determines the maximum number of vehicles existing in the physical space of the region. The capability of communication devices determines how many existing vehicles in the region can be serviced by communication devices to participate in cooperative perception. We use M max to denote the maximum number of participating vehicles. In reality, the actual number of participating vehicles is between 0 and M max , and it could obey some kind of probability distribution, e.g., normal distribution. Investigating the relation between region size and the number of participating vehicles (which probability distribution) is indeed an interesting and important topic, but it is not our main concern of this paper. Therefore, we generate a dataset from 5–50 to simulate these possible cluster scales. We use the generated dataset to simulate the task scheduling of a time slot at different scales and analyze the performance of TSHS by comparison with FirstMatch and Optimal. Function q ( h i ) = lg ( h i + 9 ) in Formula (3) denotes the degree of contribution of vehicle neighbors; g ( B ( k ) ) = 1.2 B ( k ) denotes the degree of contribution of the balance degree. We choose one from many other choices, and the chosen two functions have shown good performance in simulation. This paper did not conduct additional research on the selection of the two functions, which will be included in our future work.
For a better understanding, the structure and content of the dataset are illustrated in Figure 5. For example, there are vehicle connectivity, available resources and task requests in nine RSDs when the cluster scale is 5. We can use the neighbor vector, available resources and 25 groups of task requests in different RSDs to synthesize 255 groups of data, which can denote task requests under different vehicle loads in a time slot. The data of other cluster scales can be synthesized in the same way.
Based on the generated dataset, we compare the TSHS with two other algorithms:
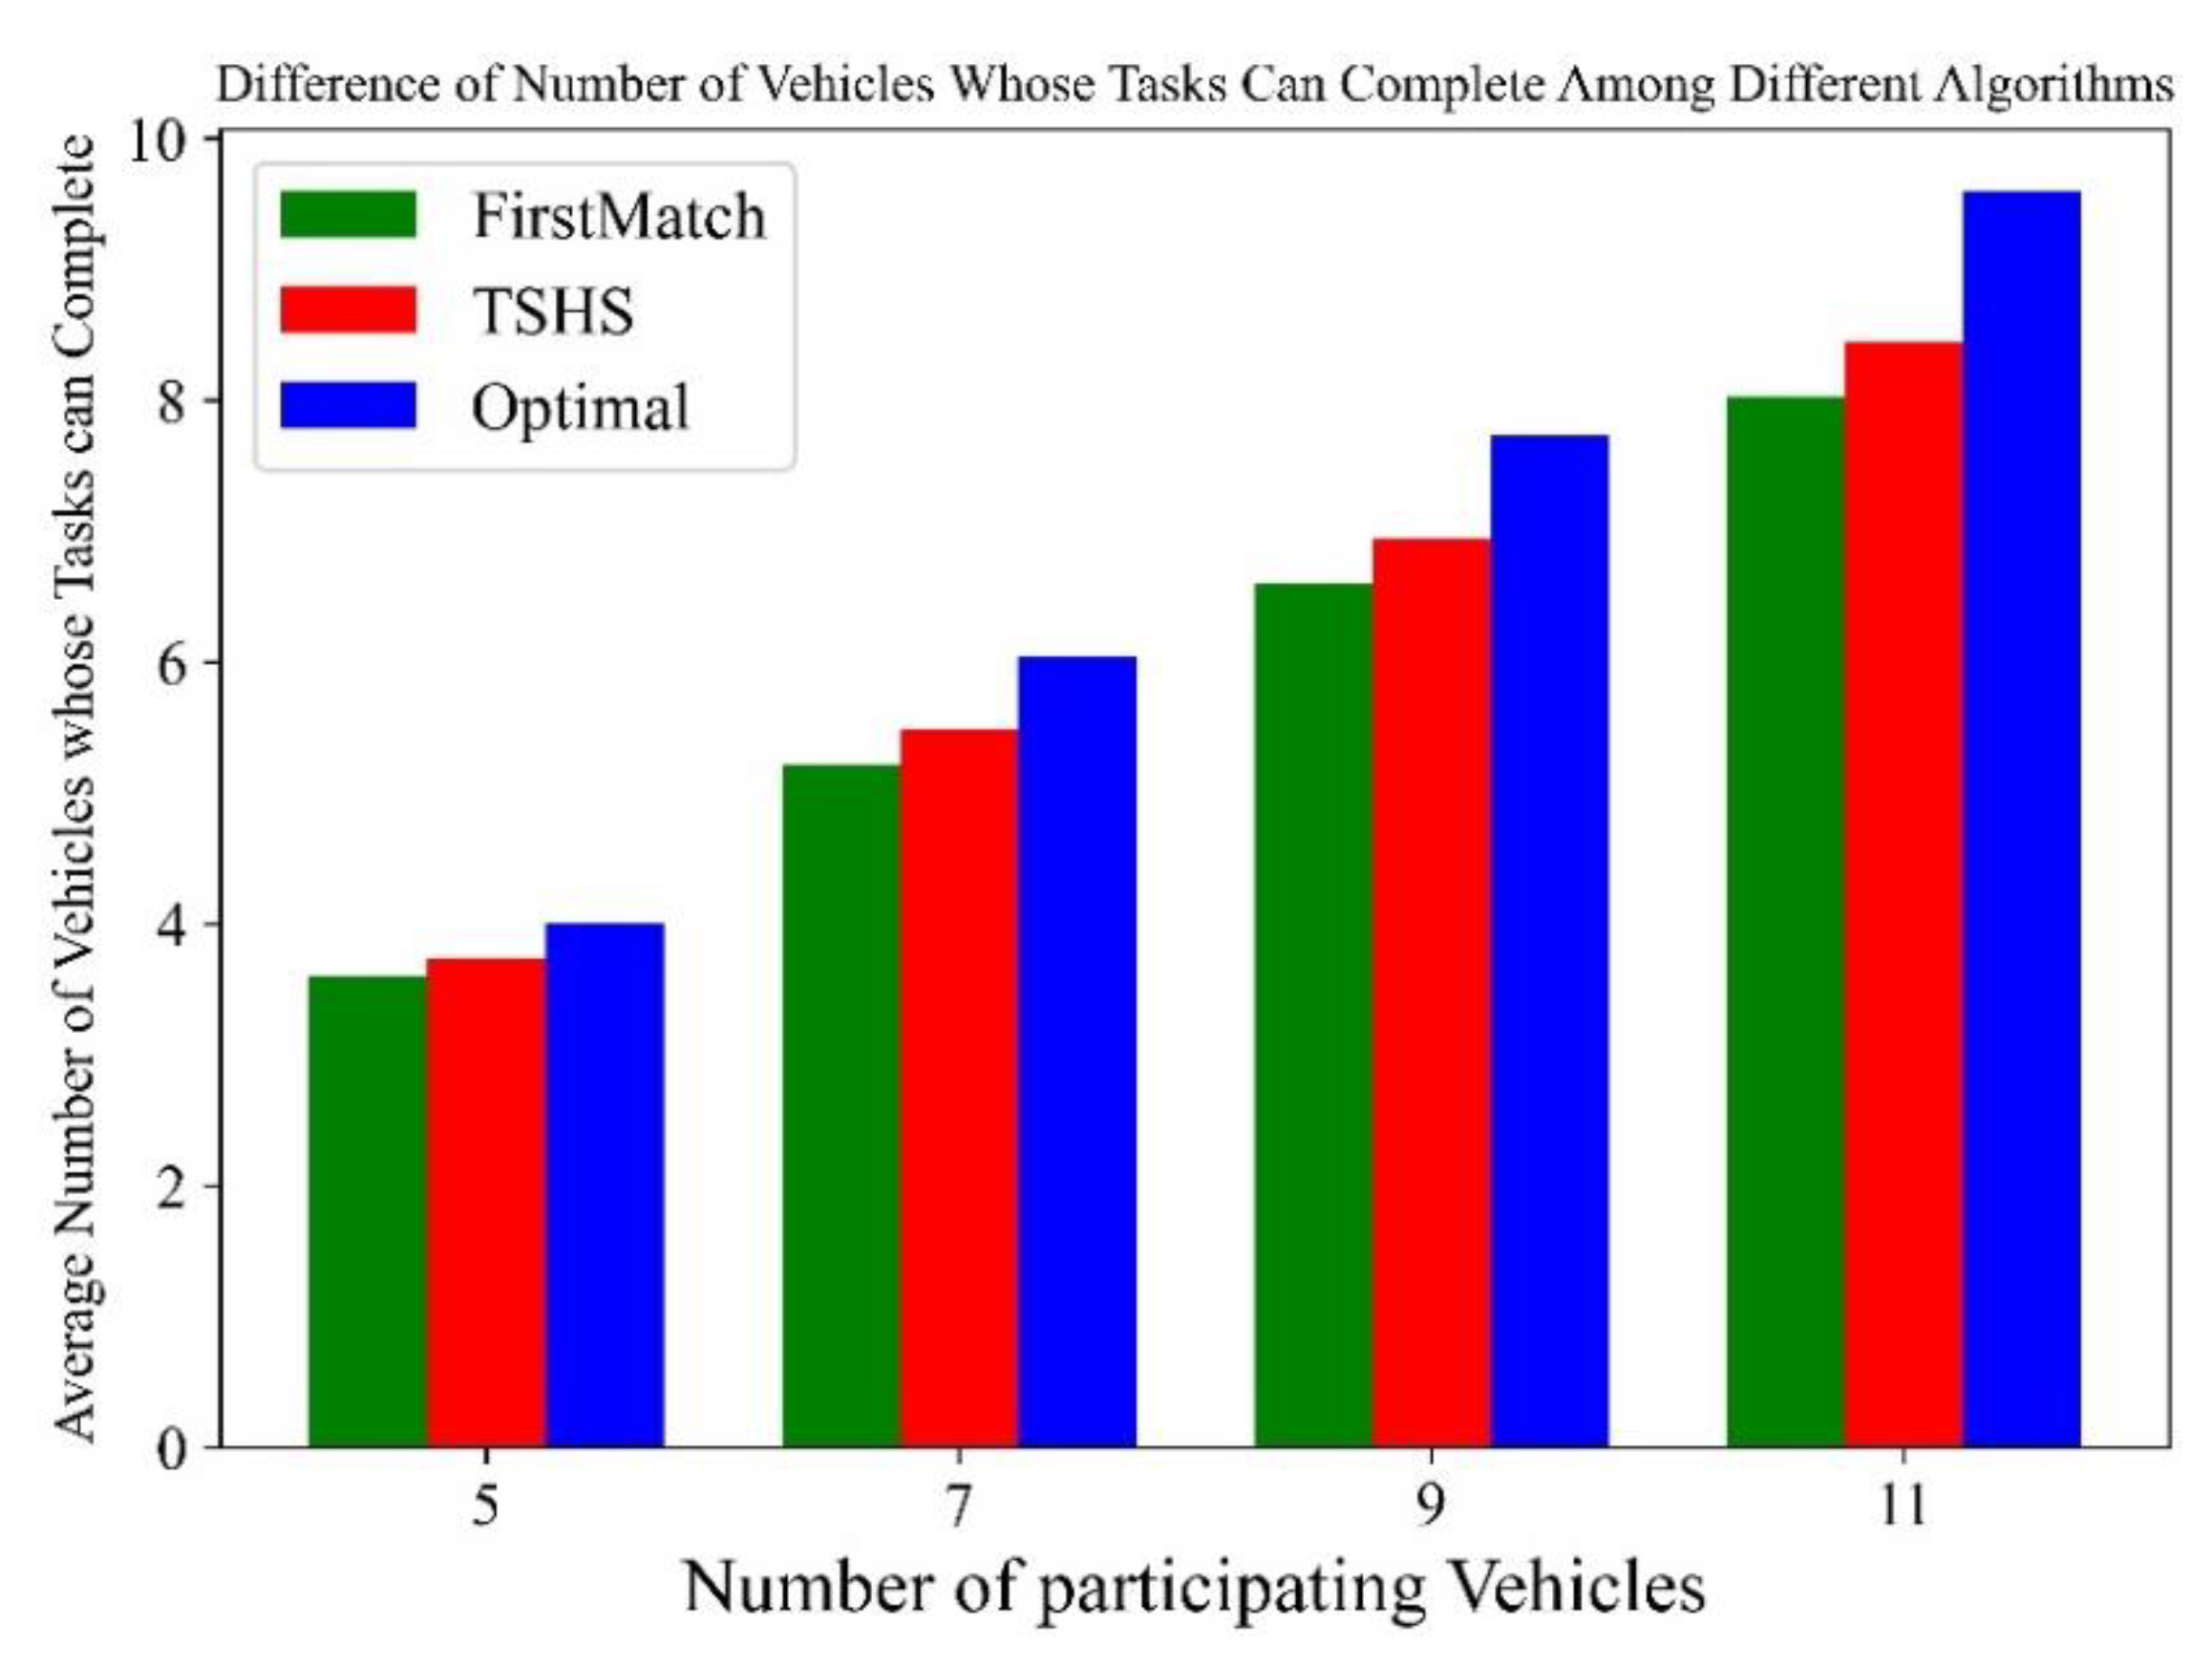
  • Optimal: optimal tasks scheduling scheme, which is solved by CPLEX.
  • FirstMatch (FM): Vehicles are numbered starting from 0, and FM selects vehicles in order from small to large for task scheduling determination. For the selected vehicle, a neighbor is also selected from the neighbor set according to the number from small to large, and as many tasks as possible are scheduled. If the vehicle cannot schedule its tasks in this way, it fails; otherwise, it succeeds.

5.2. Results and Discussion

5.2.1. Performance over Time

Before comparing the time performance of different scheduling algorithms, we first analyze the ratio of successful computations of the three algorithms in the simulation. A task scheduling decision is regarded as successful when it can be determined in an hour, and a long determination time is not sufficient because of the real-time and mobility requirements in the autonomous driving domain. Figure 6 illustrates the successful computation ratio of all simulations (a total of 255 in a scale) for three different algorithms under various cluster scales. The successful computation ratio of TSHS and FM is always 100% with the increasing cluster scale, but it declines with the increasing cluster scale for the optimal algorithm. When the cluster scale is 11, only 80% of the simulations can be completed within a fixed time. To detail the impact of RSD on the successful computation ratio, Figure 7 illustrates the successful computation ratio of the optimal algorithm along with the decrease in RSD under different cluster scales. The ratio of successful computation decreases rapidly with the increase in RSD when the cluster scale is large. Thus, the optimal offloading result cannot be acquired within a short period when the cluster scale is large, especially for vehicles in clusters with heavy loads. On the other hand, the TSHS can still acquire a good scheduling scheme within a short period.
Figure 8 illustrates the mean time consumption for acquiring results with different algorithms when the cluster scale changes, in which blue denotes optimal, red denotes the TSHS and green denotes FM. The mean time of each cluster scale is the mean value of the times of all RSDs, which denotes the average performance of the algorithm under different cluster loads. The time of each RSD is calculated by averaging the values of its 25 simulations to reduce the influence of randomness on the analysis. The optimal time increases rapidly with increasing cluster scale. Because of the long running time of the optimal algorithm, we conduct simulations using the optimal algorithm when the cluster scale is less than 12. The optimal algorithm is aborted because of memory overflow or cannot finish because of a very long execution time. Therefore, the blue bars are missing when there is a large number of participating vehicles. On the other hand, the running time of the TSHS is much less than optimal and does not increase significantly with increasing cluster scale. The TSHS is also better than FM in the simulation. Therefore, the proposed TSHS has good time performance and can be used when the cluster scale is large.

5.2.2. Improvement in Road Safety in the VEC-Based Architecture with Scheduling

First, we compare the average number of vehicles whose tasks can be completed in cooperative perception using the TSHS, FM and optimal when the cluster scale changes between 5 and 11, as shown in Figure 9. As above, the number of vehicles whose tasks can be completed in each cluster scale is derived by averaging the numbers of all RSDs of the scale, which denotes the mean performance of the algorithms under different cluster loads. The number of each RSD is calculated by averaging the numbers of its 25 simulations, which reduces the influence of randomness on the analysis. In Figure 9, red denotes the TSHS algorithm, green denotes FM and blue denotes the optimal algorithm. The difference between the TSHS and the optimal algorithm does not increase significantly as the scale increases, and the TSHS outperforms FM.
Figure 10 illustrates the average number of vehicles whose tasks can be completed under different RSDs, where green, red and blue indicate cooperative perception using FM, the TSHS and without offloading, respectively. The number decreases linearly with the decrease in the RSD without offloading, and a few vehicles can still complete their tasks by scheduling in the architecture with the TSHS, even under a larger cluster scale and heavy cluster load. At least 55% of vehicles in a cluster can complete their tasks with the TSHS, even when the RSD of a cluster is 10%. Although there is no significant difference between FM and the TSHS when the RSD is large, the TSHS is much better than FM when the RSD is lower because the property of neighbors is considered in TSHS. Therefore, the proposed TSHS can improve the number of vehicles whose tasks can be completed in cooperative perception, especially under heavy cluster loads, which means that road safety is improved by utilizing the resources of connected vehicles in a better way.

5.2.3. Resource Utilization

Finally, we compare the average resource utilization of the TSHS, FM and the optimal algorithm under different cluster scales. The CPU utilization is the proportion of the number of used CPU cores to the number of total CPU cores. Similarly, the average resource utilization is calculated by averaging the value of all RSDs of a cluster scale. As shown in Figure 11, although there is a gap between the TSHS and optimal, it is not large, and the TSHS outperforms FM. Considering the time consumed for acquiring g results, the TSHS is still a good algorithm.

6. Conclusions

In this paper, we propose a hybrid VEC-based architecture to improve the utilization of AVs for better cooperative perception and investigate the key task scheduling problem. It is modeled as a multidimensional multitask multitarget task scheduling problem with assignment restrictions. We prove its NP-hardness and propose a heuristic scheme (TSHS) to solve the problem. Substantial experiments show that the proposed TSHS is close to optimal, and at least 55% of vehicles in a cluster can complete their tasks based on our dataset, even under heavy cluster loads. Moreover, the fast running time of the TSHS is suitable for the autonomous domain. However, only one-hop offloading and a single RSU are considered in our paper, and multihop and multi-RSU collaboration will be considered in future papers. Second, designing a fair scheduling policy according to the contributions of participating AVs is also a promising direction. Third, our proposed architecture for cooperative perception does not consider the impact of communication, which is very important for cooperative perception in reality. Communication is the basis for realizing a cooperative, and its reliability directly impacts AV safety on the road, especially when high channel loads and packet collisions occur. Furthermore, the sync overhead is considerable and critical for driving safety, which means the tradeoff of gains and loss of sync should be concerned. These questions should receive deeper research.

Author Contributions

Conceptualization, Y.W. and J.Z.; methodology, Y.W. and J.Z.; software, Y.W.; formal analysis, Y.W.; investigation, Y.W.; resources, Y.W.; data curation, Y.W.; writing—original draft preparation, Y.W.; writing—review and editing, Y.W. and J.Z.; visualization, Y.W.; supervision, J.Z.; project administration, J.Z.; funding acquisition, J.Z. All authors have read and agreed to the published version of the manuscript.

Funding

This work is supported in part by the National Natural Science Foundation of China (Nos. 62062065, 12071417, 61962061), a project of the Natural Science Foundation of Yunnan Province of China (2019FB142 and 2018ZF017), the Education Foundation of Yunnan Province of China (2022J002) and the Program for Excellent Young Talents, Yunnan, China.

Institutional Review Board Statement

Not applicable.

Informed Consent Statement

Not applicable.

Data Availability Statement

The code used in the experiment can be obtained through the e-mail of the first author or corresponding author.

Conflicts of Interest

The authors declare no conflict of interest.

References

  1. Eskandarian, A.; Wu, C.X.; Sun, C.Y. Research Advances and Challenges of Autonomous and Connected Ground Vehicles. IEEE Trans. Intell. Transp. Syst. 2021, 22, 683–711. [Google Scholar] [CrossRef]
  2. Caillot, A.; Ouerghi, S.; Vasseur, P.; Boutteau, R.; Dupuis, Y. Survey on Cooperative Perception in an Automotive Context. IEEE Trans. Intell. Transp. Syst. 2022, 1–20. [Google Scholar] [CrossRef]
  3. Kenney, J.B. Dedicated Short-Range Communications (DSRC) Standards in the United States. Proc. IEEE 2011, 99, 1162–1182. [Google Scholar] [CrossRef]
  4. Liu, L.K.; Lu, S.D.; Zhong, R.; Wu, B.F.; Yao, Y.T.; Zhang, Q.Y.; Shi, W.S. Computing Systems for Autonomous Driving: State of the Art and Challenges. IEEE Internet Things 2021, 8, 6469–6486. [Google Scholar] [CrossRef]
  5. Hafner, B.; Bajpai, V.; Ott, J.; Schmitt, G.A. A Survey on Cooperative Architectures and Maneuvers for Connected and Automated Vehicles. IEEE Commun. Surv. Tutor. 2022, 24, 380–403. [Google Scholar] [CrossRef]
  6. Shen, Z.P.; Liu, Y.G.; Li, Z.M.; Nabin, M.H. Cooperative Spacing Sampled Control of Vehicle Platoon Considering Undirected Topology and Analog Fading Networks. IEEE Trans. Intell. Transp. Syst. 2022, 1–14. [Google Scholar] [CrossRef]
  7. Kim, S.W.; Qin, B.X.; Chong, Z.J.; Shen, X.T.; Liu, W.; Ang, M.H.; Frazzoli, E.; Rus, D. Multivehicle Cooperative Driving Using Cooperative Perception: Design and Experimental Validation. IEEE Trans. Intell. Transp. Syst. 2015, 16, 663–680. [Google Scholar] [CrossRef]
  8. Zhou, P.Y.; Kortoci, P.; Yau, Y.P.; Finley, B.; Wang, X.J.; Braud, T.; Lee, L.H.; Tarkoma, S.; Kangasharju, J.; Hui, P. AICP: Augmented Informative Cooperative Perception. IEEE Trans. Intell. Transp. Syst. 2022, 1–14. [Google Scholar] [CrossRef]
  9. Lin, L.; Liao, X.F.; Jin, H.; Li, P. Computation Offloading Toward Edge Computing. Proc. IEEE 2019, 107, 1584–1607. [Google Scholar] [CrossRef]
  10. Amadeo, M.; Campolo, C.; Molinaro, A. Information-Centric Networking for Connected Vehicles: A Survey and Future Perspectives. IEEE Commun. Mag. 2016, 54, 98–104. [Google Scholar] [CrossRef]
  11. Feng, J.Y.; Liu, Z.; Wu, C.; Ji, Y.S. AVE: Autonomous Vehicular Edge Computing Framework with ACO-Based Scheduling. IEEE Trans. Veh. Technol. 2017, 66, 10660–10675. [Google Scholar] [CrossRef]
  12. Zhu, C.; Chiang, Y.H.; Xiao, Y.; Ji, Y.S. FlexSensing: A QoI and Latency-Aware Task Allocation Scheme for Vehicle-Based Visual Crowdsourcing via Deep Q-Network. IEEE Internet Things 2021, 8, 7625–7637. [Google Scholar] [CrossRef]
  13. Lai, Y.X.; Xu, Y.F.; Mai, D.J.; Fan, Y.; Yang, F. Optimized Large-Scale Road Sensing Through Crowdsourced Vehicles. IEEE Trans. Intell. Transp. Syst. 2022, 23, 3878–3889. [Google Scholar] [CrossRef]
  14. Hui, Y.L.; Huang, Y.H.; Su, Z.; Luan, T.H.; Cheng, N.; Xiao, X.; Ding, G.R. BCC: Blockchain-Based Collaborative Crowdsensing in Autonomous Vehicular Networks. IEEE Internet Things 2022, 9, 4518–4532. [Google Scholar] [CrossRef]
  15. Zhao, H.Y.; Zhang, Y.B.; Meng, P.F.; Shi, H.; Li, L.E.R.; Lou, T.C.; Zhao, J.S. Safety Score: A Quantitative Approach to Guiding Safety-Aware Autonomous Vehicle Computing System Design. In Proceedings of the 31st IEEE Intelligent Vehicles Symposium (IV), Las Vegas, NV, USA, 23–26 June 2020; pp. 1479–1485. [Google Scholar]
  16. Tissljaric, L.; Vrbanic, F.; Ivanjko, E.; Caric, T. Motorway Bottleneck Probability Estimation in Connected Vehicles Environment Using Speed Transition Matrices. Sensors 2022, 22, 20. [Google Scholar] [CrossRef]
  17. Shan, M.; Narula, K.; Wong, Y.F.; Worrall, S.; Khan, M.; Alexander, P.; Nebot, E. Demonstrations of Cooperative Perception: Safety and Robustness in Connected and Automated Vehicle Operations. Sensors 2021, 21, 31. [Google Scholar] [CrossRef]
  18. Gani, S.M.O.; Fallah, Y.P.; Bansal, G.; Shimizu, T. A Study of the Effectiveness of Message Content, Length, and Rate Control for Improving Map Accuracy in Automated Driving Systems. IEEE Trans. Intell. Transp. Syst. 2019, 20, 405–420. [Google Scholar] [CrossRef]
  19. Higuchi, T.; Giordani, M.; Zanella, A.; Zorzi, M.; Altintas, O. Value-Anticipating V2V Communications for Cooperative Perception. In Proceedings of the 30th IEEE Intelligent Vehicles Symposium (IV), Paris, France, 9–12 June 2019; pp. 1947–1952. [Google Scholar]
  20. Thandavarayan, G.; Sepulcre, M.; Gozalvez, J. Cooperative Perception for Connected and Automated Vehicles: Evaluation and Impact of Congestion Control. IEEE Access 2020, 8, 197665–197683. [Google Scholar] [CrossRef]
  21. Rohani, M.; Gingras, D.; Vigneron, V.; Gruyer, D. A New Decentralized Bayesian Approach for Cooperative Vehicle Localization Based on Fusion of GPS and VANET Based Inter-Vehicle Distance Measurement. IEEE Intell. Transp. Syst. Mag. 2015, 7, 85–95. [Google Scholar] [CrossRef]
  22. Miller, A.; Rim, K.; Chopra, P.; Kelkar, P.; Likhachev, M. Cooperative Perception and Localization for Cooperative Driving. In Proceedings of the IEEE International Conference on Robotics and Automation (ICRA), Paris, France, 31 May–15 June 2020; pp. 1256–1262. [Google Scholar]
  23. Krämmer, A.; Schöller, C.; Gulati, D.; Knoll, A. Providentia—A Large Scale Sensing System for the Assistance of Autonomous Vehicles. 2019. Available online: https://mediatum.ub.tum.de/1510403 (accessed on 6 July 2021).
  24. Liu, X.; Li, W.D.; Zhang, X.J. Strategy-Proof Mechanism for Provisioning and Allocation Virtual Machines in Heterogeneous Clouds. IEEE Trans. Parallel Distrib. Syst. 2018, 29, 1650–1663. [Google Scholar] [CrossRef]
  25. Zhang, J.X.; Yang, X.T.; Xie, N.; Zhang, X.J.; Vasilakos, A.V.; Li, W.D. An online auction mechanism for time-varying multidimensional resource allocation in clouds. Future Gener. Comp. Syst. 2020, 111, 27–38. [Google Scholar] [CrossRef]
  26. Zhang, J.X.; Xie, N.; Zhang, X.J.; Li, W.D. Strategy-Proof Mechanism for Online Time-Varying Resource Allocation with Restart. J. Comput. 2021, 19, 20. [Google Scholar] [CrossRef]
  27. Zhang, J.X.; Xie, N.; Yang, X.T.; Zhang, X.J.; Li, W.D. Strategy-proof mechanism for time-varying batch virtual machine allocation in clouds. Clust. Comput. 2021, 24, 3709–3724. [Google Scholar] [CrossRef]
  28. Zhang, J.X.; Xie, N.; Zhang, X.J.; Li, W.D. An online auction mechanism for cloud computing resource allocation and pricing based on user evaluation and cost. Future Gener. Comp. Syst. 2018, 89, 286–299. [Google Scholar] [CrossRef]
  29. Zhang, J.X.; Xie, N.; Zhang, X.J.; Yue, K.; Li, W.D.; Kumar, D. Machine Learning Based Resource Allocation of Cloud Computing in Auction. CMC-Comput. Mat. Contin. 2018, 56, 123–135. [Google Scholar] [CrossRef]
  30. Zhang, J.X.; Chi, L.X.; Xie, N.; Yang, X.T.; Zhang, X.J.; Li, W.D. Strategy-proof mechanism for online resource allocation in cloud and edge collaboration. Computing 2022, 104, 383–412. [Google Scholar] [CrossRef]
  31. Zhang, J.X.; Lou, W.L.; Sun, H.; Su, Q.; Li, W.D. Truthful auction mechanisms for resource allocation in the Internet of Vehicles with public blockchain networks. Future Gener. Comp. Syst. 2022, 132, 11–24. [Google Scholar] [CrossRef]
  32. Liwang, M.H.; Wang, J.X.; Gao, Z.B.; Du, X.J.; Guizani, M. Game Theory Based Opportunistic Computation Offloading in Cloud-Enabled IoV. IEEE Access 2019, 7, 32551–32561. [Google Scholar] [CrossRef]
  33. Chen, X.; Thomas, N.; Zhan, T.M.; Ding, J. A Hybrid Task Scheduling Scheme for Heterogeneous Vehicular Edge Systems. IEEE Access 2019, 7, 117088–117099. [Google Scholar] [CrossRef]
  34. Wan, S.H.; Li, X.; Xue, Y.; Lin, W.M.; Xu, X.L. Efficient computation offloading for Internet of Vehicles in edge computing-assisted 5G networks. J. Supercomput. 2020, 76, 2518–2547. [Google Scholar] [CrossRef]
  35. Liu, Y.; Yu, H.M.; Xie, S.L.; Zhang, Y. Deep Reinforcement Learning for Offloading and Resource Allocation in Vehicle Edge Computing and Networks. IEEE Trans. Veh. Technol. 2019, 68, 11158–11168. [Google Scholar] [CrossRef]
  36. Zhou, Z.Y.; Feng, J.H.; Chang, Z.; Shen, X.M. Energy-Efficient Edge Computing Service Provisioning for Vehicular Networks: A Consensus ADMM Approach. IEEE Trans. Veh. Technol. 2019, 68, 5087–5099. [Google Scholar] [CrossRef]
  37. Xu, X.L.; Xue, Y.; Qi, L.Y.; Yuan, Y.; Zhang, X.Y.; Umer, T.; Wan, S.H. An edge computing-enabled computation offloading method with privacy preservation for internet of connected vehicles. Future Gener. Comp. Syst. 2019, 96, 89–100. [Google Scholar] [CrossRef]
  38. Jansen, K. A Fast Approximation Scheme for the Multiple Knapsack Problem. In International Conference on Current Trends in Theory and Practice of Computer Science; Springer: Berlin/Heidelberg, Germany, 2012; Volume 7147, pp. 313–324. [Google Scholar]
  39. Available online: https://www.ibm.com/products/ilog-cplex-optimization-studio (accessed on 2 June 2021).
Figure 1. Illustration of cooperative perception. Vehicles can connect with other vehicles via V2V links and can connect with RSUs via V2I links. Detected environmental information can be transmitted among all participants.
Mathematics 10 03328 g001
Figure 2. Tasks scheduling procedure in a hybrid VEC-based architecture for cooperative perception.
Mathematics 10 03328 g002
Figure 3. Road safety improvement via task scheduling in cooperative perception. (a) No task scheduling performed. (b) Conduct task scheduling.
Mathematics 10 03328 g003
Figure 4. Example: impacts of NoN on the number of AVs whose tasks can be completed. (a) Vehicle with more NoN offloads first; (b) otherwise.
Mathematics 10 03328 g004
Figure 5. Diagram of the generated dataset.
Mathematics 10 03328 g005
Figure 6. Successful computation ratio of different algorithms under diverse cluster scales.
Mathematics 10 03328 g006
Figure 7. Successful computation ratio of optima under different RSDs and cluster scales. The two lines, blue and orange, coincide with each other.
Mathematics 10 03328 g007
Figure 8. Average running time of different algorithms.
Mathematics 10 03328 g008
Figure 9. Differences in the number of vehicles whose tasks can be completed among different algorithms under different numbers of participating vehicles.
Mathematics 10 03328 g009
Figure 10. Average number of vehicles whose tasks can be completed under different RSDs. (a) Cluster scale is 18. (b) Cluster scale is 28. (c) Cluster scale is 48.
Mathematics 10 03328 g010
Figure 11. Utilization of different resources. (a) Utilization of CPU cores. (b) Utilization of RAM. (c) Utilization of disk.
Mathematics 10 03328 g011
Table 1. Summary of Acronyms.
AcronymPhrase
AVautonomous vehicle
VECvehicular edge computing
RSUroadside unit
TSHStwo-stage heuristic scheme
CAVsconnected and autonomous vehicles
DSRCdedicated short-range communication
V2Vvehicle-to-vehicle
V2Ivehicle-to-infrastructure
ECedge computing
NoNnumber of neighbors
BDRbalance degree of resources
RRATresource requirements of all tasks
RSDsatisfaction degree
Table 2. Main annotations used in the paper.
TermDescription
M , Number and set of AVs in cooperative perception
K ,   K Number and set of task types
R ,   Number and set of resource types
s i ,   S Task request vector of vehicle i and task request matrix of all AVs in a time slot
ω i ,   W Resource requirement vector of task type i , and the resource requirement matrix of all types of tasks
c i ,   C Available resources of AV i used in cooperative perception and those resources of all vehicles in a time slot
δ i ,   Δ Neighbor vector of AV i and those of all vehicles
x i Decision variable of AV i , which indicates whether its tasks are completed with assistance from other vehicles. x i { 0 , 1 } .
y i j k Latent decision variable of k -type tasks that are transmitted to AV i from AV j for execution. y i j k Z + { 0 } .
Publisher’s Note: MDPI stays neutral with regard to jurisdictional claims in published maps and institutional affiliations.

