Abstract
The behavior risk of workers is one of the main restricting factors in coal mine safety decision-making and management. In this paper, the behavior and decision-making process of individuals and organizations are modeled and analyzed to solve this challenge, based on data analysis and behavior decision-making. Based on system dynamics (SD), this paper proposes an unsafe behavior correction system (SD-Ipt) for coal miners to reduce occupational risk. The “1 + 1 + 3 + X” behavior risk correction decision-making system is constructed, and the implementation scheme of the system is put forward, which has been applied in coal mines. This study can effectively correct the unsafe behavior of coal mining enterprises and improve the occupational safety and health management ability of coal mining enterprises.
MSC:
91C05
1. Introduction
Human factors are the main part of occupational risk, and the reduction of occupational risk is one of the important methods of Coal Mine Occupational Safety and health management. Therefore, research on human factors is an important research field to reduce the risk of occupational safety and health management in coal mines.
The purpose of this article is to establish a system for correcting the safety behavior level of coal mine employees, thereby improving the safety level of coal mine employees, effectively reducing the incidence and loss of accidents caused by human behavior and achieving significant social and economic benefits.
In recent decades, a large number of pioneering and fruitful studies have been conducted on safety behavior, which has accumulated rich research results and experience for this study. Some scholars have found that there is a certain relationship between safety behavior and safety atmosphere [1]. The relationship between safety atmosphere, safety motivation and safety behavior are studied from the individual and group level [2]. Safety behaviors are also related to factors such as safety supervision and underground noise level in coal mines [3,4]. In other industries, the main influencing factors of unsafe behaviors include organizational and social factors [5], management safety, work safety tension [6], safety atmosphere and personal safety awareness [7,8,9,10].
With the deepening of research, it is found that the factors leading to unsafe behaviors exist in many aspects. For example, leaders’ behaviors and management policies will have an impact on employees’ behaviors [11], the lack of safety culture will lead to employees’ unsafe behaviors [12] and personal perception, environmental support, organizational management system and experience\personal psychological pressure will also lead to unsafe behaviors [13,14,15].
Many scholars use simulation to analyze and study safety behavior, and have achieved rich results. System dynamics (SD) has been used to analyze the cognitive mechanism of unsafe behaviors [16] and propose joint intervention strategies to control unsafe behaviors [17,18]. Group dynamics is used to analyze the group safety behavior of coal miners [19]. Evolutionary game theory is used to describe the dynamic process of multi person game in coal mine safety supervision [20,21]. QSIM (Qualitative Simulation) can simulate and analyze qualitative problems, and based on it, a computer can realize qualitative simulation. QSIM and a group safety behavior software platform based on genetic neural network optimized QSIM filtering are used to simulate and analyze the group safety behavior of coal miners [22,23]. These provide some new ideas for the research on behavior of coal miners.
Correction of unsafe behaviors can improve employees’ behaviors and processes [24]. The ways to improve safety behavior have been studied from many aspects: for example, improving employees’ safety awareness and emotional participation [25], strengthening supervision over enterprise safety [26], strengthening safety education and training for miners, creating a good atmosphere, improving systems and standards, and improving employees’ skills [15,27].
The above research results have laid a foundation for the correction of group safety behavior. The above studies studied the characteristics and influencing factors of safety behavior from the perspective of the group, and studied the changing process, rules and characteristics of safety behavior. This paper constructs an SD model of coal mine employees’ unsafe behaviors and simulates the evolution of unsafe behaviors. It also contributes to the prediction and correction system of coal mine employee behavior. The development and deepening of the prediction and correction system for coal mine employees’ behavior has high theoretical significance and practical application value.
2. Methods
2.1. Behavior Characteristics of Coal Mine Workers
Most of the coal mine workers work underground, and their working characteristics are as follow:
- ➀
- Long working time and high intensity. Although the underground mechanization is gradually improving, part of the work that needs to be completed manually is still heavy. Therefore, compared with employees in other industries, coal mine employees have long working hours and high intensity.
- ➁
- High work risk. The underground work of coal mine workers is accompanied by the threat of water damage, fire, gas and other hidden dangers. Once the accident is caused by improper operation, it will cause serious casualties.
- ➂
- Poor working environment. Coal mine workers usually work in the depth of the earth’s surface, accompanied by a lot of dust, high temperature, high humidity and high noise. Under such a working environment, the occupational safety and health of employees are seriously affected.
Under such work characteristics, coal mine workers have formed their own unique unsafe behaviors. The specific characteristics are as follows:
- ➀
- Easy to spread. Due to the particularity of the work of coal mine workers, any individual in the group (team or district team) has unsafe behavior. If it is not stopped, other individuals in the group will follow suit, so that the behavior can quickly spread in the group.
- ➁
- Behavior tends to create risk. Coal mine employees are very tired. In order to get more rest time, under the influence of luck and energy-saving psychology, coal mine employees will have some dangerous behaviors to complete the task as soon as possible. At this time, the employees’ behavior will tend to create risk.
- ➂
- Uncertainty. Affected by various external environmental factors and the physiological and psychological factors of the employees themselves, it is impossible to predict and determine when the employees will take safe actions and when unsafe actions. Even if there are unsafe behaviors, the consequences cannot be determined, because some unsafe behaviors may cause accidents, but some only increase the risk of production and do not cause accidents.
The behavior of coal mine workers is considered to be a complex system, including all aspects of their work. If all factors are used to build the model, it is impossible to complete the task. Therefore, how to select the factors needed for modeling with emphasis is a challenge in modeling. The selected factors should reflect the behavior characteristics of coal mine workers as much as possible, and must be as simple and reliable as possible.
2.2. The SD Model
The sense of group safety and the level of cognition are the abilities of employees. It is obtained by the accumulation of safety psychological and physiological level with time. Similarly, risk identification ability, risk aversion ability and emergency response ability are also elements to describe the characteristics of subgroups, and the level of group safety ability can be accumulated with time. The relationship between the group safety feeling and the cognitive level, the group safety ability level and the group safety behavior state, is the growth rate compared with the group safety behavior level. They are the integral of the group safety behavior level with respect to time T. Therefore, the level of group safety ability, the level of group safety feeling and cognition and the state of group safety behavior are all variables of growth rate in the model.
In the model, four state variables, i.e., the size of positive subgroups, the number of positive subgroups, the size of negative subgroups and the number of negative subgroups, are established to simulate the evolution of group behavior from the microscopic perspective. The product of the number of subgroups and the size of subgroups is the total size of the relevant groups. These variables directly affect the group subculture, including the positive subgroup affecting the positive subculture, the negative subgroup affecting the negative subculture, and the subculture has a direct impact on the group safety behavior.
The SD flow chart of the safety behavior level of coal mine employees was created based on the causal relationship and feedback of the above analysis, as shown in Figure 1. According to the system dynamics modeling requirements, the feedback loop of the group safety behavior level is fed back from the group safety behavior level gap. It constitutes the dynamic simulation and simulation mechanism of the entire SD system over time.
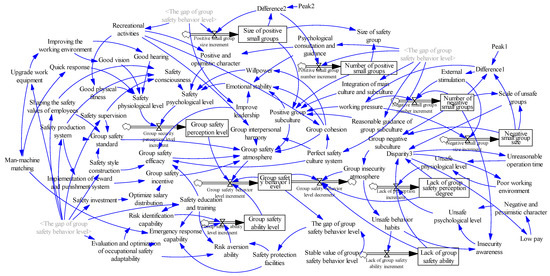
Figure 1.
SD flow chart of the level of safety behavior of coal mine workers.
2.3. The Determination of Initial Values
The initial value of the model should be determined according to the research purpose of the model, the relationship between variables and repeated debugging of variables. Based on expert scoring and model adjustment and optimization method, the initial value assignment of each variable in the SD model was obtained, as shown in Table 1. The time step is 0.25, that is, the value is selected at every 0.25 time point in the simulation. The smaller the time step, the shorter the interval between the selection of various variables in the system, and the more accurate the results of system operation, which provides a higher accuracy and research basis for linear regression analysis of simulation data in the later stage.

Table 1.
Data table of initial values of some variables in SD model.
This article creates a new decision-making correction intensity (Impact Intensity) determination index IPT, which is used to determine the correction intensity of intervention decision-making on the level of group safety behavior. The calculation formula of IPT is:
where Kn is the linear regression slope value of the strengthened intervention strategy, and K0 is the linear regression slope value of the original data. Therefore, IPT is the ratio of the strength of intervention decision-making in a unit time period to the slope of the group safety behavior level of the original data, which can objectively reflect the correction intensity of the group safety behavior level in the unit time period Tn.
IPT = Kn/K0
3. Results
3.1. EAP System Intervention
Perform intervention decision simulation on the SD model of group safety behavior level, increase the intervention intensity of various intervention decisions in the EAP (Employee Assistance Program) system respectively and obtain the simulation diagram of the correction intensity of various intervention decisions in the EAP system, as shown in Figure 2.
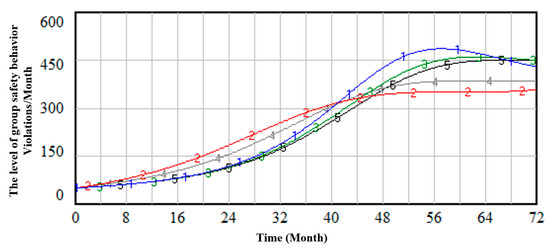
Figure 2.
The intervention decision simulation diagram of EAP system. Line 1 shows the influence of psychological counseling and counseling on the level of group safety behavior, Line 2 shows the impact of safety investment on the level of group safety behavior, Line 3 shows the impact of upgrading work equipment on the level of group safety behavior, Line 4 shows the influence of recreational and sports activities on the level of group safety behavior, Line 5 shows the initial data.
According to the average segmentation of the time series, there are 18 time periods, which are represented by Tn (n = 1,2,3,4……18), and each time period contains 4 months. Taking the linear regression analysis of the fund security investment decision K2 in the T1 time period as an example, the linear regression dot matrix diagram of the fund security investment in the time period T1 is obtained, as shown in Figure 3, and the linear regression equation slope K2T1 in the T1 time period is obtained.
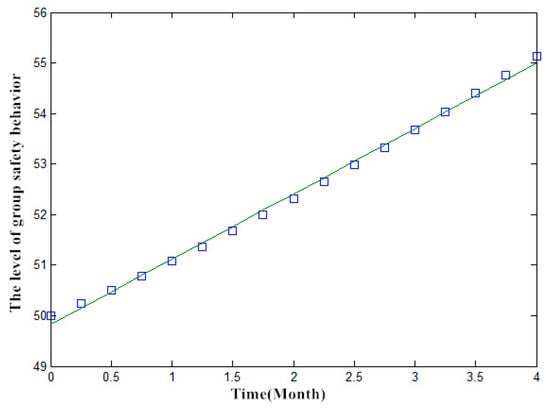
Figure 3.
The data of safety investment linear regression at period of time T1.
According to the above method, the four decisions of the EAP system in each time period are analyzed and researched, and the growth rate K of the EAP system in each time period after each decision-making strength is strengthened is shown in Table 2. The comparison of the slope Kn and the original data K0 after the various decision-making efforts are strengthened is shown in Figure 4.
Table 2.
The growth rate K with each decision power strengthened of EAP system.
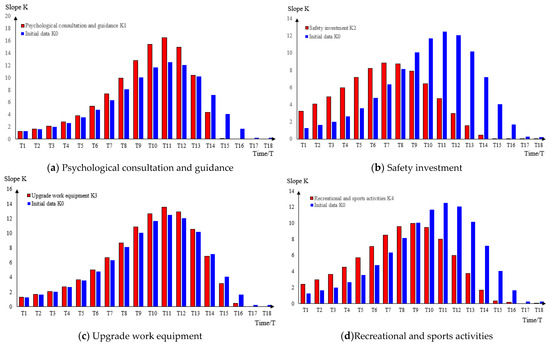
Figure 4.
The comparison of Kn in every period of time.
For each time period, take each decision correction strength IPT according to the formula and obtain the analysis diagram of the change of the decision correction strength with the time period Tn, as shown in Figure 5.
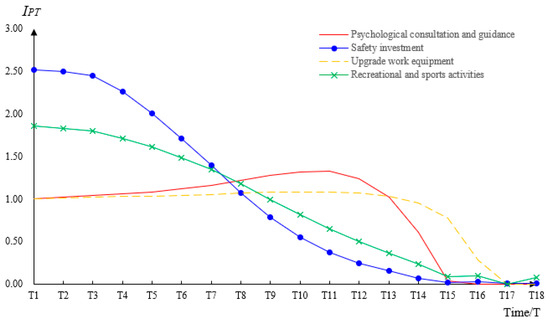
Figure 5.
The analysis of IPT change with T based on EAP system.
Therefore, the criterion for determining the intensity of intervention decision correction is established: when IPT > 1, it means that the decision has a significant effect on the improvement of group safety behavior level; when IPT < 1, it means that the effect of this decision on correction and improvement of group safety behavior level is poor. The larger the IPT, the better the corrective effect of the decision-making intensity on the safety behavior level of the group during the time period. According to the criterion of correction intensity, taking IPT = 1 as the baseline, cultural, sports and entertainment activities and fund security investment have a more obvious effect on the improvement of group safety behavior level correction within the time period of T1–T8, of which the correction intensity of fund security investment is higher; psychological counseling and counseling and upgrading work equipment have a more obvious effect on improving group safety behavior level correction during the T8–T13 time period and the intensity of psychological counseling and counseling correction is higher.
Research has shown that in the various decisions of the EAP system, capital security investment and cultural, sports and entertainment activities have a better effect on improving the level of group safety behavior in the early stage and psychological counseling and counseling and upgrading work equipment have a better effect on improving the level of group safety behavior in the later stage.
3.2. Organizational Management Intervention
Carry out intervention decision simulation on the SD model of group safety behavior level and increase the intervention intensity of various intervention decisions of the organization and management. Figure 6 shows the simulation diagram of the correction intensity of various intervention decisions in the organization and management.
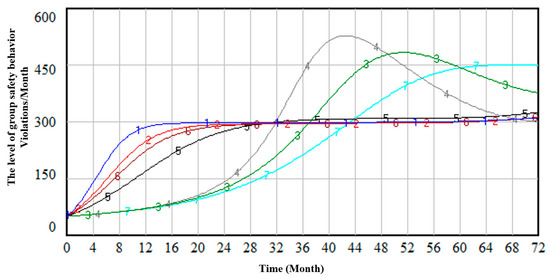
Figure 6.
Simulation of organizational management intervention decision. Line 1 shows the impact of safety education and training on the level of group safety behavior, Line 2 shows the impact of improving leadership on the level of group safety behavior, Line 3 shows the impact of safety protection facilities on the level of group safety behavior, Line 4 shows the impact of safety occupational adaptability evaluation on the level of group safety behavior, Line 5 shows the impact of safety supervision on the level of group safety behavior, Line 6 shows on the impact of safety production system on the level of group safety behavior, Line 7 shows the initial data.
According to the above method, the six decisions of organizational management intervention in each time period are analyzed and studied. The six decisions are: to improve leadership, safety protection facilities, safety occupational adaptability evaluation, safety education and training, safety supervision and safety production system.
According to the calculation formula of the decision-making correction strength judgment index IPT, the analysis diagram of the change of the decision-making correction strength with the time period Tn is calculated as shown in Figure 7.
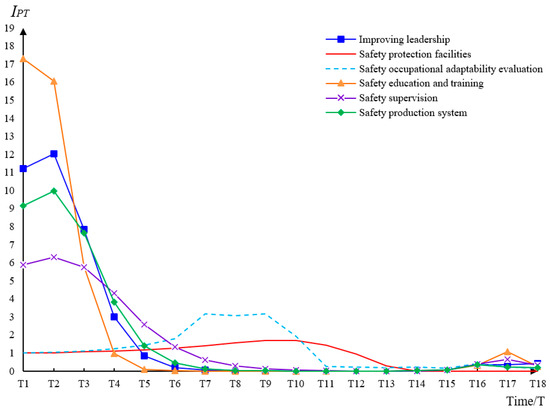
Figure 7.
The analysis of IPT change with T based on organizational management.
According to the criterion of correction intensity, with IPT = 1 as the baseline, safety education and training, improvement of managerial leadership, improvement of safety productivity and strengthening of supervision are more effective in improving the level of group safety behavior in the T1–T5 time period. In addition, the preliminary comparison of the four decisions in the T1–T5 time period is: safety education and training, improvement of managerial leadership, safety production system and strengthening of safety supervision. The correction intensity of them increases with time, that is, safety education training has the strongest correction intensity in the T1–T3 time period and the improvement of the leadership ability of managers and the safety production system has the strongest correction intensity in the T3–T4 time period and strengthening supervision is the strongest correction intensity in the T4–T5 period. Safety occupational adaptability evaluation and safety protection facilities have a more obvious effect on the improvement of group safety behavior level in the later stage and safety occupational adaptability evaluation has a higher correction intensity.
Research shows that in the organization and management of various decisions, safety education and training, improvement of managerial leadership, safety production system and strengthening of safety supervision are effective in improving the level of group safety behavior in the early stage. Safety occupational adaptability evaluation and safety protection facilities have a better effect on improving the level of group safety behavior in the later stage.
3.3. Safety Culture Intervention
Carry out intervention decision simulation on the SD model of group safety behavior level, increase the intensity of various intervention decision-making interventions in safety culture, respectively: complete safety culture system, reasonable guidance of group subculture, integration of main culture and subculture, safety style construction, shaping employee safety values. The simulation diagram of correction intensity of various intervention decisions of safety culture is shown in Figure 8.
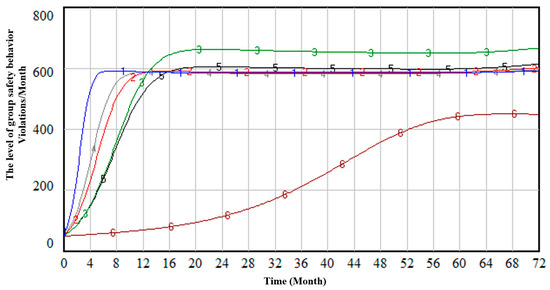
Figure 8.
Simulation of safety culture intervention decision. Line 1 shows the impact of safety culture system perfection on the level of group safety behavior, Line 2 shows the impact of rational guidance of group subculture on the level of group safety behavior, Line 3 shows the impact of main culture and sub-culture interface integration on the level of group safety behavior, Line 4 shows the impact of safety style construction on the level of group safety behavior, Line 5 shows the impact of employee safety values shaping on the level of group safety behavior, Line 6 shows the initial data.
According to the calculation formula of the decision-making correction strength judgment index IPT, the analysis diagram of the change of the decision-making correction strength with the time period TN is calculated as shown in Figure 9.
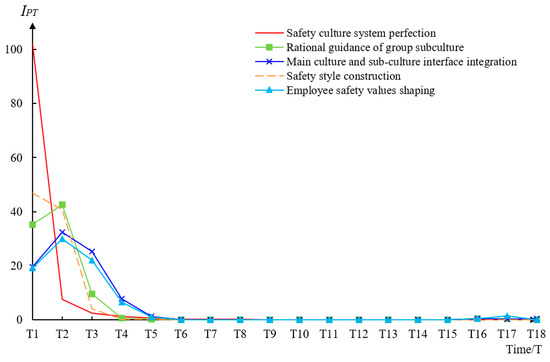
Figure 9.
The analysis of IPT change with T based on safety culture.
According to the criterion of correction strength, take IPT = 1 as the baseline. The improvement of safety culture system, the construction of safety style, the reasonable guidance of subculture, the integration of main culture and subculture, and the shaping of employee safety values have a more obvious effect on the correction and improvement of group safety behavior level during the T1–T5 period, that is, the improvement of the safety culture system has the strongest correction intensity in the T1 time period and the construction of safety style and the reasonable guidance of group subcultures have the strongest correction intensity in the T2 time period, the integration of the main culture and the subculture and the shaping of employee safety values have the strongest correction intensity during the T3–T5 period.
Research has shown that in various decisions regarding safety culture, the improvement of safety culture system, the construction of safety styles and the reasonable guidance of group subculture are effective in improving the level of group safety behaviors in the early stage. The integration of the main culture and the subculture and the shaping of employee safety values have good effects on the correction of group safety behavior in the later stage, and the integration of the main culture and the subculture has the best correction effect in the later stage.
4. Discussion
4.1. The Basic Structure
Based on the SD model simulation, this study establishes a “1 + 1 + 3 + X” coal mine worker group safety behavior correction system. Its basic structure is as follows: the first “1” refers to the organizational structure of the correction system and the general plan, the second “1” refers to the mutual operation mechanism and specific operating procedures of various corrective countermeasures,”3” refers to specific intervention measures in the three dimensions of “EAP system”, “organizational management” and “safety culture”, “X” refers to the specific implementation plan. During the implementation of the specific plan, optimization and adjustment should be made according to the actual special requirements of the specific project, and the attachments are other security supports or items that may need additional support. Figure 10 shows the “1 + 1 + 3 + X” correction system structure diagram.
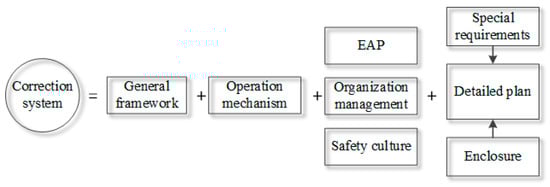
Figure 10.
The structure diagram of correction system about “1 + 1 + 3 + X”.
The main content of the general framework of the group safety behavior correction system is to formulate the guidance document for the correction system, explaining the purpose and function of the correction system, the laws and regulations on which it is based, the safety production rules and regulations and the technical specifications and standards for the management of coal enterprises. Identify the department responsible for behavior modification management, the participating units, departments and personnel involved in the various tasks of the behavior modification system and determine the specific division of labor and specific tasks of each unit, department and personnel.
The operation mechanism of the group safety behavior correction system consists of three modules: EAP system, organization management and safety culture, and is based on the orderly development of various decision-making measures in time series, and according to the actual conditions of coal mines, carry out investigations and researches on the special requirements of coal mine enterprises, put forward a specific implementation plan for coal mines and make full preparations for the material guarantees and other requirements required for the operation of the system.
4.2. The Operation Mechanism
According to the simulation results of the model, the operation mechanism and specific implementation plan of the coal mine worker group safety behavior correction system are shown in Table 3.
Table 3.
Operation mechanism and specific implementing scheme of correction system.
4.3. The Verification of the Correction System
The research results of this paper have been applied to coal mining enterprises, and the safety supervision measures have been adjusted in June 2020. This series of measures has been implemented for one year, and employees’ violations have been summarized and analyzed. In order to observe the application effect of management measures on workers’ safety behavior, the evolution trend of employees’ violation behavior is counted from 2020 to 2021, as shown in Figure 11.
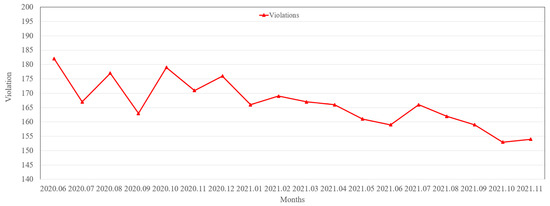
Figure 11.
Development trend of violation from 2020 to 2021.
Although the number of violations by workers in Figure 10 fluctuates locally, the overall trend is downward. This shows that adjusting management measures and strengthening the strength and frequency of safety supervision can reduce violations and improve their safety behavior.
The data of the same month in 2020 and 2021 will be compared and analyzed to more clearly analyze the evolution trend of employee behavior, as shown in Figure 12.
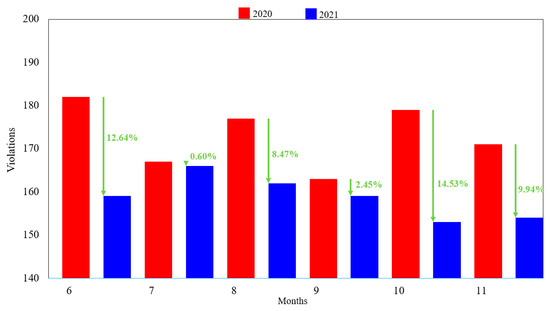
Figure 12.
Comparative analysis of violation times of coal mine workers in 2020 and 2021.
The engineering application shows that the research results of this paper have positive significance for the safety behavior of coal miners. As can be seen from Figure 11 and Figure 12, the research results of this paper can reduce workers’ violations and promote safety behavior, but there is still room to reduce the number of violations. Therefore, the focus of future research work will be to adopt scientific and reasonable methods to further improve the safety behavior of coal miners.
5. Conclusions
Based on the SD-IPT, the decision correction intensity discrimination index is established to guide coal mine safety production, and the specific implementation plans is put forward. The main conclusions of this paper are as follows:
- (1)
- The SD model of group safety behavior level of coal mine workers is established. Systemically simulate the SD model of coal mine employees’ group safety behavior level. The evolution law of small group safety behavior in scale and quantity is studied.
- (2)
- The new type of decision correction strength index IPT is created. The IPT of various correction decisions in the three aspects of the EAP system, organizational management and safety culture is calculated, and the correction intensity characteristic of the intervention decision over time is obtained according to the characteristics of the judgment index.
- (3)
- The “1 + 1 + 3 + X” correction system for the safety behaviors of coal mine workers was established. The specific coal mine implementation plan is proposed for the operating mechanism. It is proved that the correction system has a significant correction and improvement effect on group safety behaviors and individual safety behaviors.
Author Contributions
Conceptualization, K.Y.; methodology, L.Z.; validation, S.Z.; formal analysis, P.L.; investigation, K.Y.; resources, J.C.; data curation, K.Y.; writing—original draft preparation, K.Y.; writing—review and editing, P.L.; supervision, K.Y.; project administration, L.Z. and S.Z.; funding acquisition, K.Y. All authors have read and agreed to the published version of the manuscript.
Funding
This research was funded by Shandong Provincial Natural Science Foundation, China, grant number ZR2020QE137 and Youth Fund for Humanities and Social Sciences Research of the Ministry of education of China, grant number 20YJC840021.
Institutional Review Board Statement
The study was conducted according to the guidelines of the Declaration of Helsinki, and the study was approved by the Shandong Provincial Natural Science Foundation (ZR2020QE137).
Informed Consent Statement
Informed consent was obtained from all subjects involved in the study.
Data Availability Statement
The data presented in this study are available on request from the corresponding author.
Acknowledgments
The authors would like to thank support of all teachers and students of safety engineering and the authors of the references.
Conflicts of Interest
The authors declare no conflict of interest.
References
- Cooper, M.D.; Phillips, R.A. Exploratory analysis of the safety climate and safety behavior relationship. J. Saf. Res. 2004, 35, 497–512. [Google Scholar] [CrossRef] [PubMed]
- Neal, A.; Griffin, M.A. A study of the lagged relationships among safety climate, safety motivation, safety behavior, and accidents at the individual and group levels. J. Appl. Psychol. 2006, 91, 946–953. [Google Scholar] [CrossRef] [PubMed]
- Fang, D.; Wu, C.; Wu, H. Impact of the Supervisor on Worker Safety Behavior in Construction Projects. J. Manag. Eng. 2015, 31, 4015001. [Google Scholar] [CrossRef]
- Li, J.; Qin, Y.; Yang, L.; Wang, Z.; Han, K.; Guan, C. A simulation experiment study to examine the effects of noise on miners’ safety behavior in underground coal mines. BMC Public Health 2021, 21, 324. [Google Scholar] [CrossRef] [PubMed]
- Mullen, J. Investigating factors that influence individual safety behavior at work. J. Saf. Res. 2004, 35, 275–285. [Google Scholar] [CrossRef]
- Morrow, S.L.; McGonagle, A.K.; Dove-Steinkamp, M.L.; Walker, C.T., Jr.; Marmet, M.; Barnes-Farrell, J.L. Relationships between psychological safety climate facets and safety behavior in the rail industry: A dominance analysis. Accid. Anal. Prev. 2010, 42, 1460–1467. [Google Scholar] [CrossRef]
- Lyu, S.; Hon, C.K.H.; Chan, A.P.C.; Wong, F.K.W.; Javed, A.A. Relationships among Safety Climate, Safety Behavior, and Safety Outcomes for Ethnic Minority Construction Workers. Int. J. Environ. Res. Public Health 2018, 15, 484. [Google Scholar] [CrossRef]
- Wang, M.; Sun, J.; Du, H.; Wang, C. Relations between Safety Climate, Awareness, and Behavior in the Chinese Construction Industry: A Hierarchical Linear Investigation. Adv. Civ. Eng. 2018, 2018, 6580375. [Google Scholar] [CrossRef]
- Brondino, M.; Silva, S.A.; Pasini, M. Multilevel approach to organizational and group safety climate and safety performance: Co-workers as the missing link. Saf. Sci. 2012, 50, 1847–1856. [Google Scholar] [CrossRef]
- Deng, Y.; Guo, H.; Meng, M.; Zhang, Y.; Pei, S. Exploring the Effects of Safety Climate on Worker’s Safety Behavior in Subway Operation. Sustainability 2020, 12, 8310. [Google Scholar] [CrossRef]
- Fernández-Muñiz, B.; Montes-Peón, J.M.; Vázquez-Ordás, C.J. The role of safety leadership and working conditions in safety performance in process industries. J. Loss Prev. Process Ind. 2017, 50, 403–415. [Google Scholar] [CrossRef]
- Mokarami, H.; Alizadeh, S.S.; Pordanjani, T.R.; Varmazyar, S. The relationship between organizational safety culture and unsafe behaviors, and accidents among public transport bus drivers using structural equation modeling. Transp. Res. Part F Traffic Psychol. Behav. 2019, 65, 46–55. [Google Scholar] [CrossRef]
- Zhang, J.; Fu, J.; Hao, H.; Fu, G.; Nie, F.; Zhang, W. Root causes of coal mine accidents: Characteristics of safety culture deficiencies based on accident statistics. Process Saf. Environ. Prot. 2020, 136, 78–91. [Google Scholar] [CrossRef]
- Wang, D.; Wang, X.; Xia, N. How safety-related stress affects workers’ safety behavior: The moderating role of psychological capital. Saf. Sci. 2018, 103, 247–259. [Google Scholar] [CrossRef]
- Wang, C.; Wang, J.; Wang, X.; Yu, H.; Bai, L.; Sun, Q. Exploring the impacts of factors contributing to unsafe behavior of coal miners. Saf. Sci. 2019, 115, 339–348. [Google Scholar] [CrossRef]
- Lifen, F.A.N.G.; Zhang, Z.; Haihong, G.U.O. Cognitive mechanism and intervention strategies of coal miners’ unsafe be-haviors: Evidence from China. Rev. De Cercet. Si Interv. Soc. 2018, 61, 7–31. [Google Scholar]
- Yu, K.; Cao, Q.; Xie, C.; Qu, N.; Zhou, L. Analysis of intervention strategies for coal miners’ unsafe behaviors based on analytic network process and system dynamics. Saf. Sci. 2019, 118, 145–157. [Google Scholar] [CrossRef]
- Jiang, Z.; Fang, D.; Zhang, M. Understanding the Causation of Construction Workers’ Unsafe Behaviors Based on System Dynamics Modeling. J. Manag. Eng. 2015, 31, 4014099. [Google Scholar] [CrossRef]
- Wang, L.; Cao, Q.; Han, C.; Song, J.; Qu, N. Group dynamics analysis and the correction of coal miners’ unsafe behaviors. Arch. Environ. Occup. Health 2020, 76, 188–209. [Google Scholar] [CrossRef]
- Li, S.; Wang, Y.; Liu, Q. A model of unsafe behavior in coal mines based on game theory. Int. J. Min. Sci. Technol. 2013, 23, 99–103. [Google Scholar] [CrossRef]
- Liu, Q.; Li, X.; Meng, X. Effectiveness research on the multi-player evolutionary game of coal-mine safety regulation in China based on system dynamics. Saf. Sci. 2018, 111, 224–233. [Google Scholar] [CrossRef]
- Yu, K.; Zhou, L.; Cao, Q.; Li, Z. Evolutionary Game Research on Symmetry of Workers’ Behavior in Coal Mine Enterprises. Symmetry 2019, 11, 156. [Google Scholar] [CrossRef]
- Cao, Q.; Yu, K.; Zhou, L.; Wang, L.; Li, C. In-depth research on qualitative simulation of coal miners’ group safety behaviors. Saf. Sci. 2019, 113, 210–232. [Google Scholar] [CrossRef]
- Ismail, Z.; Doostdar, S.; Harun, Z. Factors influencing the implementation of a safety management system for construction sites. Saf. Sci. 2011, 50, 418–423. [Google Scholar] [CrossRef]
- Wachter, J.K.; Yorio, P.L. A system of safety management practices and worker engagement for reducing and preventing accidents: An empirical and theoretical investigation. Accid. Anal. Prev. 2014, 68, 117–130. [Google Scholar] [CrossRef] [PubMed]
- Lu, R.; Wang, X.; Yu, H.; Li, D. Multiparty Evolutionary Game Model in Coal Mine Safety Management and Its Application. Complexity 2018, 2018, 9620142. [Google Scholar] [CrossRef]
- Min, Y.; Yexiang, F.; Weilin, T.; Jiajie, Z. Study on safety behavior planning theory and control strategies for coal chemical workers. Saf. Sci. 2020, 128, 104726. [Google Scholar] [CrossRef]
Publisher’s Note: MDPI stays neutral with regard to jurisdictional claims in published maps and institutional affiliations. |
© 2022 by the authors. Licensee MDPI, Basel, Switzerland. This article is an open access article distributed under the terms and conditions of the Creative Commons Attribution (CC BY) license (https://creativecommons.org/licenses/by/4.0/).