Abstract
Artificial intelligence has been utilized extensively in the healthcare sector for the last few decades to simplify medical procedures, such as diagnosis, prognosis, drug discovery, and many more. With the spread of the COVID-19 pandemic, more methods for detecting and treating COVID-19 infections have been developed. Several projects involving considerable artificial intelligence use have been researched and put into practice. Crowdsensing is an example of an application in which artificial intelligence is employed to detect the presence of a virus in an individual based on their physiological parameters. A solution is proposed to detect the potential COVID-19 carrier in crowded premises of a closed campus area, for example, hospitals, corridors, company premises, and so on. Sensor-based wearable devices are utilized to obtain measurements of various physiological indicators (or parameters) of an individual. A machine-learning-based model is proposed for COVID-19 prediction with these parameters as input. The wearable device dataset was used to train four different machine learning algorithms. The support vector machine, which performed the best, received an F1-score of 96.64% and an accuracy score of 96.57%. Moreover, the wearable device is used to retrieve the coordinates of a potential COVID-19 carrier, and the YOLOv5 object detection method is used to do real-time visual tracking on a closed-circuit television video feed.
Keywords:
machine learning; crowdsensing; object detection; support vector machine; time-series data; wearable device; YOLOv5 MSC:
68T01
1. Introduction
Since the beginning of 2020, the newly found coronavirus disease (COVID-19) has turned the world upside down and has been declared a global pandemic. It has caused countless deaths and even impacted the economy of many countries. According to the World Health Organization’s (WHO) data, there have been 34,765,976 confirmed cases of COVID-19, with 478,759 deaths as of 31 December 2021 [1] in the country. The clinical studies carried out for COVID-19 testing have revealed that most hospitalized patients have pneumonia-like symptoms and problems breathing [2]. COVID-19 is a highly contagious virus that spreads through tiny droplets in the air when an affected person sneezes or speaks directly without wearing a mask [3]. The WHO claimed that people in the early stages of the sickness are likely to develop symptoms two days after becoming infected by the virus [4]. Therefore, a person could be a COVID-19 carrier even when they are not experiencing any relevant symptoms (i.e., they could be asymptomatic). Therefore, detecting the novel coronavirus and self-isolating oneself is vital to avoid its transmission. In addition to COVID-19, another mutant was highlighted by WHO, dubbed the delta variant, which was observed to be more hazardous than COVID-19 and produced the second wave, resulting in many deaths internationally [5]. The WHO has designated this variant as a variant of concern (VOC). Recently, another strain named omicron has been found, which is claimed to be transmitted more swiftly than the novel coronavirus [6]. Testing is still underway to evaluate its severity and whether or not the vaccine offered to people will function against the new version [7].
Due to the outbreak, people are advised to avoid crowded places; however, there are specific places where people gather for several reasons, such as for religious purposes, celebrations, and so on. Therefore, detecting the potential COVID-19 carriers and protecting others from getting infected is essential. For this purpose, this paper proposes a crowdsensing framework to detect potentially positive COVID-19 carriers using wearable devices and the you only look once (YOLOv5) model for closed-circuit television (CCTV)-camera-based real-time object tracking. Crowdsensing is a technique of sharing data collected by sensor devices and predicting a pattern of information. This raises the question of this technology’s potential in alerting people to this pandemic and preventing future COVID-19 outbreaks. The healthcare industry has been developing new tools to detect the coronavirus during this global pandemic. The use of artificial intelligence (AI) in this business is essential, and numerous ground-breaking technologies have been developed in this field [8]. AI could help analyze the degree of viral infection and even find clusters and ’hot spots,’ according to a review study by R. Vaishya et al., which will aid in contact tracing and monitoring infected people [9].
1.1. Related Works
This subsection discusses the various research works presented to date and their contribution to the detection and early diagnosis of the COVID-19 virus. In 2021, Nguyen et al. proposed a face mask prototype with wearable and disposable biosensors that can detect the presence of COVID-19 in the wearer’s body in 90 min [10]. The wearable biosensors in this diagnostic mask are made from freeze-dried, cell-free (FDCF) genetic circuits. For privacy reasons, the findings are shown on the inside of the mask.Moreover, A. Syrowatka et al. conducted a study review of the available literature on the use of AI to make informed decisions for pandemic preparedness and response [11]. They have identified six key use cases where machine learning (ML) was leveraged for the same, including “real-time monitoring of adherence to public health recommendations”. A scoping review on applications of AI, telehealth, and several digital health solutions to optimize the healthcare industry amidst the pandemic was presented by [12]. It suggests a need for better evaluation of applications for population surveillance and points of entry. Another study [13] utilized Biovitals Sentinel, which processed clinical data fed from wearable biosensors for indications of early clinical progression in quarantined individuals with COVID-19 exposure. They proposed a protocol for a randomized controlled trial, and it had a primary result of measuring the time taken for diagnosis of the virus. C. Jin et al. [14] proposed a deep learning (DL)-based system to achieve rapid COVID-19 detection and performed a statistical analysis on computed tomography (CT) images of COVID-19 patients based on the AI system. On applying deep convolutional neural networks (DCNN), an AUC score of 97.81% was achieved on the test data and approximately 93% on other databases used for validation. In addition to this, the guided gradient-weighted class activation mapping (Guided Grad-CAM) method was used to capture attention regions for the diagnosis. Another study [15] discussed a framework review to categorize integrative research works on applications of AI and ML methodology on three scales: molecular, clinical, and societal. It articulated the impacts of various AI-based solutions proposed and the need to employ the principles of AI in practice with better solutions.
Mohammad-H. et al. published a survey paper that included AI applications in the fight against COVID-19 [16]. It provided in-depth information on clinical applications, X-ray image processing, and other topics, such as treatment, diagnosis, patient monitoring, and many others, employing machine learning algorithms [16]. Using CT scan image processing, W. Zhang et al. suggested a novel dynamic fusion-based federated learning approach for COVID-19 positive case detection [17]. Their evaluation showed that their framework was practicable and provided superior model performance and communication efficiency than the default setting of federated learning [17].
Furthermore, Imran et al. created an app called ’AI4covid-19,’ which records the sound of three 3 s coughs and sends it to a cloud-based AI model, which delivers the results of COVID-19 detection in a matter of minutes [18]. The paper was proposed before the vaccine was invented. However, it was not proven to be an ideal solution because the model was trained and tested on a small dataset, and it has been stated that the data quality might have been compromised. Hirten et al. suggested another approach in which severe acute respiratory syndrome coronavirus 2 (SARS-CoV-2) is diagnosed and COVID-19 is forecasted using heart rate variability (HRV) reports collected from wearable devices with sensors, such as smartwatches [19]. It was not demonstrated to be a realistic solution because the data they utilized for testing was quite limited, which contradicts the ability of precise infection prediction via HRV metrics. In other cases, mobile crowdsensing was used to create smart quarantine tactics to prevent the virus [20] from spreading further. The study also describes an application that self-diagnoses the COVID-19 infection and sends out warning notifications to everyone in the area of the potentially infected person if the result is positive. The current project aims to develop a method for crowdsensing and accurately predicting when a person will exhibit COVID-19 symptoms. Table 1 shows the comparison of the existing state-of-the-art work and our proposed work by considering parameters, such as objective, performance measures and research gaps.
Table 1.
A relative comparison of various state-of-the-art approaches for the detection and early diagnosis of the COVID-19 virus.
1.2. Contributions
The main contributions of this paper are as follows:
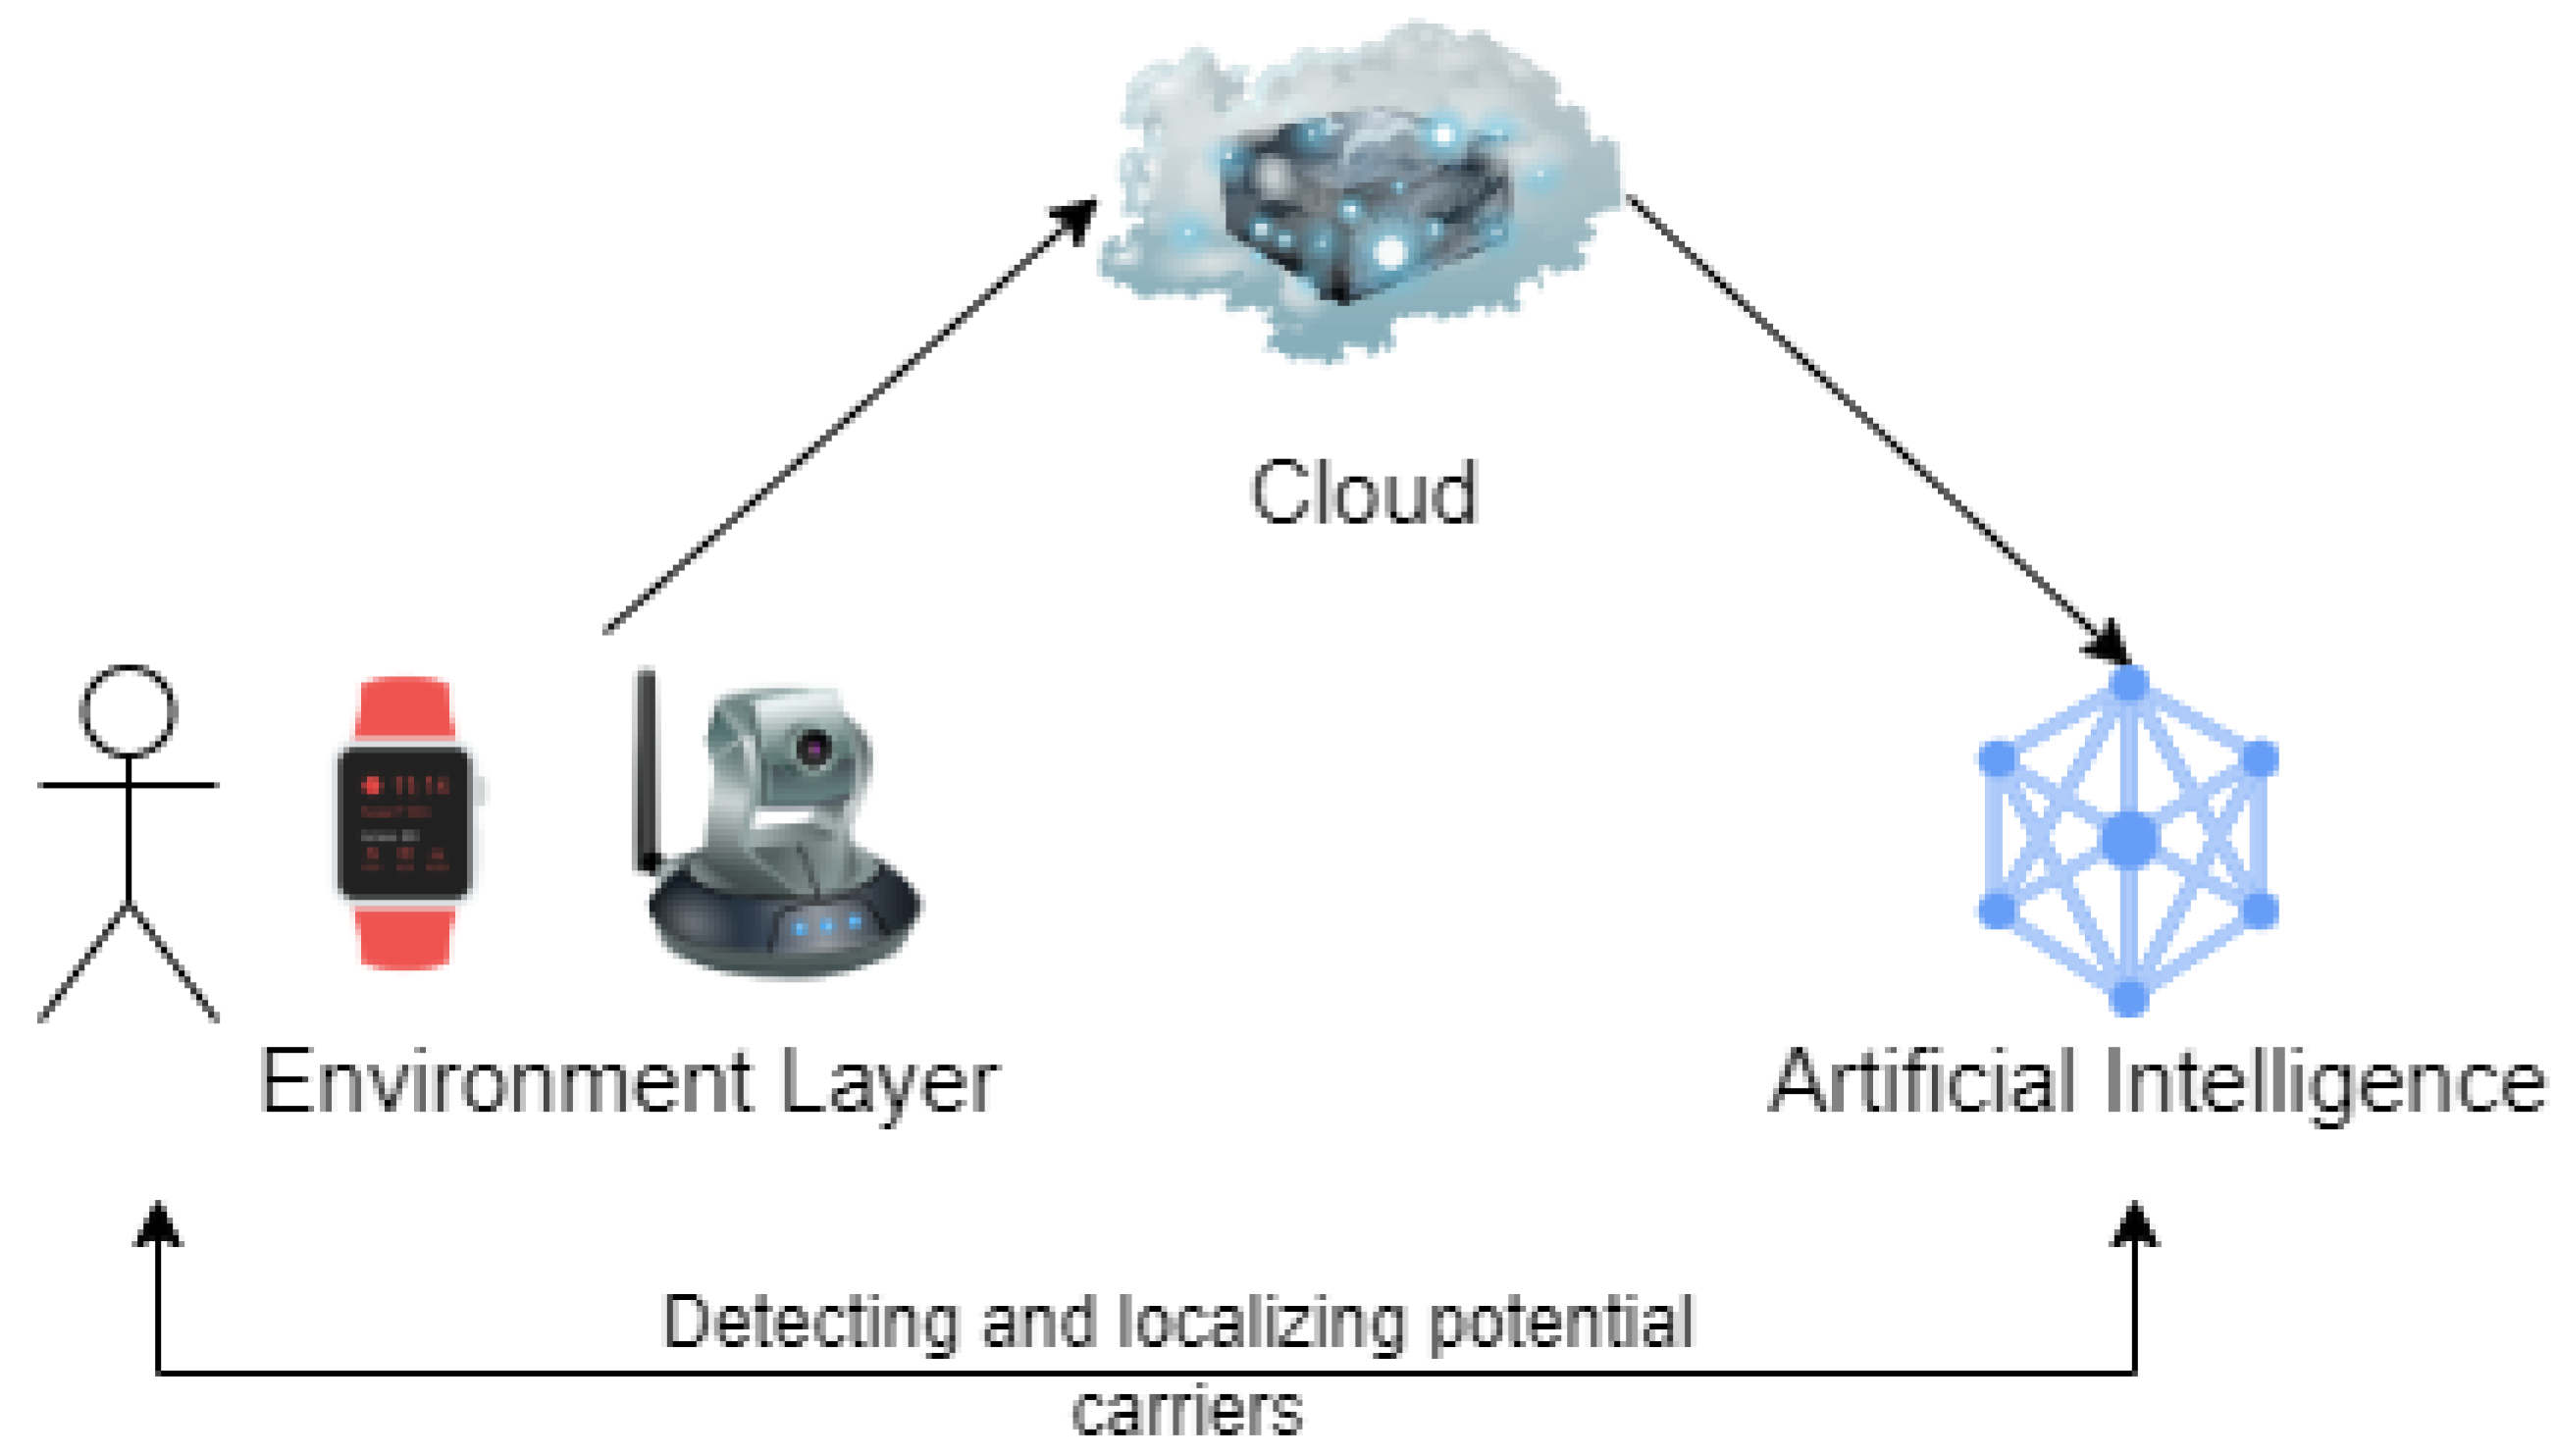
- We present a framework for crowdsensing in the context of COVID-19 carrier detection. In this context, we use wearable device sensor data, such as live GPS coordinates and temporary vital signs, to detect covid carriers.
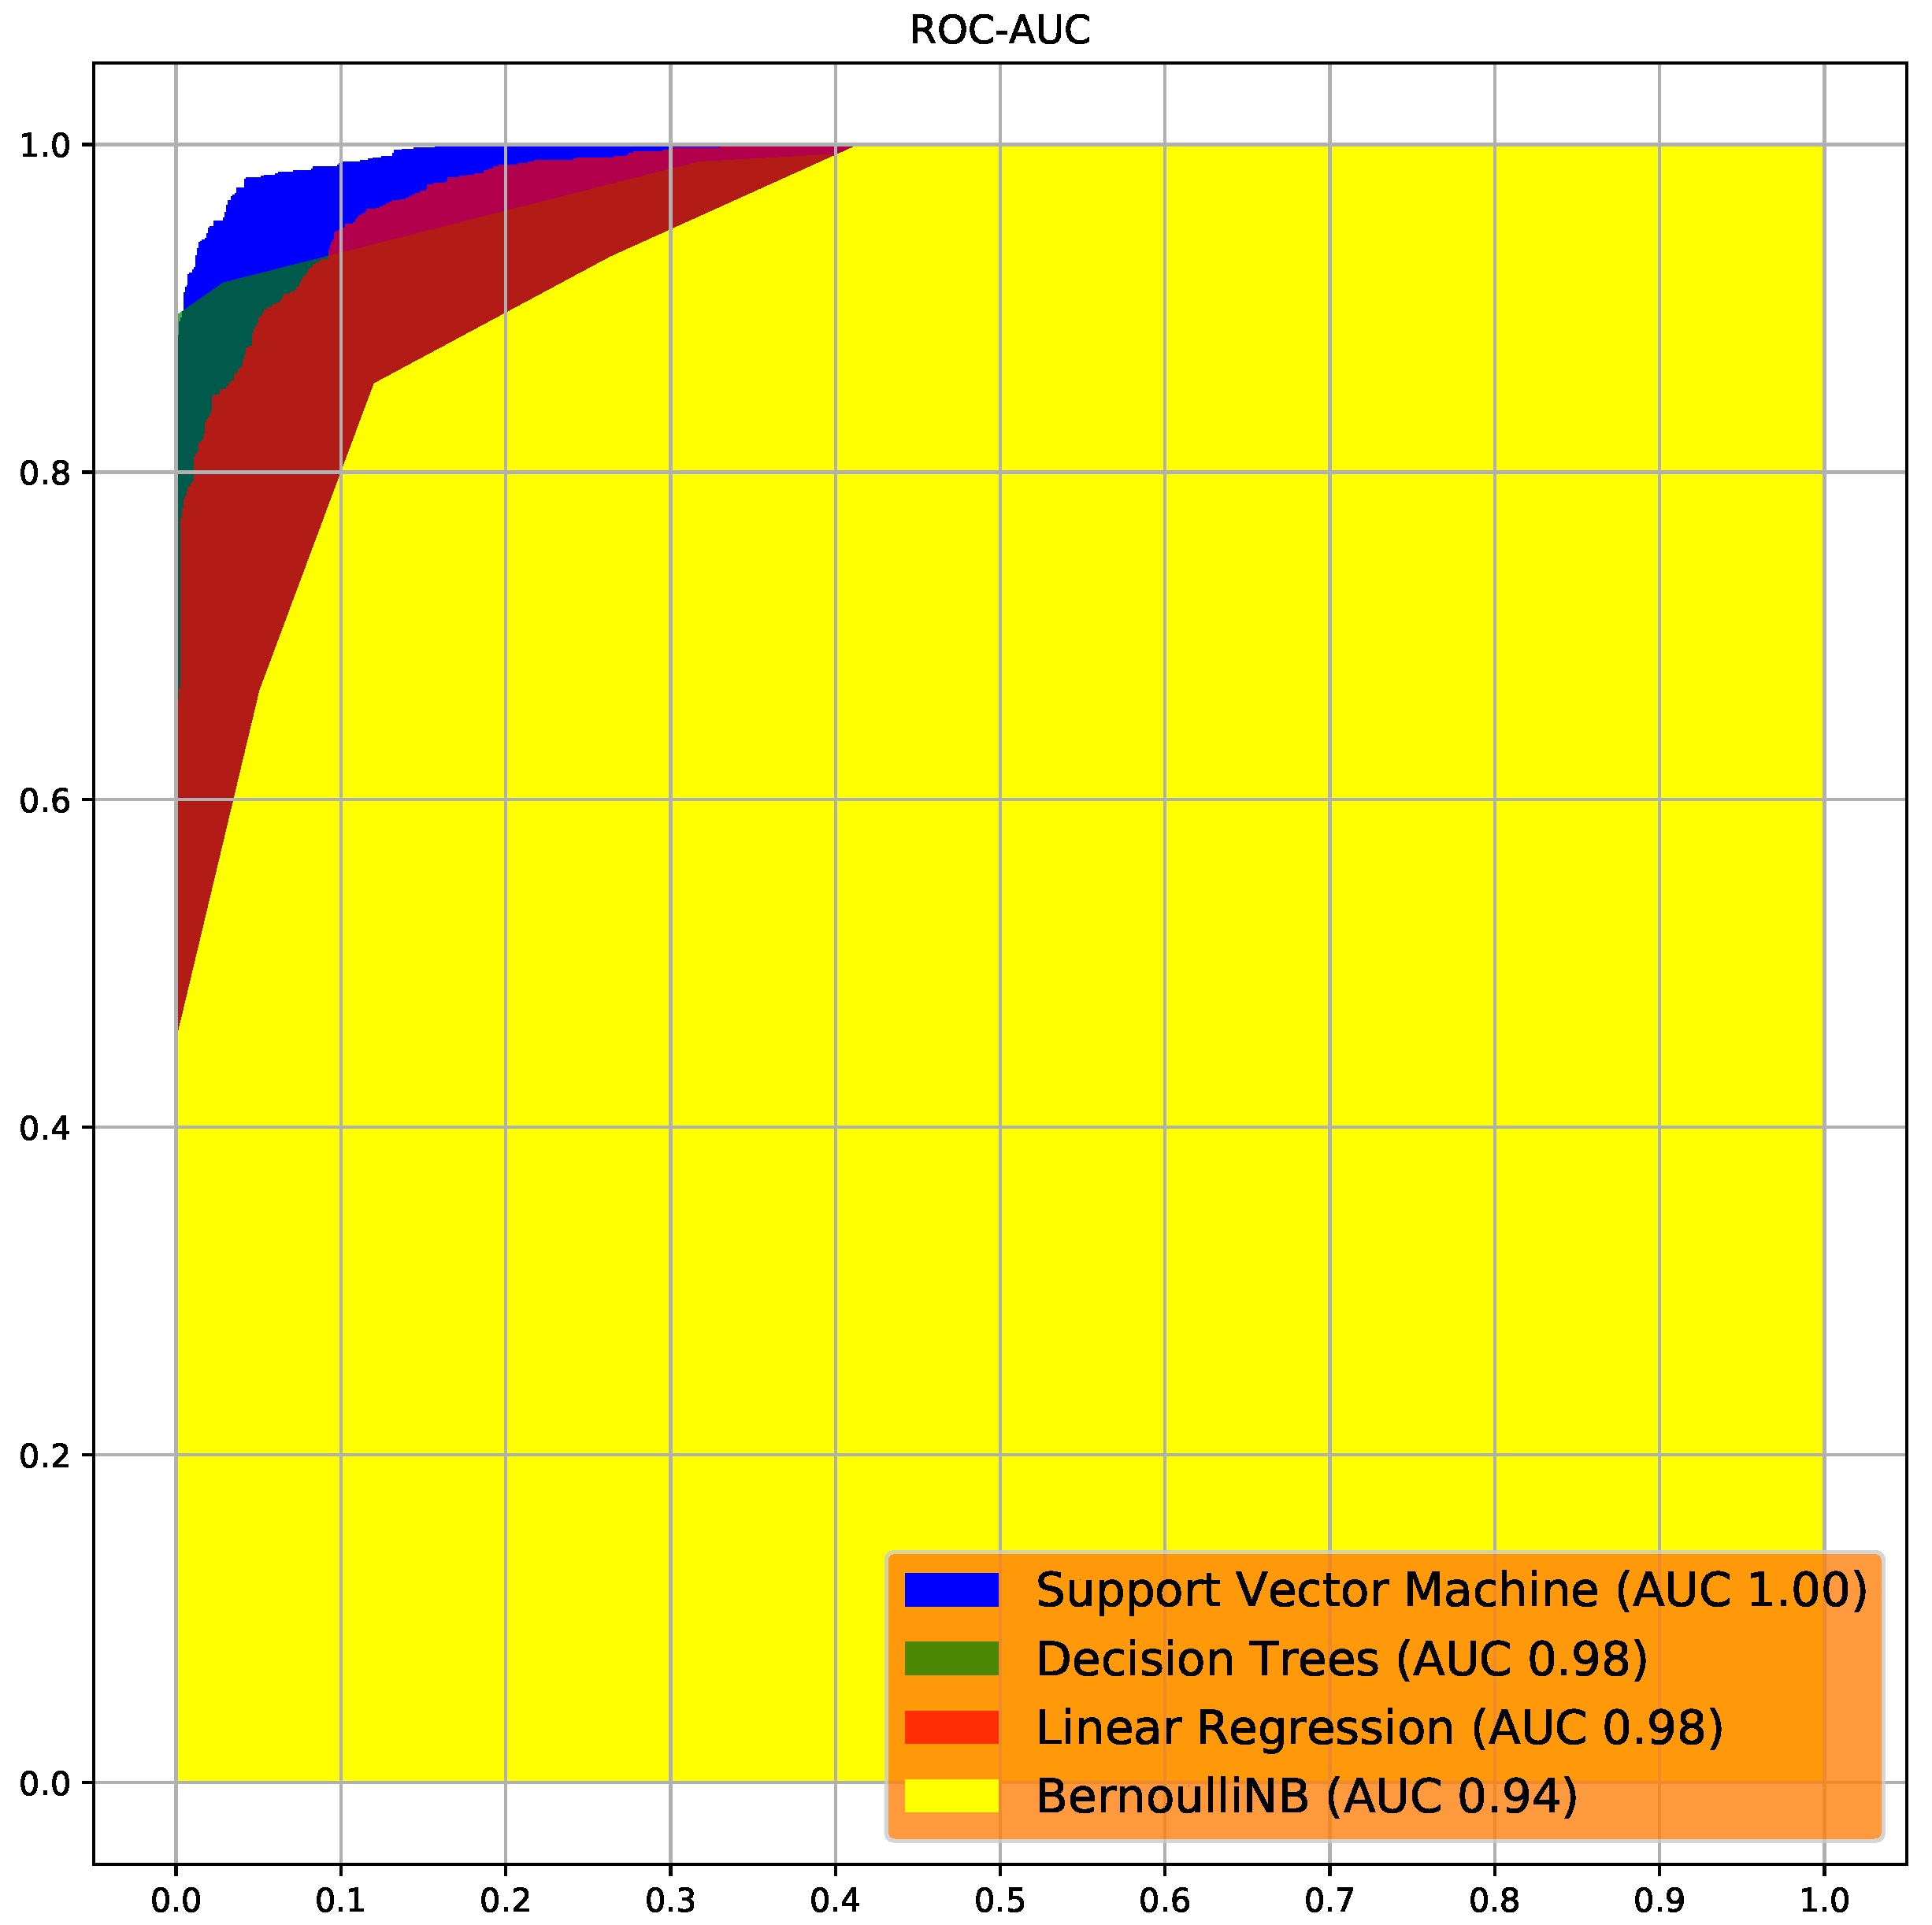
- We employ a machine learning approach to train the sensor-based dataset for COVID-19 prediction. For the same purpose, various algorithms are trained and assessed on a test dataset. The support vector machine (SVM) model is shown to perform the best after extensive examination utilizing the evaluation measures.
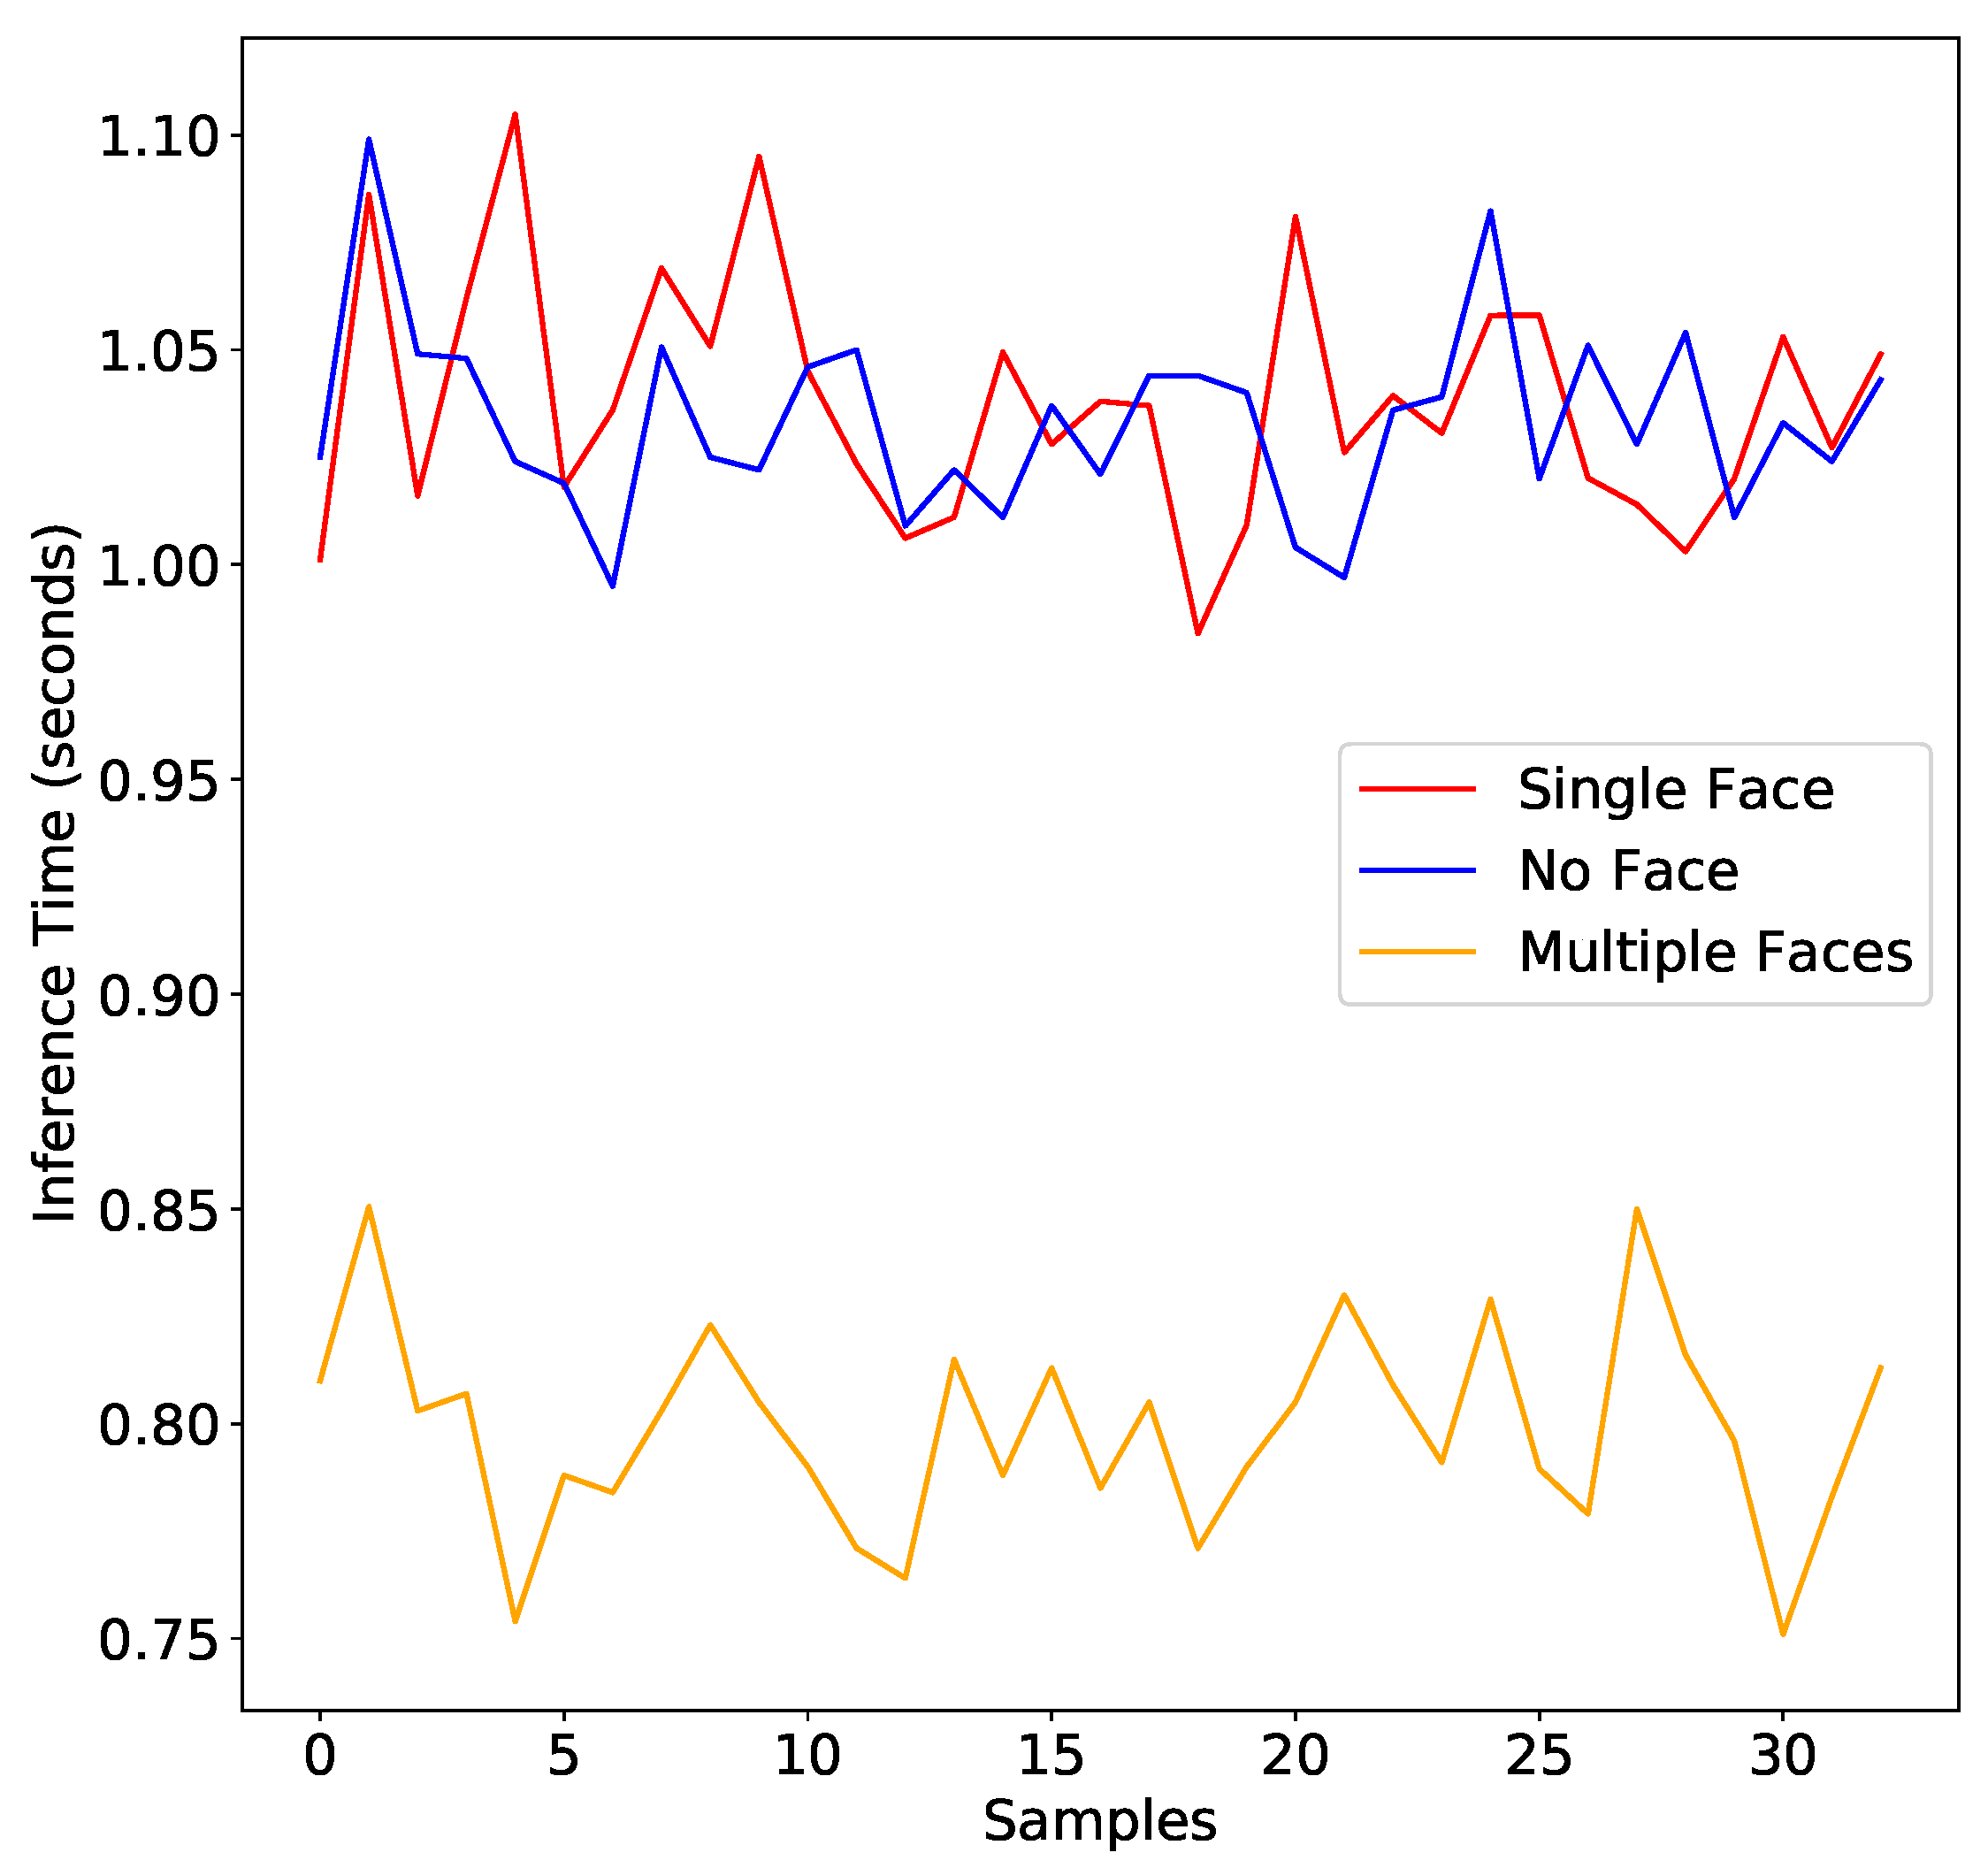
- We deploy a YOLOv5 algorithm over a CCTV video stream for real-time monitoring of positive COVID-19 carriers for speedy reinforcement.
1.3. Organization
The organization of the paper is as follows. Section 2 discusses the system model and the formulation of the problem being discussed. Section 3 describes the proposed solution for the problem statement. Section 4 presents the obtained results for the trained model, and Section 5 concludes the paper and provides insights for future works.
2. System Model and Problem Formulation
The proposed technique for crowdsensing to detect possible COVID-19 carriers in a specific area is discussed in this section. This part also includes a detailed mathematical explanation of the problem to be solved. Various assumptions about the context for which the system is suggested are also explored in greater depth.
2.1. System Model
Figure 1 demonstrates the system model for crowdsensing to detect a probable COVID-19 carrier. It is believed that the setup where the system is planned to be deployed is a closed building or in an environment with well-defined boundaries, such as a company campus, hospital rooms, corridors, and so on, and not in open spaces such as public parks, playgrounds, and so on. It is also expected that all the institutional premises contain functional wearable devices with temperature, pulse rate, and SpO2 sensor. It is also expected that all wearable devices are global positioning system (GPS)-enabled, connected to the cloud, and constantly broadcast the sensor and position data to the main server. As demonstrated in Figure 1, each wearable device transmits sensor data to the cloud. A CCTV camera, which is statically positioned inside the campus area, delivers the video stream to the cloud. The acquired data in the cloud is fed to the AI interface. Sensor data is made available to the trained ML model, which predicts whether that particular user is a potential COVID-19 carrier or not. The nearest CCTV to each potentially positive carrier is discovered, and the object-detection and localization algorithm is applied to the incoming video stream. Potentially positive people can be then advised and medically tested for COVID-19. Moreover, real-time tracking facilitates quicker detection and location of such carriers.
Figure 1.
System model for detecting and localizing potential COVID-19 carrier in crowd using the sensor data transmitted by the wearable device.
2.2. Problem Formulation
The exponential spike in the COVID-19 epidemic raises the requirement for efficient and effective crowd management as the virus spreads through the medium of human contact. In confined private locations, such as a firm campus area where people work and move about, it is of the greatest necessity to detect potential COVID-19 carriers to safeguard the safety of people and that of the potential carriers as well. Faster detection, localization, and reporting of the COVID-19 carriers help limit and prevent the hazards of COVID-19 spread in the campus area. Hence, a wearable-device-based technique is proposed to enable crowdsensing for rapid COVID-19 detection and tracking, which relies on machine learning algorithms applying sensor data from wearable devices to predict COVID-19. The next section provides a thorough description of the proposed framework for the provided problem statement.
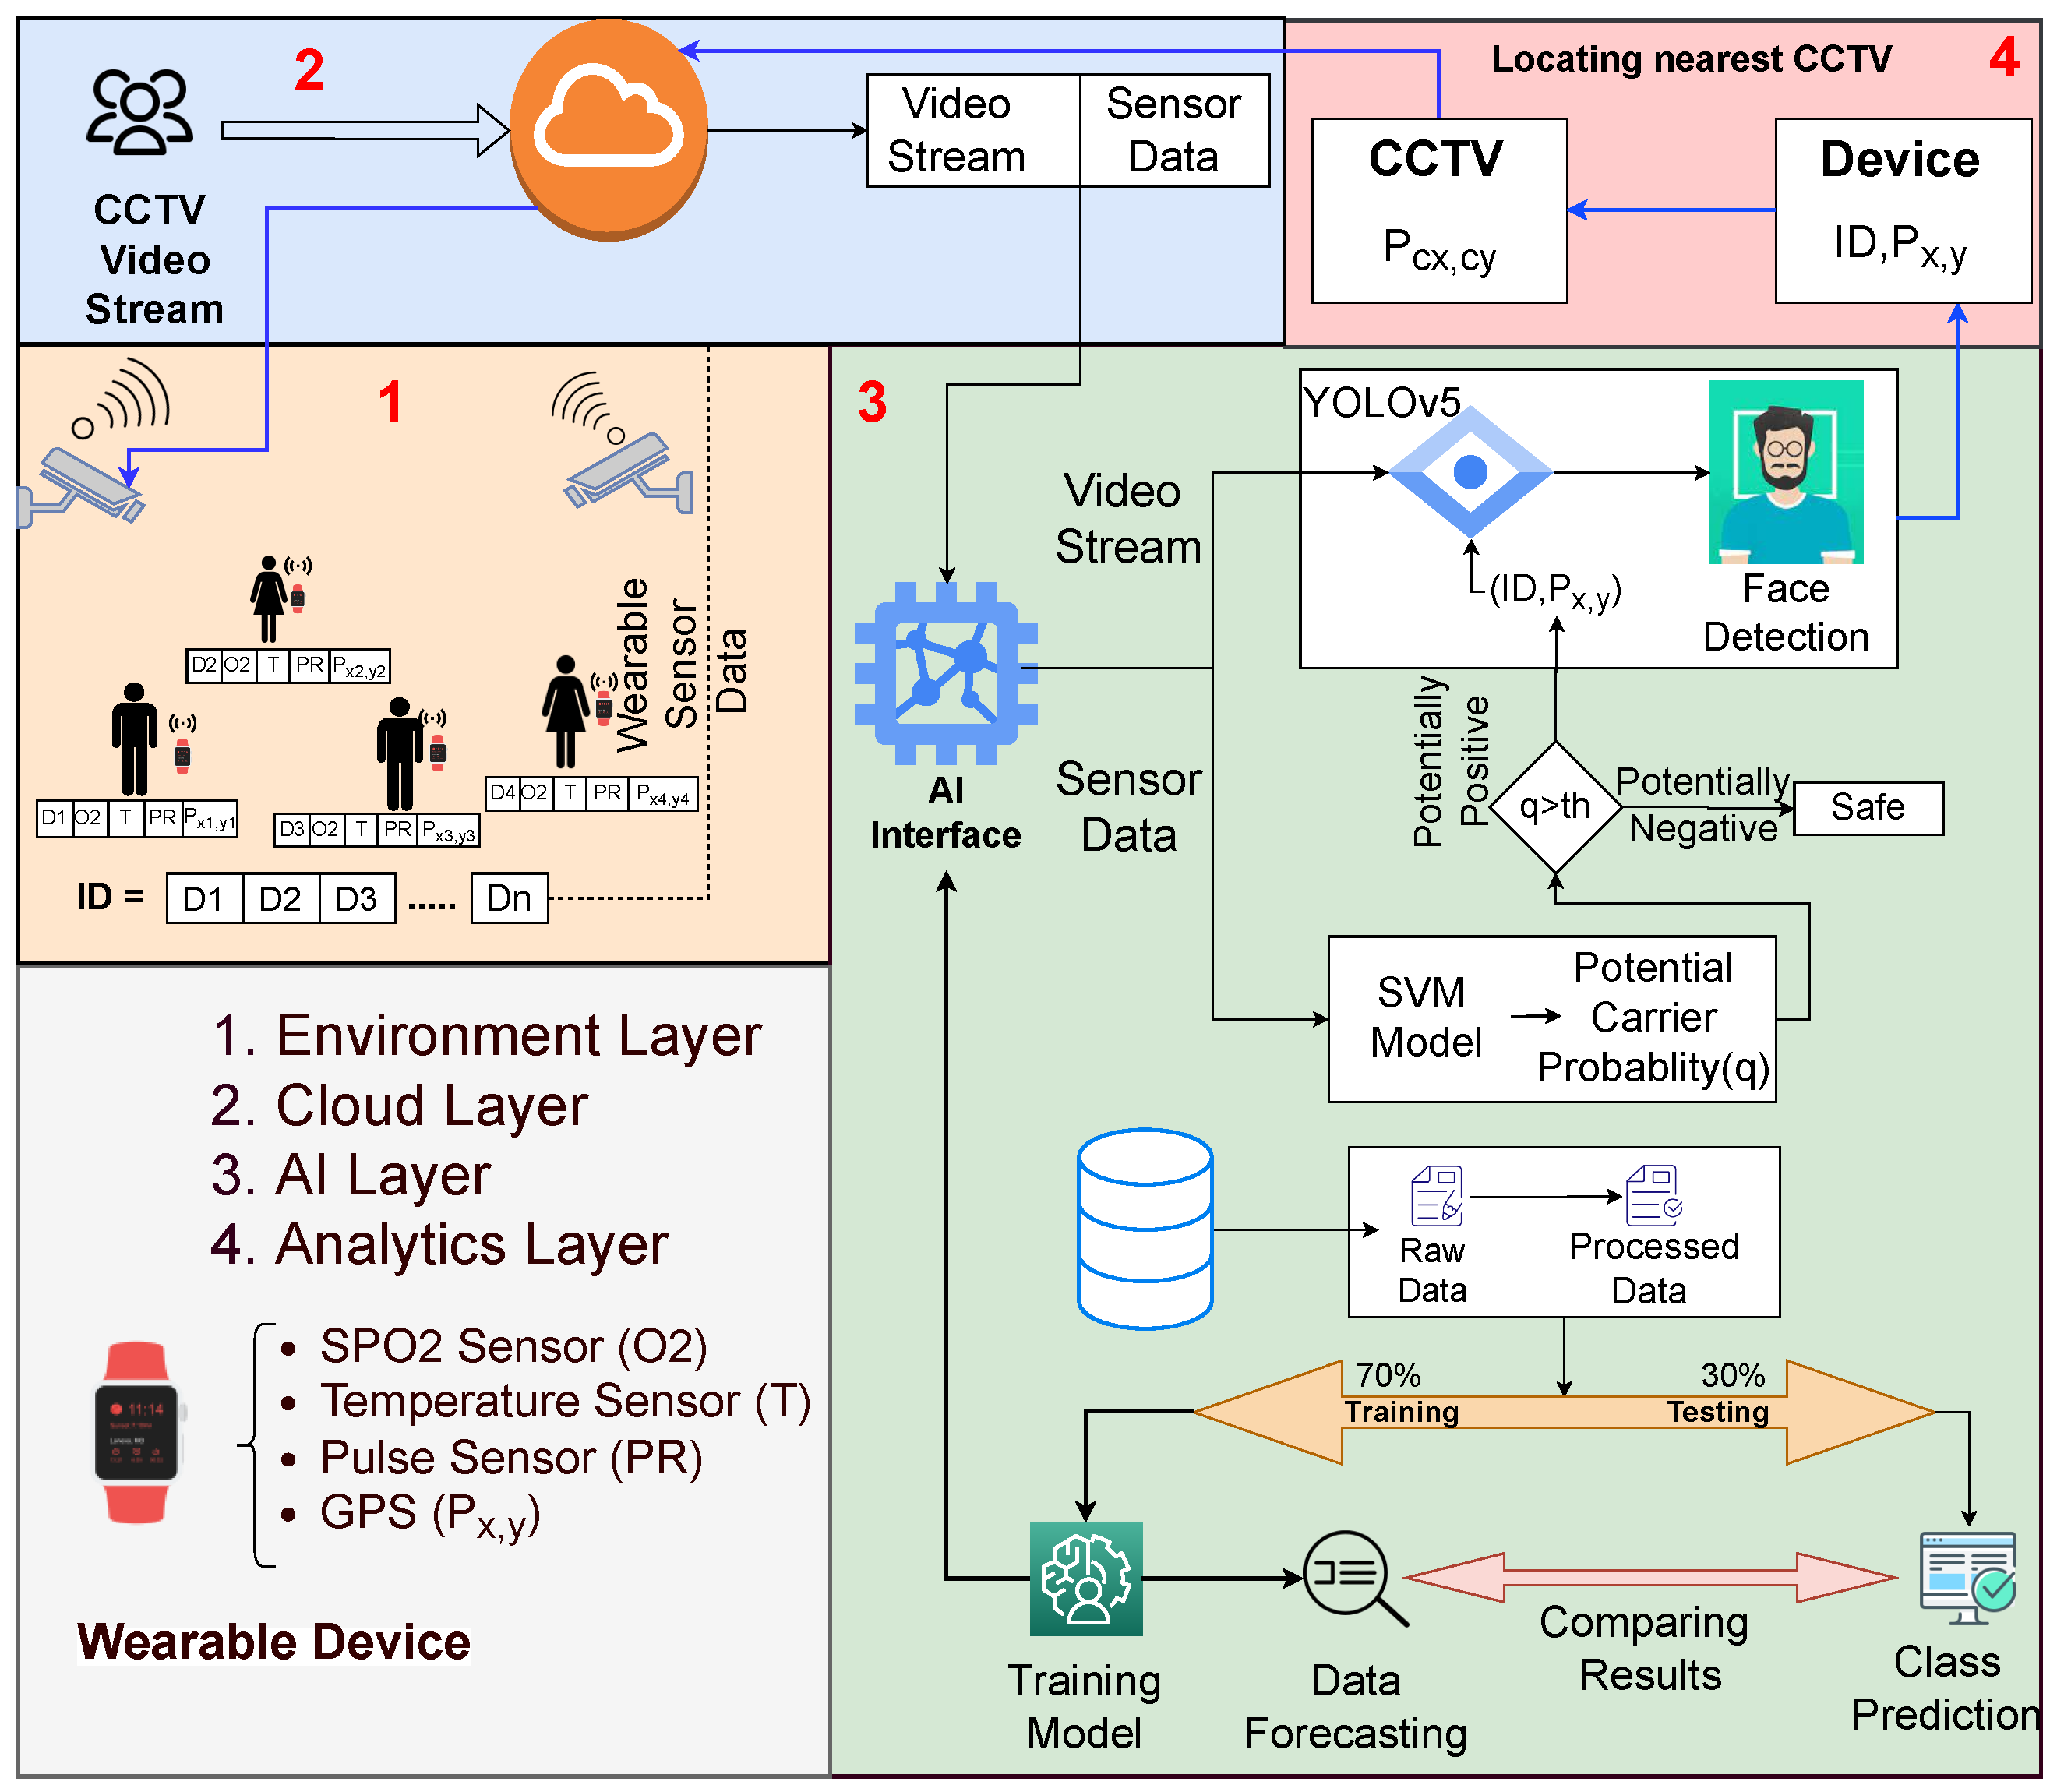
3. The Proposed Framework
Figure 2 demonstrates the proposed framework to achieve the job of real-time COVID-19 carrier prediction using the wearable sensor data combined with real-time tracking of the potentially positive carrier. For better understandability, the Figure 2 is labeled with numbers (1, 2, 3, and 4) to show the sequential flow of the proposed framework. First, the ML algorithm (i.e., SVM) is used to classify the disease by generating a probability value. Further, the object detection technique is employed to locate the potential carrier in the video stream. Then, the proposed architecture is divided into four unique layers: (i) environment layer, (ii) cloud layer, (iii) AI layer, and (iv) analytics layer. Each layer is elaborated as follows.
Figure 2.
Proposed crowdsensing framework for real-time COVID-19 detection and tracking using wearable devices.
3.1. Environment Layer
The environment layer is the high-level layer where actual actors reside and move around in their surroundings. This layer consists of statically installed CCTV cameras that constantly capture and transmit a video feed to the cloud layer. Based on the system model’s assumptions, all the individuals present in the environment possess wearable devices and are connected to the cloud environment. Real-time sensor data combined with position coordinates are transferred to the cloud in real time. To explain it mathematically, let us consider a system with a set W with a n number of wearable devices connected to the cloud. Each wearable device has a unique id (where ), which consists of m sensors (where m = 4).
Here, , = O2 (SPO2 sensor), = T (temperature sensor), = PR (pulse sensor), and = (GPS sensor). Assume an environment with total cameras c, where each camera is placed at the static location with coordinates and transmits a video stream. Hence, depending on the total cameras, is a set of video streams that is transmitted to the cloud. Each = , where f = total frames, h = height, b = width, and = channels.
3.2. Cloud Layer
The cloud layer receives heterogeneous data consisting of sensor data S transmitted by the wearable device and video stream data V transmitted by the CCTV cameras. The data is separately stored and made available to the layer (i.e., the AI interface used) for further prediction and detection.
3.3. AI Layer
The real-time data received at the cloud layer is fed to the AI layer as an input. The segregated input video stream and sensor data are then handed to their respective models for prediction/detection purposes. Sensor data from wearable devices are sent to the trained ML model for COVID-19 prediction. A few algorithms are used for training, out of which the SVM is found to be the best performing model. It has a greater accuracy and lowers the false negative rate, due to which it is considered for prediction in the final pipeline. The other algorithms for experimentation include decision tree, logistic regression, and Bernoulli naive Bayes. These models, along with SVM, are the standard classification algorithms in the ML domain; hence, the need to experiment with them is evident. As the data is not complex in terms of its dimensionality, we stick to only machine learning algorithms and do not apply neural network algorithms to the data. Moreover, deep learning models are generally larger in size and have high inference time. The dataset used in the paper is also not significant. Using deep learning models for them would yield overfitting, which would also affect the model performance. Consider an SVM model , for which
where is the linear classifier function, and w and b are the unknowns and can be determined by training the dataset. The training involves minimizing the loss function J.
where is the target column for the training example. The kernel trick can be applied to map the input vector to higher-dimensional non-linear mappings.
The minimization expression with kernel trick can be rewritten as
With this, a trained SVM model can be used for predictions [21,22,23] as shown in Algorithm 1. For each wearable device with unique id , sensor data is passed to trained SVM model to obtain prediction probability q.
| Algorithm 1 AI layer algorithmic flow for carrier detection. |
Input: SensorData S, VideoStream V Output: BoundingBox B
|
If , where = 0.5 represents the threshold value, it implies that the model predicts the input to be potentially COVID-19 positive. This threshold value is decided based on an ROC curve by plotting the true positive rate (TPR) vs the false positive rate (FPR) value and finding the optimal point with the optimal threshold value. It is important to note here that this threshold value depends on the distribution of the dataset used for training. This distribution may change with the increase in the number of data instances. Change in statistical semantics in data is called data drift and can occur over a long period of time. To tackle this, the model has to be retrained regularly, and therefore new threshold values have to be decided as well to ensure efficient model performance. The YOLOv5 person detection algorithm can be applied to the video stream. The video stream for camera can be passed to YOLOv5 model function for object detection, which returns rectangular bounding box with vertices and , through which the potential carrier can be identified and tracked through video footage. The YOLOv5 pipeline that is applied on input steam contains a trained neural network N. This neural network is trained to output the prediction vector given by P.
where is the probability of classification. The probability of the face being detected in the input image can be analyzed using , , , and , which represent the coordinates of bounding boxes. Moreover, the k represents a single frame from the video stream (i.e., ). As a result, the bounding boxes are obtained around the detected face in the input stream. However, the problem persists if multiple bounding boxes for a single face id are obtained. This problem is countered in YOLO by applying non-max suppression [24]. The objective of non-max suppression can be understood as below.
where t refers to a single prediction vector obtained from as output from the YOLO algorithm; and are regions that are functions of bounding box coordinates (); and refers to a prediction vector with a maximum probability value. The final bounding boxes obtained describe the identified and localized faces of the potential carriers in the video input stream.
3.4. Analytics Layer
The analytics layer gets activated by the AI layer depending on whether or not any potentially positive carrier is detected. If detected, GPS sensor data for wearable device is transmitted to the cloud. Furthermore, the nearest CCTV camera gets activated for live tracking such that
The above expression returns the real-time coordinates of the nearest CCTV camera to a certain wearable device. The video stream gets recorded on the CCTV camera on which the YOLOv5 algorithm is executed. Therefore, it can be considered that all the layers are synchronized and operate seamlessly with each other.
4. Results and Discussion
In this section, the results of ML models implemented to predict the potential of a person being COVID-19 positive based on multiple parameters recorded by the wearable device are presented, along with an analysis of the models implemented. Furthermore, the details of the dataset used for training are also discussed.
4.1. Dataset Description
According to the proposed solution, it can be predicted whether or not a person is potentially COVID-19 positive by getting the data from the wearable device worn by the person. For the training of the model for COVID-19 prediction, we have used a COVID-19 dataset containing the instantaneous readings of a person [25]. The data comprises vital values such as oxygen level, pulse rate, and temperature with a label indicating if a person with a given id is potentially positive or negative [25]. This dataset comprises the records of 7392 distinct individuals, with 3719 labeled positive and 3673 labeled negative. The attributes of the dataset are explained in Table 2.
Table 2.
Features of the dataset.
4.2. Model Training
This section describes the training configuration of all four algorithms experimented with in the paper. The four ML algorithms trained on the dataset are logistic regression, SVM, decision trees, and Bernoulli naive Bayes. The dataset used contained 3719 positively labeled and 3673 negatively labeled classes. Hence, the dataset can be considered balanced, with a total of 7392 entries. The train-to-test split ratio is taken as 4:1, which is 80% in the training set and 20% in the testing set. External and trusted Python libraries, including SciKit-Learn, are used for the training on the dataset. The hyperparameter settings of the algorithms are as follows. These hyperparameters are the default hyperparameters of the algorithm.
- Logistic regression: penalty = L2, solver = LBFGS
- SVM: Kernel = rbf, polynomial degree = 3
- Decision tree: criterion = gini, minimum sample split = 2
- Bernouli naive Bayes: alpha = 1
4.3. Evaluation Metric
Once the training of models is concluded, it is necessary to evaluate their prediction performance by their scores and accuracy, depending on several performance metrics. These metrics are used to determine the model performance on the test data. We provide a classification report that displays the F1-score, receiver operating characteristic—area under the curve (ROC-AUC) values, precision, and recall. These measurements are obtained from the confusion matrix, which compares the actual and anticipated classes. A detailed description of the metrics and their findings is provided as follows.
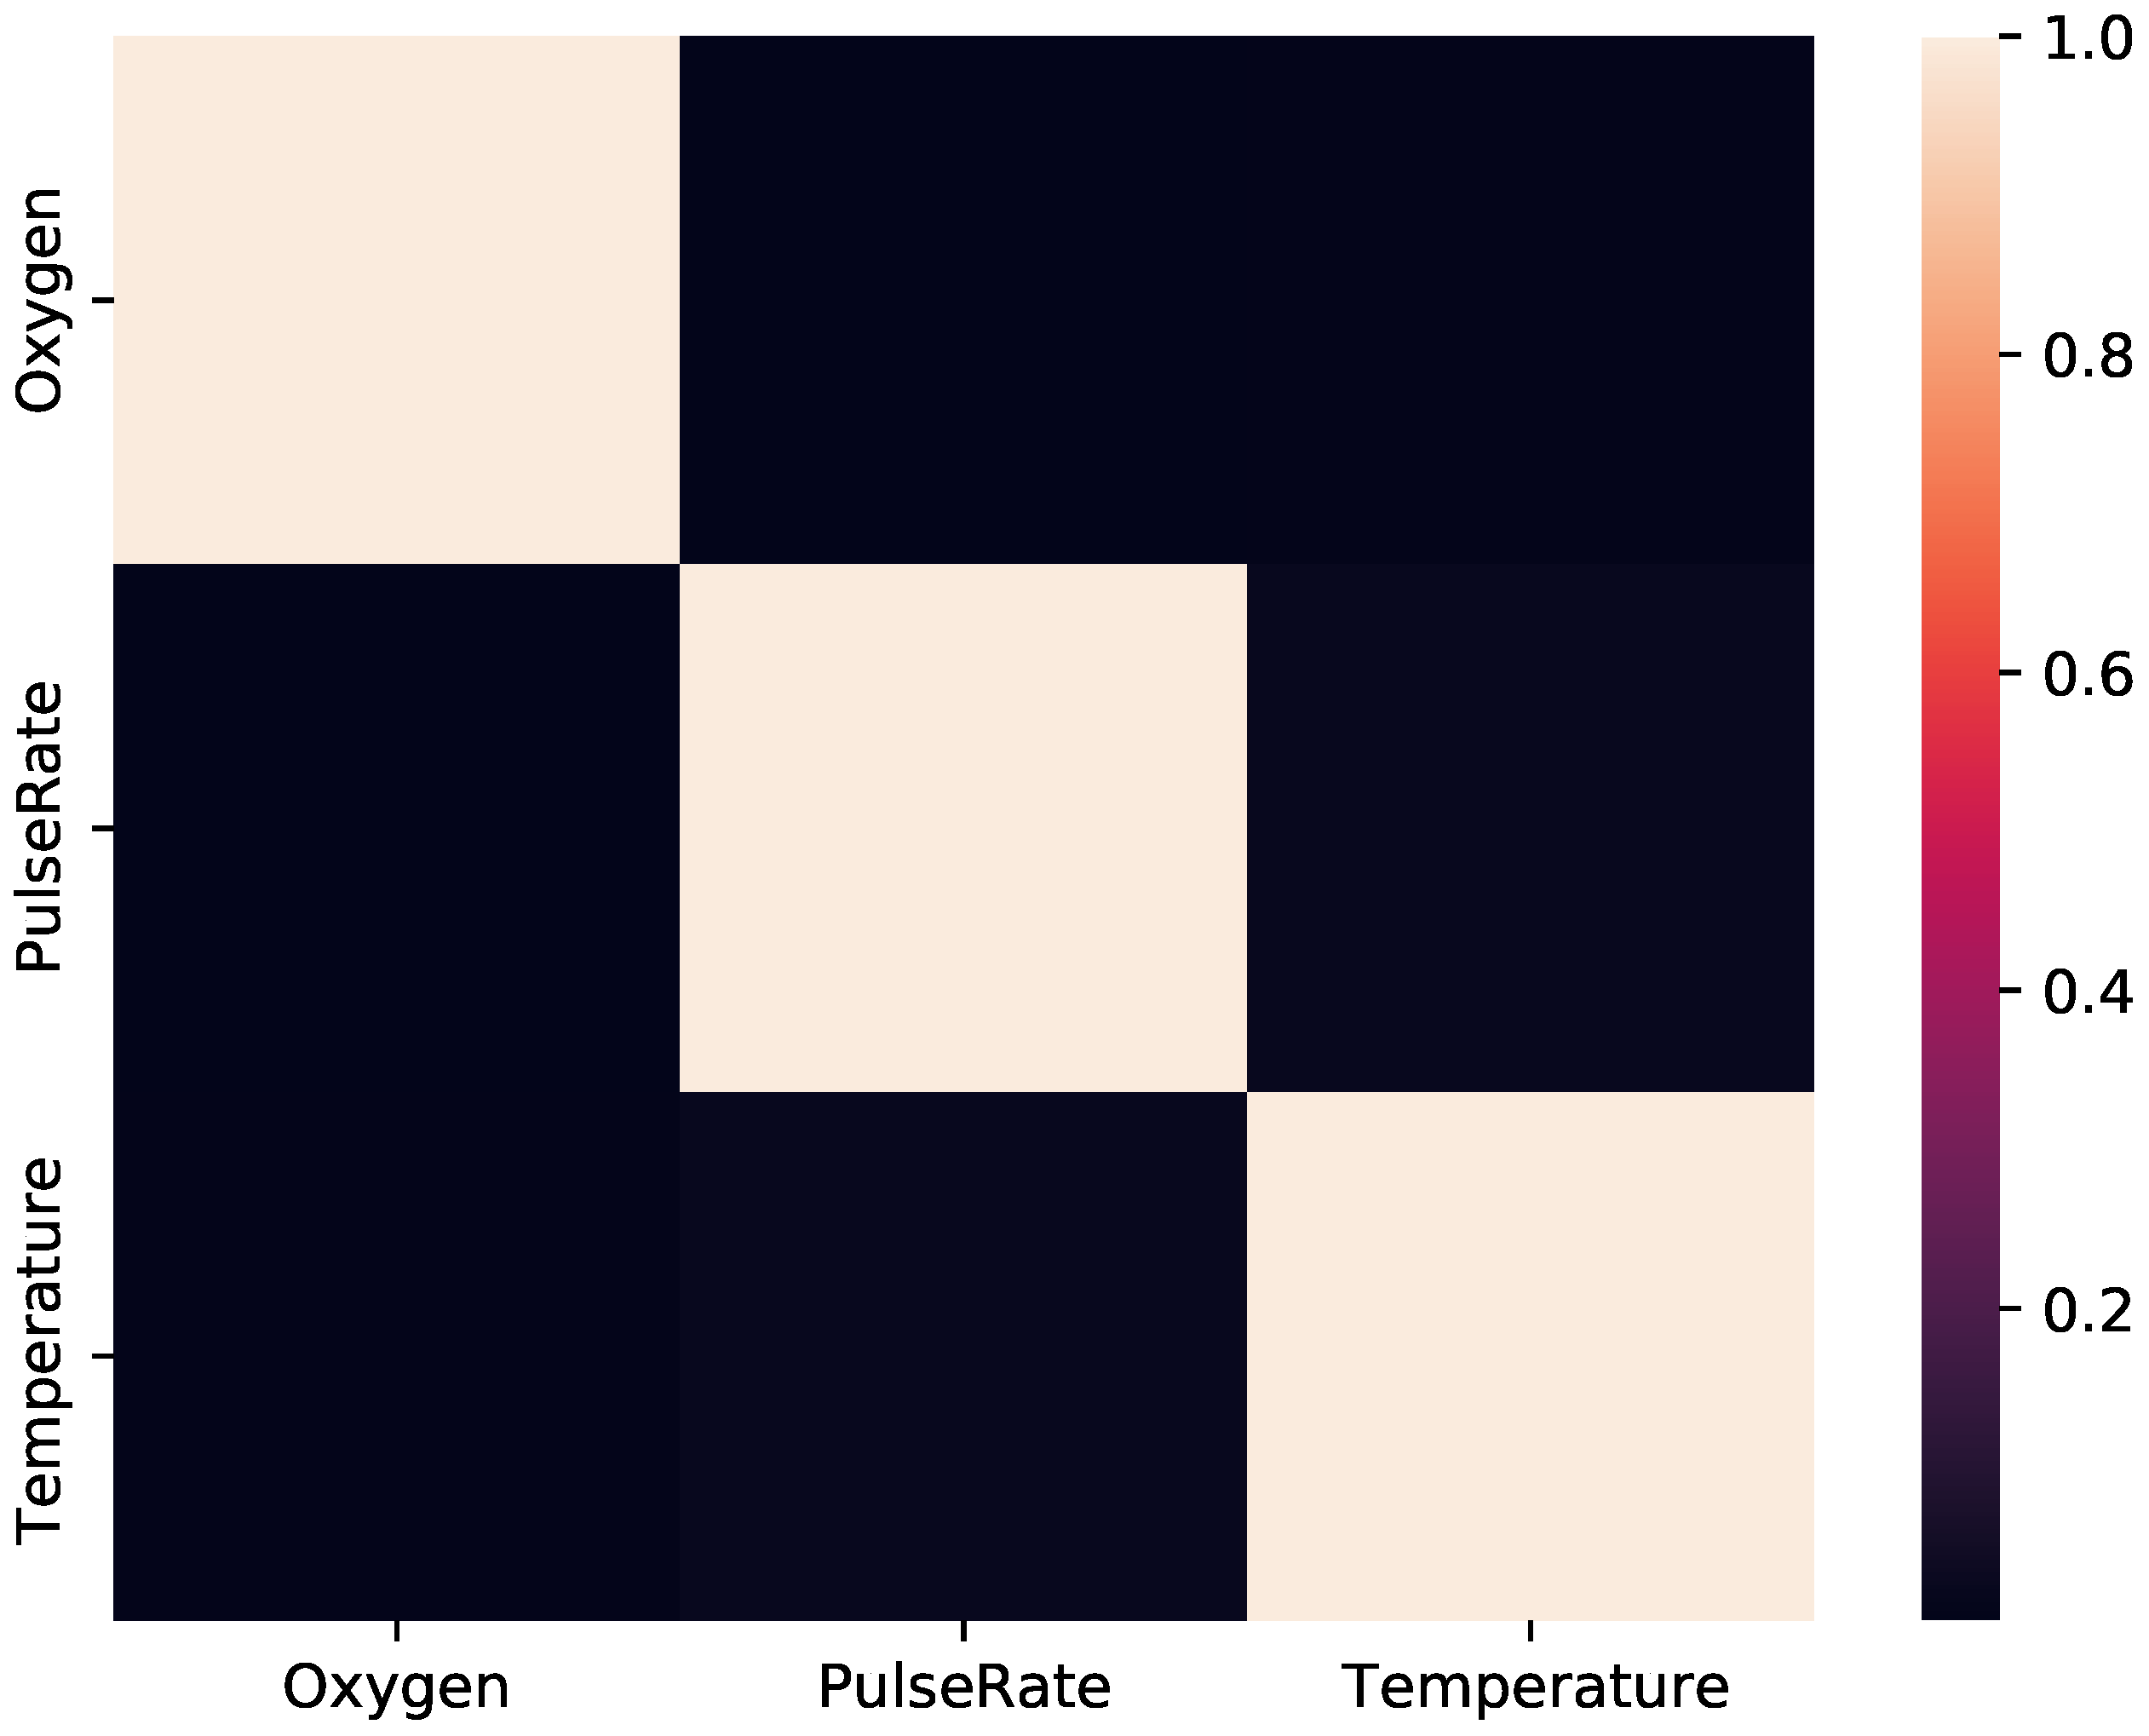
- Confusion Matrix: A confusion matrix is a tabular representation summarizing the performance of a classification algorithm [26]. It is an matrix, where N represents the number of classes to be predicted, showing the actual and predicted classes.
- Precision: Precision is defined as the number of (true positives) over total true values predicted [26].
- Recall: This is defined as the ratio of the number of and total potential true values [26].
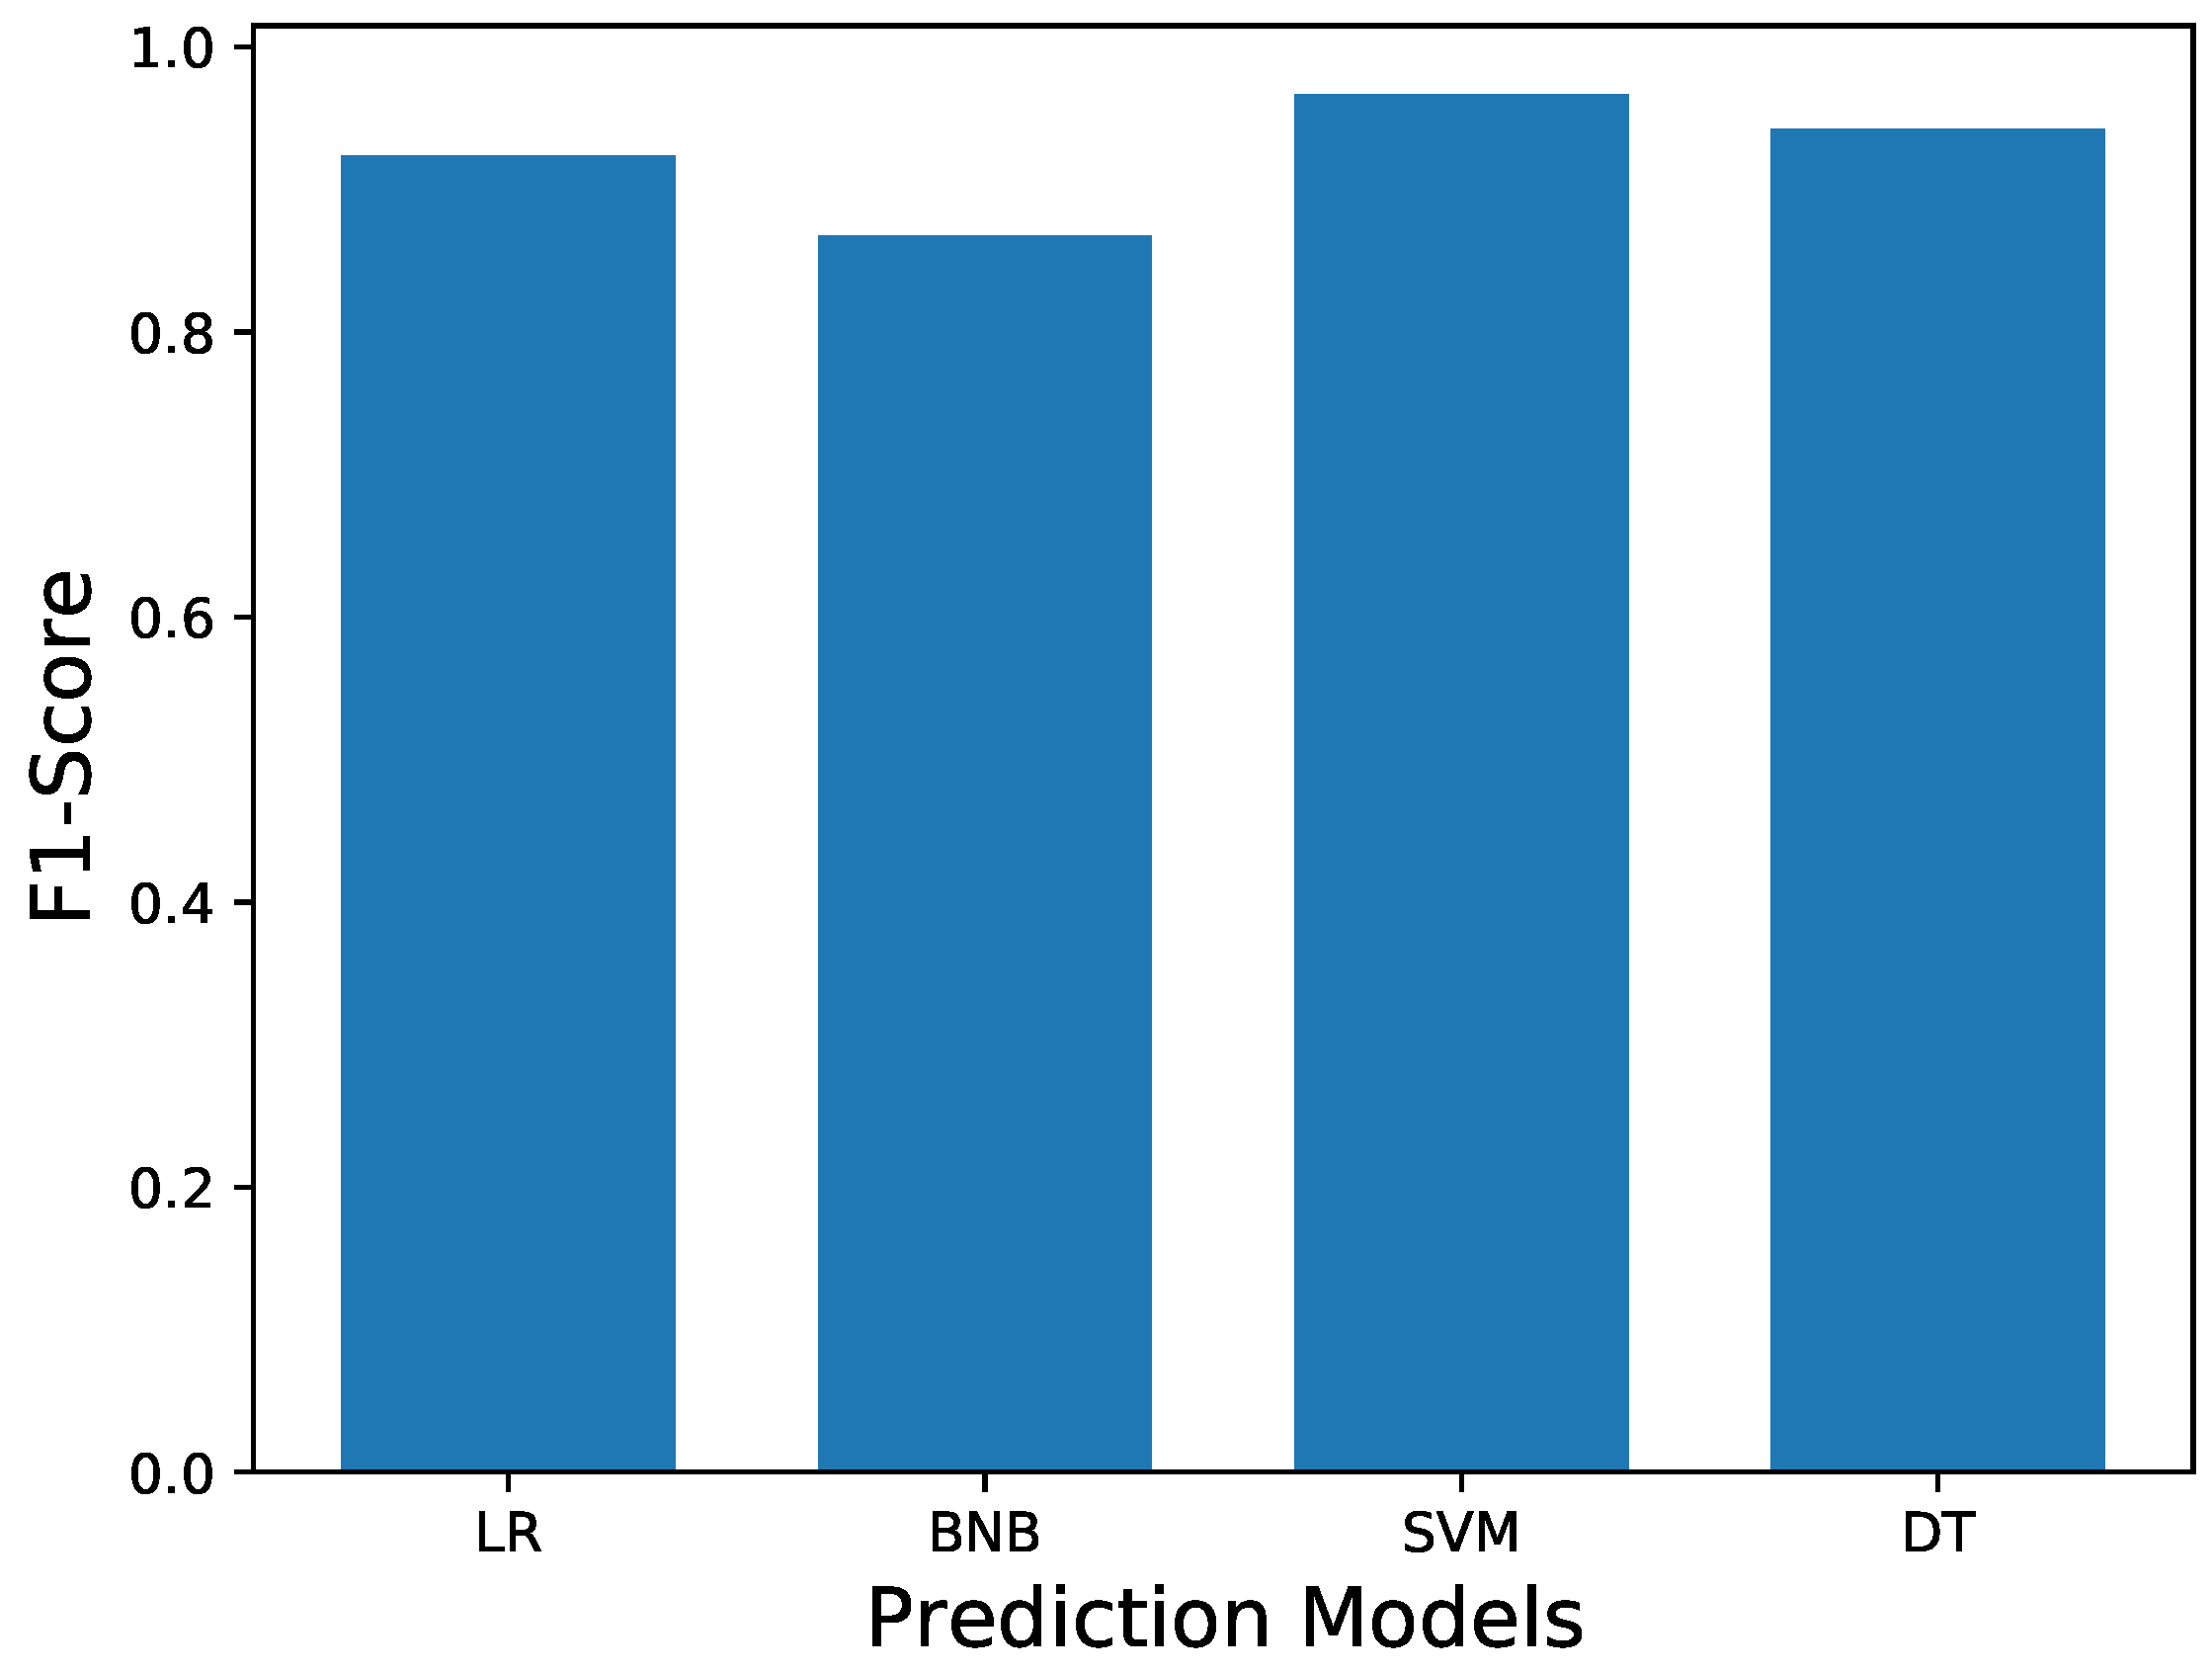
- F1-Score: This is defined as the harmonic mean of precision and recall values in a classification problem [26]. It gives the combined information of precision and recall, which helps in comparing two different models with distinct precision and recall values.
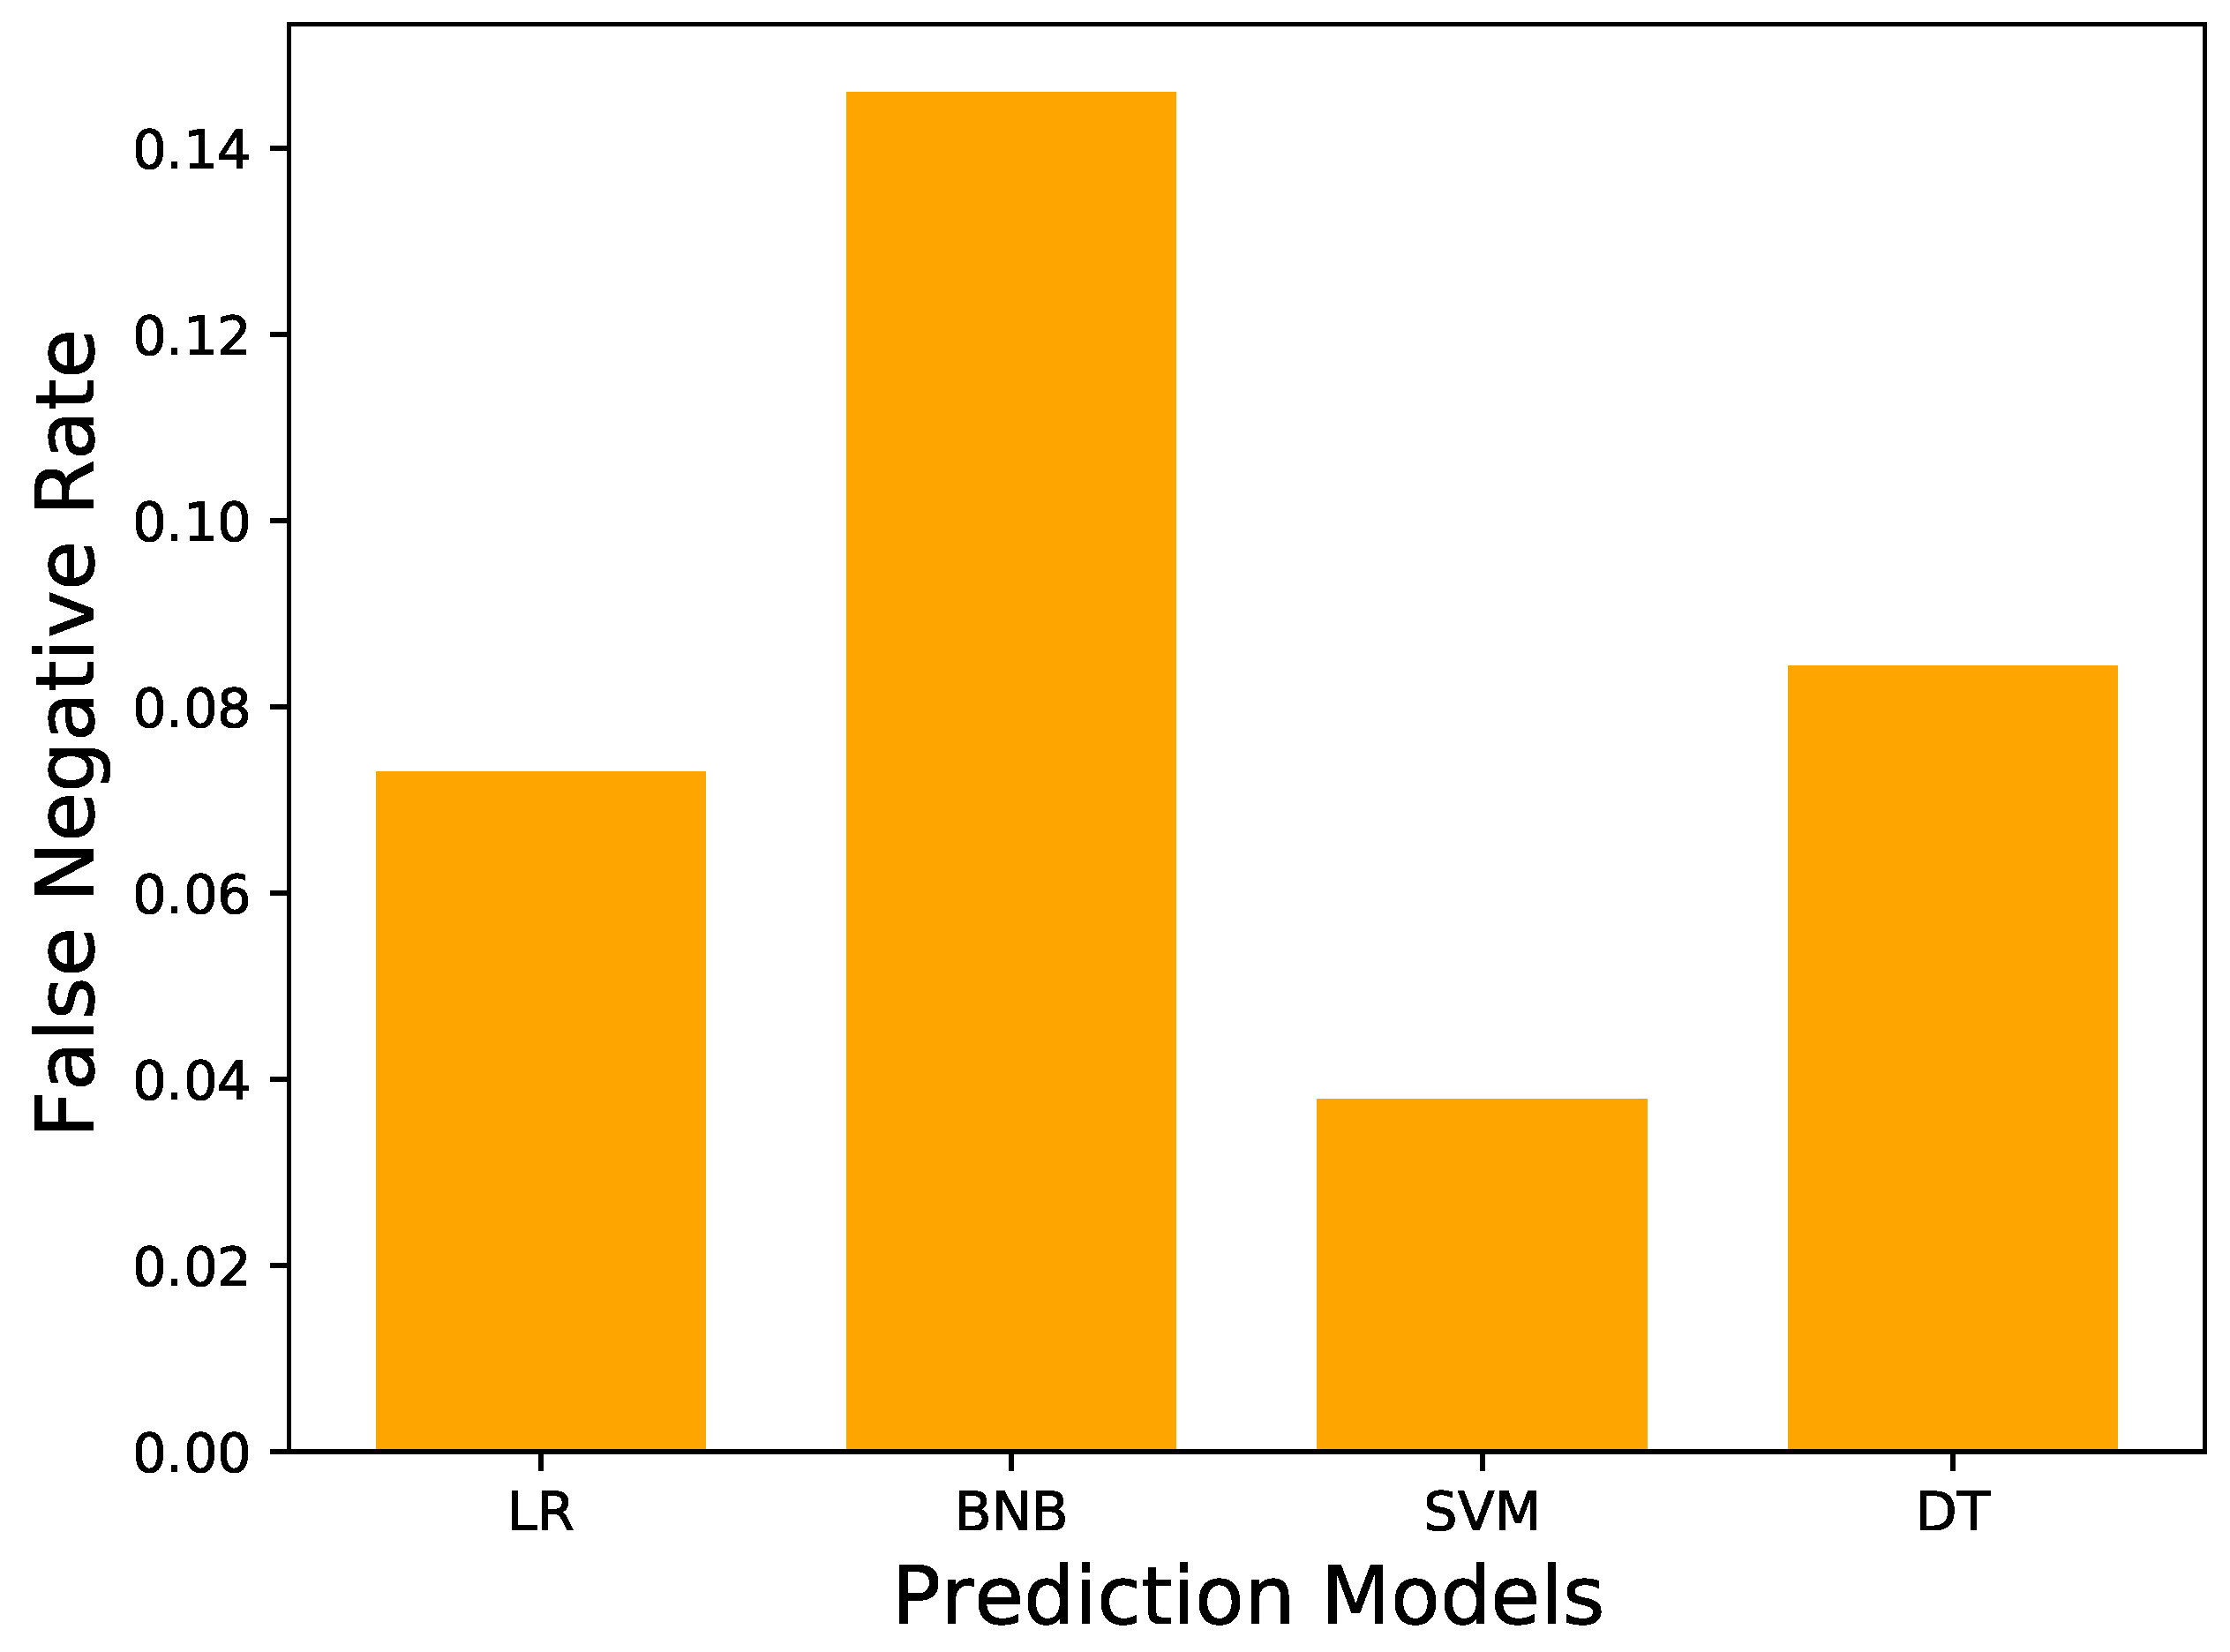
- False Negative Rate (FNR): This is defined as the ratio of the number of (false negatives) and the sum of and . The proportion specifies the number of patients predicted to be negative that are actually positive. For the purpose discussed in the paper, a lower false-negative rate is better suited for the application.
Four different ML algorithms were trained for the classification task to detect potential COVID-19 carriers based on the sensor data. As the target classes are not overlapping, SVM surpassed the other models by giving considerably better training and testing results.
As explained above, the F1 score is a major key evaluation metric as it provides the combined precision and recall outcomes. In many circumstances, it becomes challenging to find an acceptable model to train the dataset purely based on precision, as there is always a chance that the model might overfit the data. Hence, the precision and recall values interpretation is made in the form of F1-scores. Figure 3 displays a quantitative comparison of F1-scores of the proposed models. It can be observed that SVM provides the best F1-score compared to the other ML algorithms.
Figure 3.
F1-scores of the proposed ML algorithms for the potential COVID-19 carrier detection. LR refers to linear regression, BNB refers to Bernoulli naive Bayes, SVM refers to support vector machines, and DT refers to decision trees.
As stated previously, a false negative rate (FNR) is considered a significant indicator for the system as it corroborates the validity of the suggested system. Figure 4 displays the quantitative comparison of the FNRs of the offered models. It is recognized that the lower the FNR, the better the proposed model. In Figure 4, SVM has the lowest false-negative rate and corresponds with the best F1-score as compared to other models. This is an important observation as it demonstrates that the probability of a patient being positive but recorded as negative is smaller, and this will subsequently avoid the transmission of the virus.
Figure 4.
False negative rates (FNR) of the proposed ML algorithms for the potential COVID-19 carrier detection.
4.4. ROC-AUC Curve
The ROC curve displays a classifier’s performance for different possible probability thresholds. This curve is plotted for the true positive rate (TPR) vs false positive rate (FPR). The area under the ROC curve is measured and calculated as an AUC score, which is an essential judging parameter in model selection. A higher AUC denotes that the model better predicts the target classes. In Figure 5, it can be seen that SVM has the highest AUC value, which implies that it is the best performing model compared to the others in terms of incorrectly detecting potential COVID-19 carriers. The decision trees and linear regression models have also performed well, and they differ from the SVM by a tiny margin.
Figure 5.
ROC-AUC curve for the proposed algorithms. SVM has the highest AUC value, whereas decision trees and linear regression have equal AUC values.
SVMs are trained by solving a constrained quadratic optimization problem, which implies that there exists a unique optimal solution for each choice of the SVM parameters [27]. In the past, SVM has been successfully used in medical diagnosis, and it is therefore considered an ideal solution to our problem statement.
In Figure 6, the heatmap reveals that there are much fewer incorrect values, and thus the FNR is smaller. As the values of false positives and false negatives are lower, it boosts precision and recall values. This leads to effective crowd screening and quick detection of probable COVID-19 carriers. Table 3 presents the classification report of SVM on the dataset describing the evaluation metrics for the class labels 0 (negative) and 1 (positive).
Figure 6.
Confusion matrix for SVM.
Table 3.
Classification report of SVM on the test dataset.
YOLOv5 is the latest and most cutting-edge version of the YOLO real-time object detection technology. It recognizes objects by dividing input images into the SXS grid system. In Figure 7, the inference time relation is illustrated for the various samples on which the YOLOv5 algorithm was implemented. Further, the Inference time defines the amount of time taken to apply the trained neural network model to the test data. It is vital to apprehend the time taken as in the graph given; it can be shown that a higher amount of time is taken by the model to detect a face in a series of frames with a single face or no face in comparison to the samples with numerous faces. The reason behind this is that the system recognizes multiple faces in a single forward propagation/pass and does not require much time to screen the complete frame for predicting them. On the other hand, the samples not containing faces take more inference time as the algorithm repeatedly checks for faces to predict and draw bounding boxes.
Figure 7.
Inference time relation with samples on which YOLOv5 algorithm has been implemented.
Furthermore, to see and comprehend the link between multiple aspects in a huge dataset, a correlation matrix is produced where the values of coefficients span from −1 to 1. It is typically utilized in feature selection when multi-dimensional data is included in the dataset. Figure 8 presents the correlation matrix, which illustrates the correlation coefficients of the three attributes of the dataset. By monitoring the values of coefficients between the characteristics (i.e., less than 0.2, which is almost tending to zero), it can be determined that the features are independent of each other. Therefore, there is no connection between these properties, which is advantageous for the prediction.
Figure 8.
Correlation matrix for the parameters of the dataset.
Table 4 provides the mean inference time in seconds for 10-fold cross-validation on the test dataset for the different ML classifiers. It can be observed that the highest score is for the SVM model (i.e., 0.152), which is a good indication of its performance on the data compared to the other models, whose values almost tend to be 0.
Table 4.
Mean inference time for 10 fold cross-validation on the test dataset.
5. Conclusions and Discussions
This research presents a deployable crowdsensing strategy based on wearable sensor data to detect and localize probable COVID-19 carriers in a specific environment. Various ML models are trained on an existing wearable sensors dataset, and their performances are compared shown in Figure 5. We concluded that the SVM classifier performed best in predicting the probable COVID-19 carriers based on the input data. On implementing SVM, we achieved an F1-score of 96.64% and an accuracy score of 96.57%. In addition, the inference time for 10-fold cross-validation on the test dataset has been evaluated for the chosen ML classifiers. It is found that SVM has the highest mean inference time, 0.1521 s, which has been proven beneficial in selecting the best ML model for integration with the proposed framework. Further, the YOLOv5 object detection algorithm is integrated with the input video stream to localize and track potential carriers visually. Figure 7 corroborates the usage of the YOLOv5 algorithm as it does not require much time to predict multiple faces in a series of frames fed into the system.
In the future, we will make the system highly efficient and robust by improving the dataset. The competition dataset used in the paper is static and limited in size. As the proposed system aims to be deployed in a real-life scenario, real-time data instances must be included. Hence, the proposed system can be regularly retrained to increase the accuracy of the outcome. The proposed framework also leverages GPS signals to locate the potential carrier. However, there is a possibility of a loss of GPS signals, weak GPS signals, errors in transmissions of the positions, and so on. There is also a possibility that the transmission channel gets compromised by hackers, who may then send fake locations instead of the actual position data. Currently, we are not focusing on addressing these security issues, but rather entirely focused on making the crowdsensing framework intelligent. In future works, we will integrate a blockchain network with the proposed crowdsensing framework to achieve the framework’s security and privacy.
Author Contributions
Conceptualization: R.G., A.M.S., H.M. and S.T.; writing—original draft preparation: H.M., F.A., R.G., P.P. and N.K.J.; methodology: S.T., A.M.S., B.-C.N. and G.G.; writing—review and editing: S.T., B.-C.N., F.A. and G.G.; investigation: R.G., S.T. and N.K.J.; supervision: S.T., F.A., B.-C.N., R.G. and G.G.; visualization: S.T., F.A., A.M.S. and N.K.J.; software: N.K.J., P.P., H.M. and R.G. All authors have read and agreed to the published version of the manuscript.
Funding
This work was funded by the Researchers Supporting Project No. RSP2022R509, King Saud University, Riyadh, Saudi Arabia.
Institutional Review Board Statement
Not applicable.
Informed Consent Statement
Not applicable.
Data Availability Statement
No data is associated with this research work.
Acknowledgments
The authors would like to extend their gratitude to King Saud University for funding this research through Researchers Supporting Project No. (RSP2022R509) King Saud University, Riyadh, Saudi Arabia and the authors are thankful to the Gheorghe Asachi Technical University of Iasi for their valuable support.
Conflicts of Interest
The authors declare no conflict of interest.
References
- World Health Organization (WHO). Available online: https://covid19.who.int/region/searo/country/in (accessed on 3 January 2020).
- Holshue, M.L.; DeBolt, C.; Lindquist, S.; Lofy, K.H.; Wiesman, J.; Bruce, H.; Spitters, C.; Ericson, K.; Wilkerson, S.; Tural, A.; et al. First case of 2019 novel coronavirus in the United States. N. Engl. J. Med. 2020, 382, 929–936. [Google Scholar] [CrossRef] [PubMed]
- Gupta, R.; Kumari, A.; Tanwar, S.; Kumar, N. Blockchain-Envisioned Softwarized Multi-Swarming UAVs to Tackle COVID-I9 Situations. IEEE Netw. 2021, 35, 160–167. [Google Scholar] [CrossRef]
- World Health Organization (WHO). Available online: https://www.who.int/news-room/questions-and-answers/item/coronavirus-disease-covid-19-how-is-it-transmitted (accessed on 23 December 2021).
- Mistry, C.; Thakker, U.; Gupta, R.; Obaidat, M.S.; Tanwar, S.; Kumar, N.; Rodrigues, J.J.P.C. MedBlock: An AI-enabled and Blockchain-driven Medical Healthcare System for COVID-19. In Proceedings of the ICC 2021, IEEE International Conference on Communications, Montreal, QC, Canada, 14–23 June 2021; pp. 1–6. [Google Scholar] [CrossRef]
- Omicron Reference. Available online: https://www.cdc.gov/coronavirus/2019-ncov/variants/omicron-variant.html (accessed on 23 March 2022).
- Nair, A.R.; Gupta, R.; Tanwar, S. FAIR: A Blockchain-based Vaccine Distribution Scheme for Pandemics. In Proceedings of the 2021 IEEE Globecom Workshops (GC Wkshps), Madrid, Spain, 7–11 December 2021; pp. 1–6. [Google Scholar] [CrossRef]
- Sheth, K.; Patel, K.; Shah, H.; Tanwar, S.; Gupta, R.; Kumar, N. A taxonomy of AI techniques for 6G communication networks. Comput. Commun. 2020, 161, 279–303. [Google Scholar] [CrossRef]
- Vaishya, R.; Javaid, M.; Khan, I.H.; Haleem, A. Artificial Intelligence (AI) applications for COVID-19 pandemic. Diabetes Metab. Syndr. Clin. Res. Rev. 2020, 14, 337–339. [Google Scholar] [CrossRef] [PubMed]
- Nguyen, P.Q.; Soenksen, L.R.; Donghia, N.M.; Angenent-Mari, N.M.; de Puig, H.; Huang, A.; Lee, R.; Slomovic, S.; Galbersanini, T.; Lansberry, G.; et al. Wearable materials with embedded synthetic biology sensors for biomolecule detection. Nat. Biotechnol. 2021, 39, 1366–1374. [Google Scholar] [CrossRef] [PubMed]
- Syrowatka, A.; Kuznetsova, M.; Alsubai, A.; Beckman, A.L.; Bain, P.A.; Craig, K.J.T.; Hu, J.; Jackson, G.P.; Rhee, K.; Bates, D.W. Leveraging artificial intelligence for pandemic preparedness and response: A scoping review to identify key use cases. NPJ Digit. Med. 2021, 4, 1–14. [Google Scholar] [CrossRef] [PubMed]
- Gunasekeran, D.V.; Tseng, R.M.W.W.; Tham, Y.C.; Wong, T.Y. Applications of digital health for public health responses to COVID-19: A systematic scoping review of artificial intelligence, telehealth and related technologies. NPJ Digit. Med. 2021, 4, 40. [Google Scholar] [CrossRef] [PubMed]
- Wong, C.K.; Ho, D.T.Y.; Tam, A.R.; Zhou, M.; Lau, Y.M.; Tang, M.O.Y.; Tong, R.C.F.; Rajput, K.S.; Chen, G.; Chan, S.C.; et al. Artificial intelligence mobile health platform for early detection of COVID-19 in quarantine subjects using a wearable biosensor: Protocol for a randomised controlled trial. BMJ Open 2020, 10, e038555. [Google Scholar] [CrossRef] [PubMed]
- Jin, C.; Chen, W.; Cao, Y.; Xu, Z.; Tan, Z.; Zhang, X.; Deng, L.; Zheng, C.; Zhou, J.; Shi, H.; et al. Development and evaluation of an artificial intelligence system for COVID-19 diagnosis. Nat. Commun. 2020, 11, 5088. [Google Scholar] [CrossRef] [PubMed]
- Luengo-Oroz, M.; Hoffmann Pham, K.; Bullock, J.; Kirkpatrick, R.; Luccioni, A.; Rubel, S.; Wachholz, C.; Chakchouk, M.; Biggs, P.; Nguyen, T.; et al. Artificial intelligence cooperation to support the global response to COVID-19. Nat. Mach. Intell. 2020, 2, 295–297. [Google Scholar] [CrossRef]
- Tayarani, M. Applications of artificial intelligence in battling against covid-19: A literature review. Chaos Solitons Fractals 2020, 142, 1–31. [Google Scholar] [CrossRef] [PubMed]
- Zhang, W.; Zhou, T.; Lu, Q.; Wang, X.; Zhu, C.; Sun, H.; Wang, Z.; Lo, S.K.; Wang, F.Y. Dynamic-Fusion-Based Federated Learning for COVID-19 Detection. IEEE Internet Things J. 2021, 8, 15884–15891. [Google Scholar] [CrossRef] [PubMed]
- Imran, A.; Posokhova, I.; Qureshi, H.N.; Masood, U.; Riaz, M.S.; Ali, K.; John, C.N.; Hussain, M.I.; Nabeel, M. AI4COVID-19: AI enabled preliminary diagnosis for COVID-19 from cough samples via an app. Inform. Med. Unlocked 2020, 20, 100378. [Google Scholar] [CrossRef] [PubMed]
- Hirten, R.P.; Danieletto, M.; Tomalin, L.; Choi, K.H.; Zweig, M.; Golden, E.; Kaur, S.; Helmus, D.; Biello, A.; Pyzik, R.; et al. Use of physiological data from a wearable device to identify SARS-CoV-2 infection and symptoms and predict COVID-19 diagnosis: Observational study. J. Med. Internet Res. 2021, 23, e26107. [Google Scholar] [CrossRef] [PubMed]
- Cecilia, J.M.; Cano, J.C.; Hernández-Orallo, E.; Calafate, C.T.; Manzoni, P. Mobile crowdsensing approaches to address the COVID-19 pandemic in Spain. IET Smart Cities 2020, 2, 58–63. [Google Scholar] [CrossRef]
- Yang, Y.; Wang, J.; Yang, Y. Improving SVM classifier with prior knowledge in microcalcification detection1. In Proceedings of the 2012 19th IEEE International Conference on Image Processing, Orlando, FL, USA, 30 September 2012–3 October 2012; pp. 2837–2840. [Google Scholar]
- Han, S.; Qubo, C.; Meng, H. Parameter selection in SVM with RBF kernel function. In Proceedings of the World Automation Congress 2012, Puerto Vallarta, Mexico, 24–28 June 2012; pp. 1–4. [Google Scholar]
- Understanding the Mathematics behind Support Vector Machines. Available online: https://shuzhanfan.github.io/2018/05/understanding-mathematics-behind-support-vector-machines/ (accessed on 7 May 2018).
- Redmon, J.; Divvala, S.K.; Girshick, R.B.; Farhadi, A. You Only Look Once: Unified, Real-Time Object Detection. In Proceedings of the IEEE Conference on Computer Vision and Pattern Recognition, Las Vegas, NV, USA, 27–30 June 2016; pp. 779–788. [Google Scholar]
- COVID-19 Dataset. Available online: https://www.kaggle.com/rishanmascarenhas/covid19-temperatureoxygenpulse-rate (accessed on 19 July 2021).
- Ting, K.M. Precision and Recall. In Encyclopedia of Machine Learning; Sammut, C., Webb, G.I., Eds.; Springer: Boston, MA, USA, 2010; p. 781. [Google Scholar] [CrossRef]
- Evgeniou, T.; Pontil, M. Support Vector Machines: Theory and Applications; Machine Learning and Its Applications, Advanced Lectures; Lecture Notes in Computer Science; Paliouras, G., Karkaletsis, V., Spyropoulos, C.D., Eds.; Springer: Berlin, Germany, 2001; Volume 2049, pp. 249–257. [Google Scholar]
Publisher’s Note: MDPI stays neutral with regard to jurisdictional claims in published maps and institutional affiliations. |
© 2022 by the authors. Licensee MDPI, Basel, Switzerland. This article is an open access article distributed under the terms and conditions of the Creative Commons Attribution (CC BY) license (https://creativecommons.org/licenses/by/4.0/).