Abstract
It is important to estimate the sample data when inspecting the quality of products. Therefore, sampling error and uncertainty in the measurement are inevitable, which may lead to misjudgment in product performance evaluation. Since the important quality characteristics of gasoline belong to one-sided specifications, a one-sided specification capability index was proposed to evaluate whether the process capabilities of various quality characteristics of gasoline reach the required quality levels. The 100(1−α)% upper confidence limits of the index were obtained to ensure low producer’s risk and reduce sampling errors. To deal with fuzzy data and limited sample sizes, a fuzzy testing model based on the 100(1−α)% upper confidence limits of the index was developed. A practice example of 95 unleaded gasoline was used to illustrate the effectiveness and usefulness of the proposed method. The result shows that two quality characteristics—Reid vapor pressure and oxygen content—of the nine quality characteristics of the 95 unleaded gasoline should be considered for improvements. This study provided an evaluation procedure to facilitate quality managers to take the opportunity to improve product quality, promoting the improvement of air quality, and the sustainability of industrial processes or products.
Keywords:
product quality; unleaded gasoline; confidence interval; fuzzy evaluation model; air pollution MSC:
03E72; 03E75; 62P30
1. Introduction
A high-quality product can not only ensure the safety of users, but also improve the market competitiveness of companies [1]. Given the importance of product quality, many product quality assessment and improvement approaches have been developed. There are two main ways to study this issue: one is based on process-driven modeling approaches [2] and the other is based on data-driven modeling approaches [3]. Compared with process-driven modeling, data-driven modeling only uses observed data to characterize the mathematical relationship between variables, so it does not need continuous model calibration [4]. In addition, the model developed based on data-drive can be easily applied to other quality improvement and management problems. However, most data-driven modeling methods are based on traditional statistical methods without considering the fuzziness and uncertainty of data [5,6,7,8]. Therefore, these methods are not suited to modeling the process data in unknown and complex environments.
The gradually prevalent and mature environment for the Internet of Things (IoT) is helpful for companies to achieve the goals of smart manufacturing and innovative management. In view of the effectiveness and costs, an enterprise usually does not, in practice, take an overly large sample size to make a fast and accurate decision in a short period [9,10]. However, the risks of random error may increase considerably with a decrease in sample size. On the other hand, most previous studies on the process of quality evaluation used precise measurement data for analysis and evaluation [11,12,13]. However, measurement errors may easily cause problems in explicit data quantification [14,15,16,17]. In addition, unspecified product characteristics or other unspecified product elements may lead to ambiguity and uncertainty during the evaluation [18,19]. Many studies have indicated that the fuzzy testing model based on the confidence interval could incorporate the experience garnered by data experts and improve the accuracy of the test when the sample size is small [1]. Therefore, the objective of this study is to develop a more reliable product quality evaluation model to evaluate the process quality when the sample data are imprecise. The proposed model adopted the one-sided specification indices to propose a fuzzy one-tailed testing model for products with multiple quality characteristics, which accurately conforms to the actual manufacturing process. To increase the reliability of assessment, a fuzzy test method on the basis of the 100(1−α)% upper confidence limits of the one-sided specification indices was developed. The evaluation model ensures that each index value of each quality characteristic reaches the required quality level, which, in practice, is conducive to the industry chain development and product quality improvement.
The remainder of this paper is organized as follows. Section 2 presents the one-sided specification capability indices with their 100(1−α)% upper confidence limits and the establishment of the decision rule of fuzzy tests using the fuzzy critical value of one-sided specification capability indices. Section 3 provides a case study for 95 unleaded gasoline quality improvements. The results and discussion are given in Section 4. Conclusions are summarized in Section 5. Finally, Section 6 concludes the paper with limitations and future research directions.
2. Research Methodology
This section contains three parts. First, the one-sided specification process quality evaluation index Qph is presented, and the relationships between Qph and product yield are described. Second, under the assumption of normality, the 100(1−α)% upper confidence limits of index Qph are derived. Then, a fuzzy estimate and a fuzzy testing method for index Qph are established. Finally, a flowchart of the proposed method is constructed.
2.1. One-Sided Specification Capability Index with Its Upper Confidence Limit
Since several important quality characteristics of gasoline are one-sided specifications, many studies have pointed out that process capability indices (PCIs) are not only a powerful tool for quality engineers in evaluating and analyzing process quality but also an effective communication tool between sales engineers and customers [20]. Assuming that gasoline has m one-sided specification quality characteristics, Then, the proposed one-sided specification process quality evaluation index can be expressed as follows:
where is process mean, is process standard deviation, is the upper specification limit and is the lower specification limit for quality characteristic h.
Many studies have pointed out that when all process quality evaluation indicators meet the requirements of process capability, it is guaranteed that all quality characteristics can also meet the requirements of process capability [21]. According to Equation (1), the process yield for quality characteristic h is , where is the cumulative distribution function of the standard normal distribution. Based on Chen and Yu [1], the product yield is:
Therefore, the product quality index can be defined as follows:
According to Equation (2), the following equation can be obtained:
Therefore,
Generally, only when the process capability of each quality characteristic meets the requirements can it be regarded as a qualified product. Hence, if the required value of the product quality index is C, the required value of the quality evaluation index of individual quality characteristics must be greater than C. In determining a qualifying product, Equation (4) can be rewritten as follows:
Thus,
Since index contains unknown parameters, it must be estimated through sample data [22]. Let be a random sample of quality characteristic h 1,2, …, m. Then, the sample mean and sample standard deviation can be shown below, respectively:
and
Based on the above equations, the estimators of the quality evaluation indices can be shown as follows:
Under the assumption of normality, let
and
then, is distributed standard normal distribution, and is distributed as chi-square distribution with degree of freedom, denoted as . Therefore,
where is the lower quantile of .
For the smaller-the-better type quality characteristics, the following equation can be obtained:
where is the upper quantile of standard normal distribution.
For the larger-the-better type quality characteristics, the following equation can be obtained:
Under the assumption of normality, and random variables and being independent, the following equation can be obtained:
Thus, the 100(1−α)% upper confidence limit of is:
2.2. Fuzzy Hypothesis Testing
As mentioned above, if the value of the product quality index is , then the required value of the quality evaluation index of individual quality characteristics is . In order to determine whether the value of one-sided specification capability indices is larger or equal to , the hypothesis for testing at the significance level can be stated as follows:
Let be the observed values of . Then the observed values of and , respectively, are as follows:
and
Thus, the observed value of is:
and the observed value of the 100(1−α)% upper confidence limit is as follows:
According to the above statistical test rules and the method introduced by Chen [22], this study developed a fuzzy testing method based on . Therefore, the -cuts of the triangular shaped fuzzy number could be obtained as follows:
where
and
Recall that all the α-cuts of the triangular shaped fuzzy number for . Thus, the half-triangular shaped fuzzy number , where
and
Therefore, the membership function of the fuzzy number is:
where is determined by
Then, the diagram of membership function with vertical line = is presented in Figure 1.
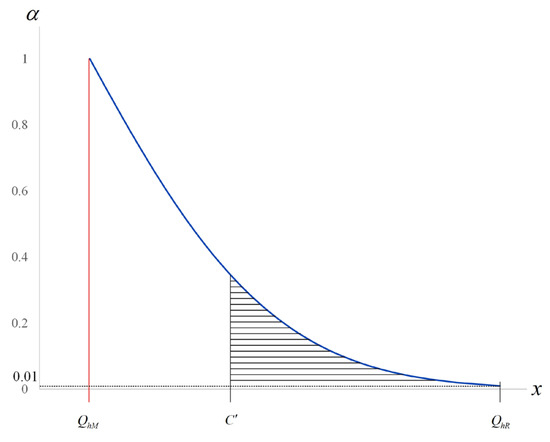
Figure 1.
The diagram of membership function with vertical line .
Following Chen [22], let set be the area in the graph of , such that
Let be the length of the bottom of , then
Similarly, let set be the area in the graph of , but to the right of the vertical line = , then
where , such that . Similarly, let be the length of the bottom of , then
Based on Equations (31) and (33), the following equation can be obtained:
Following Chen and Yu [1], let 0 0.5. Then, the decision value of the h one-side specification evaluation index satisfies the following equation:
where is the decision value of hth quality characteristics is determined by , then
Based on Chen [22], the decision rule of fuzzy tests is as follows:
- (a)
- If is equivalent to , reject H0 and conclude that .
- (b)
- If is equivalent to , do not reject H0 and conclude that QPh > C’.
2.3. The Proposed Procedure
A fuzzy quality evaluation and analysis model based on one-sided specifications for products with multiple quality characteristics is proposed in this paper to evaluate whether the process capabilities of various quality characteristics of gasoline reach the required quality levels. Figure 2 depicts the proposed method of the detailed workflow of the research process. The procedure of the proposed method is as follows:
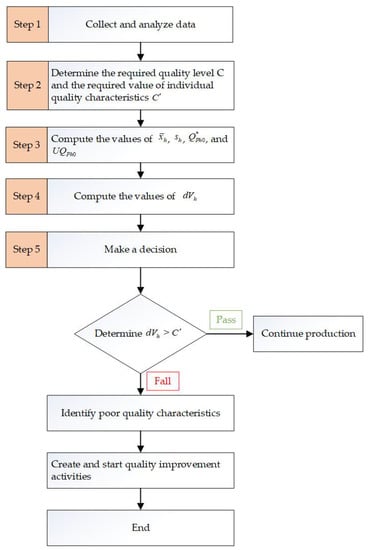
Figure 2.
Flowchart of the proposed method.
Step 1: Collect and analyze data. Determine the sample size is large enough to estimate the process parameters and .
Step 2: Determine the require quality level C. Then, compute the required value of the quality evaluation index of individual quality characteristics by using Equation (7).
Step 3: Calculate the values of , , , and by using Equations (8)–(10).
Step 4: Calculate the values of by using Equation (36).
Step 5: Make a decision. Check all quality characteristics of gasoline are acceptable. If not, the quality improvement activities should be considered.
3. An Illustrative Example
Gasoline is one of the major products of petroleum processing and is a fuel exclusively used for gasoline engines. It is mainly used to fuel vehicles, motorcycles, speedboats, and airplanes. Gasoline is a clear, water-white liquid with a density between 0.70 g/cm3 and 0.78 g/cm3. It emanates a distinctive gasoline scent, of which the distillation range is from 30 °C to 220 °C. The leaded gasoline commonly used previously contained the additive tetraethyl lead (TEL), which is toxic and may impair the catalytic converter that controls exhaust pollution. Therefore, many countries in the world have switched to unleaded gasoline. In Taiwan, unleaded gasoline is classified into 98, 95, and 92 unleaded gasoline, among which 95 unleaded gasoline is one of the primary fuels used for vehicles and motorcycles.
In general, poor quality unleaded gasoline may lead to a burst inside the steam cylinder, high gasoline consumption, poor starting performance and engine operation, gasoline deterioration, or varnishing. This poor quality can impair the engine or result in carbon deposits. Further, this will not only reduce the service life of a vehicle or motorcycle but also affect driving safety and even cause air pollution. Apparently, ensured gasoline quality protects both drivers and the environment. Thus, this study illustrates the application of the proposed method with the quality of the 95 unleaded gasoline—the most widely used gasoline in Taiwan—as a case study. The 95 unleaded gasoline possesses nine quality characteristics: (1) Octane number; (2) Reid vapor pressure; (3) Sulfur content; (4) Oxygen content; (5) Distillation point (10%); (6) Distillation point (50%); (7) Distillation point (90%); (8) Distillation end point; (9) Distillation residue. The specifications of these nine quality characteristics are detailed in Table 1. The quality of the 95 unleaded gasoline was evaluated according to main procedures shown in Figure 2. The calculated results were derived in the Microsoft Excel environment (Microsoft Excel 2016, Microsoft, Taichung, Taiwan) and obtained on a laptop (Core i5-8265M–1.60 GHz processor) with 8.00 GB of RAM, requiring less than 15 min.

Table 1.
Specifications of 95 unleaded gasoline.
Step 1: 15 samples were taken from an oil tank randomly. Therefore, the sample size is small (n < 30).
Step 2: Since the quality of 95 unleaded gasoline is related to safety and environmental protection issues, the requirements for product quality standards include six standard deviation quality levels (i.e., C = 6). According to Equation (7), the requirement for the quality level of the 95 unleaded gasoline is 6.347. The hypothesis for testing is as follows:
Step 3: Equations (8)–(10) were employed to compute the values of , , and . For instance, the octane number was:
Similarly, all the values of , , , and of the quality characteristic of 95 unleaded gasoline were calculated, summarized in Table 2.
Table 2.
Process evaluation results of 95 unleaded gasoline.
Step 4: Equation (36) was used to compute the values of dVh as follows. The results are shown in Table 2.
Step 5: A decision was made.
Table 2 shows that the Reid vapor pressure ( 5.325) and oxygen content ( 5.280) reached less than the required value of 6.347, indicating that the two quality characteristics are unqualified; hence, improvement activities should be considered.
4. Results and Discussion
Improving gasoline quality is conducive to air pollution improvement. It is important to adopt a reasonable and effective evaluation model to accurately identify the gasoline quality characteristics that need improvement. According to the results of this study, the quality characteristics of “oxygen content” and “Reid vapor pressure” fell below the standard, which should be improved immediately. In particular, as the oxygen content was not acceptable in multiple terms, it should be set as a key improvement. According to the decision value and decision rules of fuzzy tests, seven of the nine quality characteristics of the 95 unleaded gasoline have an upper confidence limit value of above 6.347. Therefore, the seven quality characteristics reached the required process quality levels ( ≥ 6.347). From the statistical and the fuzzy testing results, the quality characteristic of oxygen content must be improved ( 6.334 6.347 and 5.280 6.347). Noteworthily, according to the statistical testing methods, the upper confidence limit value of the Reid vapor pressure was acceptable ( = 6.386 ≥ 6.347). However, based on the proposed fuzzy testing rules in this paper, the quality characteristic of Reid vapor pressure should also be improved because 5.325 6.347. In fact, = 3.959 is much smaller than = 6.347.
The strengths of the proposed model are detailed as follows:
- (a)
- The point estimation of the PCIs calculated directly from sample data is quite convenient and easy to use in practice. However, its shortcomings in sampling methods or sampling errors lead to the misjudgment of analysis results [17]. Therefore, the proposed method avoids sampling errors and errors in estimating process parameters, helping companies make more reliable decisions.
- (b)
- From a statistical point of view, one of the risks of miscalculation in the confidence intervals arises from the sample size [23,24,25]. The length of the confidence interval narrows with the increase in sample size, thus reducing the risk of miscalculation. However, due to the limited time and the required quick decision-making, a large sample size is not suitable for practical application. The method proposed in this study not only reduced the risk of misjudgment but also overcame the problem of sample size and improved the production efficiency of companies.
- (c)
- The statistical test and analysis method based on the upper confidence limits of PCI can effectively measure and improve product quality, ensure low producer’s risk, and reduce the production cost [26]. In addition, the PCI proposed in this study can also directly reflect the percent yield of a product without any calculation or conversion processes.
- (d)
- Fuzziness and random uncertainty in the process of data collection are inevitable [19,27,28,29]. Noteworthily, the proposed method addresses the problem of fuzzy data in the production process, and improves the accuracy of product quality analysis results and the operation performance of companies.
- (e)
- Inferior gasoline not only affects the performance of engines but also causes air pollution due to insufficient combustion [30,31,32,33]. The method proposed in this paper can effectively help companies improve gasoline quality and reduce the impact of poor gasoline on human health and air quality.
5. Conclusions
Based on the fuzzy theory, this study developed a more reliable process quality evaluation model to evaluate the process quality when the sample data are imprecise. Further, this study adopted the one-sided specification indices to propose a fuzzy one-tailed testing model for products with multiple quality characteristics which accurately conforms to the actual manufacturing process. Based on the upper confidence limit, the fuzzy test not only improves the evaluation accuracy but also possesses good, convenient management efficiency. The proposed evaluation model is highly convenient and useful for the operator and maintains the accuracy of the test by replacing the computationally difficult with an easy-to-calculate computation. Furthermore, the evaluation model ensures that each index value of each quality characteristic reaches the required quality level, which, in practice, is conducive to the industry chain development and quality improvement.
This paper adopts the proposed evaluation model to study the quality characteristic levels of 95 unleaded gasoline in Taiwan. According to the results of this study, two of the nine quality characteristics of the 95 unleaded gasoline fall below the standard (i.e., oxygen content and Reid vapor pressure), which should be improved immediately. In particular, as the oxygen content was not acceptable in multiple terms, it should be set as a key improvement. Although the Reid vapor pressure was deemed qualified, its value calculated with the method proposed in this paper did not meet the requirement.
6. Limitations and Future Research
This paper proposes a product quality evaluation and analysis for unleaded gasoline under a fuzzy environment. However, there are some limitations that should be addressed in future research. The normal process is a common process distribution in the manufacturing industry and is also the basic assumption of this paper. When the process distribution was abnormal, the model in this paper may have achieved a relatively large error. This phenomenon can be a direction for future research. It is recommended that this proposed model be applied to measure the process/product quality level of suppliers or other manufacturing industries, such as chips, plastics, and food.
Author Contributions
Conceptualization, C.-M.Y. and K.-S.C.; data curation, C.-M.Y. and S.L.; formal analysis, T.-H.H., K.-S.C., C.-H.C. and S.L.; funding acquisition, C.-M.Y.; investigation, T.-H.H., C.-H.C. and S.L.; methodology, K.-S.C. and C.-H.C.; project administration, T.-H.H.; resources, C.-M.Y.; supervision, K.-S.C.; writing—original draft, C.-M.Y., K.-S.C., C.-H.C. and S.L.; writing—review & editing, C.-M.Y., T.-H.H., K.-S.C. and S.L. All authors have read and agreed to the published version of the manuscript.
Funding
This research was funded by National Natural Science Foundation of China under grant No. 71762008, Quality and Brand Development Research Center in Dongguan University of Technology under Grant No. GB200101, and Foundation of College’s Key Research base on Humanities and Social Science in Guangdong Province, China: Pearl River Delta Industrial Ecology Research Center under Grant No. 2016WZJD005.
Institutional Review Board Statement
Not applicable.
Informed Consent Statement
Not applicable.
Data Availability Statement
Not applicable.
Conflicts of Interest
The authors declare no conflict of interest.
References
- Chen, K.S.; Yu, C.M. Lifetime performance evaluation and analysis model of passive component capacitor products. Ann. Oper. Res. 2022, 311, 51–64. [Google Scholar] [CrossRef]
- Chang, S.I.; Yen, D.C.; Chou, C.C.; Wu, H.S.; Lee, H.P. Applying Six Sigma to the management and improvement of production planning procedure’s performance. Total Qual. Manag. Bus. 2012, 23, 291–308. [Google Scholar] [CrossRef]
- Wang, C.H.; Ali, M.H.; Chen, K.S.; Negash, Y.T.; Tseng, M.L.; Tan, R.R. Data driven supplier selection as a circular economy enabler: A Taguchi capability index for manufactured products with asymmetric tolerances. Adv. Eng. Inform. 2021, 47, 101249. [Google Scholar] [CrossRef]
- Sun, Y.N.; Qin, W.; Xu, H.W.; Tan, R.Z.; Zhang, Z.L.; Shi, W.T. A multiphase information fusion strategy for data-driven quality prediction of industrial batch processes. Inform. Sci. 2022, 608, 81–95. [Google Scholar] [CrossRef]
- Leco, M.; Kadirkamanathan, V. A perturbation signal based data-driven Gaussian process regression model for in-process part quality prediction in robotic countersinking operations. Robot. Comput. Integr. Manuf. 2021, 71, 102105. [Google Scholar] [CrossRef]
- Pang, J.; Zhang, N.; Xiao, Q.; Qi, F.; Xue, X. A new intelligent and data-driven product quality control system of industrial valve manufacturing process in CPS. Comput. Commun. 2021, 175, 25–34. [Google Scholar] [CrossRef]
- Ma, Q.; Li, H.; Thorstenson, A. A big data-driven root cause analysis system: Application of Machine Learning in quality problem solving. Comput. Ind. Eng. 2021, 160, 107580. [Google Scholar] [CrossRef]
- Ji, W.; Li, Y.; AbouRizk, S.M. Integrated data-driven approach for analyzing pipe welding operator-quality performance. Automat. Constr. 2019, 106, 102814. [Google Scholar] [CrossRef]
- Chen, K.S.; Yu, C.M. Fuzzy test model for performance evaluation matrix of service operating systems. Comput. Ind. Eng. 2020, 140, 106240. [Google Scholar] [CrossRef]
- Li, M.; Chen, K.S.; Yu, C.M.; Yang, C.M. A fuzzy evaluation decision model for the ratio operating performance index. Mathematics 2021, 9, 262. [Google Scholar] [CrossRef]
- Ramos, P.L.; Almeida, M.H.; Louzada, F.; Flores, E.; Moala, F.A. Objective Bayesian inference for the capability index of the Weibull distribution and its generalization. Comput. Ind. Eng. 2022, 167, 108012. [Google Scholar] [CrossRef]
- Otsuka, A.; Nagata, F. Quality design method using process capability index based on Monte-Carlo method and real-coded genetic algorithm. Int. J. Prod. Econ. 2018, 204, 358–364. [Google Scholar] [CrossRef]
- Zhao, C.; Dinar, M.; Melkote, S.N. A data-driven framework for learning the capability of manufacturing process sequences. J. Manuf. Syst. 2022, 64, 68–80. [Google Scholar] [CrossRef]
- Abdolshah, M.; Yusuff, R.M.; Hong, T.S.; Ismail, M.Y.B.; Sadigh, A.N. Measuring process capability index Cpmk with fuzzy data and compare it with other fuzzy process capability indices. Expert Syst. Appl. 2011, 38, 6452–6457. [Google Scholar] [CrossRef]
- Basu, S.; Dan, P.K.; Thakur, A. Experimental design in soap manufacturing for optimization of fuzzified process capability index. J. Manuf. Syst. 2014, 33, 323–334. [Google Scholar] [CrossRef]
- Hesamian, G.; Akbari, M.G. Fuzzy process capability indices based on imprecise observations induced from non-normal distributions. Comp. Appl. Math. 2018, 37, 5715–5726. [Google Scholar] [CrossRef]
- Besseris, G.J. Evaluation of robust scale estimators for modified Weibull process capability indices and their bootstrap confidence intervals. Comput. Ind. Eng. 2019, 128, 135–149. [Google Scholar] [CrossRef]
- Choi, Y.H.; Na, G.Y.; Yang, J. Fuzzy-inference-based decision-making method for the systematization of statistical process capability control. Comput. Ind. 2020, 123, 103296. [Google Scholar] [CrossRef]
- Buckley, J.J. Fuzzy statistics: Hypothesis testing. Soft Comput. 2005, 9, 512–518. [Google Scholar] [CrossRef]
- Yang, C.M. An improved multiple quality characteristic analysis chart for simultaneous monitoring of process mean and variance of steering knuckle pin for green manufacturing. Qual. Eng. 2021, 33, 383–394. [Google Scholar] [CrossRef]
- Yang, C.M.; Chen, K.S.; Hsu, C.H. Developing a multi-quality characteristic analysis model to measure the quality of quick-release bicycle hubs. J. Chin. Inst. Eng. 2019, 42, 309–318. [Google Scholar] [CrossRef]
- Chen, K.S. Fuzzy testing of operating performance index based on confidence intervals. Ann. Oper. Res. 2022, 311, 19–33. [Google Scholar] [CrossRef]
- Kagan, A.M.; Malinovsky, Y. Monotonicity in the sample size of the length of classical confidence intervals. Stat. Probabil. Lett. 2013, 83, 78–82. [Google Scholar] [CrossRef] [Green Version]
- Dobbin, K.K.; Ionan, A.C. Sample size methods for constructing confidence intervals for the intra-class correlation coefficient. Computat. Stat. Data An. 2015, 85, 67–83. [Google Scholar] [CrossRef]
- Tarasińska, J. Sample size needed to get given ratio of endpoints for confidence interval of standard deviation in a normal distribution. Commun. Stat.-Theor. M. 2017, 46, 11480–11484. [Google Scholar] [CrossRef]
- Yang, C.M.; Chen, K.S. An integrated contract manufacturer selection and product quality optimization methodology for the mechanical manufacturing industry. Expert Syst. Appl. 2021, 183, 115336. [Google Scholar] [CrossRef]
- Hesamian, G.; Akbari, M.G. A process capability index for normal random variable with intuitionistic fuzzy information. Oper. Res. 2021, 21, 951–964. [Google Scholar] [CrossRef]
- Momeni, F.; Gildeh, B.S.; Hesamian, G. Fuzzy nonparametric estimation of capability index Cpk. Soft Comput. 2019, 23, 10485–10494. [Google Scholar] [CrossRef]
- Ganji, Z.A.; Gildeh, B.S. Fuzzy process capability indices for simple linear profile. J. Appl. Stat. 2020, 47, 2136–2158. [Google Scholar] [CrossRef]
- Yang, G.; Zhang, Y.; Li, X. Impact of gasoline upgrade policy on particulate matter pollution in China. J. Clean. Prod. 2020, 262, 121336. [Google Scholar] [CrossRef]
- Nguyen, D.D.; Moghaddam, H.; Pirouzfar, V.; Fayyazbakhsh, A.; Su, C.H. Improving the gasoline properties by blending butanol-Al2O3 to optimize the engine performance and reduce air pollution. Energy 2021, 218, 119442. [Google Scholar] [CrossRef]
- Wen, L.; Xin, C.Y.; Yang, S.C. The effect of adding dimethyl carbonate (DMC) and ethanol to unleaded gasoline on exhaust emission. Appl. Energ. 2010, 87, 115–121. [Google Scholar] [CrossRef]
- Yao, Y.C.; Tsai, J.H.; Chiang, H.L. Effects of ethanol-blended gasoline on air pollutant emissions from motorcycle. Sci. Total Environ. 2009, 407, 5257–5262. [Google Scholar] [CrossRef] [PubMed]
Publisher’s Note: MDPI stays neutral with regard to jurisdictional claims in published maps and institutional affiliations. |
© 2022 by the authors. Licensee MDPI, Basel, Switzerland. This article is an open access article distributed under the terms and conditions of the Creative Commons Attribution (CC BY) license (https://creativecommons.org/licenses/by/4.0/).