1. Introduction
Year after year, e-commerce is becoming more common among the general population. On the one hand, users choose this medium for its practicality and efficiency in finding specific products. On the other hand, merchants benefit from the reach and ease of reaching potential buyers. This supply-and-demand phenomenon has generated considerable growth in the number of items available on these platforms. In an environment with millions of products offered every day, providing a good experience in searching and purchasing items brings many opportunities and many challenges.
One challenge that arises with the increasing number of offers is to automatically identify which of them refers to the product of interest. Doing this makes it easier for the buyer to find different proposals for the same product and allows the seller to know the market of offered products. This problem is known as product matching and is a particular case of entity matching.
Entity-matching (EM) and product-matching (PM) problems have been widely studied for several years; EM has the longest history as the general case. Many models have been tested and show a constant improvement in the performance of these tools over time.
Let us place ourselves in the current context of Latin America, and specifically, Mexico. An increase in e-commerce purchases has been observed as a result of the health emergency caused by the SARS CoV-2 virus (COVID-19) and the lockdown imposed by health authorities. However, the use of e-commerce platforms in Latin America clearly lags behind the use of similar platforms in the United States, China and the United Kingdom.
Consequently, in Latin America, the mere design of an e-commerce platform can be very different from platforms targeted at consumers in countries with a more developed market, and, while those platforms are increasingly generalizing the use of schemes such as those provided by schema.org for the presentation of their products, indeed, it is not certain whether the platforms in Latin America, and specifically in Mexico, will follow the same trend.
The task of PM becomes more complicated within platforms that offer products whose textual descriptions are not clear and homogeneous due to the impossibility of automatically locating specific characteristics of the product that are essential to compare with similar products. It is possible, for example, that the position of the name within the web page changes with each product or that the brand name is explicitly displayed for certain products and not for others. Perhaps this is why PM has focused mainly on Chinese or English-speaking platforms. The closest thing we have in Latin America is the implementation of a tool for the extraction of product features [
1]; however, the PM problem is not addressed as such. This scarcity of research in the Latin American region opens an interesting field of study because several existing tools can be applied to this type of problem. However, it is not expected that the tools will work the same way they do on non-Spanish platforms, so it is essential to test them and develop a unique methodology for this case.
An important aspect to consider is the multimodal nature of the data related to the PM task. When the information related to some phenomenon of interest comes from different sources, sensors, or instruments, we say it is multimodal [
2]. It is particularly evident with the information shared by users or companies on digital media or social networks, where the information related to some item (user, product, news, post, etc.) is composed of images, text, audio, or video. Traditionally, many tasks related to this kind of data (PM included) have been addressed by considering only one modality of the information. In recent years, there has been an increasing number of research efforts to model and combine the information from each modality of data to solve specific tasks related to them. Methodologically, there is a preference for classical-machine-learning (CML) algorithms within the literature for solving the PM task, whether a unimodal or multimodal approach is considered, and state-of-the-art (SOTA) results have been achieved by using deep-learning (DL) methods. There are many advantages to using CML and DL methods in both performance metrics and in the fact that the amount of training data required is greatly reduced due to the pre-trained models available, which allows transfer learning, and, as a consequence, we can obtain better generalization. For these reasons, we propose a multimodal data approach based on DL and CML methodologies to solve the PM task for the particular case of Mexican e-commerce.
Given the lack of resources and research for the Mexican e-commerce market, this work aims to develop and test a system capable of recognizing the similarity between products offered on different e-commerce sites in Mexico. This system will be based on ML techniques and will offer the consumer and the business a clearer picture of the products they intend to obtain and trade, respectively, by automatically identifying, within a large number of offers, which one corresponds to the product of interest. We build a database of products offered on e-commerce websites operating in Mexico to this end. As the PM problem has not been studied in the Spanish language, any database with this characteristic will have to be built from scratch. This is not an easy task; due to the complexity of the PM problem, it will not be possible to use data from all e-commerce stores operating in Mexico. Therefore, it is necessary to define some criteria. In our case, we decided to focus on the two most popular e-commerce stores in Mexico. Names are not disclosed due to the confidentiality of the information. The stores will be referred to as e-shop 1 and e-shop 2, hereafter. In addition, we restrict ourselves to the most popular products offered in these e-commerce stores. We obtained two modalities of data for each product: text and images.
With this multimodal data, we implemented and compared several ML methodologies to address the PM problem as a binary classification problem: the objective is to identify if a given pair of offers corresponds to the same product. Initially, we used some CML algorithms based on a particular representation of the text description of the data. In addition, we used some of the SOTA models for PM based on DL architectures that use only one modality of the data (image or text) independently. We propose some multimodal algorithms based on the intermediate fusion of some useful vector representations of images and text.
Another objective we pursue with this research is to know how the Mexican market and e-commerce platforms present their products and what structure (if any) they follow to organize their characteristics. We think this work could set a precedent for future research on PM and the obstacles to working with these data for the Mexican market and the Spanish language.
In summary, this research develops a product-matching scheme, which is the first focused on e-commerce in Spanish-speaking countries and considers the Mexican market’s particularities. The proposed scheme, which also considers the difficulties of the Mexican market, is bimodal and has not been explored in Chinese- or English-speaking e-commerce markets. The proposed bimodal product-matching system also explores a wide range of SOTA, CML, and DL algorithms in EM, which will allow measuring their efficiency in the Mexican market and the Spanish language.
Section 2 provides an overview of related papers that deal with similar topics. The definition of the problem, the data set, and the methodology we propose are described in
Section 3.
Section 4 presents the result of our study with regard to the stated objectives. Based on these results,
Section 5 provides further key findings and challenges and envisions future research directions to master them.
2. Related Work
Since the advent of e-commerce, several ML-based solutions to specific tasks have been proposed, ranging from prediction, web mining, data gathering and preprocessing [
3,
4,
5,
6]. With the rise in the big-data era and disruptive information technologies (IT), methodologies for solving traditional and new tasks related to e-commerce have evolved too, from classical-ML to artificial-intelligence (AI) approaches [
7]. This evolution allows us to face large-scale prediction problems such as extreme classification, where multi-label prediction with hundreds of thousands or even millions of labels are involved [
8,
9,
10,
11], and is particularly relevant in PM, when there may not be an exact match but may be an approximate match, as is the case in recommendation systems.
To give some context to our particular PM problem and to reinforce ideas that were discussed earlier, a brief literature review will follow. Starting with classical methods, ref. [
12] addresses the MS problem by asking the question of how similar is similar? The question is answered by constructing an algorithm capable of finding the appropriate similarity function to remove ambiguity. Ref. [
13] proposed a methodology for the formalization and evaluation of product-category matching schemes, cost-effectively and reliably. Another classical approach is given by [
14], who bases the study on Markov logic and combines first-order logic and probabilistic models for solving the EM task.
As for ML-based approaches, ref. [
15] performs work for the PM task using a document representation called term frequency–inverse document frequency (TF-IDF). This representation is described in
Section 3.3.1.2. Roughly speaking, it is a numerical measure expressing how relevant a word is within a document. Similarly, the authors use the Word2vec technique [
16], which assigns each word a vector in space so that words that share the same context are closer than others. Both techniques, together with a measure for the similarity between two vectors called cosine similarity, make it possible to create a model capable of calculating the similarity between two objects. The results showed that TF-IDF is the more efficient and straightforward of the two techniques and that Word2Vec requires a large amount of data to obtain good results.
A work that employs both classical and ML-based approaches was developed by [
17]. Here, several problems within the EM domain, including PM, are addressed by using the structure to evaluate the relationship between entities (FEVER) to implement and adjust each model used. Classical methods include PPJoin [
18] which, by defining a threshold and a similarity function, determines how similar two entities are. The method proposed by [
19], also classical, works similarly but defines lower and upper bounds. For methods based on ML techniques, FEBRL [
20] and MARLIN [
21] were used, which are based on support vector machine (SVM) and decision trees, respectively. Ref. [
22] developed a neural-network-based product-matching system using only the title and attributes of the offered product.
A vital system based on ML techniques is the system designed by [
23] (Magellan), as it provides a step-by-step guide on how to act in each EM scenario, as well as proposing techniques and models for data cleaning, visualization, and learning. The above proposals help the user to address any problem related to EM.
For further references to these and other models, ref. [
24] provides an overview of the aspects to consider for the resolution of this task, from basic concepts to a vast number of strategies and methods to follow for the type of task to be solved.
One of the first DL works carried out concerning the EM task was developed by [
25] and presents a system that they called DeepER, which uses a compendium of DL techniques and models, achieving excellent performance. In this system, recurrent neural networks (RNN), bidirectional recurrent networks (BRNN), and long short-term memory (LSTM) units convert each pair of products into a vector that can be used to capture similarities between pairs. In addition, that system considers cases where there are pre-trained
word embeddings (vector representations of words that are derived from training a neural network), as well as cases where they are not. Methods to improve the vectors for each special case of MS are presented. The results of implementing this system on several databases showed that DeepER performs better than previously developed systems. Ref. [
26] utilized EM techniques to develop a team-manager matching scheme that includes performance metrics and information preprocessing.
Another DL-based model is developed by [
27], which tests the benefits and limitations derived from using DL methods for the EM task. Their work examines several DL-based solutions that have been developed for similar tasks, creating a solution space shaped by DL methods: smooth inverse frequency (SIF), RNN, attention models, and a combination of the latter two. The study reports the benchmark for this task and some exceptional cases, such as PM. The authors of [
28] present an approach that combines DL techniques, natural language processing (NLP), and standard PM methods. For this, structured data are used as training for feature-extraction models in unstructured databases. These models are: dictionary-based [
29], conditional random field (CRF) [
30], CRF with
word embeddings to improve generalization (
http://nlp.stanford.edu/software/CRF-NER.shtml, accessed on 5 October 2021) [
16,
31,
32] and an attribute extraction model for images. Once the unstructured data set features are obtained, a similarity vector is computed for each pair, which will be the input information for classification models such as decision trees, SVMs, logistic regression, and Bayesian classifiers. A portion of the databases is manually labeled as matched or mismatched pairs to train these models. The results obtained indicate that the CRF model incorporating word embeddings and feature extraction from images, in addition to the classifier based on decision trees, has the best performance. The authors of [
33] highlight the fact that several e-commerce sites use a scheme given by
schema.org (
https://schema.org/, accessed on 12 January 2022) to publish offers for their products. Thanks to this, the information and structure that the Internet offers are being homogenized little by little. Among the information that more and more sites are including are unique product identifiers in their offers, which allow identical products to be grouped without manual work. With the help of this identifier, the authors formed a database with pairs of products, either identical (positive) or different (negative) from each other, belonging to four categories: computers, cameras, watches, and shoes. Subsequently, several models are tested for PM, such as the one proposed by [
23], word co-occurrence, and several models with the structure of the Deepmacher [
27]. The results show that Deepmacher models are the most efficient. However, their generalization ability is limited. The authors of [
34] address the PM problem through two different approaches, modeling it as a classification task using a deep neural network and as a similarity task using a Siamese neural network. The latter consists of two parallel neural networks, each fed with one of the two products to be compared with the corresponding binary label. In this case, the model is not learning to classify but learning to differentiate the two inputs. The Siamese network obtained the best results. However, the deep neural network was faster to train and achieved similar results. The authors of [
35] propose a model for PM that consists of two modules, one in charge of title matching and the other for attribute matching. The first one combines an RNN with a convolutional neural network (CNN). The second one only uses a CNN to perform the task, resulting in better performance than other SOTA EM models.
Recently, the field of DL for problem solving related to NLP has been revolutionized with the creation of BERT, a DL model based on
transformers, positioning itself as the state-of-the-art approach for many of these tasks. The authors of [
36] are the first to implement BERT for the PM task, demonstrating that, simply by performing
fine tuning on a pre-trained BERT model, comparable results to other SOTA models can be achieved because the BERT model is more data-efficient. The authors also show that, by training the pre-trained network with product-offering information, the performance of the network on unobserved data can be improved without the need for
fine tuning. Overall, it is shown that using BERT for the PM task is quite efficient in terms of data used and generalization.
The scientific community quickly improved BERT by creating several architectures based on it. These were exploited by [
37] to solve the PM task, specifically using two of the BERT enhancements, RoBERTa [
38] and DistilBERT [
39]. Such models take a pre-trained model and connect it to a simple network that performs the classification task. This work also addresses the problem of product classification, which consists of extracting attributes from the description of a product. For this, [
37] employ the architecture of a CNN [
40] because the task is understood as a schema in which one has one input text and multiple labels as output. The results for the PM task show good performance for the combination of RoBERTa and DistilBERT, achieving up to an F1 of 95.8 for training with 15 epochs and considering the inclusion of all attributes.
As in the work performed by [
35,
37] construct a system based on pre-trained transformer models, which they call DITTO. For this, it performs a
fine-tuning process on models such as BERT, DistilBert and RoBERTa, pretrained on a large amount of data, which greatly improves the performance of the classifier. In addition, hierarchical optimization techniques were developed for the classifier to improve its performance. For learning DITTO on the specific EM task, data-augmentation techniques are implemented by including ‘difficult’ instances, further increasing its classification capability. Consequently, DITTO can reach similar results to other SOTA models using almost half of the labeled data, being quite efficient in real large-scale problems.
Finally, the study by [
41] describes their work carried out for the
Semantic Web Challenge on the PM task. In this work, four SOTA models are implemented for the MS task: MPM [
42], Seq2SeqMatcher [
43], HierMatcher [
44] and DITTO [
25]. In addition, post-processing was performed by means of a heuristic to detect false positives or false negatives.
The outstanding performance shown by researchers at the University of Mannheim is noteworthy in the area of PM because, in addition to having several publications on the subject [
28,
33,
36], they also make public their WDC database (
http://webdatacommons.org/largescaleproductcorpus/v2/index.html, accessed on 20 September 2021) for the use of the scientific community, as well as challenges. This keeps the research in the area active and encourages research in the area.
3. Material and Methods
3.1. Problem Definition
We will start by formally defining the EM problem the same way as [
27] presents it in the article on the DeepMatcher tool. For this, any observable object in the real world (e.g., person, organization, etc.) will be called an entity. Likewise, any reference to an entity, for example, in the form of a record in a database, will be called an entity representation.
Let D and be two collections of representations. It is assumed that the elements in D and follow the same structure (e.g., each has specific attributes if the collection is structured data). The goal of EM is to find all pairs of representations between D and that refer to the same entity. These pairs will be called positive pairs; conversely, pairs of distinct entities will be called negative pairs. Usually, the product is filtered to obtain the candidate set C, which only includes pairs that have been manually identified as positive or negative. Once the set C is created, a model is designed to identify these pairs.
For the matching model, two collections, D and , and a candidate set C, which contain entity representations (, ), will be used as input. We define T, a set of tuples where , and l is a label that can take the values {“Positive”, “Negative”}, if they are identical entities or if they are distinct, respectively. Thus, given the labeled set T, the goal is to design an algorithm M that can distinguish between positive and negative pairs (, ) in C.
Now, for the particular case of the PM task, we have that the entity to observe is an offer, and its representation is everything that comprises the web page where it is advertised. That is to say, an offer can be represented through its name, brand, price, characteristics, and even its image, as long as all this information is found on the reference page. However, the same product can be advertised on different web pages within different e-commerce platforms; this causes us to have different representations for the same product, and, hence, we can build sets D and of representations that correspond to two different e-commerce platforms. Thus, depending on how similar these e-commerce platforms are or how much scope they have, they will come to offer, to a greater or lesser extent, identical products, being able to construct a set T of pairs of labeled offers. The problem remains the same: build a matching model from the set T that can distinguish whether two pairs of representations refer to the same product.
3.2. The Data Set
A crucial point in the solution to the PM problem is the construction of the data set. As mentioned above, the University of Mannheim freely offers unique databases for training and testing PM algorithms. In turn, these databases are obtained from the web-page repository Common Crawl (
https://commoncrawl.org/, accessed on 1 October 2021), which is a non-profit organization that collects web pages from different platforms and makes them available to the general public. However, this repository crawls a limited number of websites, none of which are written in Spanish, and is only updated once a month. As a result, the information collected is slightly outdated and does not contain websites written in Spanish or targeted toward buyers in Latin America. Therefore, it was necessary to extract product information using web-scraping tools to obtain the most current data possible and from web pages of interest.
As it is impossible to extract products for all the e-commerce stores operating in Mexico, the three most popular e-shops with a significant presence in Mexico and Latin America, which we named e-shop 1, e-shop 2 and e-shop 3, were initially selected. One was discarded because we observed that the information of most of the products did not follow any standard structure on the web page, making it difficult to gather the data with the web-scraping procedures we implemented. Then, we focused only on e-shop 1 and e-shop 2.
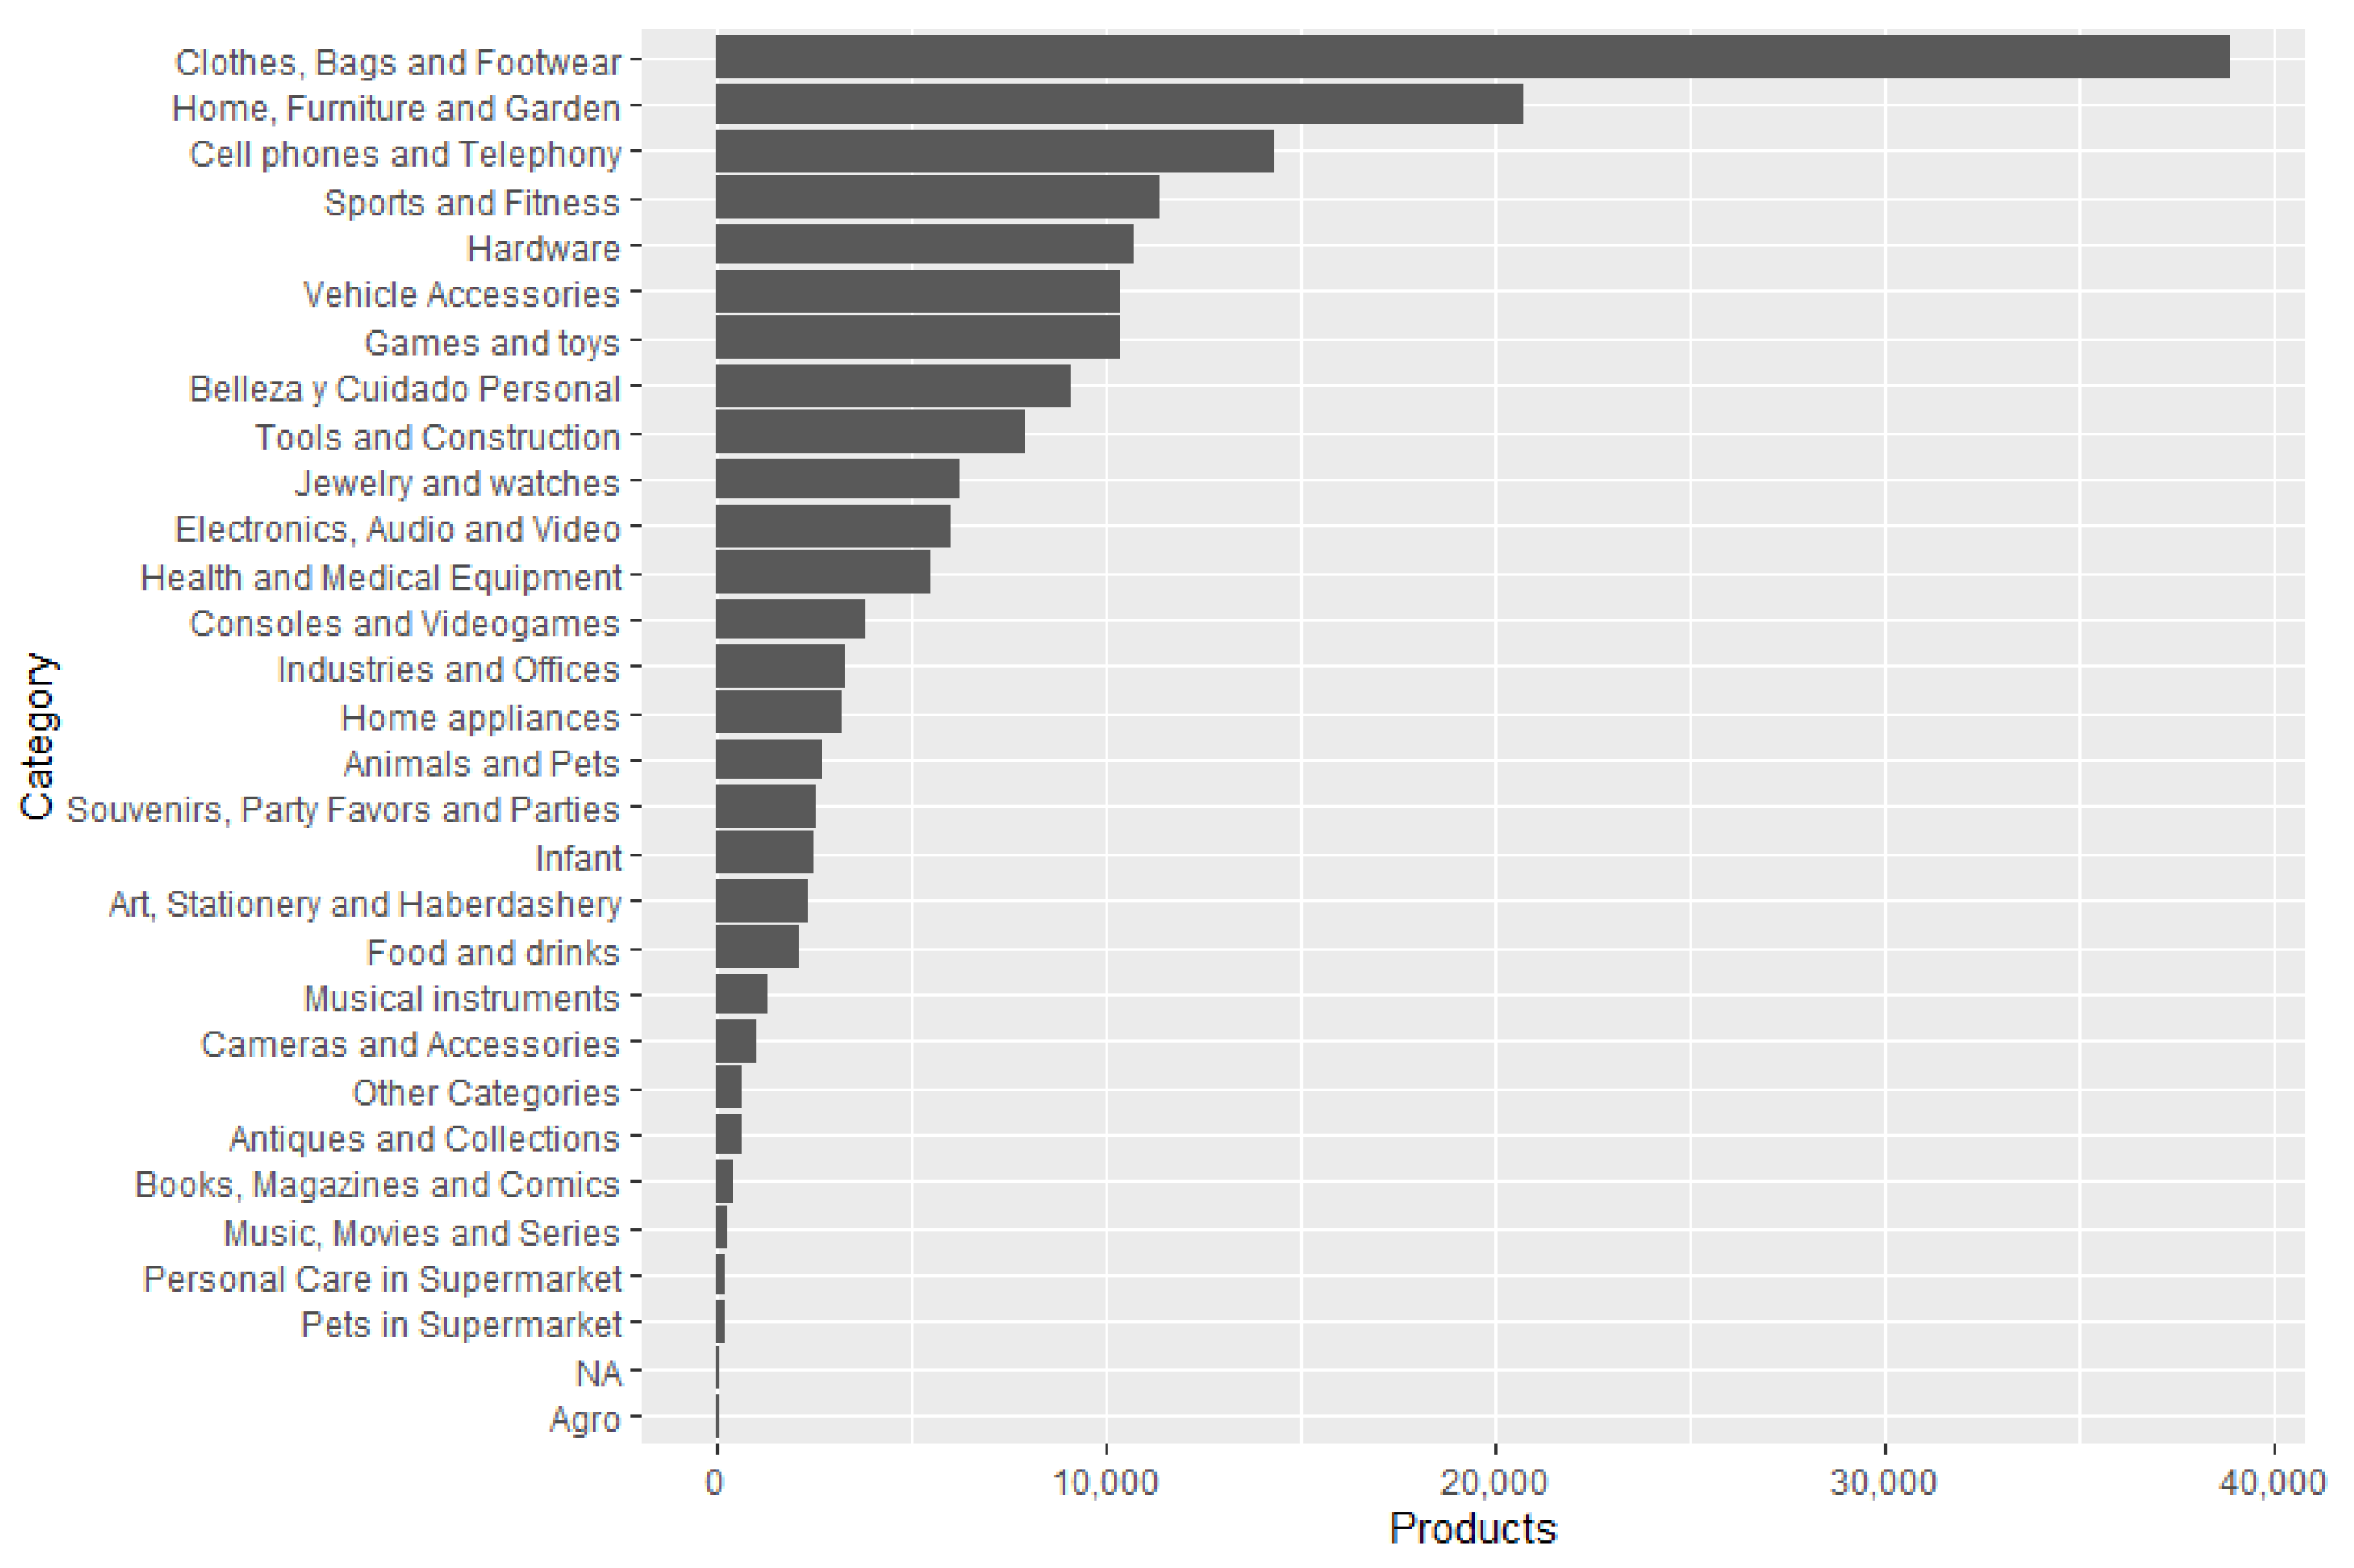
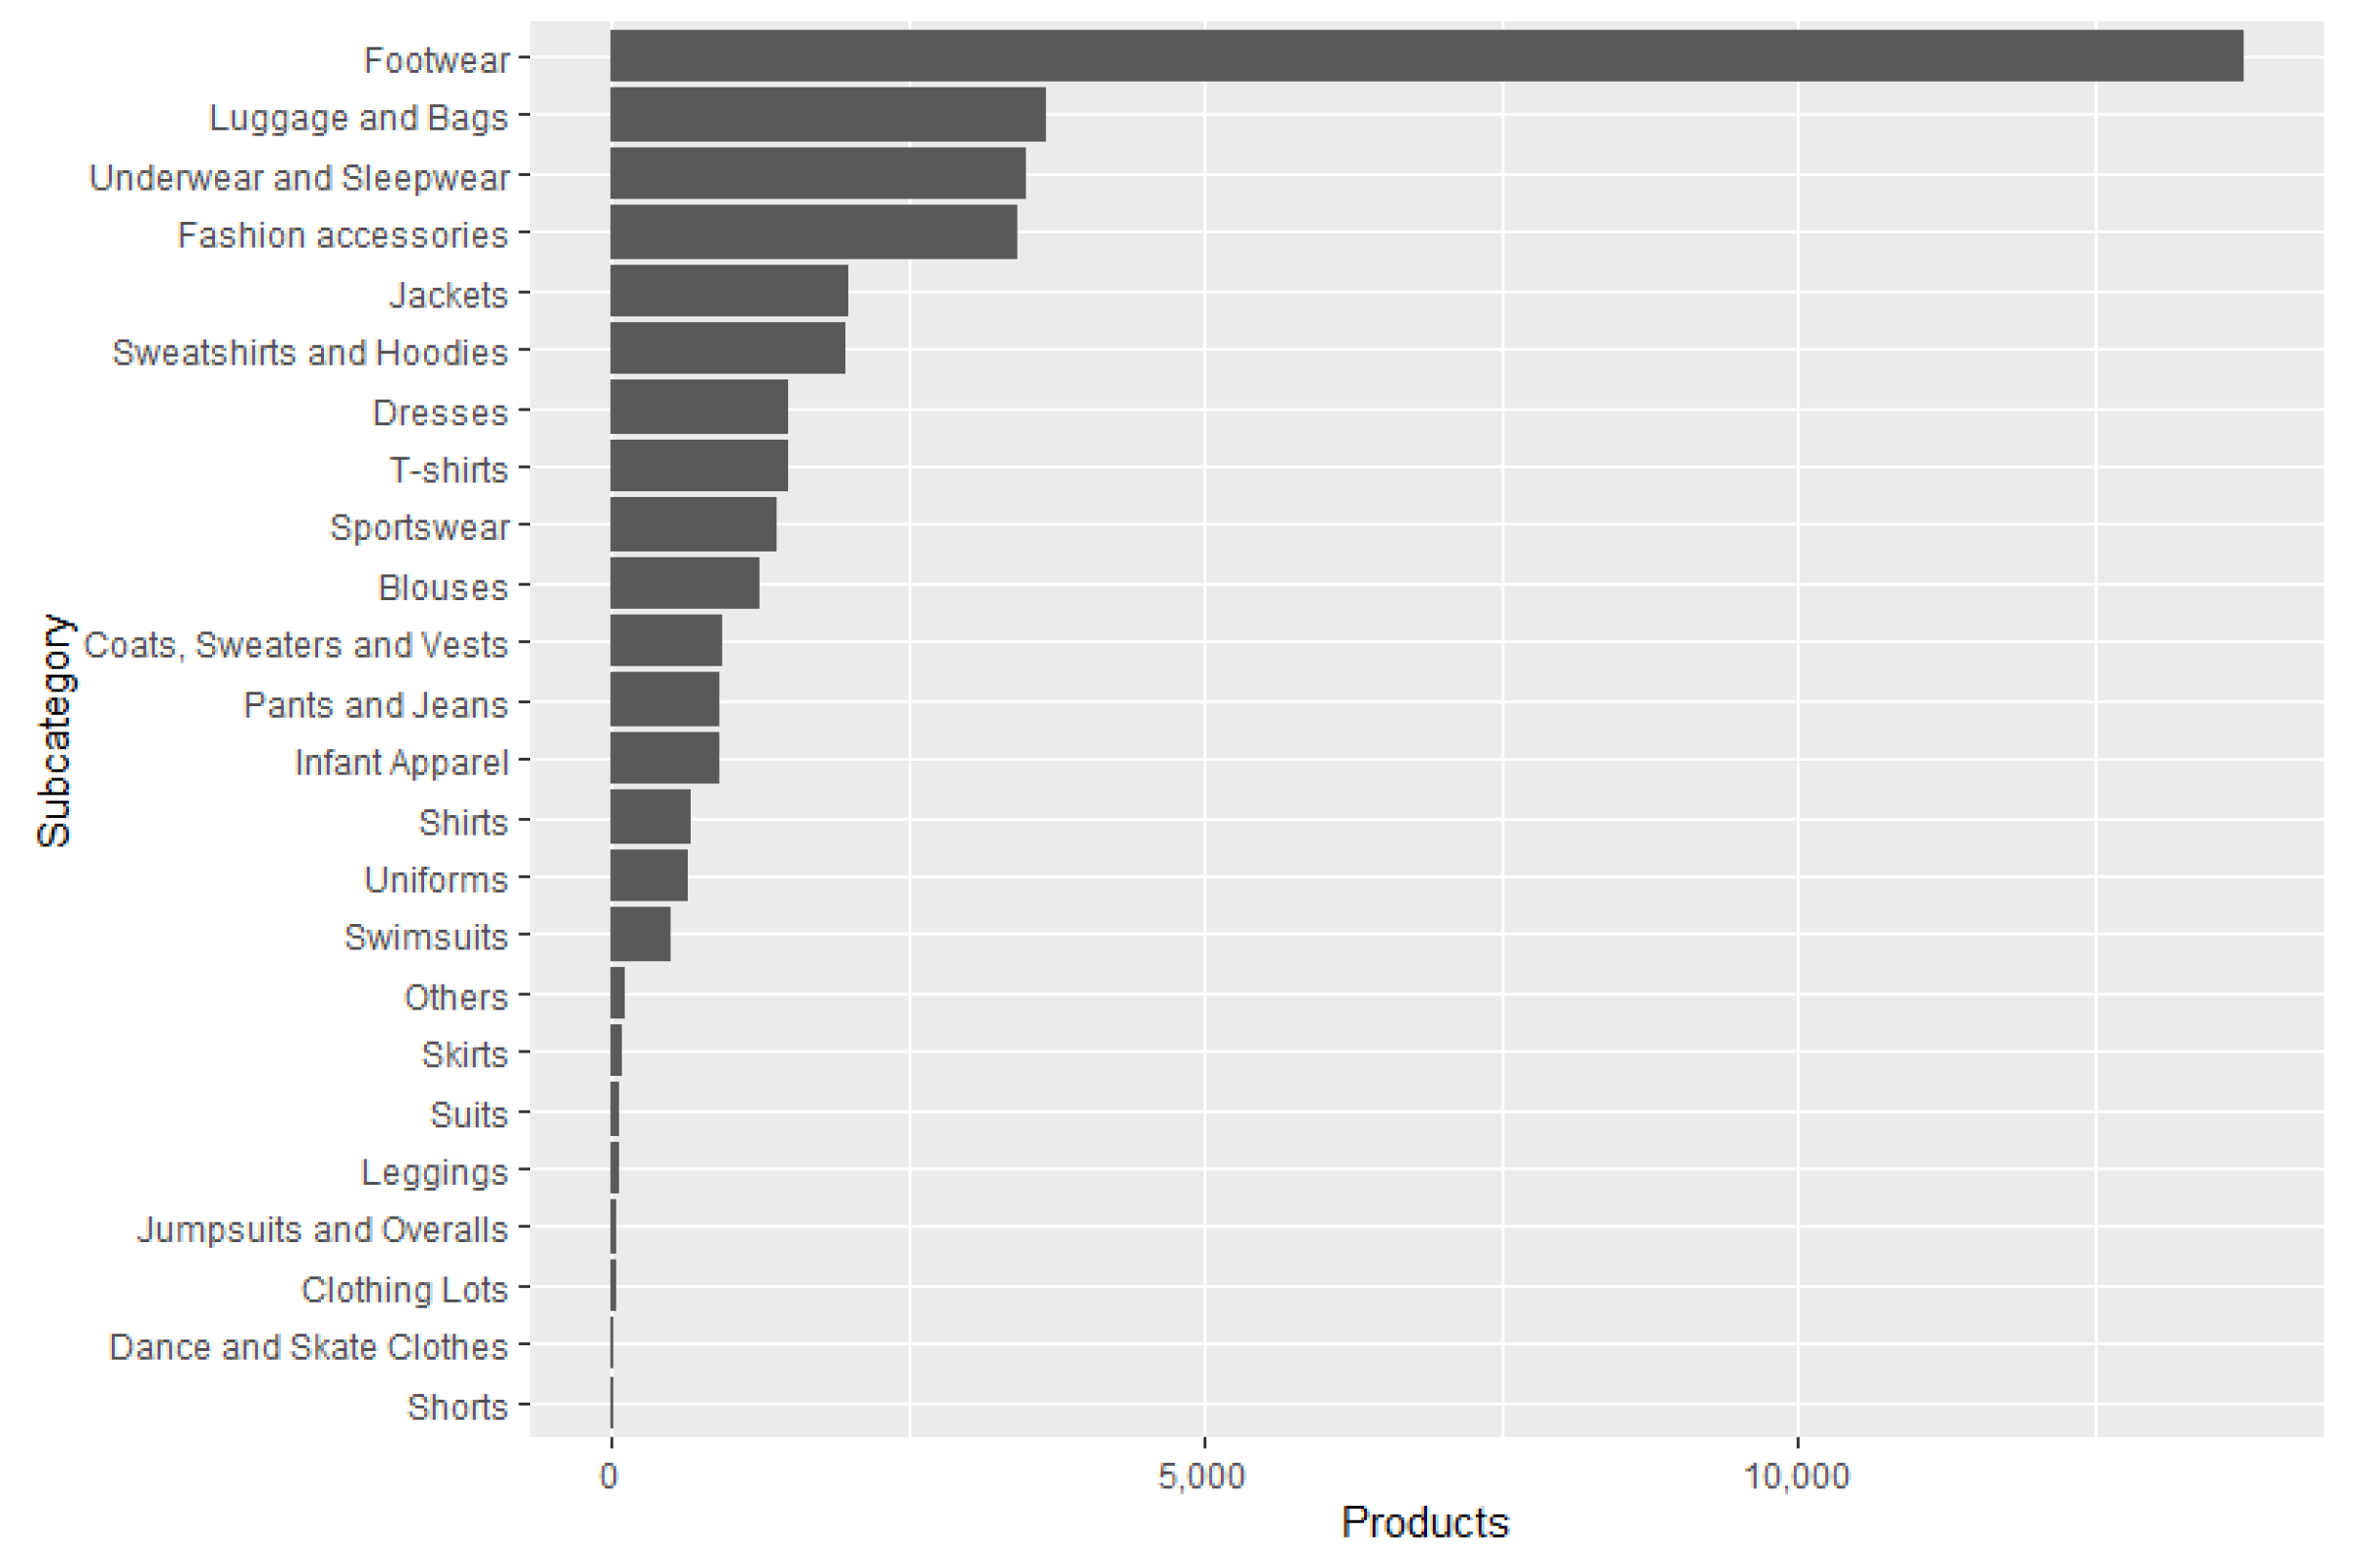
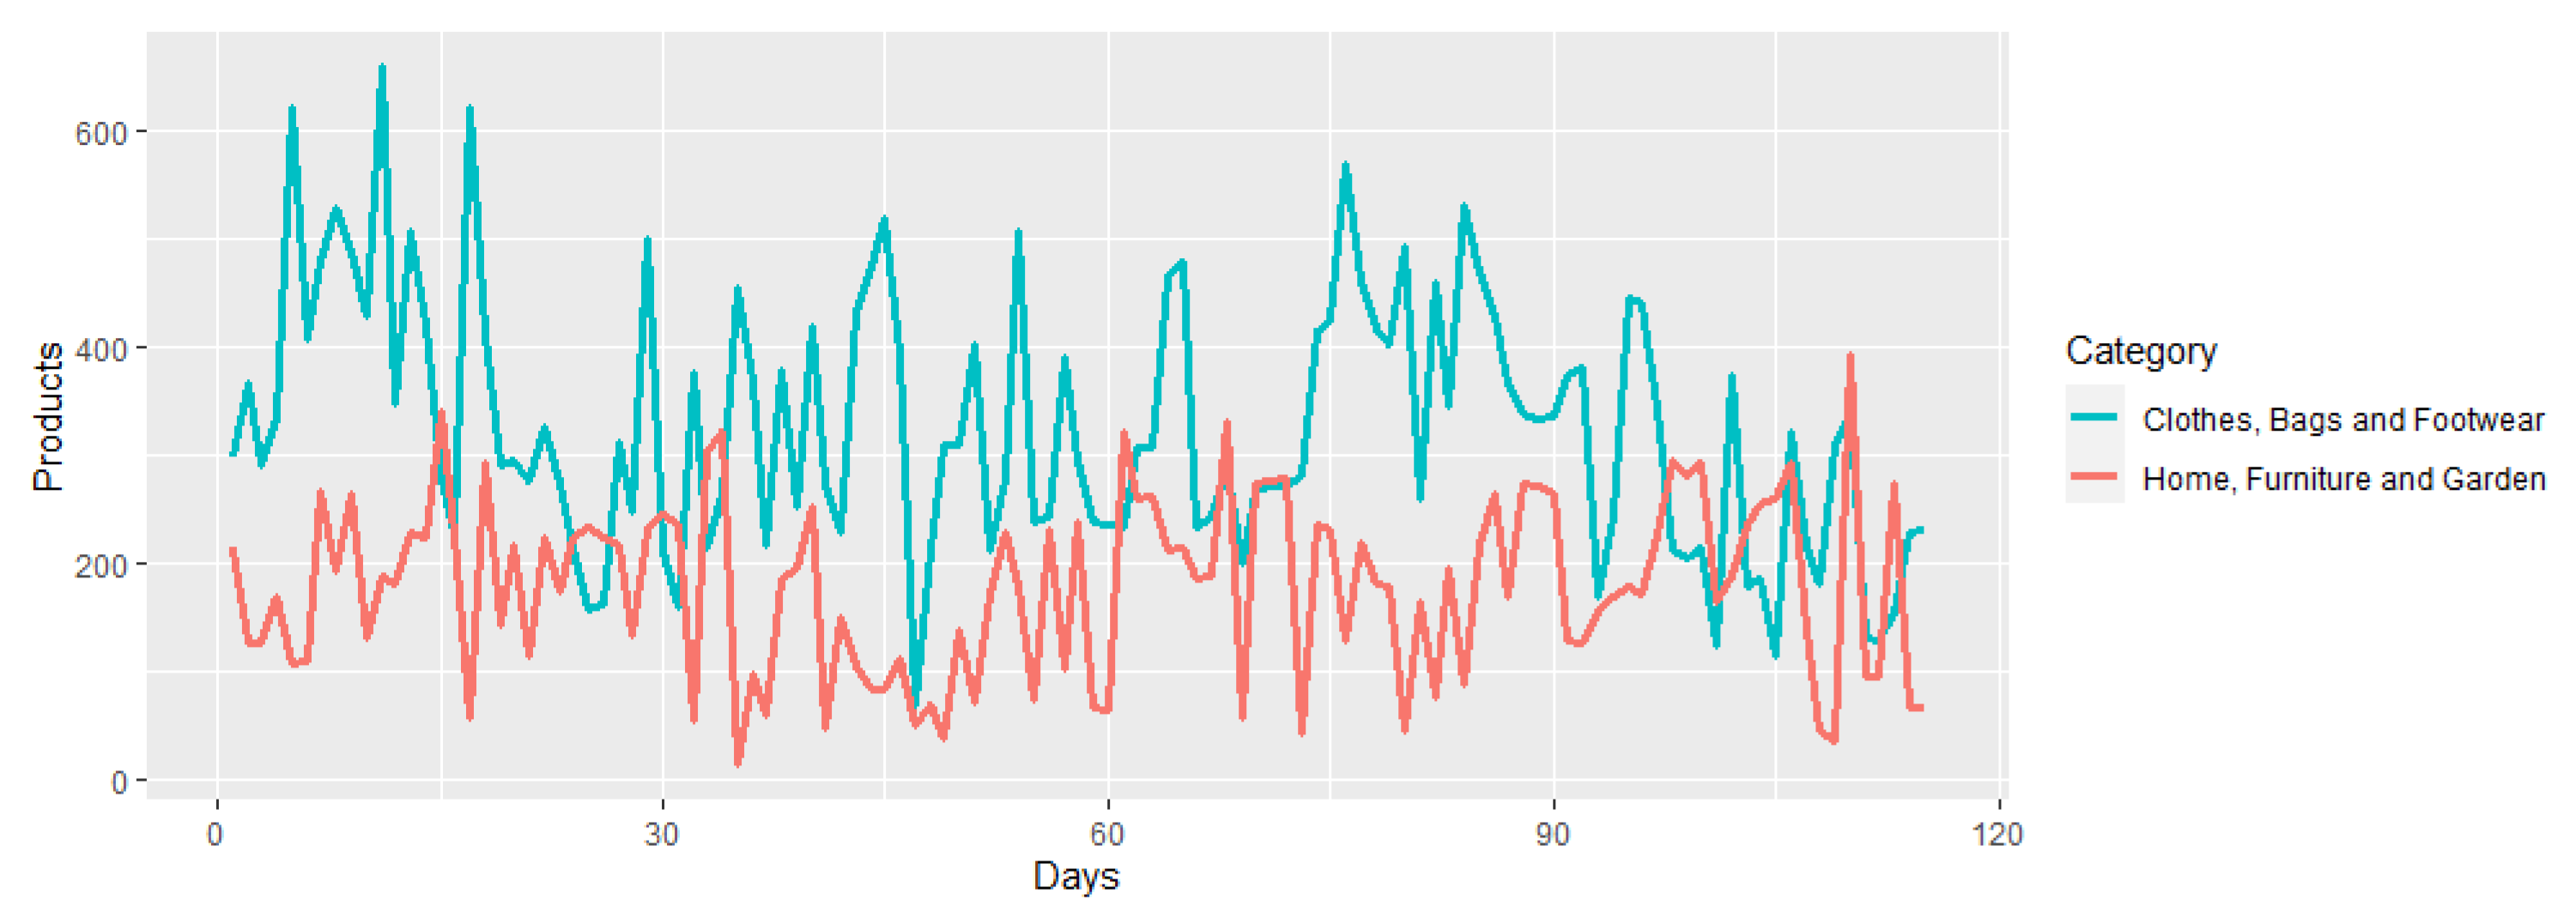
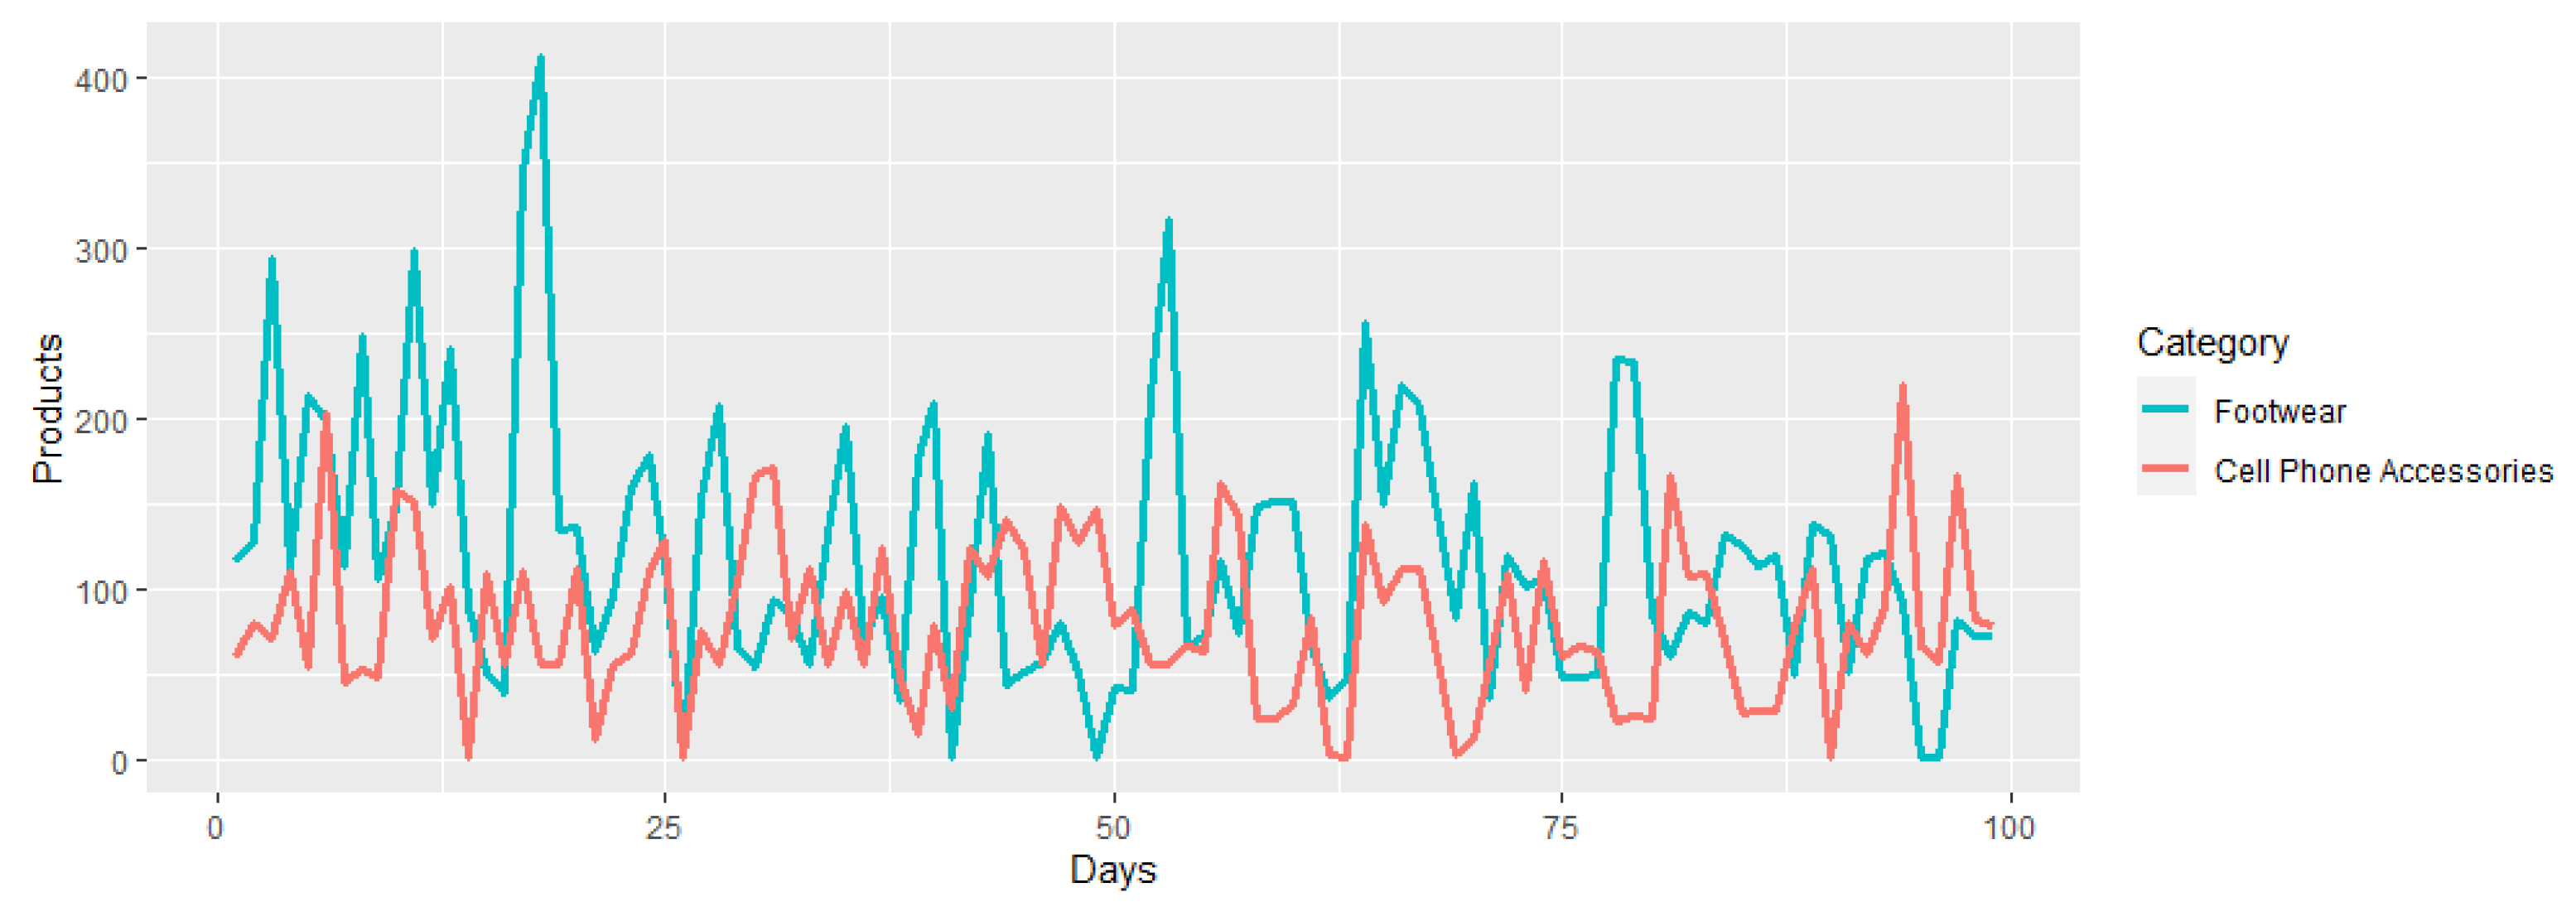
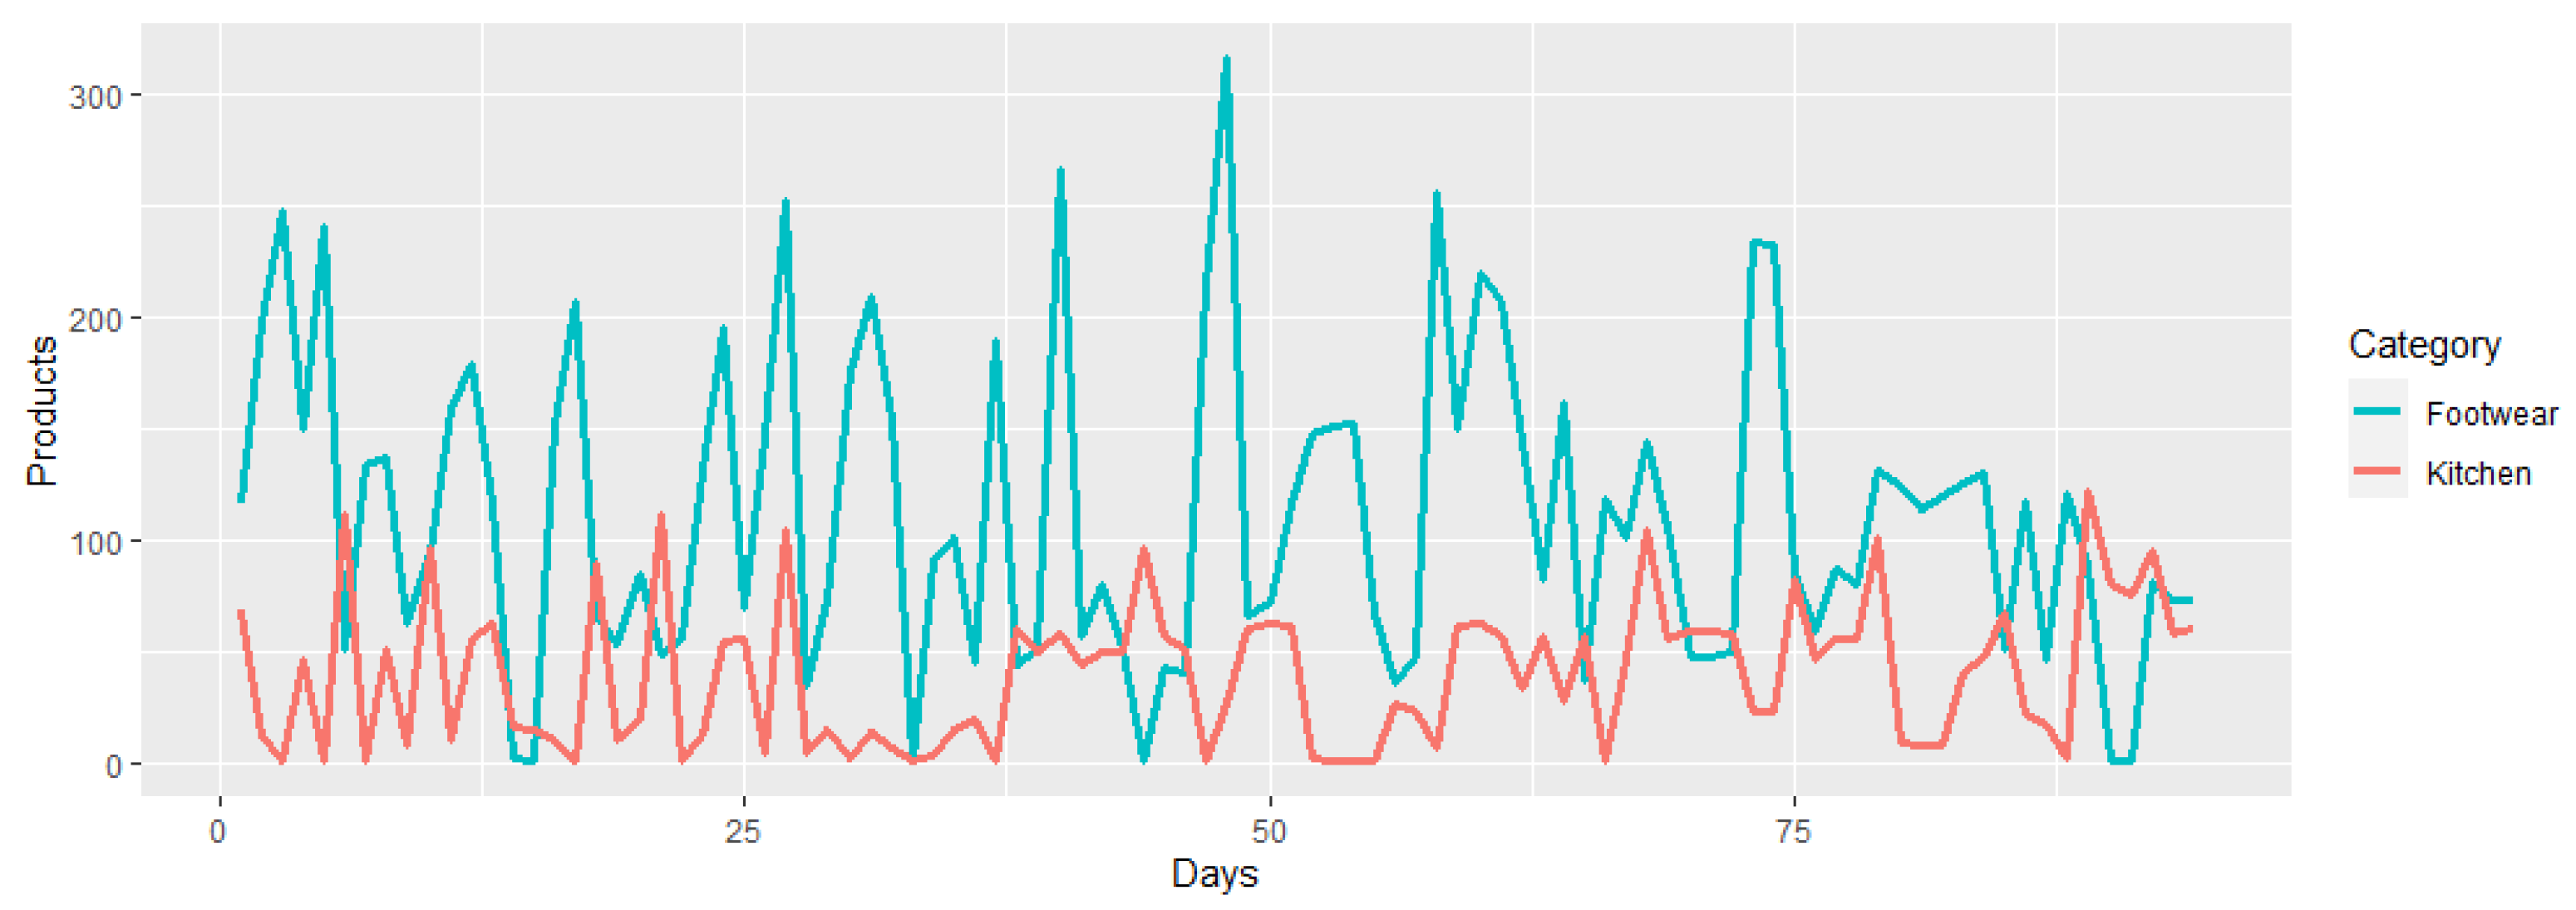
Before performing the offers extraction, a market analysis was carried out to test the EM system on the products that are most often searched for on the Internet. For this purpose, the trends page from e-shop 2 was used. This page contains a list of 40 phrases or words that were the most popular the day before the visit. Portable fans, remote control carts, and blankets for babies are some examples of these searches. Each popular target search is linked to a certain number of products so that when using the search engine of e-shop 2, the products related to the search performed will be displayed. The analysis consisted of extracting the name, price, category, and quantity of items sold from the first 50 products of each search, approximately 2000 items. This process was performed daily (although not exhaustively), from 1 September 2020, to 31 January 2021. We decided to gather and process data from footwear products based on this analysis. The details and results of this analysis can be found in the
Appendix A.
3.2.1. Pair Extraction and Labeling Process
According to the definition of PM presented in
Section 3.1, it is necessary to form the set
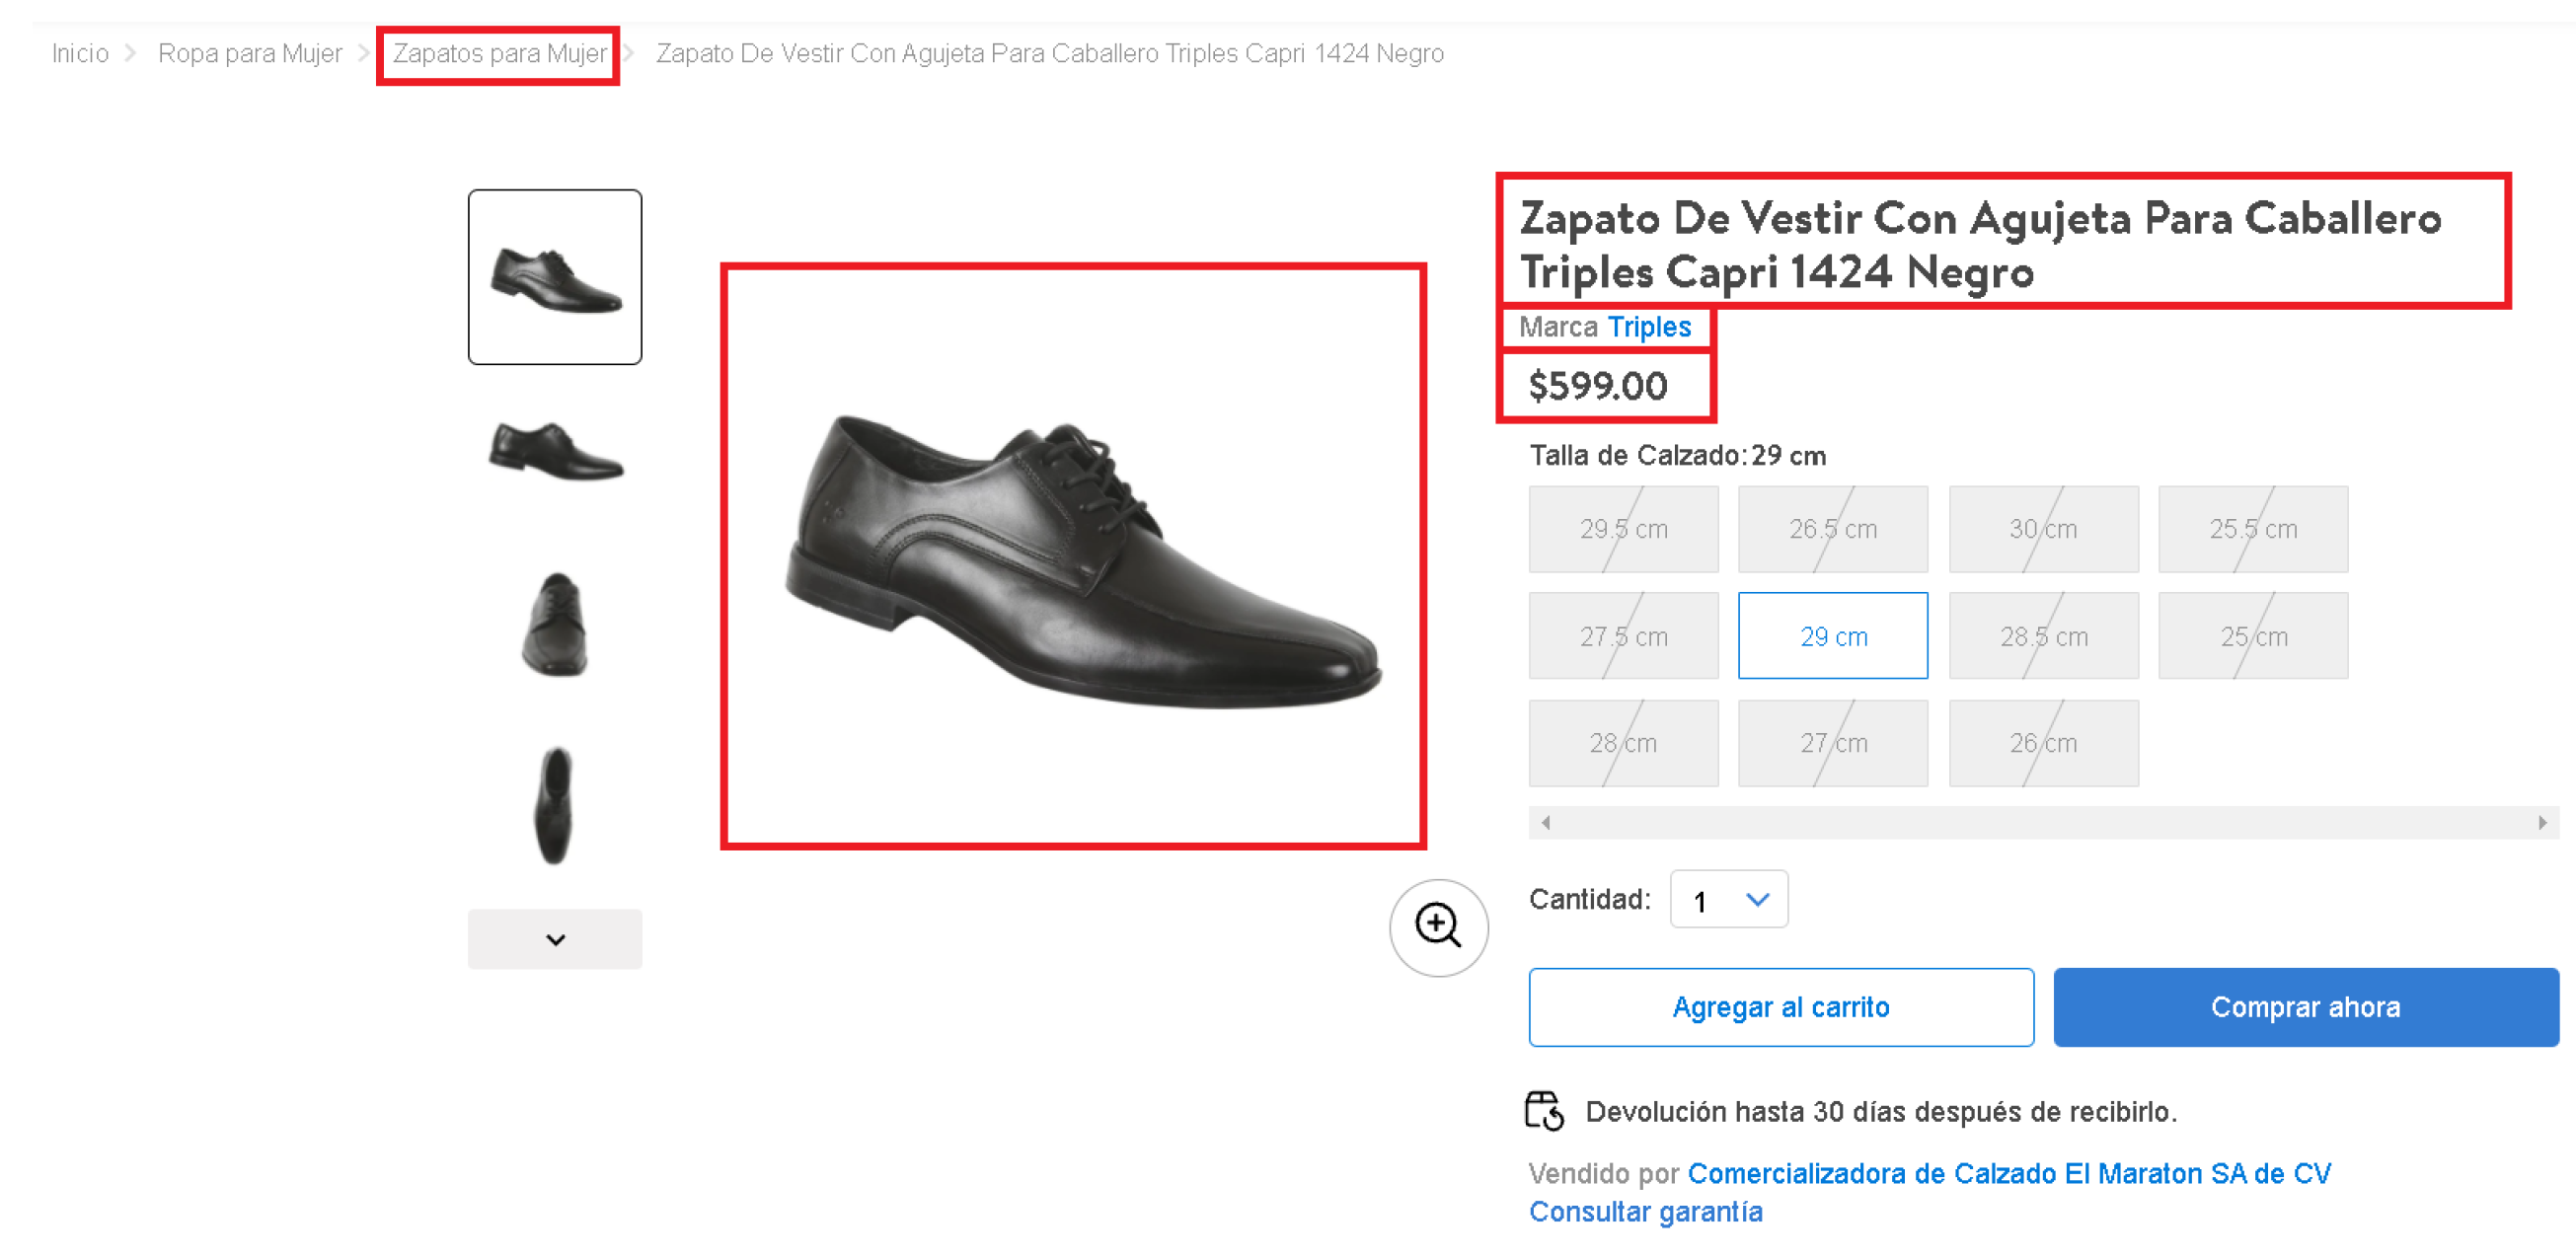
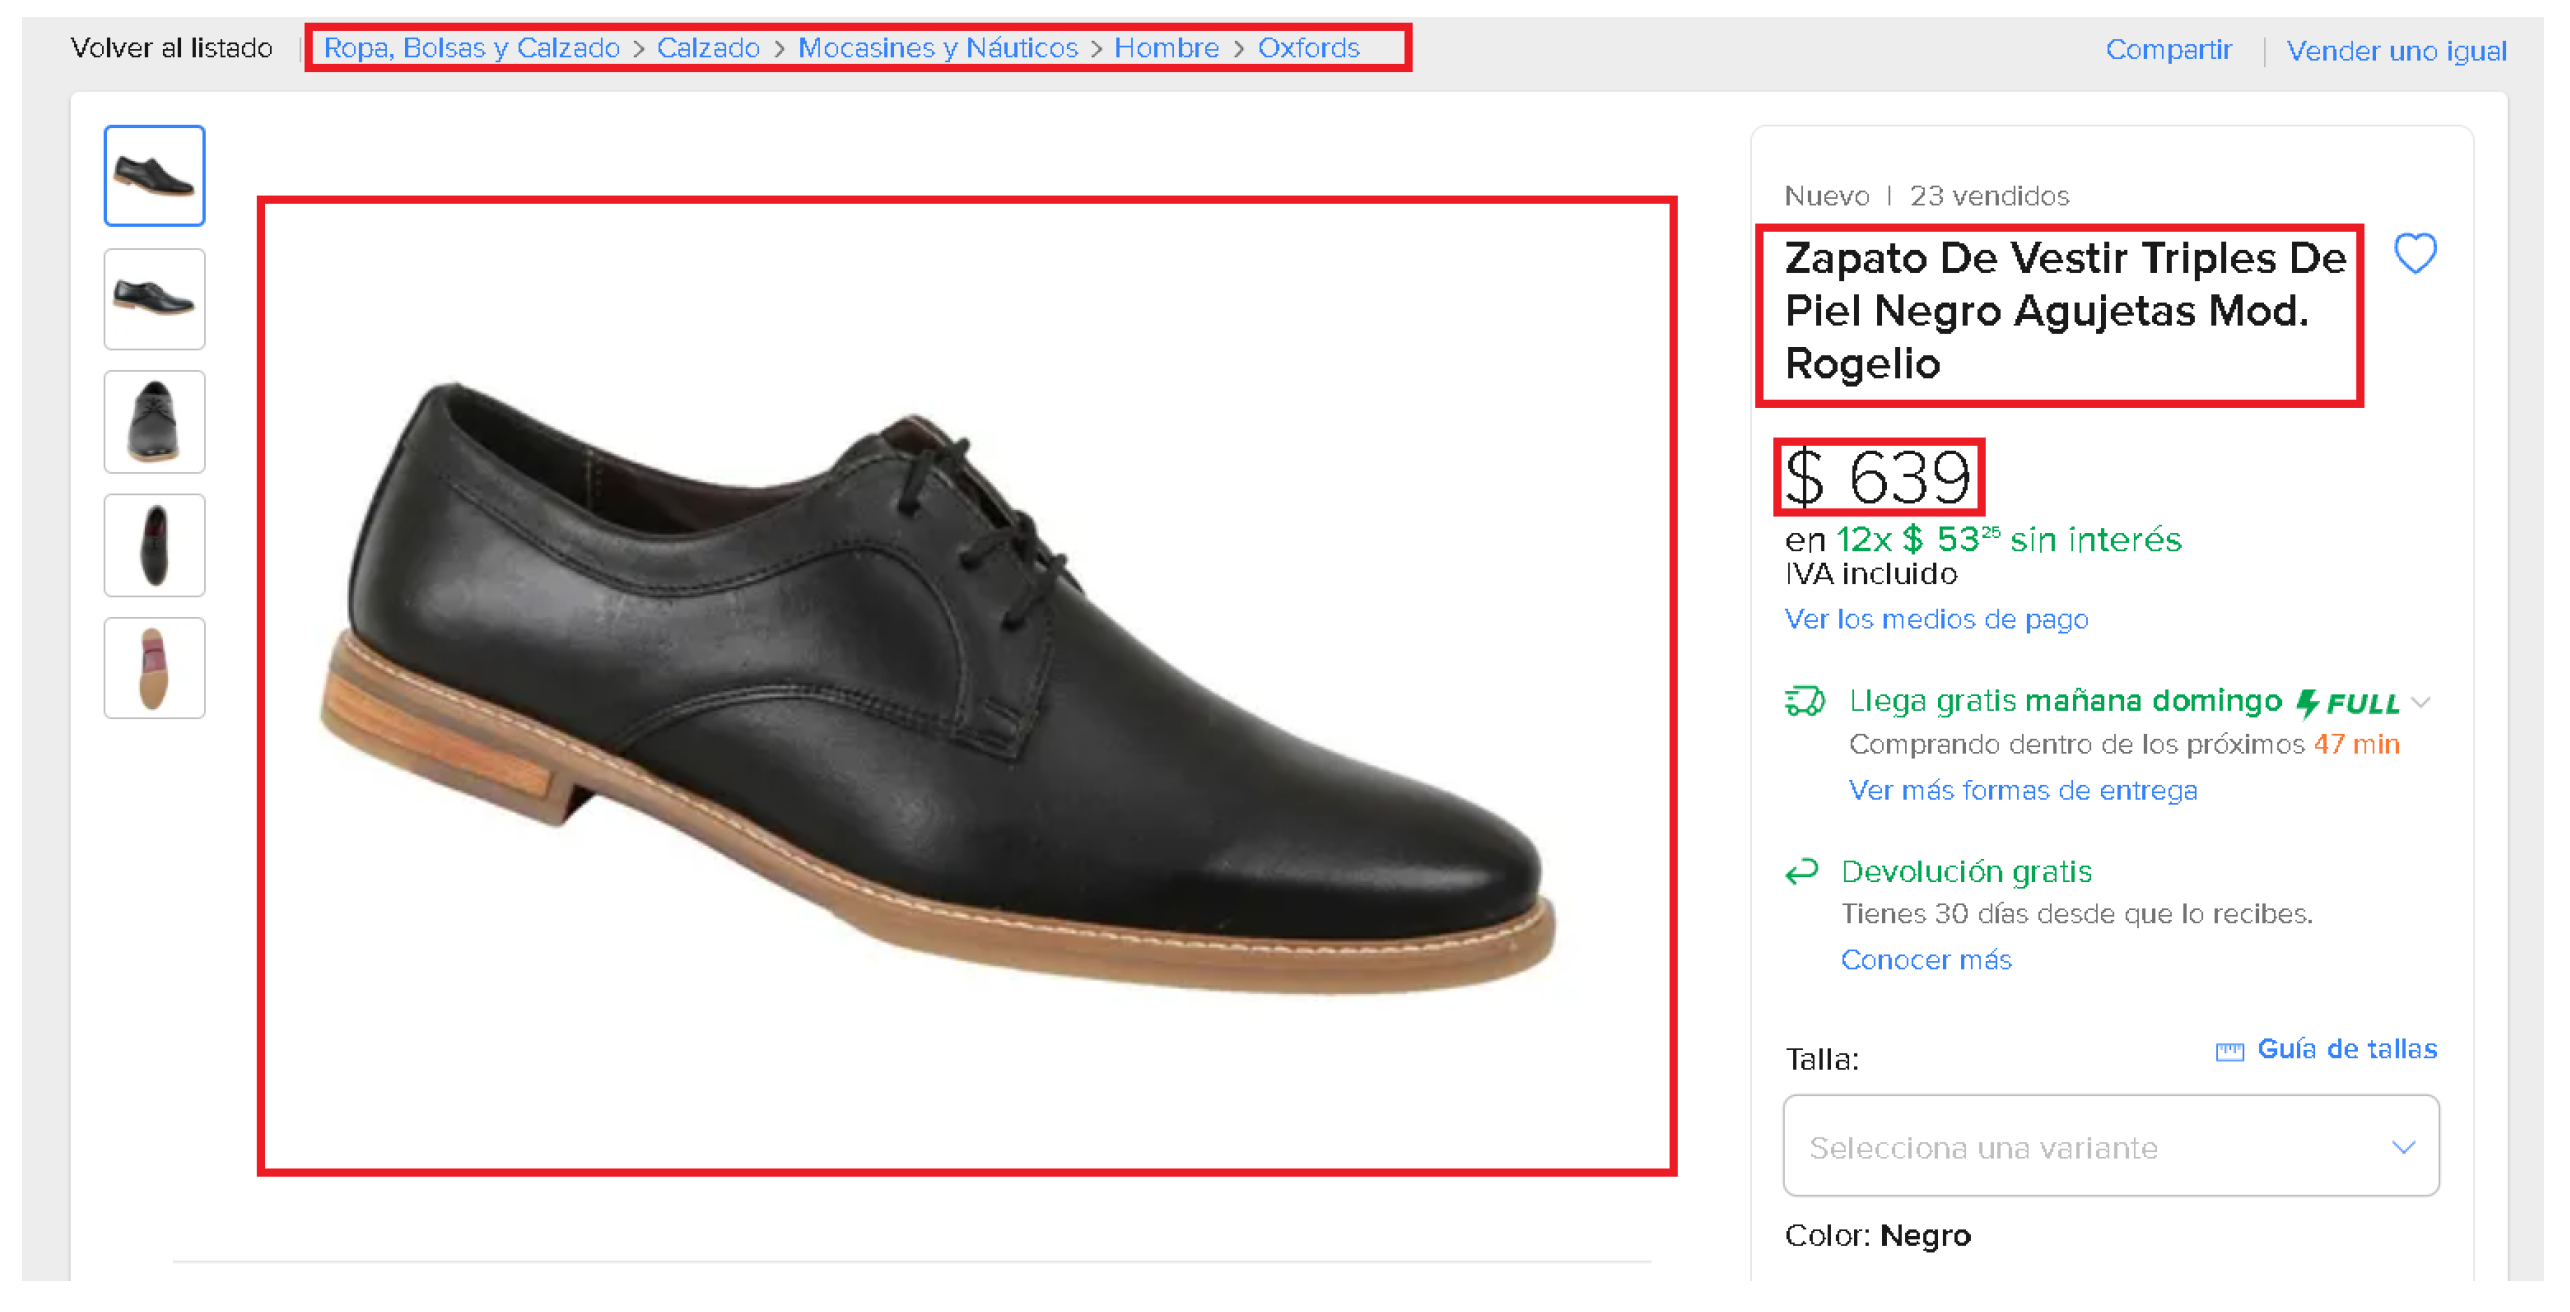
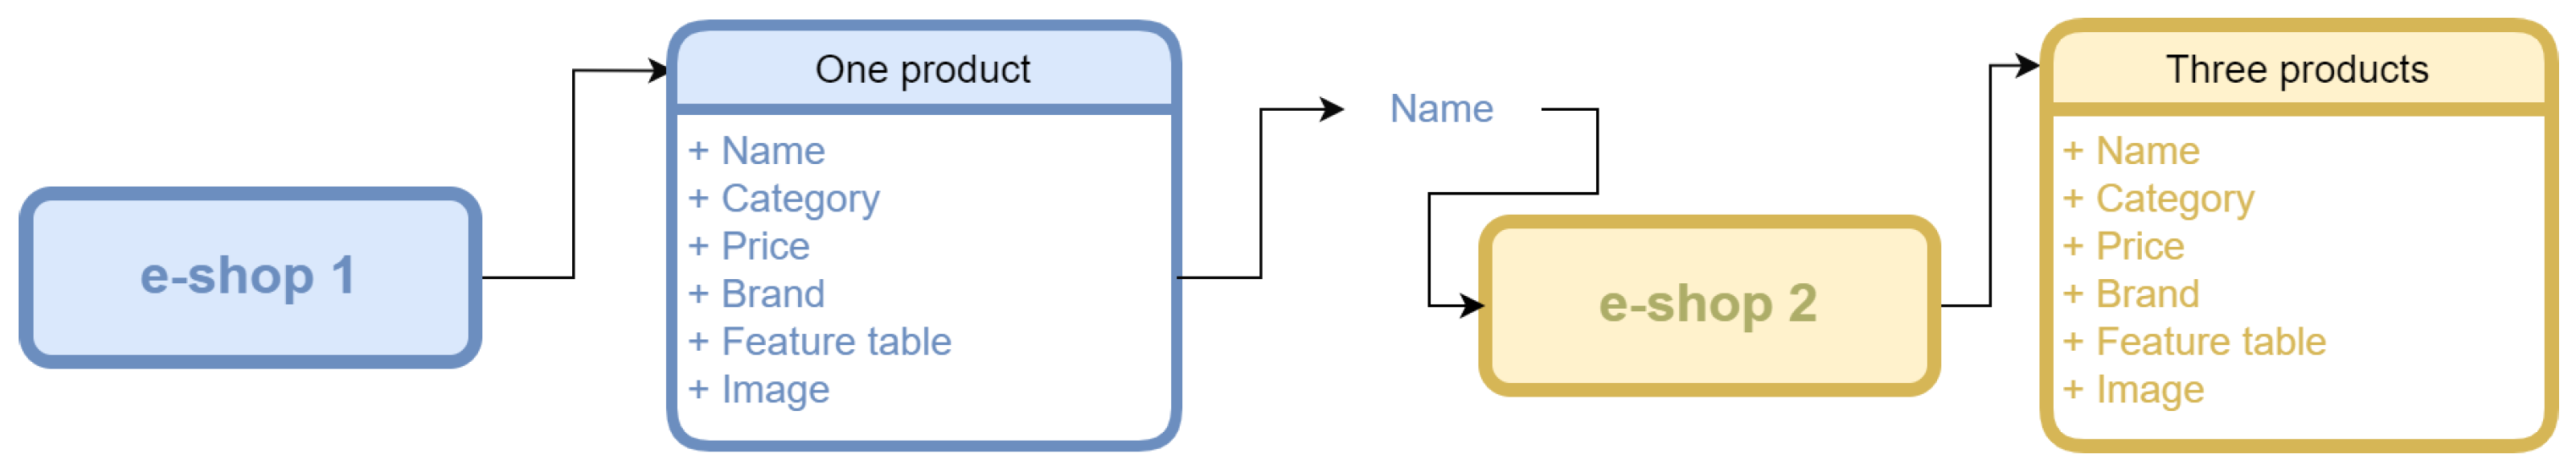
T of labeled tuples. For this, the sets of representations were constructed from offers within the e-commerce platforms. The extraction process starts from e-shop 1, extracting all available footwear items (excluding children’s footwear) from its online catalog. Due to the format of e-shop 1’s page and the information provided about the product, it is possible to extract five features: offer title, brand, category, price, and the image of the product (
Figure 1). Once the entire e-shop 1 catalog is extracted, the title of each of the offers is used as a query to search for the product in e-shop 2 (
Figure 2). From the search results, the first three matches are extracted with the same features as the query product from e-shop 1, as is shown in
Figure 3. As a result, we have pairs of entities with two modalities of data: text (title, brand, category, price) and the product’s image.
Data extraction was performed with the programming languages R and due to the benefits of both languages for certain tasks. In the case of R, the web-scraping package called rvest was used, in addition to the tidyverse set of libraries. For , web-scraping was carried out with the Selenium library, which, although it is not a package designed for web-scraping, is useful for this purpose because it can help us to display menus that do not appear when parsing the html with other packages.
The set
T has a label associated with each pair of offers. This label is already included in the databases designed for the PM problem; however, they are not available in this case, and the only way to obtain them is by manual labeling. This results in the set
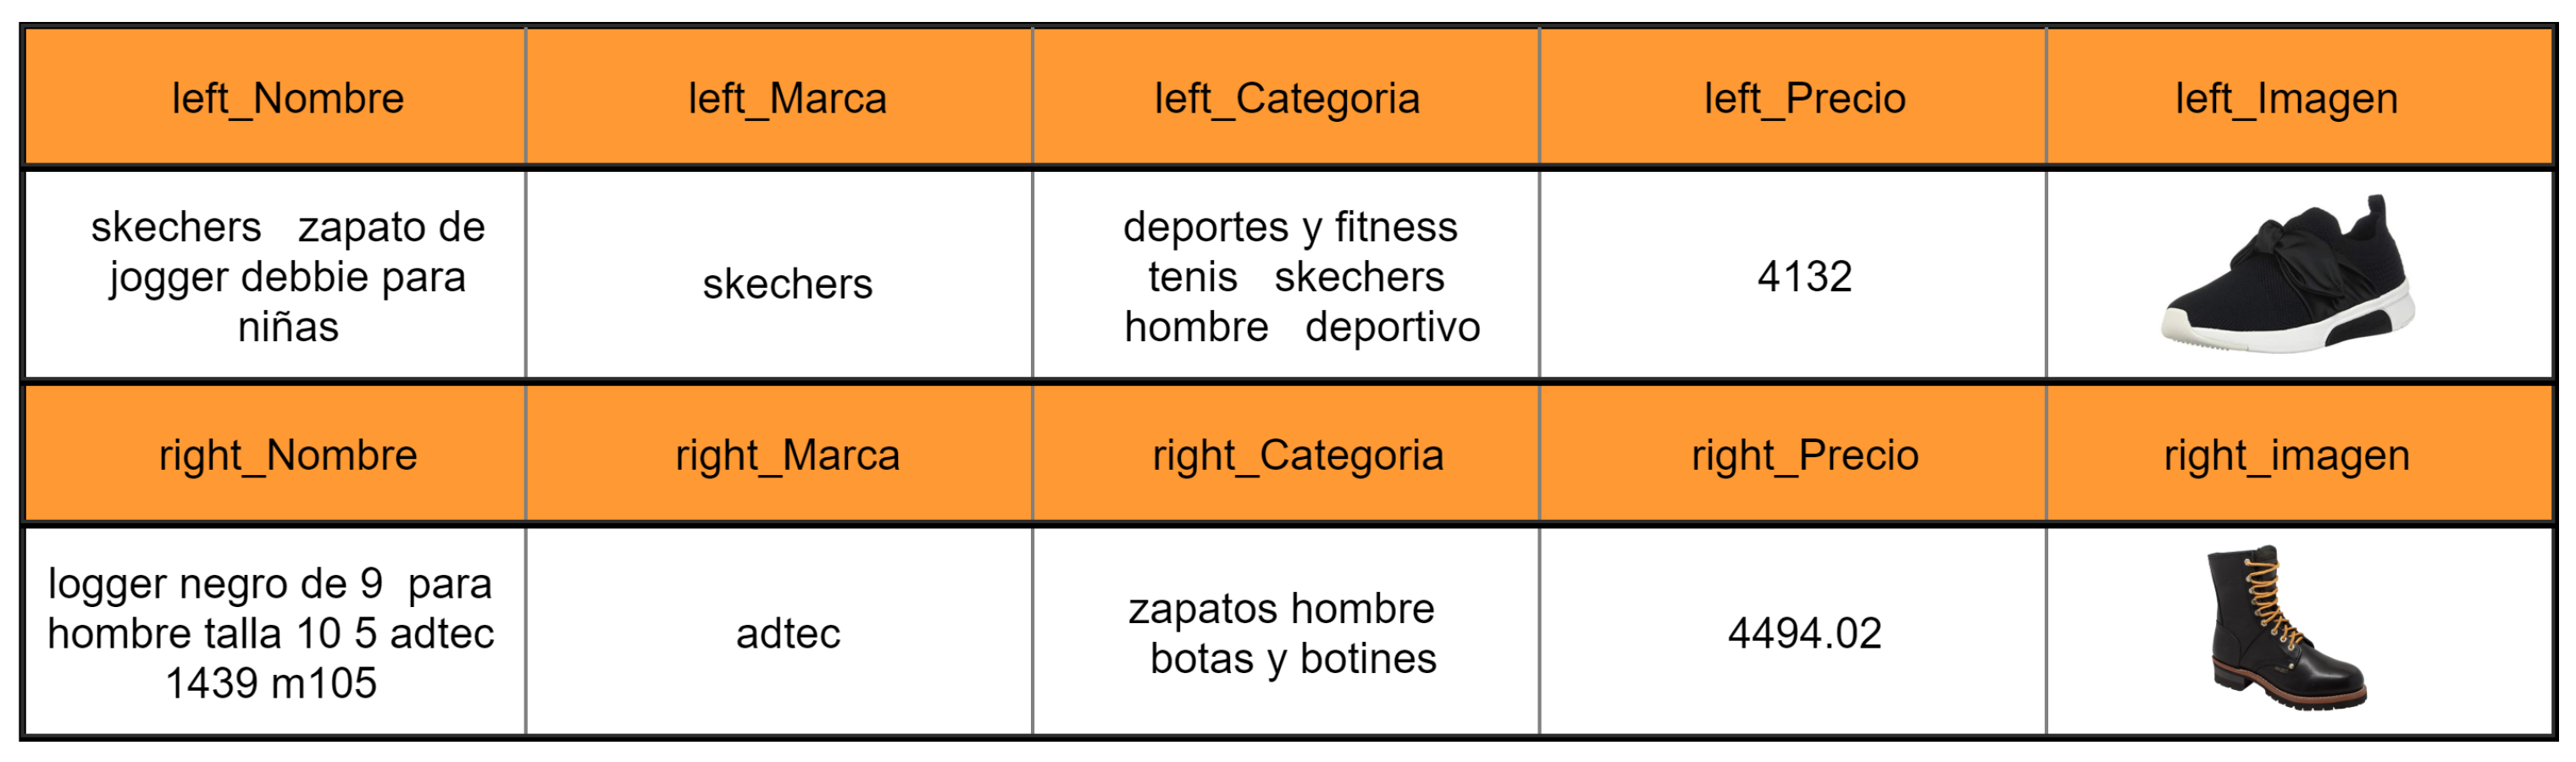
T, a database in which each element is a pair of representations accompanied by a label. These representations include structured and nonstructured data: name, brand, category, price, and image.
Figure 4 shows a representation of the elements of the database. The set
T contains 3489 pairs of products, from which 941 are positive (i.e., correspond to the same product) and 2548 are negative. Then, we have an unbalanced data set. To use this database in the labeling algorithms, a partition must be performed to create the training, validation, and test data sets. However, because the categories are unbalanced, the partitioning of the sets will have to preserve the same proportion of classes within each set. For this purpose, stratified sampling was performed with 60%, 20% and 20% for the training, validation and test sets, respectively.
3.3. A Multimodal Approach
Having defined the PM problem as a binary classification task, we aim to take advantage of two modalities of data (text and images) related to the pairs of entities, as described in
Section 3.2.1.
Although there are many advantages to incorporating more channels of information into our data through their different modalities, more data are also a challenge. In classification tasks, two key aspects of multimodal data are representation (or encoding) and combination. We will describe each briefly.
3.3.1. Feature Extraction and Encoding
In this part, the goal is to obtain useful vector representations of the different modalities of the data prior to the fusion and classification process, capable of capturing the main features they possess. Arguably, this is the most challenging part, given the complex nonstructured nature of the data. Modern approaches are based on deep encoder or encoder–decoder neural networks pretrained on large data sets for transfer learning in specific tasks [
45].
3.3.1.1. Image Modality
Particularly for images, CNNs ([
46,
47,
48,
49]) are popular models for feature extraction and representation. There are a wide variety of pretrained CNN architectures [
50]. We used a CNN with the ResNet50 architecture [
51], pretrained on the ImageNet classification data set [
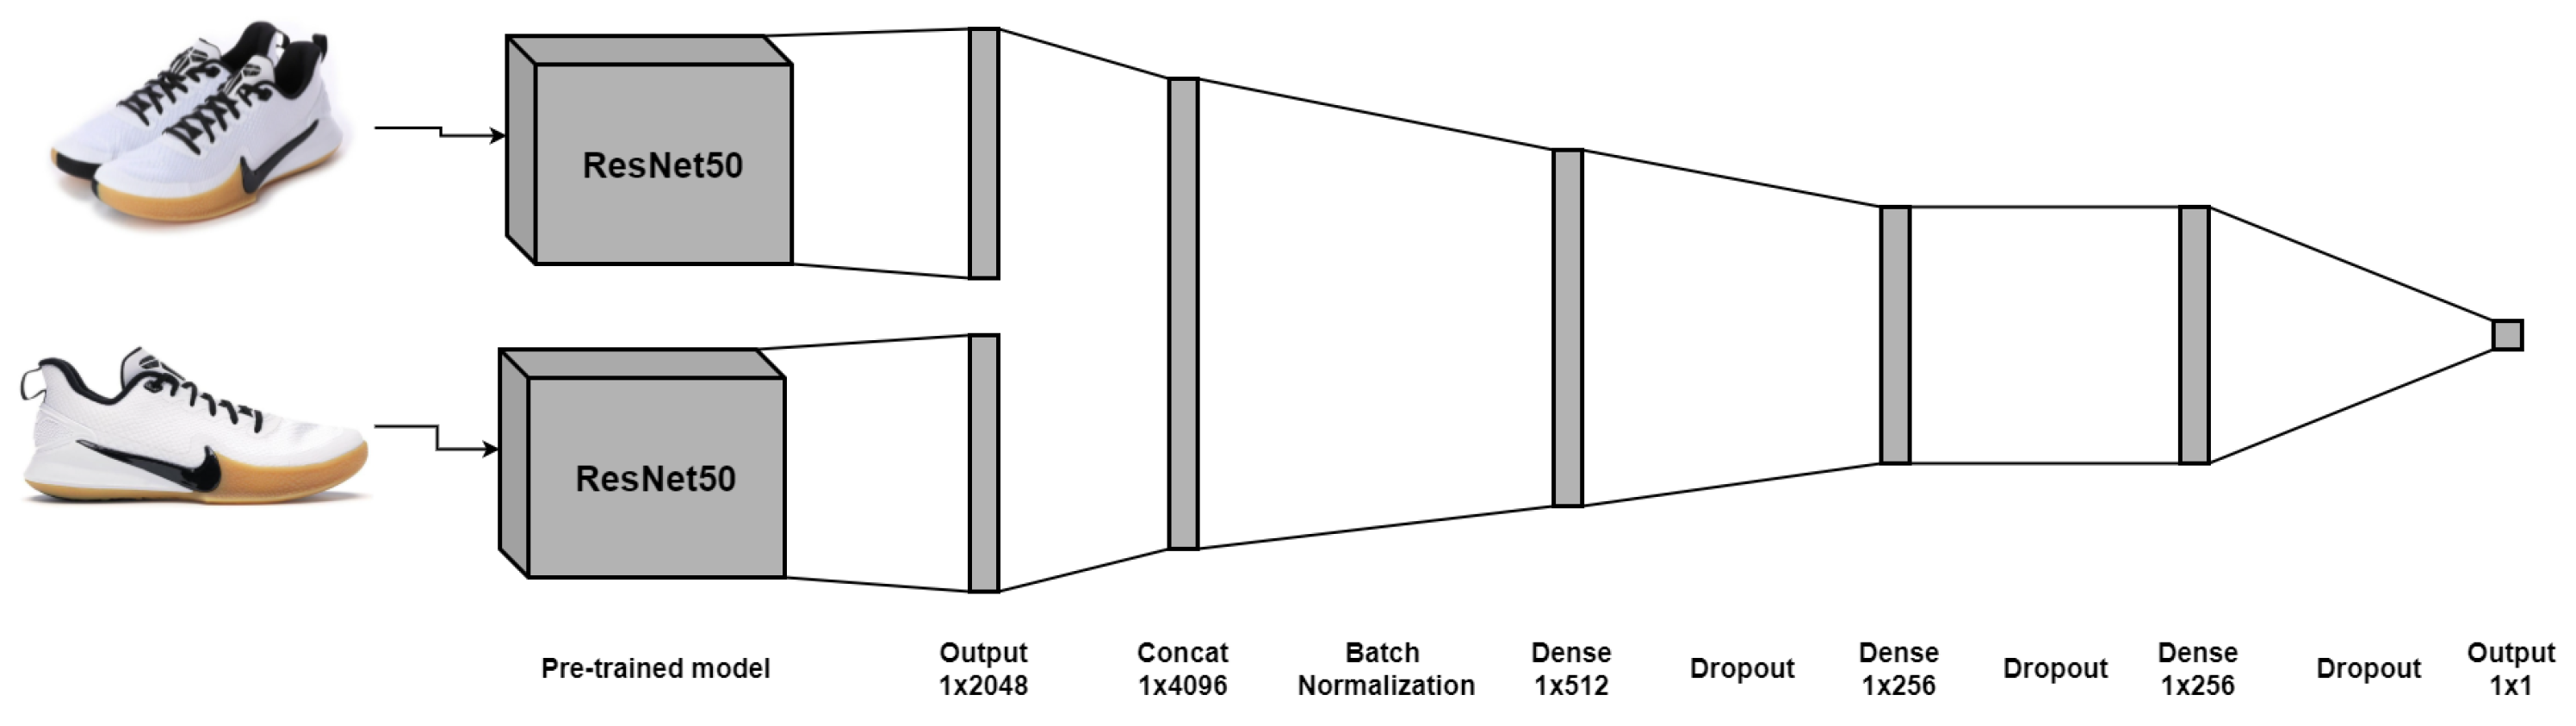
52], which has shown remarkable results in several competitions and has shown a good generalization performance. The input for the encoding process on this data modality consists of pairs of images of the products. The output will be an embedding for each offer that encodes the images’ information based on their similarity. Based on that, two encoding architectures are proposed:
2-CNN architecture: The embeddings of both images are concatenated to form a single embedding. After this, it is connected to a series of regularized dense layers, whose output is a binary classifier that identifies if the images correspond to the same product. This architecture is shown in
Figure 5.
image-Siamese: This architecture is based on a Siamese network similar to the one shown by Ralph Peeters [
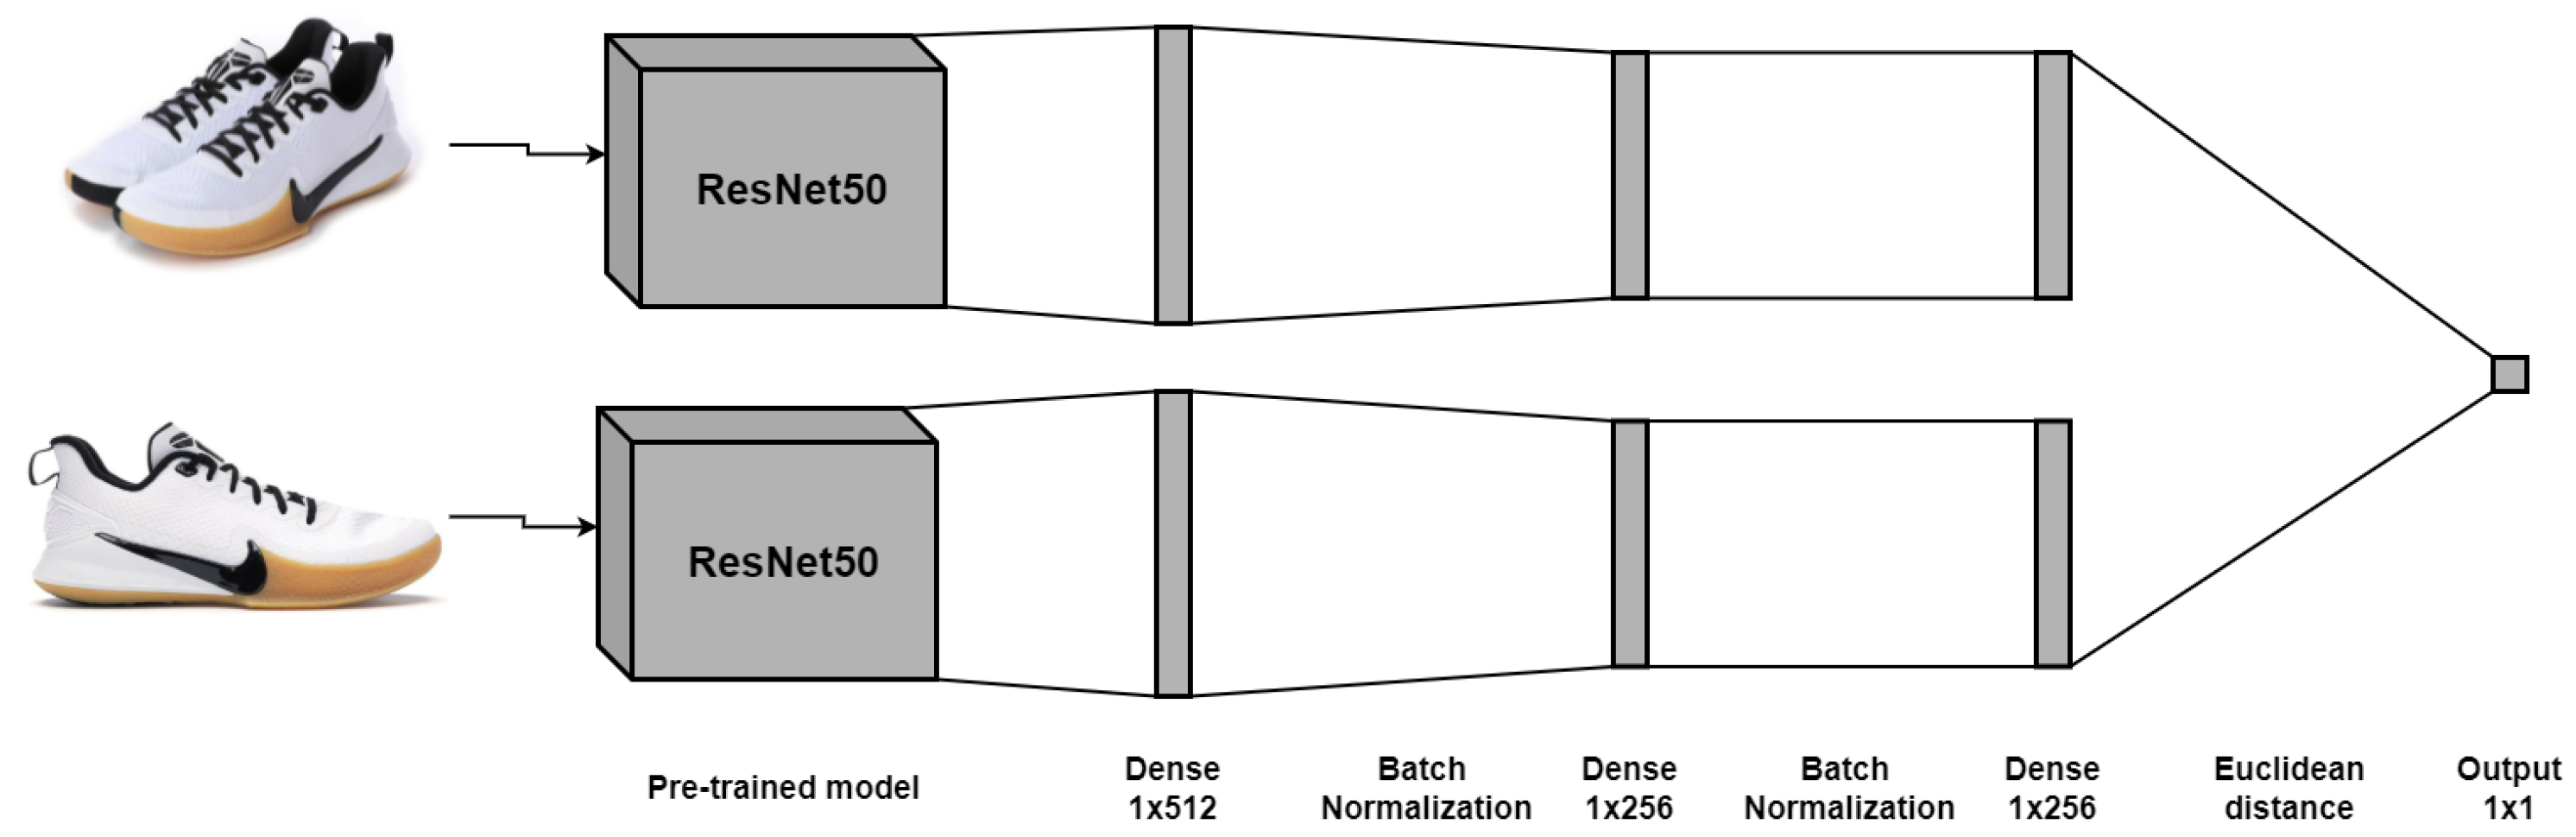
34]. In this case, the embeddings are created for each image from the connection between the pretrained CNN and the Siamese network consisting of regularized dense layers. Subsequently, a binary classifier is computed based on the Euclidean distance obtained from the final embeddings of the input images given by the Siamese network. The structure of the network is shown in
Figure 6.
It was decided to use these two models because, on the one hand, CNNs are the most popular and efficient when it comes to image-related tasks. On the other hand, Siamese networks are used explicitly for image similarity recognition. Both architectures are very different; in the first one, a single embedding is obtained, and, based on its values, a label is assigned to the embedding. In contrast, the Siamese network creates new vector representations for each image, and then a label is assigned to indicate if they are the same products, based on the distance of their embeddings.
3.3.1.2. Text Modality
There are several options to obtain vector representations capable of modeling similarities between the textual descriptions of the products. A popular encoding approach is based on the occurrence of words in documents (in our case, textual descriptions), such as the vector space model [
53] or TF-IDF ([
54]). Here, the vector representation is obtained from a term-frequency matrix, where documents are vectors with lengths equal to the size of some predefined vocabulary. These representations are easy to obtain and have proven to be very efficient in some NLP-related tasks such as text classification [
55], where even CML models perform better than sophisticated models or some ensemble of CML and DL models with TF-IDF [
56]. Additionally, this encoding approach allows some interpretability in the sense that each entry of the encoding vector is related to a word in the vocabulary (row vector of the TF-IDF matrix) or a document in the corpus (column vector of the TF-IDF matrix), which makes it very useful for information retrieval tasks [
57] or feature selection [
56]. However, there are some drawbacks due to the high dimensionality and sparsity of the embedding vectors, and it is impossible to model relevant language characteristics, such as the sequential order of the words or semantic properties. Particularly for classification tasks based solely on text information, some studies suggest that the performance of the different word and document representations are highly dependent on the characteristics of the documents, that is, the number of tokens, size of the data set, and unbalance of categories [
58,
59], in that these characteristics are even more critical than the classifier itself. Still, for some DL-based classifiers, the data set size is crucial [
56]. In recent years, word embeddings based on probabilistic language models have been building blocks of many SOTA models for various NLP tasks. They are dense vector representations of a predefined length and are capable of modeling complex properties of the semantics of words, such as polysemy, synonymy, and antonymy, among others [
60]. Nowadays, word embeddings based on neural network language models are the preferred approach [
31,
61,
62,
63], particularly, contextualized word embeddings based on deep neural networks [
64,
65] have shown the best performance. Another advantage of word and document embeddings is the ability to perform transfer learning and fine tuning, which somewhat alleviates the problem of small data sets, as in our case.
Without a doubt, contextual word embeddings based on the transformer architecture [
66] such as BERT [
65], RoBERTa [
38] or DistilBERT [
39] are the SOTA for many NLP-related tasks. As they rely on self-attention mechanisms, these approaches allow us to obtain interpretable models, where we can find insight into which tokens are relevant for the given task. This is why we decided to use BERT embeddings as the encoding method for texts. Certainly, simpler document representations such as TF-IDF might give us the same or better results for the PM task than BERT embeddings if we only consider textual information. In our case, this is only one modality of our data, and our main objective is to exploit image and text representations. Therefore, we decided to use the best representation reported in the literature for most NLP tasks. However, a comparison of the different text representations (including other contextual embeddings, such as ELMo [
64], DistilBERT, etc.) on a multimodal setting is very interesting, as is the combination of other DL classification algorithms different from dense layers, such as convolutional, LSTM-based or GRU-based neural networks. These options, suggested by a referee, will be considered as future work.
BERT (bidirectional encoder representations from transformers) is a language model pre-trained on Wikipedia’s BookCorpus [
67] on two main tasks: masked language modeling (MLM) and next sentence prediction (NSP). We used the latter. In this task, the input consists of two text sequences with the following format: [CLS] Text 1 [SEP] Text 2 [SEP]; where [SEP] and [CLS] are special tokens denoting the start and separation of the text sequences, respectively. In our case, the text sequences are formed for each pair of offers based on their attributes: name, brand, category, and price, and the output is the encoding of the token [CLS] obtained with BETO [
68] (
https://huggingface.co/dccuchile/bert-base-spanish-wwm-uncased, accessed on 1 March 2021), the pretrained model of BERT in the Spanish language. The final embedding is obtained with a model inspired by the architecture designed by Mohamad Merchant for the semantic similarity task (
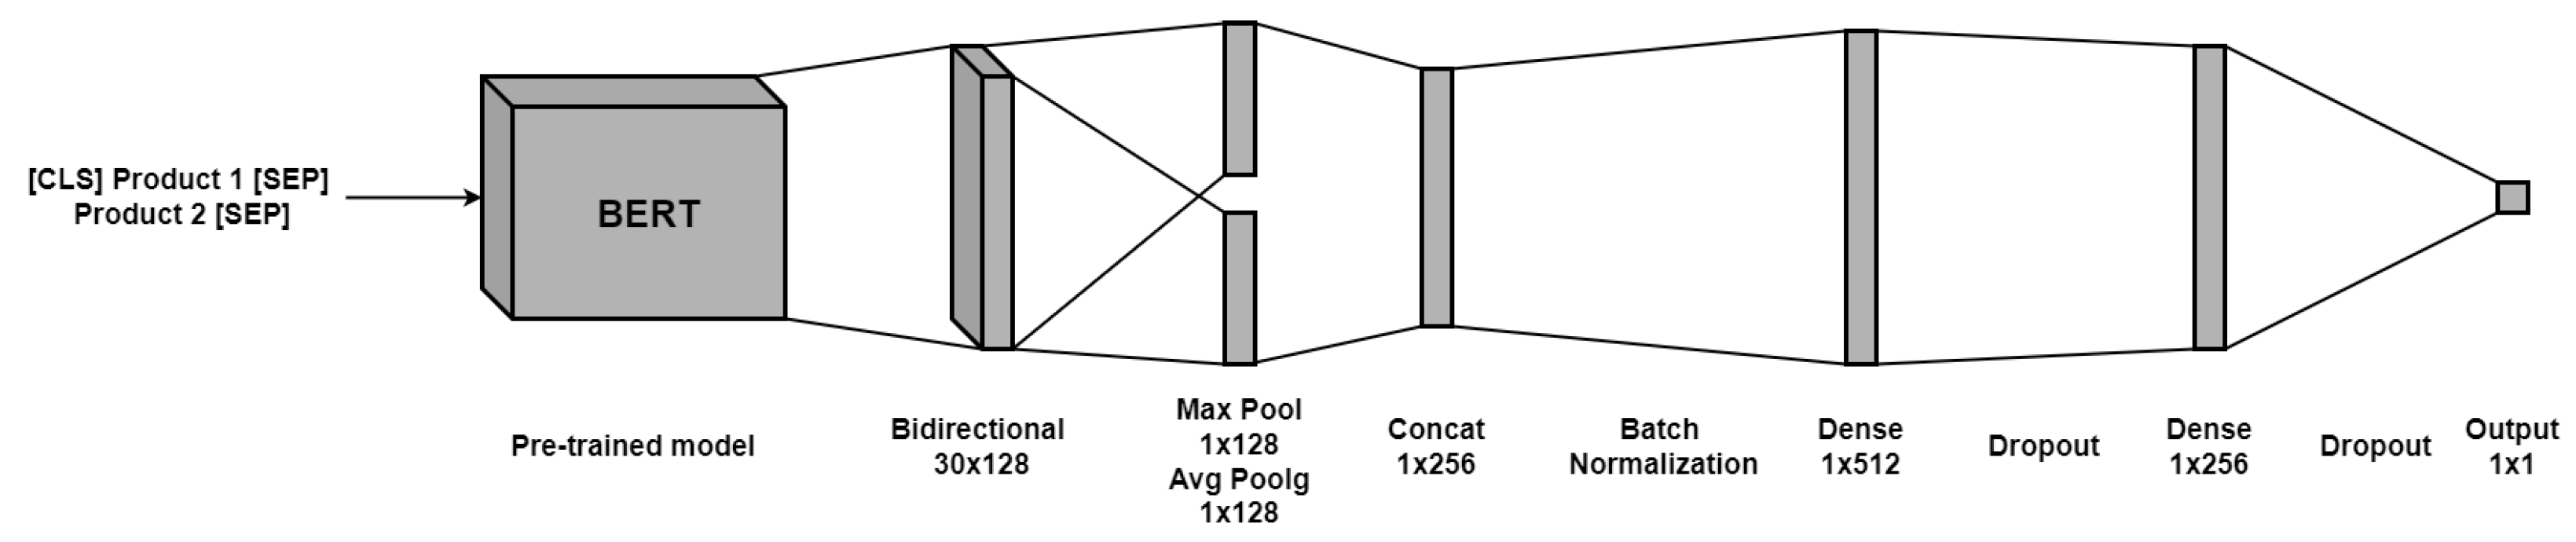
https://keras.io/examples/nlp/semantic_similarity_with_bert/, accessed on 10 February 2021), which consists of a bidirectional LSTM layer followed by a hybrid pooling layer (max-pooling and average-pooling); then, both are concatenated and passed through regularized dense layers to the output layer, as shown in
Figure 7. It should be noted that different structures were tested for these last dense layers to improve the model.
3.3.2. Fusion
After obtaining the embeddings for each modality of data, the second key aspect is the combination of the vector representations of the different modalities to have a global set of features for each item in our database. Sometimes, multimodal data can be simplified by translating the modalities in only one, such as in the case of audio transcription or image captioning [
69,
70,
71]. Then, models based on CML, NLP, or DL can be used. However, a loss of valuable information can occur on that simplification. For classification tasks, as in our case, the popular approach is data fusion techniques [
2]. Data or information fusion is defined in [
72] as “the study of efficient methods for automatically or semi-automatically transforming information from different sources and different points in time into a representation that provides effective support for human or automated decision making.” Although initially two main strategies for fusion were considered, early and late fusion [
73,
74,
75], for a wide range of ML tasks, a third one, intermediate fusion, was included [
76]. Early or input-level fusion integrates the different modalities of raw or preprocessed data before any learning process is carried out. Late or decision-level fusion operates on each modality of the data, where a classifier is learned independently, and the final prediction is made by combining the outcomes of each one of them, which is very similar to the way ensemble methods work [
77,
78,
79]. In the case of intermediate or feature-level fusion, there is a transformation of the raw inputs of each modality into a higher level representation [
76], followed by a fusion of these representations, where a learning method is applied on the global feature map. Intermediate fusion is very flexible because it allows combining different features or representations, even from the same modality of data, which could enrich the information we obtain from the phenomenon of interest through the data sample. In this work, we used this approach for the fusion of the two modalities of data we have in our database. The architectures of the models we propose for PM based on multimodal data are listed below.
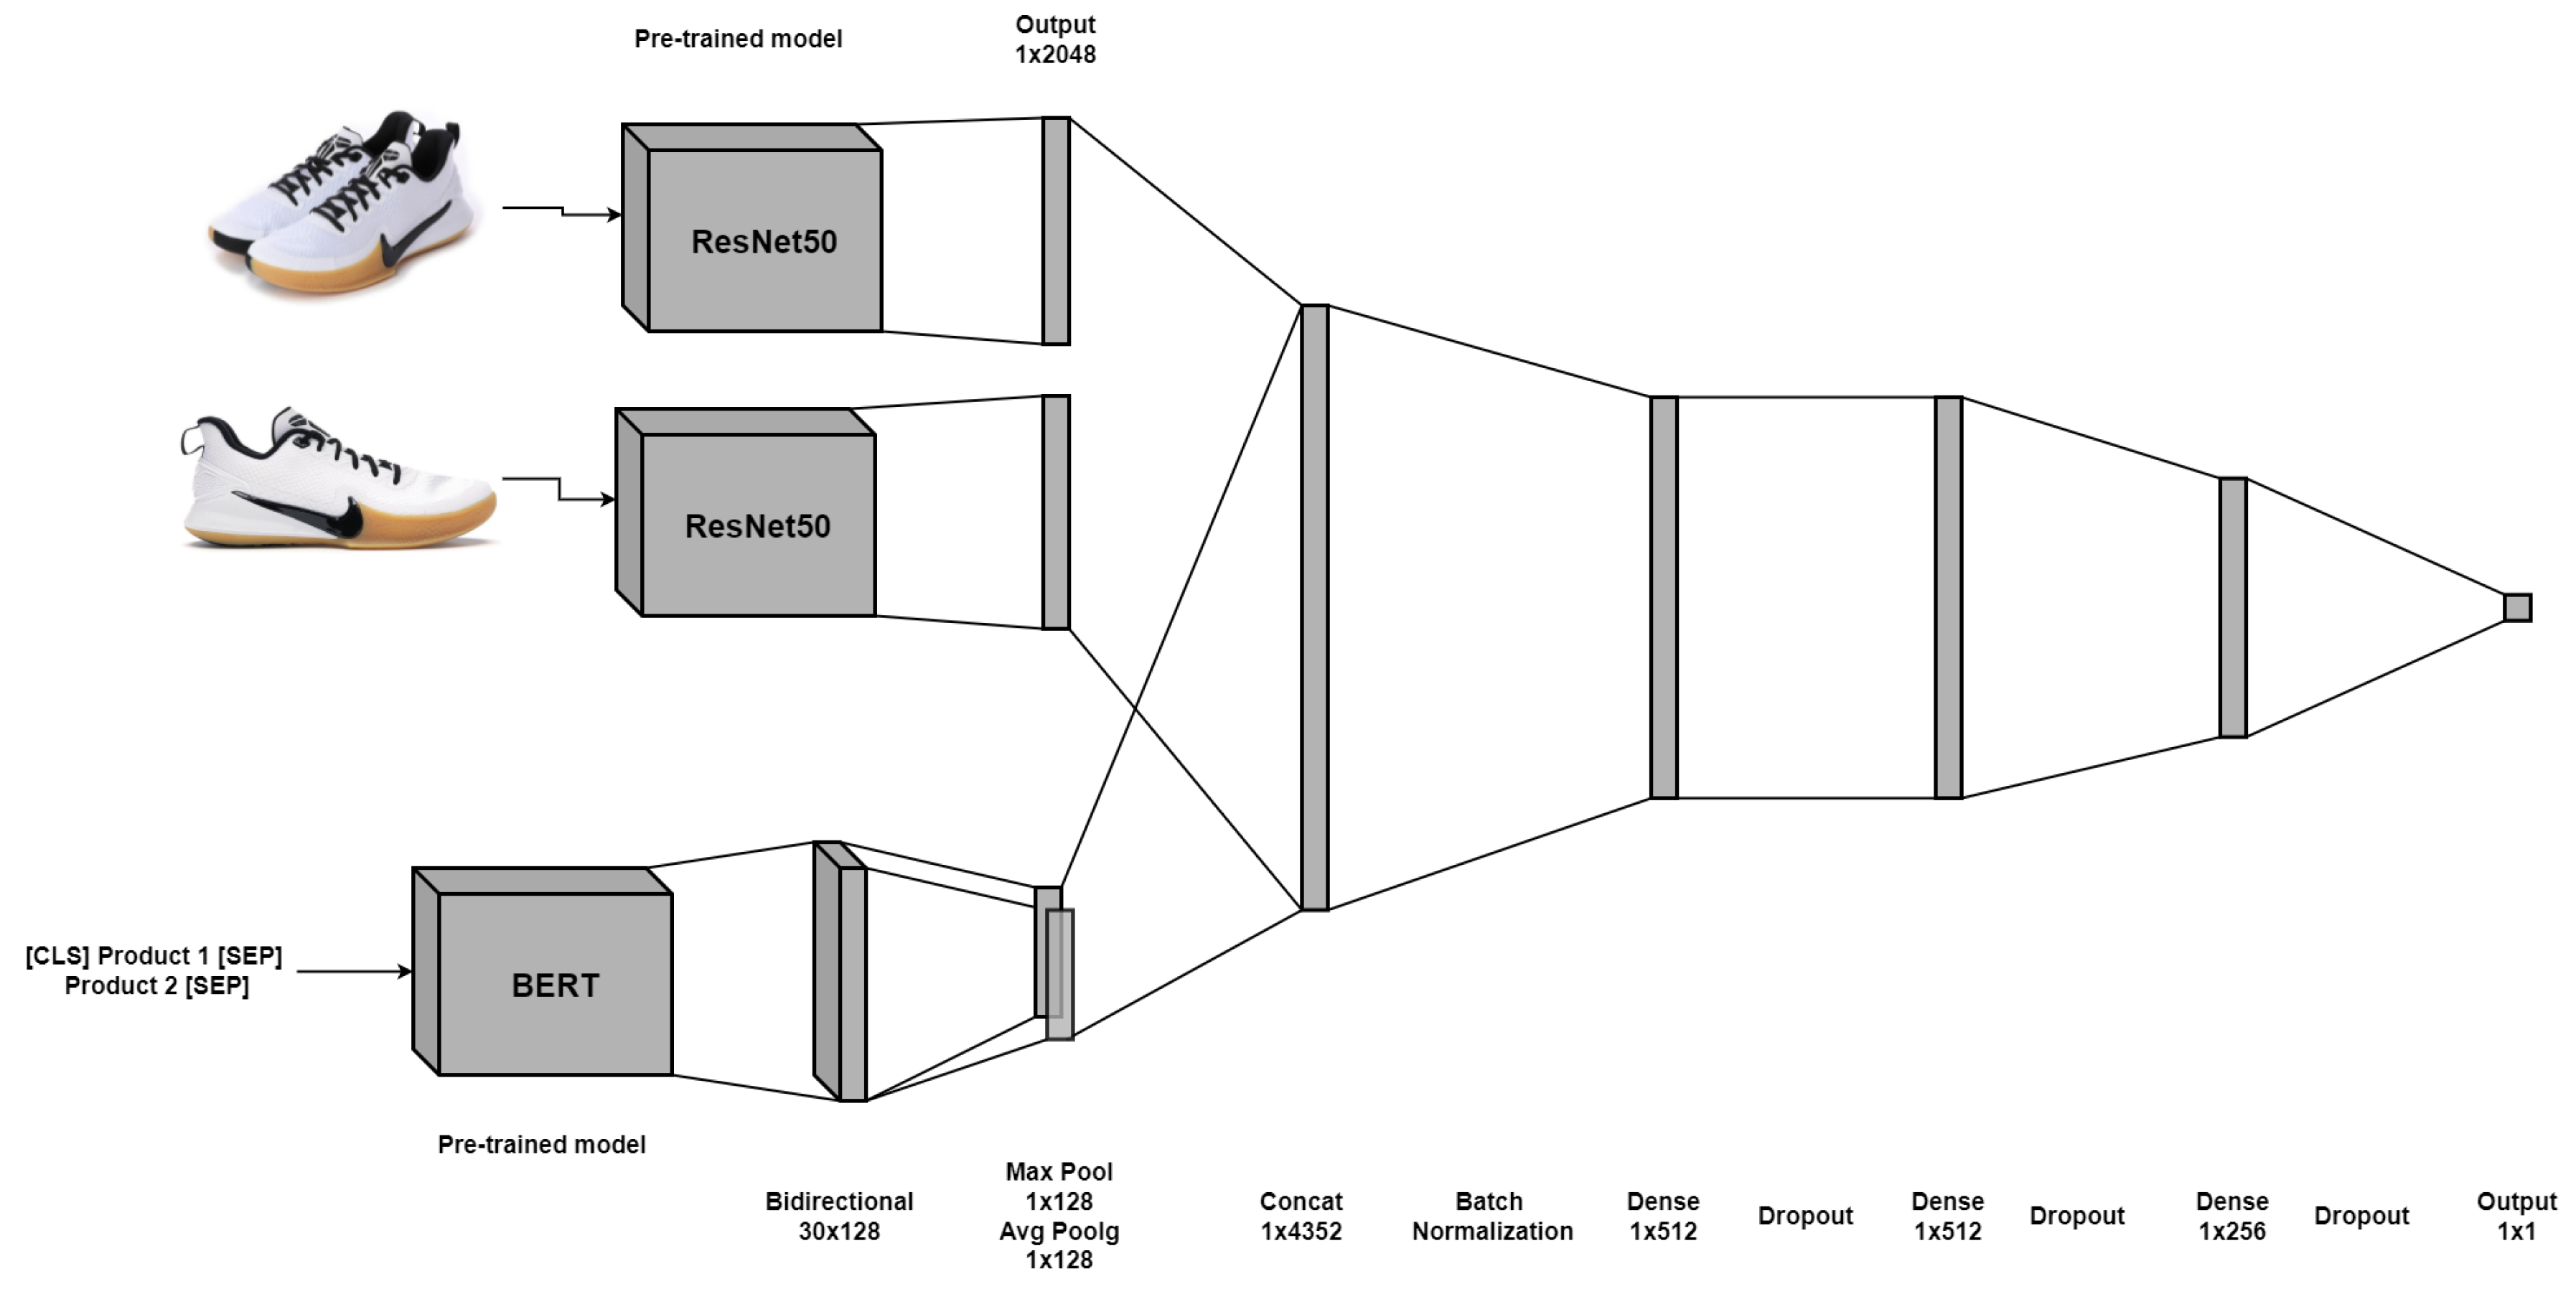
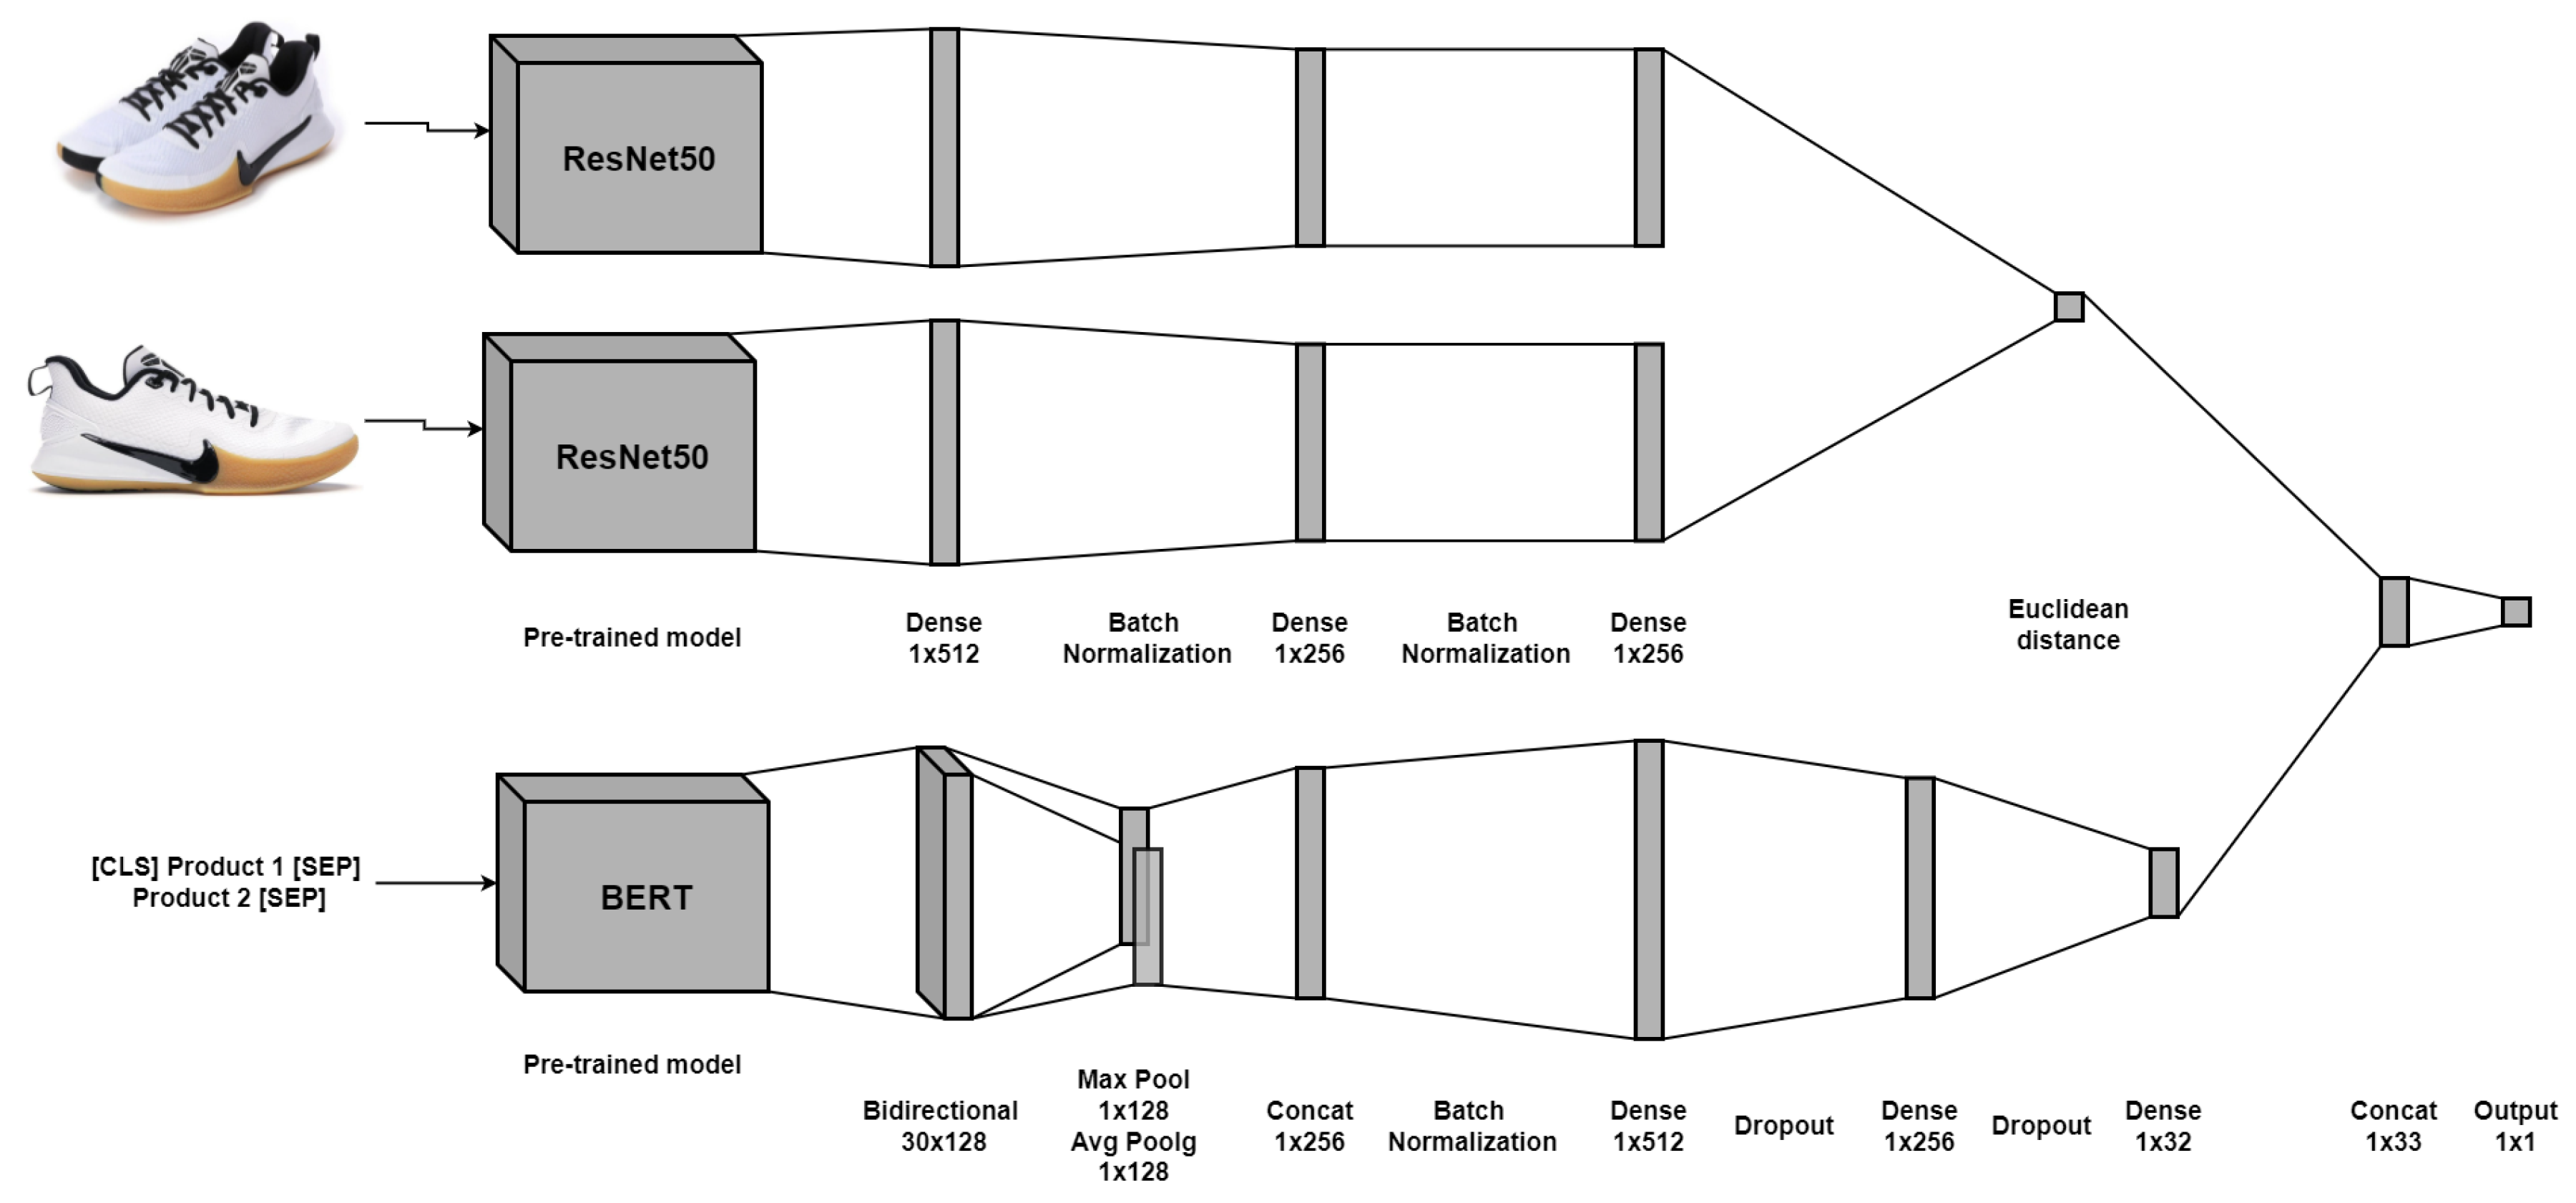
ImageBERT: This model consists of the fusion of text and image embeddings obtained with BERT and 2-CNN architectures as described in
Section 3.3.1. Thus, a single embedding is obtained, which, in turn, is the input of a regularized neural network as a classifier. This architecture is shown in
Figure 8.
BERTSiamese: This model consists of the fusion of the BERT-based embeddings for text and the image-Siamese embeddings for images, as was described in
Section 3.3.1. Unlike the previous model, we concatenate the Euclidean distance of the resulting image embeddings from the Siamese network and the text embedding from the BERT-based architecture to feed a neural network classifier. Note that the text embedding is smaller than the individual version because of the addition of the distance; we do not want to lose its importance. The structure is shown in
Figure 9.
Some relevant aspects should be mentioned. First, we introduce class weights to consider the imbalance in the categories of our data set, which implies the use of the
weighted cross-entropy loss function. This function can be defined for a
categories classification problem, and for some training pair
, as
, where the score
, for some parameters
, and
is the weight for each class, which in our case is defined according to the class proportions. It is easy to show that minimizing this loss function over the entire training set is equivalent to obtaining the maximum likelihood estimator of the parameters of the model [
80] but taking into account the imbalance of categories. For practical purposes, it is a way to tell the model to "pay more attention" to samples from an under-represented class (
https://www.tensorflow.org/api_docs/python/tf/keras/Model, accessed on 15 March 2022).
Second, we choose the architectures for the encoding of multimodal data and the fusion models after an extensive set of experiments, consisting of a grid search over different sizes and numbers of dense layers. The optimal architecture was chosen based on the performance metrics described in
Section 3.4.3.
3.4. Methodology
3.4.1. Data Preprocessing
We used some standard preprocessing for the data. We converted text to lowercase, removed special characters and stop words, and applied word tokenization. We resized images to pixels.
3.4.2. First Approach, CML Algorithms
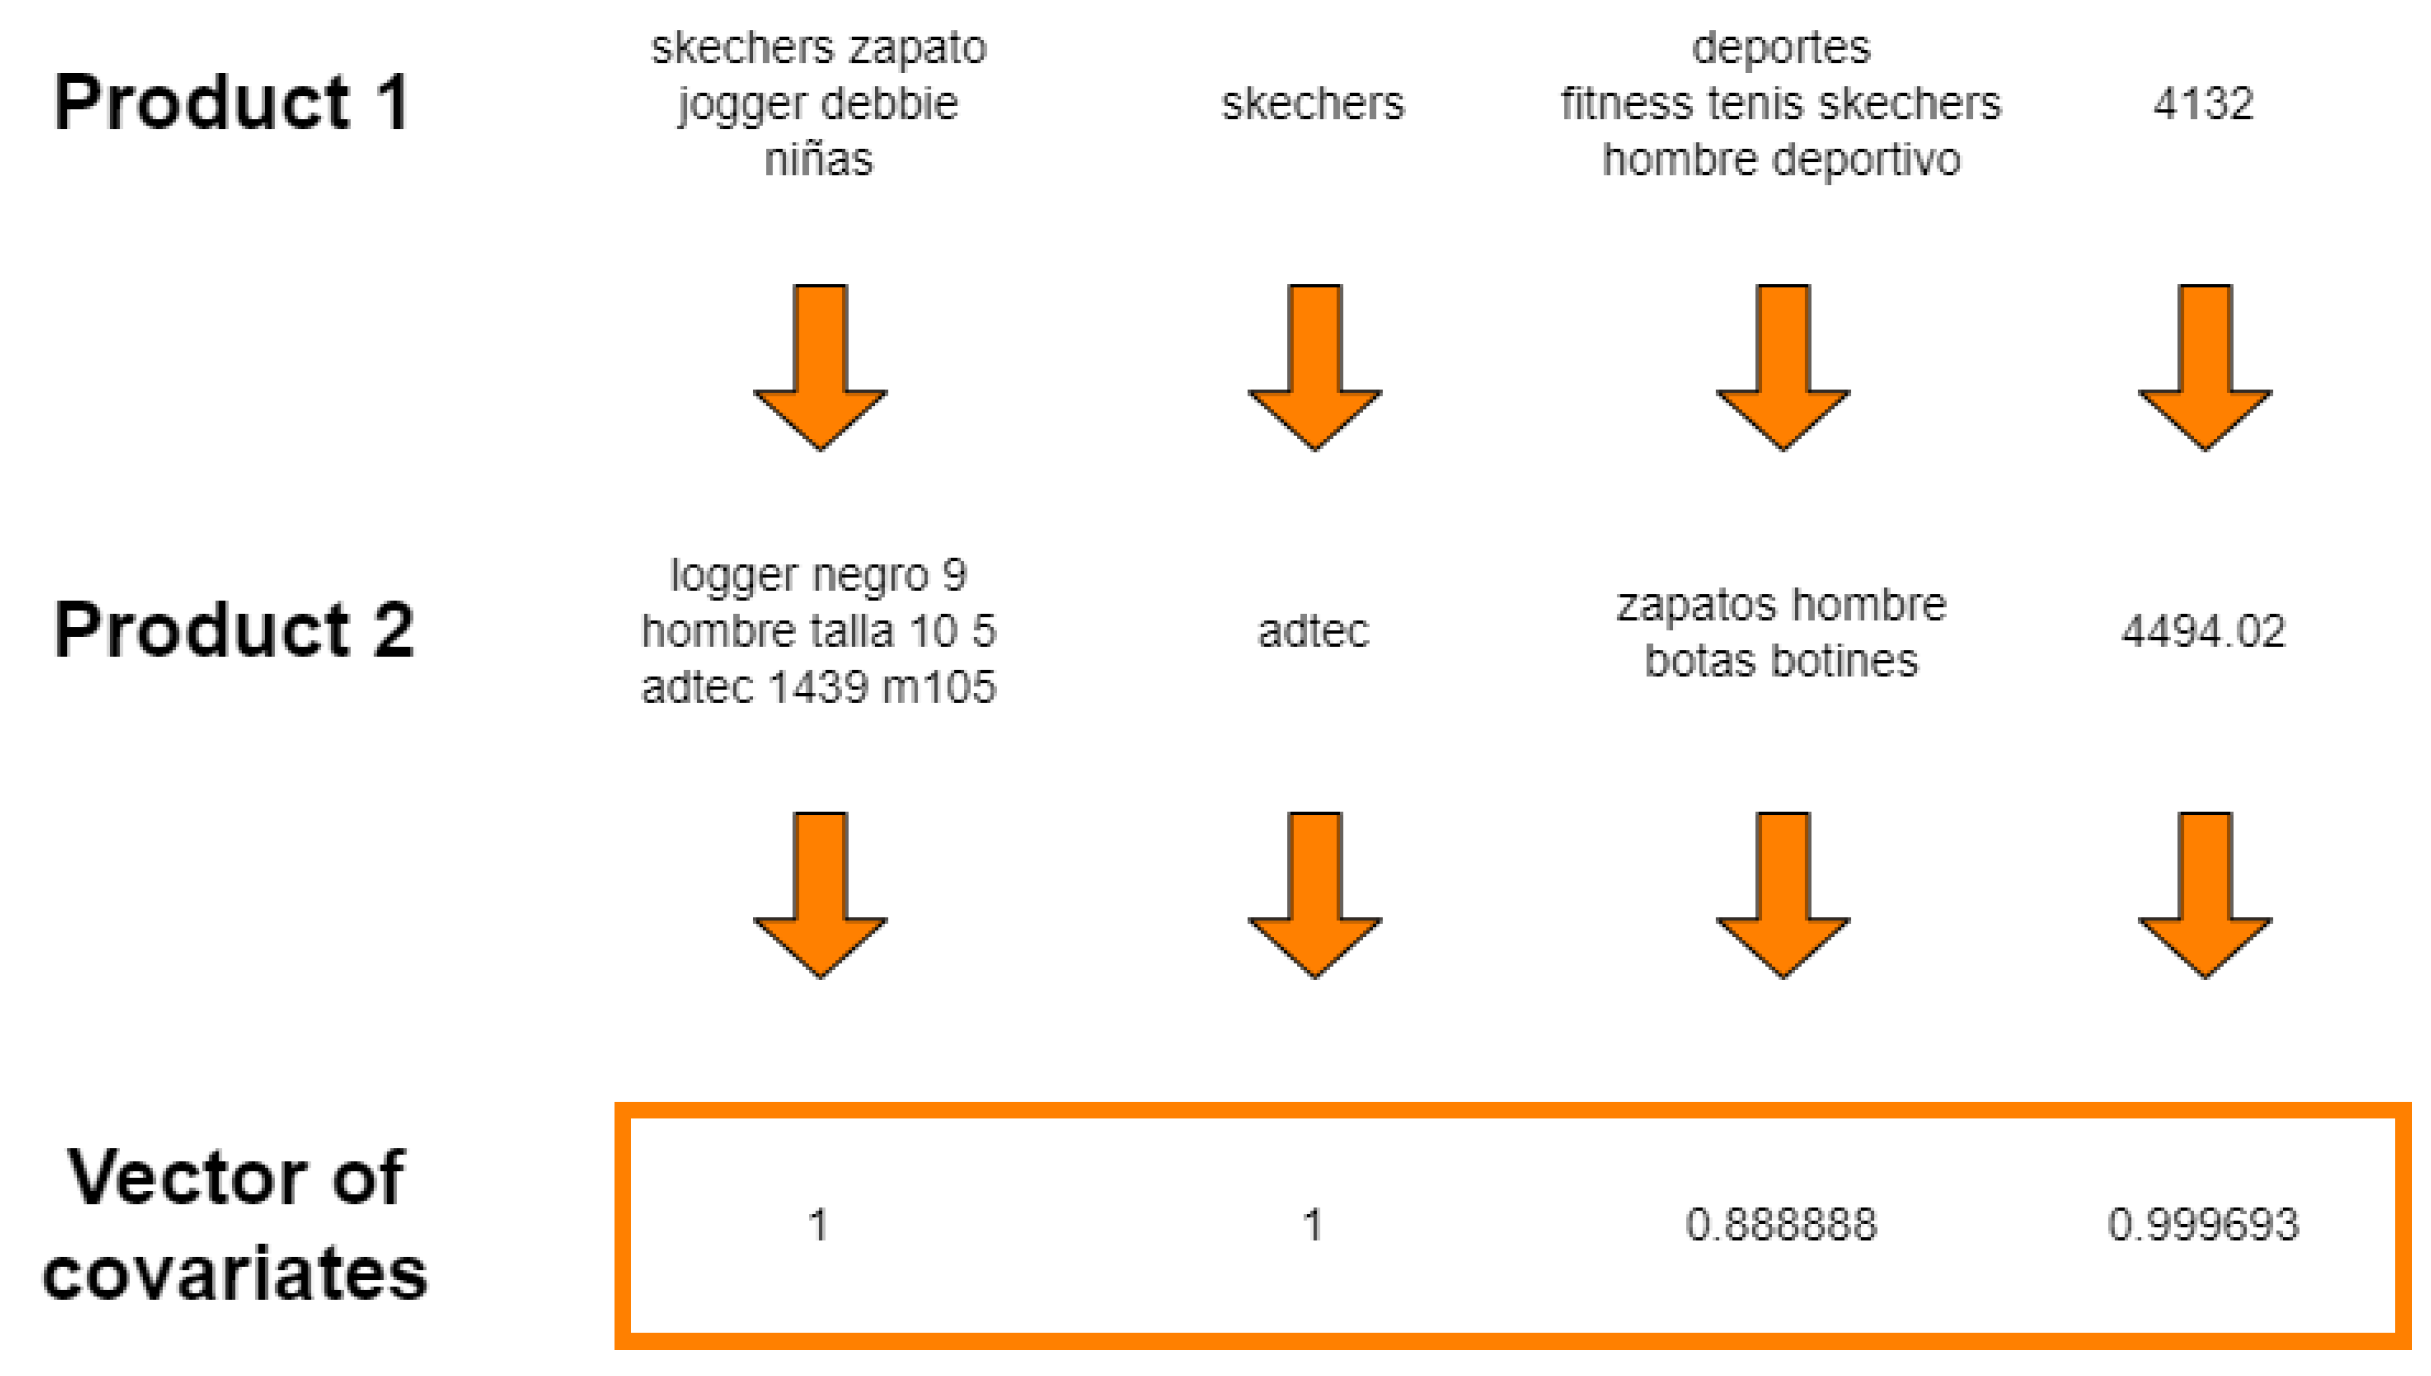
Our first approach consisted of some classical classification algorithms based on textual information only. The data structure includes the following characteristics for each pair of products: name, category, brand, price, and image. The similarity between each pair of products will be calculated for each of these characteristics except the image, and they will be, in turn, the covariates of each labeled tuple. In the case of text, we used the Jaccard distance, defined by
, where
is the Jaccard index, computed by
. The Jaccard index gives us the similarity between two documents
and
as the ratio of intersection over the union of the set of tokens of which they are composed. The difference between prices will be calculated and normalized, and the result will be subtracted from 1 so that all distances are in the same range. This results in four independent variables corresponding to the distance between each attribute. In all cases, the dependent variable is binary, indicating whether they are the same products or not. An example of the resulting vector of covariates is shown in
Figure 10.
Our CML classification algorithms are based on logistic regression, SVMs, naive Bayes,
nearest neighbors, and random forest, using the default settings implemented in the Scikit-learn Python module [
81].
3.4.3. Performance Metrics
We used standard metrics for classification tasks to assess the performance of the models we proposed.
Accuracy: Determines the proportion of correct predictions.
where:
- -
TP = true positives;
- -
TN = true negatives;
- -
FP = false positives;
- -
FN = false negatives.
Precision: answers the question: what proportion of positive predictions are actually correct?
Sensitivity (Recall): similar to Accuracy, Sensitivity answers the question: how many true positives were correctly classified?
F1 value: represents a weighted average between Accuracy and Sensitivity.
4. Results
All models were implemented in the Python programming language using the Scikit-learn module for the CML algorithms and Keras-TensorFlow [
82,
83,
84] for the DL models. All training and inference processes were performed on Google Colab (
https://research.google.com/colaboratory/, accessed on 15 January 2021) with 12 GB RAM and using the GPU provided by this service. Training, validation, and test data sets were created for all models. For DL models, we used binary-weighted cross-entropy as the cost function (
Section 3.3.2), the Adam optimizer, and all models were trained with 160 epochs. Additionally, we used
early stopping with a patience parameter of 20 epochs to avoid overfitting. The bidirectional layer was chosen for the BERT model to take better advantage of the type of output of the pre-trained model. Hybrid pooling was selected to increase the number of elements that the classifier would receive as input. In general, the choice was made to keep the structures simple, so there is room for further improvements.
In
Table 1, we show the results obtained for the CML models. Special attention will be paid to the F1 metric to evaluate the performance of all classification models, as it contains information on accuracy and sensitivity, measures directly related to the ability of the models to classify positive pairs correctly. It is worth mentioning that the training time for all models is very fast (less than a second) in all cases.
Table 1 shows that the CML model that achieved the best performance according to the F1 metric is random forest. Although the accuracy is above 0.7 in all models, meaning that more than 70% of the pairs were correctly classified, this metric should not be used alone due to the imbalance of the categories, as explained in
Section 3.2.1. To understand why, consider that an algorithm that classified all pairs as negative would have an accuracy of 73%. However, it cannot distinguish one category from another. Therefore, knowing the accuracy performance of all the models is not a decisive point. Note also that there are no significant changes in the accuracy across the CML algorithms. In all cases, more than 50% of the predictions of positive pairs were correct. However, a drastic sensitivity change is observed among the methods. The lowest in sensitivity is logistic regression, with 38% of true positives classified correctly, while random forest scores 73%, a considerable difference. In addition to the F1 metric, this positions random forest as the best among the classical models.
For comparison purposes, we test the performance of the unimodal DL models proposed in
Section 3.3.1. In this case, we used these models as classification algorithms, which is different from the multimodal approach described in
Section 3.3.2, where we used only the embeddings of the unimodal representations of the data to combine them later with fusion techniques. The results are shown in
Table 2.
A clear improvement is observed compared to the CML algorithms. Here, the accuracy is above 91%, the precision is 81%, and the sensitivity is 92%. In particular, the image-Siamese algorithm is the best in all metrics, achieving an accuracy of 91.1%, a precision of 81.8%, a sensitivity of 86.0%, and an F1 of 83.22%. An important observation in the unimodal models is that the algorithms behaved similarly despite using different types of data, that is, images and text, independently. In other words, a single data type, either images or text, is sufficient to build a model that can identify similarities between products. This, in part, responds to the doubt that arose as to whether, by having pairs of products with very similar textual descriptions, the algorithm fed only with texts would have problems identifying whether they were the same. Furthermore, this problem does not influence the performance of the models based on textual information because it behaves very similarly to the algorithms with only images as input and is even superior to one of them. However, this is not conclusive; more robust algorithms will have to be developed, and more tests must be carried out with each type of data to identify if there is indeed a problem.
Finally, we show the results for the multimodal approach we proposed in
Table 3. It is worth analyzing each models’ behavior separately. Remember that the ImageBERT algorithm consists of the fusion of BERT and 2-CNN embeddings; we can observe an improvement in their performance, especially when we compare it to the unimodal 2-CNN architecture. Regarding their metrics, the accuracy is 92.41%, an improvement by 5.06% for BERT and 6.99% for 2-CNN; the precision is 86.26%, an improvement by 16% for BERT and 14.16% for 2-CNN; the sensitivity is 86.45%. These values suggest that the model could better identify positive pairs by sacrificing some accuracy. In contrast, for the BERTSiamese model, a loss in performance is observed compared to its unimodal algorithms BERT and image-Siamese in most cases. Although the image-Siamese model obtained the best performance within the unimodal models, its performance decreases for all metrics when we fuse it with BERT. This may be due to the final representation obtained from the Siamese model because it is only a distance value, which may not provide enough information from this modality of data compared to the textual representation given by the BERT embedding.
We can see that that the training time for all DL models was greater than one hour, whereas the training of the CML models was practically immediate. This is a disadvantage for DL-based models, however, once the models are trained, the inference procedure for new data is immediate. Furthermore, the specified epochs were not completed in any of the DL models due to the early-stopping procedure included.
5. Conclusions
In this article, a first approximation was made to understand the behavior of the Mexican e-commerce market, both in terms of buyers’ preferences and the structure in which sellers offer their products. We saw that the lack of resources and the heterogeneous structure of e-commerce platforms in Mexico make it particularly difficult to deal with the PM problem. For this reason, we developed a system capable of solving this specific problem based on modern deep-learning architectures and multimodal data consisting of text and image information. An extensive set of experiments were carried out to compare our proposal with different classical DL algorithms and even with modern DL models based on unimodal data.
Random forest presented the best performance of the CML algorithms because it was able to classify 73% of the positive pairs correctly.
During the unimodal models testing, and contrary to what was initially believed during the manual labeling of pairs, the performance of the algorithms trained only with text or with images was similar. This was observed despite the existence of certain pairs where the description is very similar. The previous leads us to conclude that it was equally feasible to create a model fed either by images only or by text only in terms of modeling.
The results indicate that multimodal models that combine text and images to construct a classification model can improve the performance of models based on unimodal data, as seen in the ImageBERT algorithm, which showed the best performance metrics.
Based on the above points, and despite the peculiarities and difficulties of the database, the objective of creating a system capable of identifying the similarity between products was achieved. This proposed system corresponds to the first system, as far as we know, that focused entirely on products with descriptions in Spanish and, specifically, for the Mexican e-commerce market. As a consequence of the lack of uniformity among the analyzed e-commerce sites, the input of the proposed system was multimodal. Furthermore, in addition to being the first of its kind in Spanish-speaking countries, the present multimodal product matching system is also the first in the scientific literature.
Future Work
This work was intended to be a starting point for further research in the field. For this reason, and based on the observations made throughout the process and the limitations of this study, the following is a description of specific issues that would be especially important to attack in future research.
In addition to the features used to describe the algorithms (title, category, price, brand, and image), a feature table with various product information was also extracted. This information was not used in the proposed system as its characteristics were not the same for all products. However, the BERT model uses text strings as input, so with the correct data preparation, it would be easy to use this feature table to make the product description more robust.
To improve the performance of the models, it is also crucial to have a sufficiently large database to train them. Therefore, increasing the amount of data that the current database contains is indispensable for future work.
Although the use of the BERT model was based on the results achieved in the literature, its performance in the PM problem studied here was not certain. For this reason, other types of algorithms could be used to see if they improve the results for this particular problem.
Although the problem of class imbalance present in the database generated in this study was treated here by means of various techniques, it is recommended to study other classification algorithms designed with this problem in mind, as well as to incorporate data-augmentation techniques to generate synthetic data of the minority class.
The precisions, accuracies and F1 values obtained are far from those achieved in the e-commerce PM literature for platforms written in English or Chinese. Future studies should focus on generating schemes that include more than two data modalities, as well as text preprocessing, other types of information fusion and classification-algorithm types such as multimodal extreme learning and shallow trees.


