Article

Older Adults Get Lost in Virtual Reality: Visuospatial Disorder Detection in Dementia Using a Voting Approach Based on Machine Learning Algorithms

by
Areej Y. Bayahya
1,2,*,
Wadee Alhalabi
1,3,4 and
Sultan H. Alamri
5,6,7
1
Department of Computer Science, King Abdulaziz University, Jeddah 21589, Saudi Arabia
2
Department of Computer Science, Arab Open University, Jeddah 12015, Saudi Arabia
3
Virtual Reality Research Group, King Abdulaziz University, Jeddah 21589, Saudi Arabia
4
Department of Computer Science, Dar Alhekma University, Jeddah 21589, Saudi Arabia
5
Department of Family Medicine, King Abdulaziz University, Jeddah 21589, Saudi Arabia
6
Saudi Geriatrics Society, Riyadh 11614, Saudi Arabia
7
Geriatrics Service, Fakeeh Care Group, Jeddah 23323, Saudi Arabia
*
Author to whom correspondence should be addressed.
Mathematics 2022, 10(12), 1953; https://doi.org/10.3390/math10121953
Submission received: 15 February 2022 / Revised: 19 March 2022 / Accepted: 6 April 2022 / Published: 7 June 2022

Abstract

:
As the age of an individual progresses, they are prone to more diseases; dementia is one of these age-related diseases. Regarding the detection of dementia, traditional cognitive testing is currently one of the most accurate tests. Nevertheless, it has many disadvantages, e.g., it does not measure the extent of the brain damage and does not take the patient’s intelligence into consideration. In addition, traditional assessment does not measure dementia under real-world conditions and in daily tasks. It is therefore advisable to investigate the newest, more powerful applications that combine cognitive techniques with computerized techniques. Virtual reality worlds are one example, and allow patients to immerse themselves in a controlled environment. This study created the Medical Visuospatial Dementia Test (referred to as the “MVD Test”) as a non-invasive, semi-immersive, and cognitive computerized test. It uses a 3D virtual environment platform based on medical tasks combined with AI algorithms. The objective is to evaluate two cognitive domains: visuospatial assessment and memory assessment. Using multiple machine learning algorithms (MLAs), based on different voting approaches, a 3D system classifies patients into three classes: patients with normal cognition, patients with mild cognitive impairment (MCI), and patients with severe cognitive impairment (dementia). The model with the highest performance was derived from voting approach named Ensemble Vote, where accuracy was 97.22%. Cross-validation accuracy of Extra Tree and Random Forest classifiers, which was greater than 99%, indicated a greater discriminate capacity than that of other classes.

1. Introduction

Worldwide, by 2050, it is estimated that the number of older individuals will increase to 2 billion [1]. Dementia, a neurocognitive condition, is an age-related disease [2] that is one of the major causes of cognitive decline in the elderly. Dementia is characterized as a progressive deterioration of cognitive function that impairs the ability to think, make decisions, and conduct everyday activities [3]. Dementia has several forms and facets: Alzheimer’s disease (AD), Mixed Dementia (MD), Dementia with Lewy Bodies (DLB), Vascular Dementia (VaD), Frontotemporal Lobar Degeneration (FTLD), Parkinson’s disease (PD), Creutzfeldt–Jakob disease, and normal pressure hydrocephalus [2]. Due to the convergence of several common clinical characteristics across dementia, it can be difficult to differentiate between the different syndromes [4]. Alzheimer’s disease (AD) [1] is the most prevalent, accounting for between 60% and 80% of dementia patients [2]. Patients with AD have cognitive disorder and symptoms, including memory loss, reasoning disability, visual image and spatial confusion, impaired judgement, loss of direction, and other cognitive issues that prevent them from living a normal life. It can lead to death due to malfunctioning brain cells [2], a lack of understanding of the disease, and a lack of knowledge of how to deal with it. In this context, this research focused on AD and strategies for the diagnosis of cognitive disability. In order to reduce the speed and the high cost associated with the more advanced stages of Alzheimer’s disease, it is important to detect the disease at early stages [2,5]. However, at early stages, the AD diagnosis is particularly challenging. Furthermore, early discovery of the disease may help to increase care and supervision, identify dangerous situations, and anticipate safety risks [6].
Since early cognitive impairment diagnosis is valuable (as early stage therapeutic treatments are more helpful to patients [7]), it is necessary to use a type of evaluation that tests cognitive performance under real-world conditions to reliably evaluate functional impairment in dementia [8], in addition to advanced methods to diagnose functional cognitive impairment and assess the extent to which the disease impacts functionality.
Today, disease diagnosis is an important task that implies a deep understanding of the exact disease through clinical examination and assessment. Computers play a vital role as a decision support system in the disease’s diagnostic test. One important new computerized method uses the virtual environment (VE) which, combined with cognitive tests and machine learning, improves the cognitive test, and allows the patient to be immersed in a controlled environment [9,10] and to interact with the virtual world in a way that tests their cognitive abilities known to be limited by Alzheimer’s disease (e.g., getting lost, navigation). In the field of technology, virtual reality (VR) is a significant field that has recently been used for neuropsychology [1], and gives the user a sense of being immersed in a real-life scenario [11]. Computer-generated virtual environments are classified into non-immersive, semi-immersive, and fully immersive [5]. Recently, VR applications [12,13,14,15] have been designed specifically for elderly patients to recognize cognitive disabilities using different levels of interaction between the patient and the virtual environment.
The goal of this study was to use a voting approach based on machine learning to make diagnoses of dementia based on the patients’ data that were collected from Bayahya et al. [16]. The goal of this research was to develop a Medical Visuospatial Dementia Test (MVD Test), a VR-based cognitive tool to diagnose memory loss, and visual and spatial defects, in patients with dementia. Smart computer aided diagnosis (CAD) tools were built to identify cognitive disability in patients with cognitive dysfunction. Different tasks were developed to test two separate cognitive domains: visuospatial tasks (spatial navigation, spatial orientation, and visual memory) and memory tasks (verbal delayed recall). Then, scores were collected. The current study classified the patients using machine learning algorithms (MLAs) into three distinct groups, namely: dementia, mild cognitive impairment (MCI), or healthy older adults. Although dementia and MCI can both involve deficits in one or multiple cognitive domains, MCI does not prevent independence in daily activities. The study of Bayahya et al. [16] had several objectives for using the smart dementia platform:
  • Designing the MVD Test as a VR environment along with MLAs, and using it to help physicians to identify behavioral and perceptual abnormalities associated with dementia.
  • Examining the probability of identifying visuospatial and memory deficits using MLAs along with VR technology in dementia patients.
  • Diagnosing cognitively impaired patients in a simulated environment that tests memory and visuospatial deficits.
  • Classifying participants into three classes: older adults who have normal cognitive functioning, MCI, and early and moderately severe dementia.
  • Analyzing data from real medical patients and measuring cognitive performance while patients perform real world tasks simulated in VR.
This paper consists of five sections: The introduction was presented above in Section 1. Section 2 is a review of the literature and related work. The architecture model of classifying dementia patients and its functionalities is presented in Section 3. Section 4 covers the evaluation results and their analysis. The conclusion and future directions are presented in Section 5.

2. Literature Review
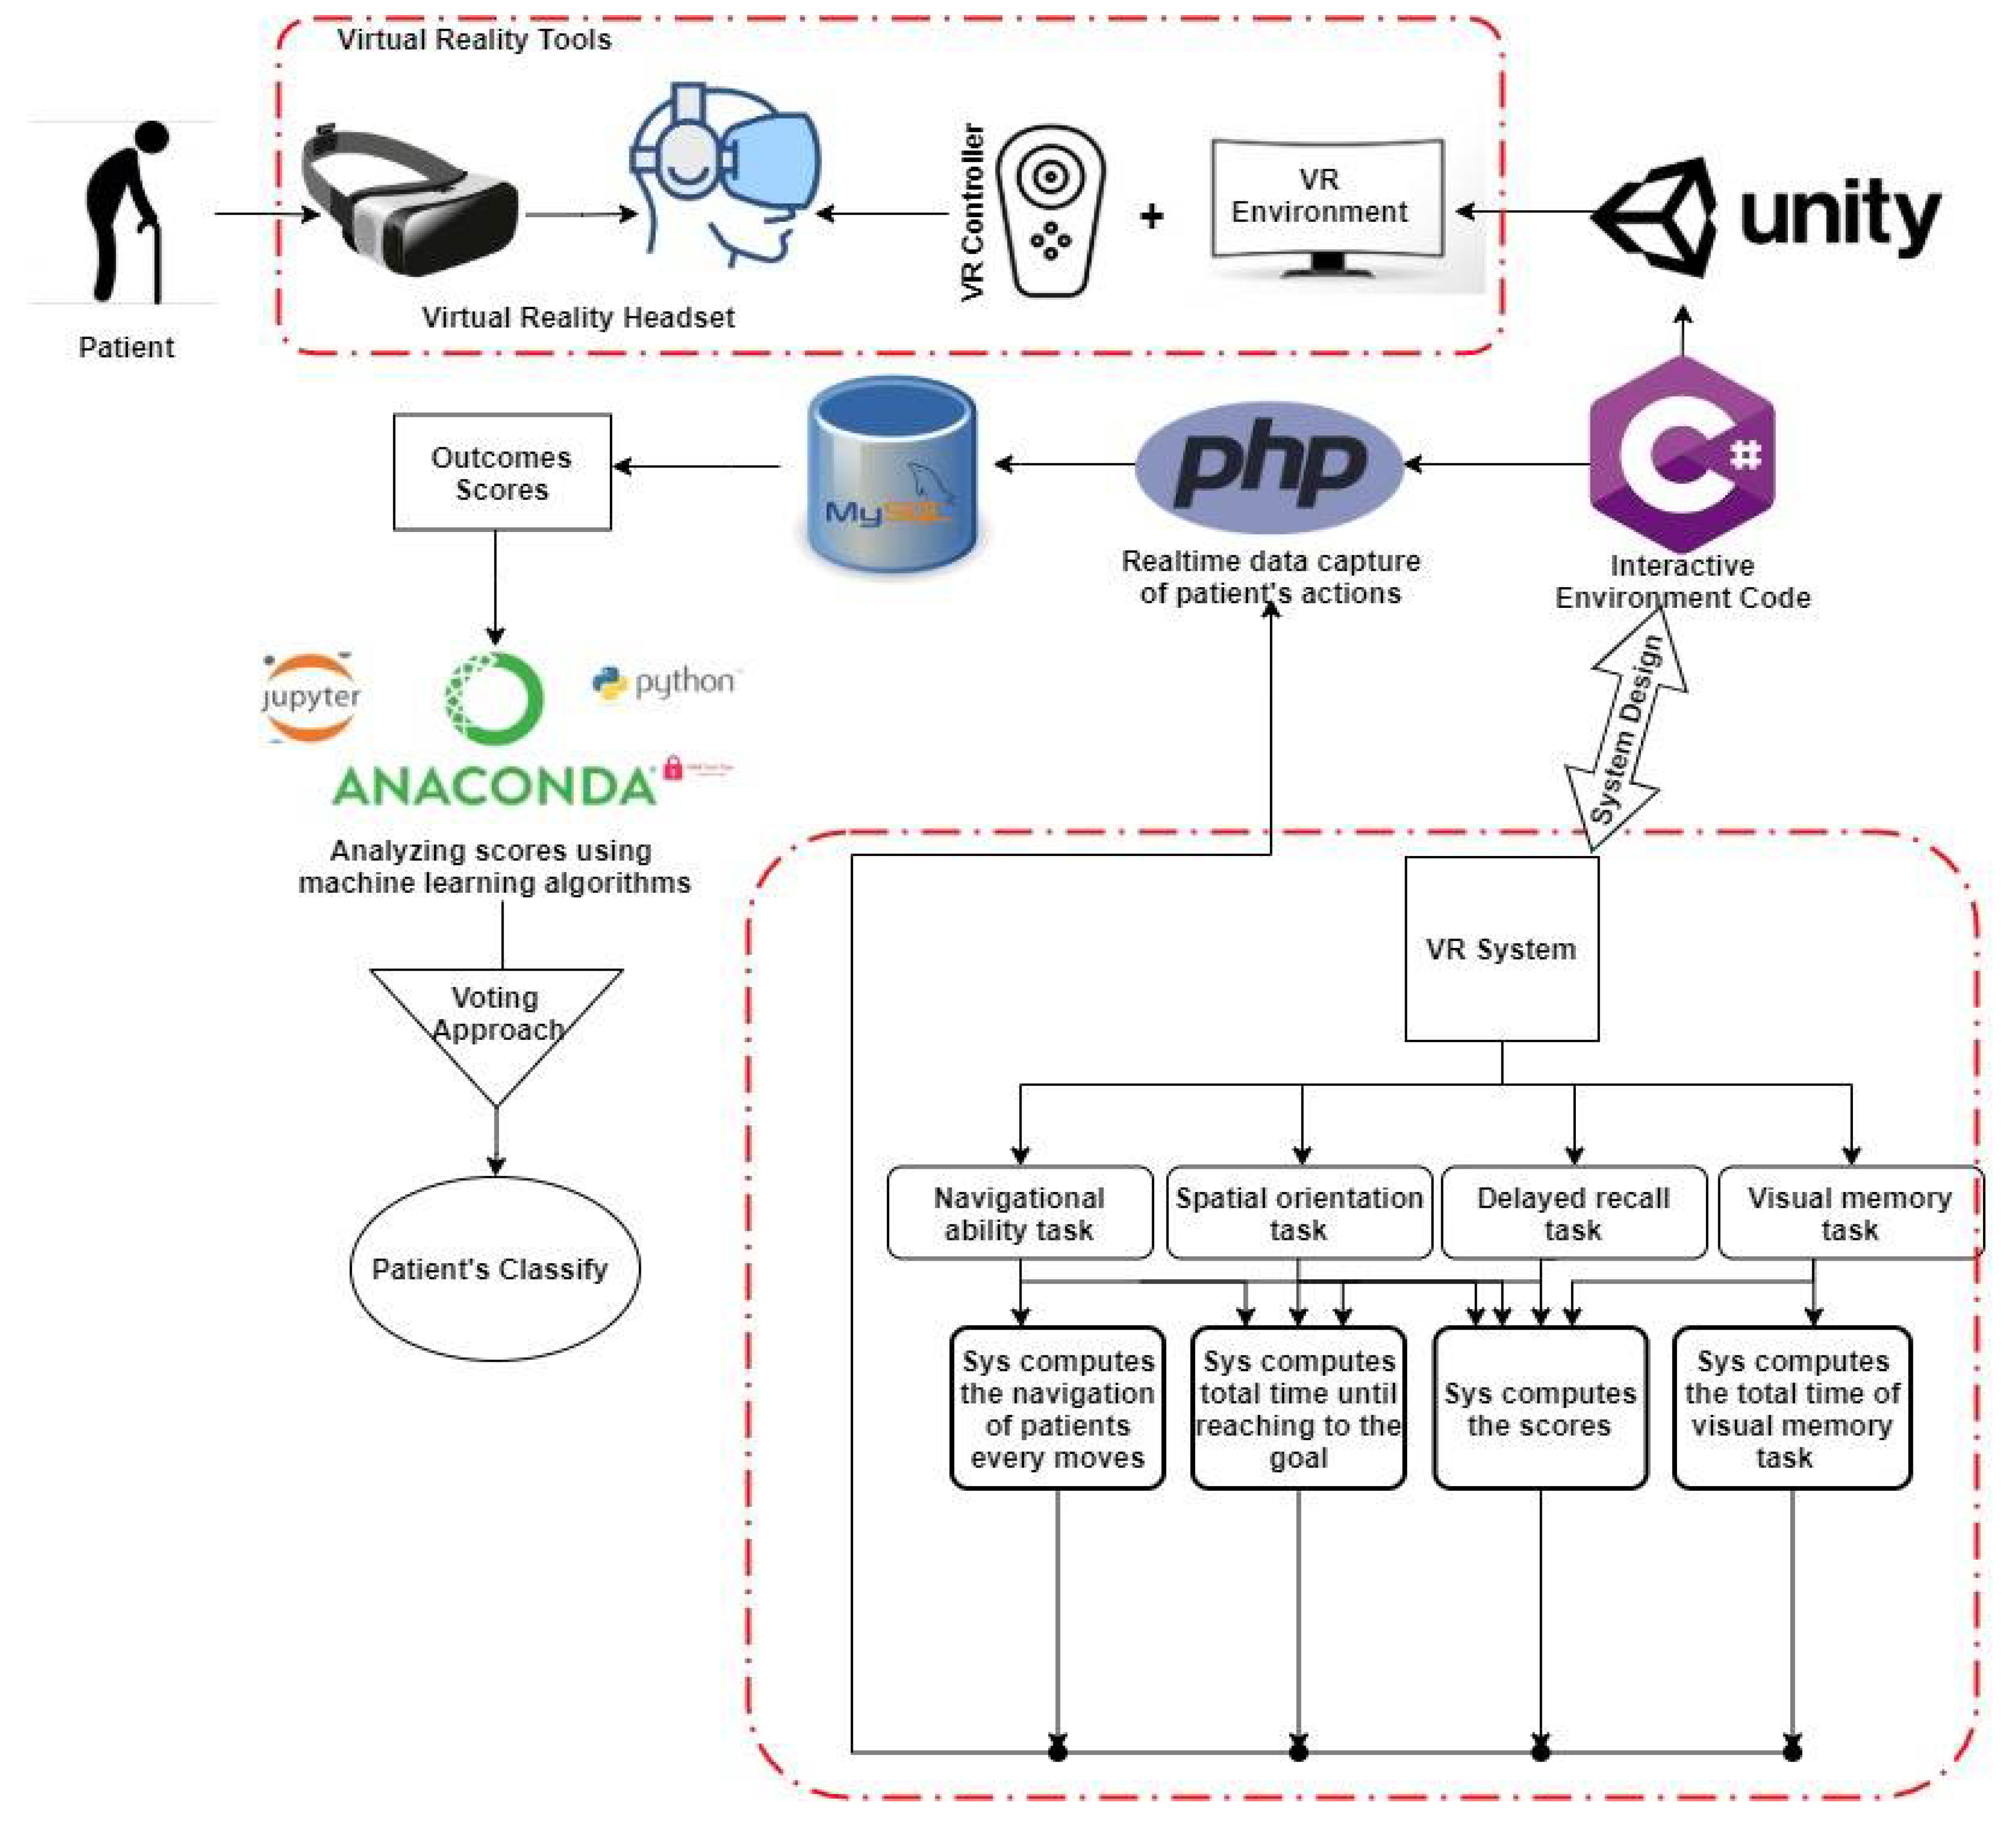
In the medical sector, especially for detecting dementia and AD, VR is a promising tool using advanced technology to develop new screening methods. It helps specialists to understand cognitive disorders more fully and to determine patients’ cognitive experiences as patients conduct everyday activities. VR may also be used to simulate regular activities, improving ecological validity.
Initially, three different branches of machine learning emerged, namely statistical methods, neural networks, and classical work in symbolic learning [17]. Subsequently, these branches developed, and algorithms such as the K-Nearest Neighbor algorithm, Decision Trees, Bayesian classifiers, and neural networks were developed [17]. Machine learning algorithms are computational methods used as data analysis techniques [7]. In areas such as medical diagnosis, nuclear energy, and stock trading, VR is used to make important choices. These algorithms perform better when the number of available data samples is high [7].
ML has many types of training algorithms: supervised learning, unsupervised learning, semi-supervised learning, and reinforcement learning [18]. Supervised learning builds a model from a specific training dataset [19]. Another name given to supervised learning is learning from exemplars [18]. The machine learns from training data, then applies the knowledge to testing data. The data is well labeled and is already tagged with the correct class. The machine analyzes the training data, and when new data arrives, it produces a correct class from the labeled data [18]. Supervised learning is classified into two categories of algorithms: classification and regression. An algorithm is called classification when the data output is categorized, such as disease and no disease [18], whereas it is a regression algorithm when the data output has a real value, such as dollars or weight [18].
Some features of ML are useful for solving medical diagnosis tasks, such as its good performance, ability to deal with missing or noisy data, and transparency of diagnostic knowledge, and when diagnosing new patients [17].
In the diagnosis of Alzheimer’s disease, the aim of using MLA is to distinguish new patients who have certain disease markers and to provide high prediction accuracy. The standard statistical analysis using median, mean, and standard deviation is inadequate for application to any new patients [20]. A novel, interactive 3D based system (VREAD) simulation was developed in Shamsuddin et al. [15]. It diagnosed an MCI that may progress to Alzheimer’s disease over time using data mining methods. It concentrated on spatial navigation and topographical disorientation (TD). For the discrimination between mild cognitive disability and the healthy elderly, algorithms such as J48, naïve Bayes, bagging, and feed forward multilayer perceptron neural networks have a high precision (90%) prediction.
In these studies [12,13,21,22], novel ways of diagnosing early stages of AD were explored in order to address the limitations of conventional tests. Real-world navigation experiments were compared by Cushman et al. [12] with a VR version simulating the same navigational environment. Their VR navigation task study showed that patients with Alzheimer’s had damage to spatial abilities.
Tu et al. [21] investigated spatial orientation using a novel ecological, non-immersive virtual supermarket task, and Zakzanis et al. [13] built an immersed virtual city in order to explore age- and AD-related variations in route learning and spatial memory. They noticed that patients with AD make more errors than others in the recognition task. All these studies used VR to include a reliable navigational evaluation.
In a link with the above-mentioned studies, Lesk et al. [22] and Plancher et al. [14] focused on memory assessment to diagnose the disease, and suggested a significant correlation between daily memory complaints and performance in a VR test. Lesk et al. [22] also designed a non-immersive virtual simulation. Episodic memory profiles were characterized by Plancher et al. [14] in an ecological fashion. Pengas et al. [23] tested topographical memory (TM) by developing three novel tests in a non-immersive virtual city.
Few studies have investigated the Activities of Daily Living (ADL), which is a recent approach used to test physical, executive, and cognitive functions. Measuring performance in everyday cognitive tasks is more ecologically valid and is more sensitive to cognitive decline in pre-dementia than other qualitative tests. Tarnanas et al. [24] used a semi-immersive environment to develop a fire evacuation virtual reality Day Out Task (VR-DOT). It measured physical, cognitive, and functional disability of six separate scenarios (naturalistic tasks) as employed by VR-DOT. In contrast, Allain et al. [25] assessed everyday action deficits of AD patients by contrasting the performance of the virtual task with the actual preparation of a cup of coffee using a virtual kitchen. In addition, a 3D touch screen was used in C. Zucchella et al. [26] to test everyday living behaviors and smart aging tasks. Determination of pre-dementia conditions depends on scores for each task within a kitchen area.

3. System Model

Based on computer aided diagnosis (CAD) tools, the current study combined a model for VR system-based cognitive tasks, and machine learning algorithms were proposed as the Medical Visuospatial Dementia Test (MVD Test). The developed model contains multiple cognitive methods to assess the impairment of the cognitive abilities of patients and uses classification tools. The performance of participants is compared with an individual’s diagnosis based on traditional neuropsychological tests used for the same cognitive domains: (i) older adults who have normal cognition; (ii) MCI; and (iii) early and moderately severe dementia. It was designed for all people in the world, including both educated and non-educated. The system was tested on 115 real patients from King Abdul-Aziz Hospital Dr. Soliman Fakeeh Hospital, Association of Elderly People Friends, and International Medical Centre. Thirty of these individuals had a cognitive impairment, sixty-five were cognitively healthy, and twenty had a mild cognitive impairment. The age of all patients was higher than 50 years, and patients were selected from both educated and non-educated backgrounds. The nature of the collected data was discrete, non-parametric, non-normalized, and labeled. Consequently, supervised and classification algorithms were used to classify the patients. The data were used as an input for the MLAs that perform a classification at the output end. In addition, for the MLAs, a series of statistical indicators were computed: accuracy, sensitivity, precision, and specificity. In the subsections that follow, we discuss the architecture model used to classify dementia patients, as shown in Figure 1.

3.1. Patient’s History and Demographic

The first stage that must be performed when using the system is enrolment, which is a record that can be used to measure the outcomes that were achieved for all patients. In the proposed system, the patient’s enrolment must be recorded, including clinical diagnosis, personal information, vision impairment problems, patient and medical histories, and depression.

3.2. System Approach

Firstly, the patient listens to the instructions of the system. Then, to prepare him/her for the examination, the patient is given a tour around the environment. The objective is for the patient to hold the most recognizable scenes in their memory. The environment consists of a sea-view lane, some shops, and a supermarket. Four of the cognitive tasks are carried out by the patient; each test provides cognitive scores. The information is compiled, and sensitivity and precision are then extracted from the system. This information is used by the machine to diagnose the patient’s cognitive disability. Each test involves tasks in a particular scenario in which cognitive testing is carried out (Figure 1).

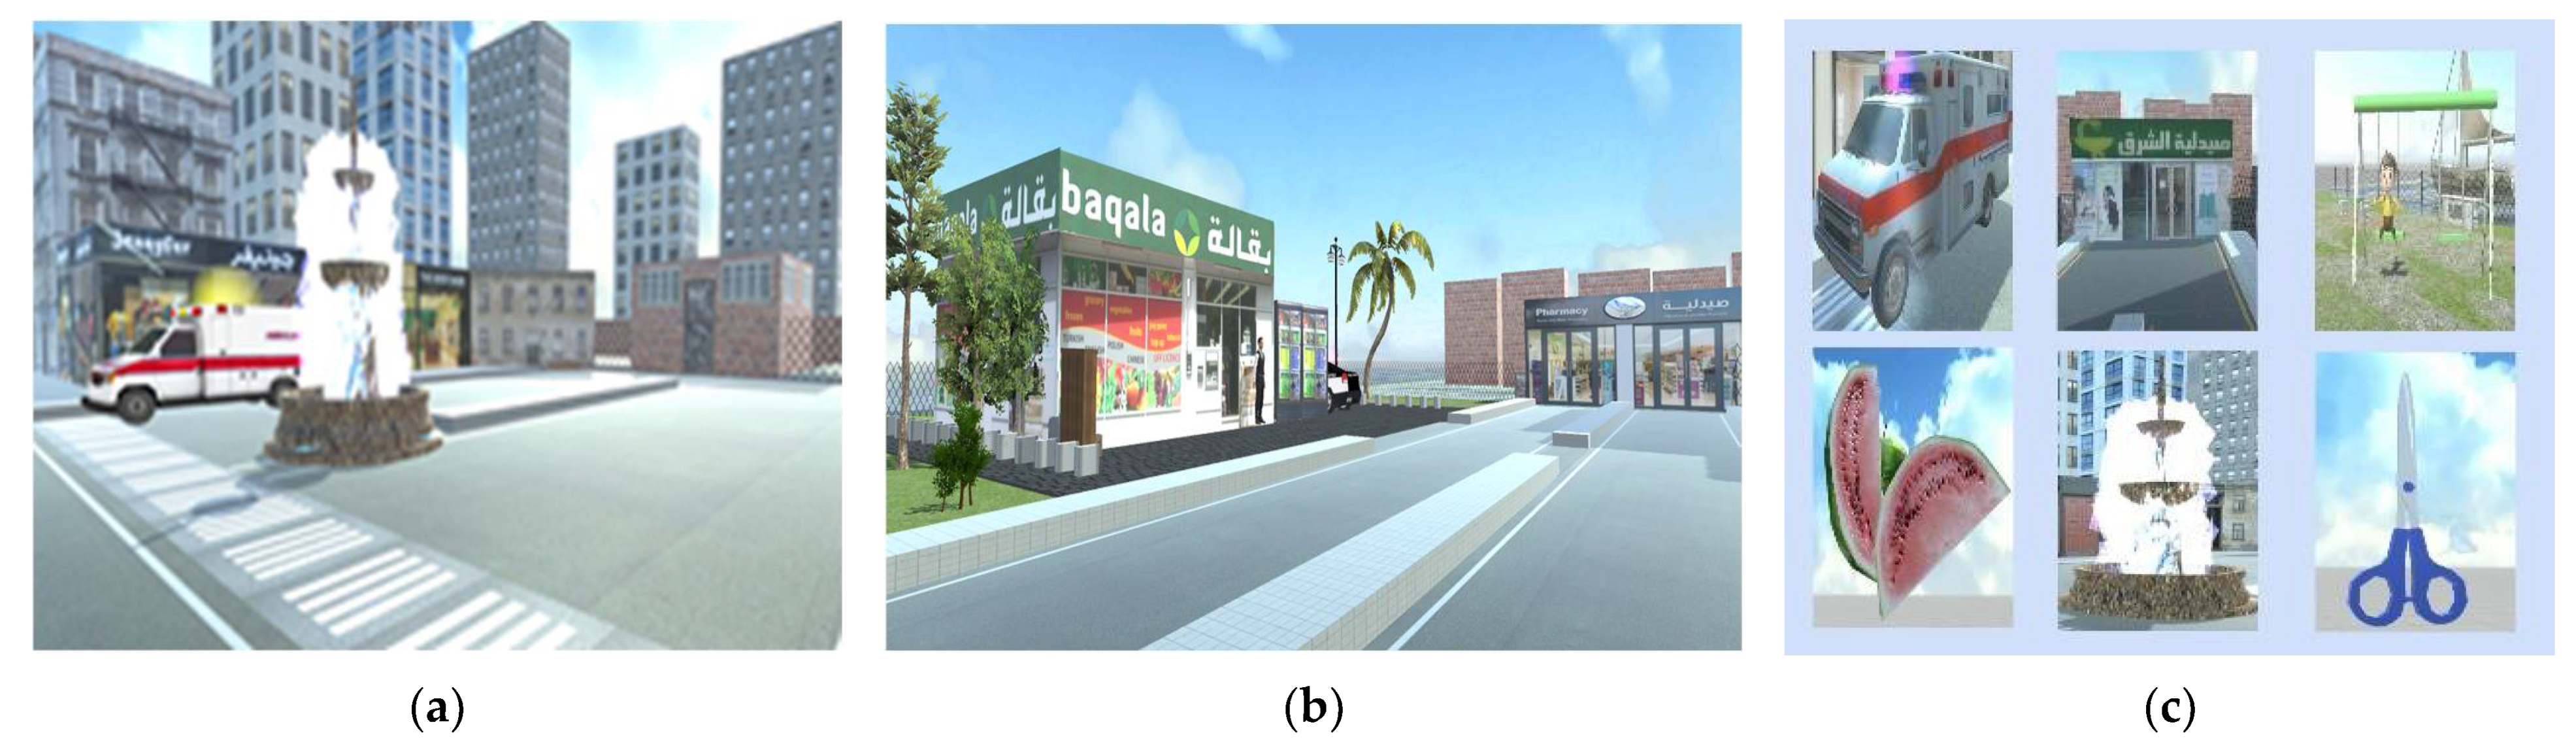
3.3. Visuospatial Function

Visuospatial function is commonly conceptualized in three components: visual perception, construction, and visual memory [27]. The task involves detecting and localizing a point in space, detecting and judging direction and distance, and detecting and topographical orientation.

3.3.1. Navigational Task

In a simulated world, the researcher applies a navigation test algorithm to determine the patient’s navigation ability (Figure 2). To shift the avatar to the right route, a hardware input device (a controller/joystick) is used that has four directions (right, left, front, back). The method tests three domains in this environment: judgment of direction, topographical orientation, and distance [4]. The navigational task is one of the important VR-based simulation techniques for detecting dementia at an early stage. The mission is carried out using the following steps:
  • A simulation is shown by the system so that the patient can see the path from the starting point to the destination.
  • To assess judgment of directions and to set points according to the response, the patient answers several questions.
  • The system measures total time and the path coordinates of the patient during the task.

3.3.2. Visual Memory Task

There are different domains under visual memory: recognition recall, topographical memory, and/or visual information, which includes the perception of the spatial orientation to enable walking in the surrounding environment [4] (Figure 2). The mission is carried out using the following step:
The system shows many photos, then the patient tries to remember if they were previously shown.

3.4. Memory Function

Memory is the most predominant cognitive dysfunction domain preceding the diagnosis of dementia. This study was focused on memory delay recall and visual memory.

Memory Registration and Delayed Recall Task

This study used the three word recall algorithm to assess memory deficits in dementia patients [25]. This test helps doctor to assess the extent of memory loss in a normal and intuitive manner (Figure 2). The mission is carried out using the following steps:
The system asks the patient to repeat three words and focus on them during the registration stage.
The patient navigates in the VE to reach the y-place, then the system asks the patient to pronounce the previous three words.

3.5. Outcomes Measurements

To detect cognitive disability in patients, a number of factors are calculated: VR score, patients’ history, time to completion, and neuropsychological assessment. The total time taken to finish the visual memory task is also recorded. VR scores include navigational ability, spatial orientation, memory recall, visual memory correct, and visual memory incorrect.

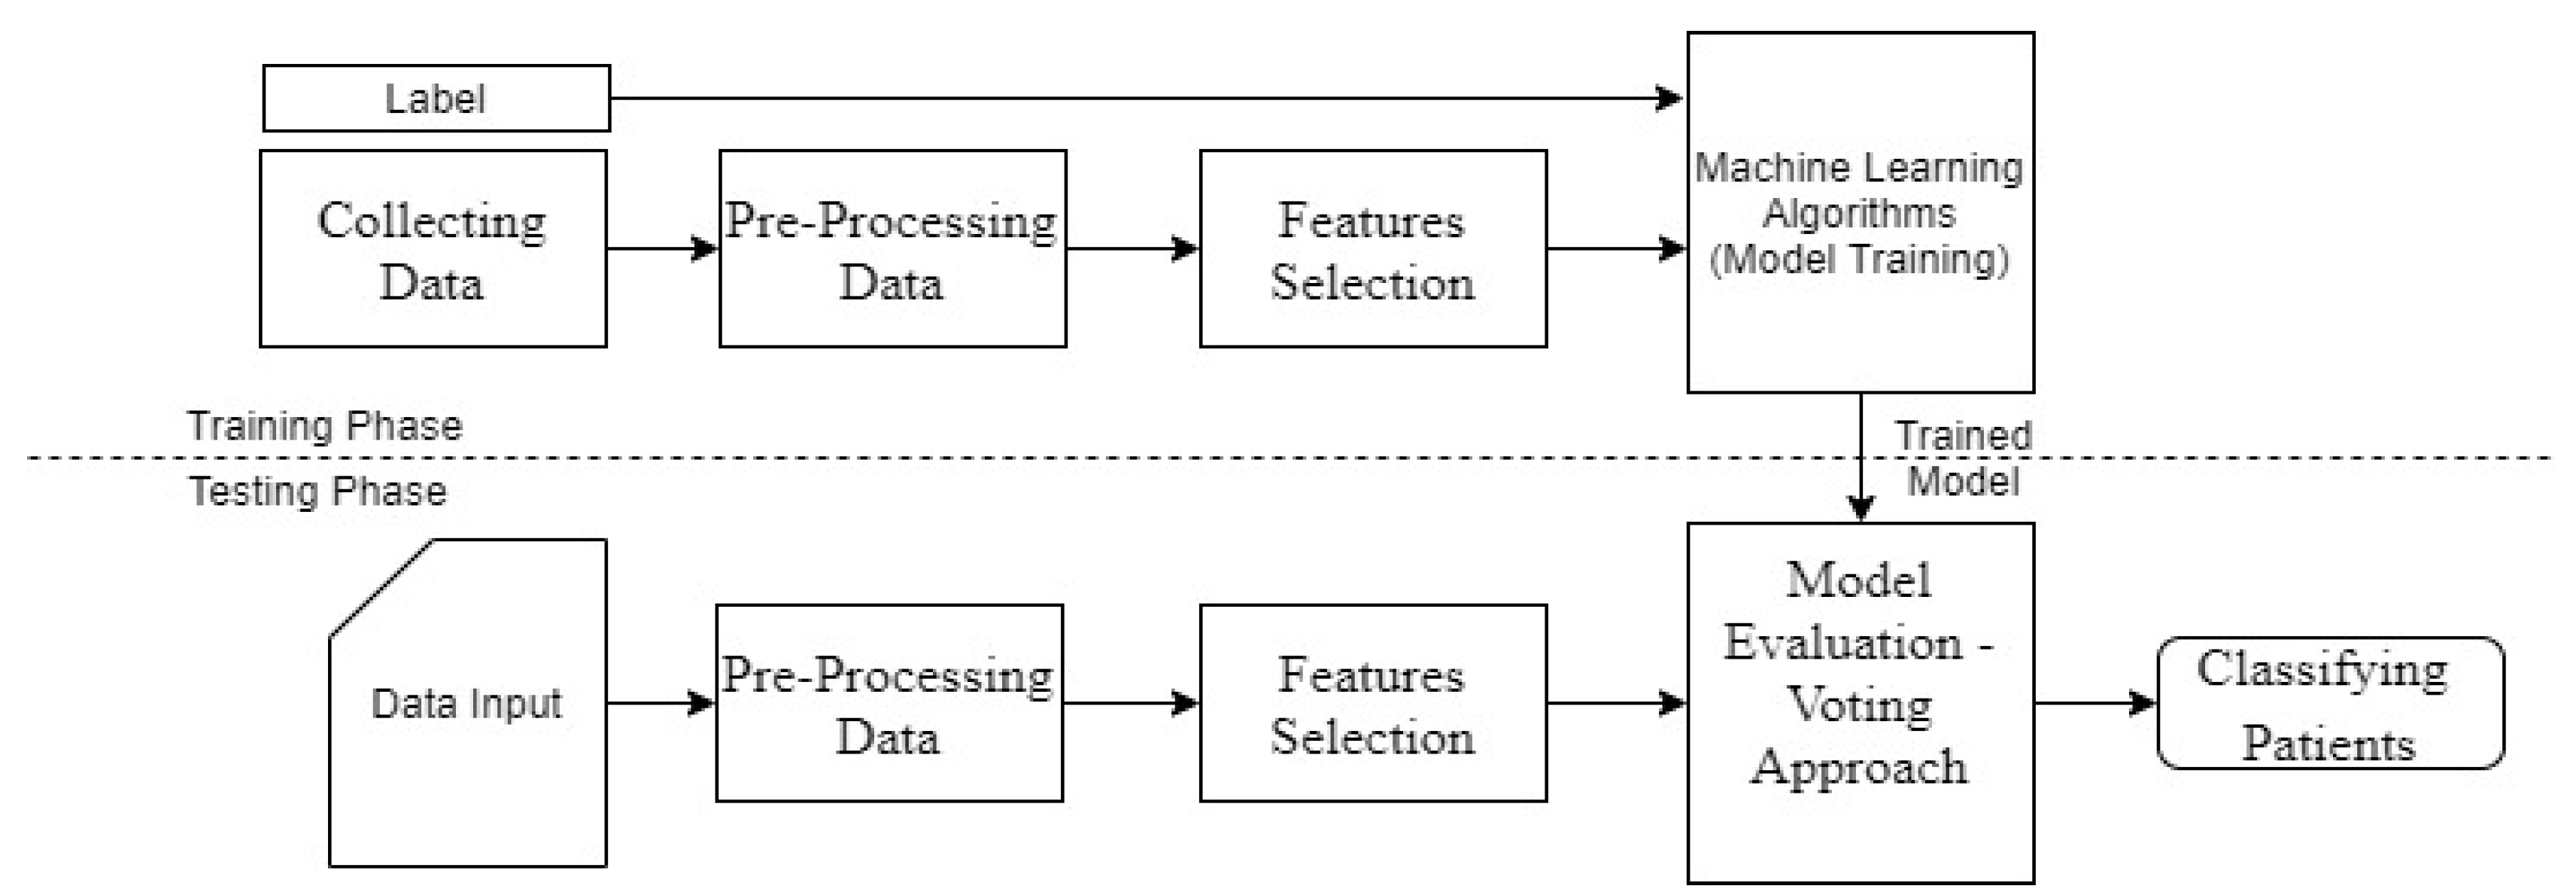
3.6. Machine Learning Algorithms

A patient’s classification depends on each patient’s outcomes. Machine learning algorithms are used in this platform to classify patients into three categories: (i) patients suffering from dementia; (ii) healthy older patients; and (iii) MCI patients. In addition, this platform uses more than one MLA to vote for a higher rating through a plurality voting approach, thus offering accurate information and high diagnostic accuracy of patients’ classification.
During the training phase (see Figure 3), a feature selection approach is used to choose the most important features. The fundamental knowledge about each input is captured by these feature sets. Then, to create a model, feature sets and labels are fed into the machine learning algorithm.
During the testing phase, the same feature is used with new data. These feature sets are then fed into the model, which generates predicted labels (see Figure 3).

Pre-Processing Data

Different software and programing languages were used in this system, including software to deal with C#. Unity, 3D Max, Adobe Illustrator, Jupyter Notebook, Python, and Java Script were used to create the VR system. Data directly from the VR system was stored in the Apache database web server XAMPP using PHP. Then, the data format was converted to CSV in order to make it compatible with Python. The non-numerical data elements were then converted into numerical formats.
The nature of the collected data is discrete, non-parametric, non-normalized, and labeled. Consequently, supervised and classification algorithms were used to classify the patients. The data were used as an input for the MLAs that perform a classification at the output end. In addition, for the MLAs, a series of statistical indicators were computed: accuracy, sensitivity, precision, specificity, F1, and Receiver operating characteristic (ROC) curve.
The MVD system extracts the most important attributes depending on a heatmap, which assigns values between −1 and 1. Then, features are used as inputs for the classifier (see Figure 4). For example, Memory Recall-VaR System and Navigational ability appear to have a strong correlation (0.90) with each other.
Similarly, there is a strong correlation between Visual Memory correct and both Spatial Orientation (0.68) and Memory Recall (VR system) (0.70). In contrast, there is a negative strong correlation between Memory Recall accuracy (VR system) and Time consumed in first task (−0.42). In other words, the longer taken in the VR task, the poorer their subsequent memory recall.

3.7. Classification Process

By constructing a model based on one or more numerical and/or categorical variables, classification is the task of defining and sorting items from certain classes into their appropriate categories (predictors or attributes). The purpose of classification is to be predictable in order to ensure all data is reliable and accurate [28]. The main idea of classification is to build by selecting the objects in certain classes and assigning them to their appropriate categories, predictors, or attributes [19]. This study focused on classification methods in which classifying patients depends on multiple algorithms, i.e., Decision Tree [29], Extra Trees [30], AdaBoost [31], XGB [32], Gradient Boosting [33], SVC [34], Random Forest [35], Multinomial NB [36,37], K-Neighbors [38], and MLP [39]. These algorithms are used for disease diagnosis as they achieve good accuracy. Then, a voting approach, namely Ensemble Vote [40], is used to vote for the most frequently used approaches from the latter MLAs. The next paragraphs discuss the classification methods that were applied in this study.

3.7.1. Decision Tree Classifier

A Decision Tree Classifier is defined as a multistage classification strategy, and is a classifier expressed as a recursive partition of the instant space [41]. It is an attribute-vector approach, and can be applied to the tree, the leaf node of the tree labeled with a class, or a structure containing a test. The classification process is completed by performing the test on the attributes, reaching one or another leaf. The Decision Tree Classifier builds hyperplanes/partitions to divide the space between the classes [41].

3.7.2. Extra Trees Classifier

The Extremely Randomized Trees Classifier is an extremely randomized version of the Decision Tree Classifier, and is a type of ensemble supervised learning technique that fits a number of randomized Decision Trees [30]. It is used for improving the predictive accuracy by using the average of the data within a dataset. It is very similar to a Random Forest Classifier but differs in the construction of the Decision Trees.

3.7.3. AdaBoost Classifier

Introduced in 1995 by Freund and Schapire [31], the principle of AdaBoost is to fit a sequence of weak learners where the predictions are combined through a weighted majority vote to produce the final prediction [33]. AdaBoost can be used for multiclass classification.

3.7.4. Gradient Boosting Classifier

This classifier is used for classification tasks and supports both binary and multiclass classification. It creates a strong predictive model from combining many weak learning models [33], and is used to reduce the loss between the actual training actual class and the predicted class value.

3.7.5. XGB Classifier

This classifier is a system optimization that is a customized version of the Gradient Boosting Decision Tree system. It is a tool used to extend the computation limits of what is possible for Gradient Boosting algorithms to provide a portable, scalable, and accurate library [32].

3.7.6. Random Forest Classifier

The Random Forest Classifier is an ensemble algorithm that consists of a large number of relatively uncorrelated models (trees) [42]. A class prediction comes from each individual tree in the Random Forest. Then, the class having the most votes becomes the model’s prediction [42].

3.7.7. Multinomial Naive Bayes (NB)

Multinomial Naive Bayes is a uni-gram language model with integer word counts [36]. It is an appropriate distribution when the data consists of counts [36]. It should be used for the features with discrete values such as 1, 2, 3. This approach has also been used for text classification.

3.7.8. Support Vector Classifier (SVC)

The most applicable machine learning algorithm is the Support Vector Classifier. It builds an optimal hyperplane, which is used for linearly separable patterns [34]. The optimal hyperplane is elected after fitting the data and returning the best fitting hyperplane for classifying patterns [43].

3.7.9. K-Neighbors Classifier

This is a non-parametric method used for either classification or regression. The data are classified by voting for the K-closest neighbors training in the feature space [38]. To find the closest similar points, the distance between points can be determined using distance measures such as Manhattan distance and Euclidean distance [38]. The prediction comes from the most votes for each object for its class. The models are generated with no requirement for training data-points.

3.7.10. Multilayer Perceptron

Multilayer Perceptron is a classical type of neural network. MLPs are suitable for classification prediction because they are capable of mapping highly non-linear relations between inputs and outputs and provide good performance [39].

4. Performance Evaluation and Discussion of Results

In this work, we used different MLAs that measured the accuracy of the ML algorithms’ classification of the patients into three classes: dementia, mild cognitive impairment, or healthy older adults.
Evaluation metrics such as sensitivity, specificity, accuracy, F1, precision, Mean Squared Error (MSE), the ROC curve, micro-average, and macro-average were used to determine the performance of the ML models. The different MLAs that were used to measure the classification of patients included: Extra Trees, SVC, AdaBoost, K-Neighbors, XGB, Decision Tree, MLP, Multinomial NB, and Random Forest. In the next subsections, the training and testing phases are explained, and the performance results of the MLAs and the learning curve are discussed in detail. Then, the results are generalized by the voting approach, namely Ensemble Vote [40]. Visualization data are explained in the final two subsections.

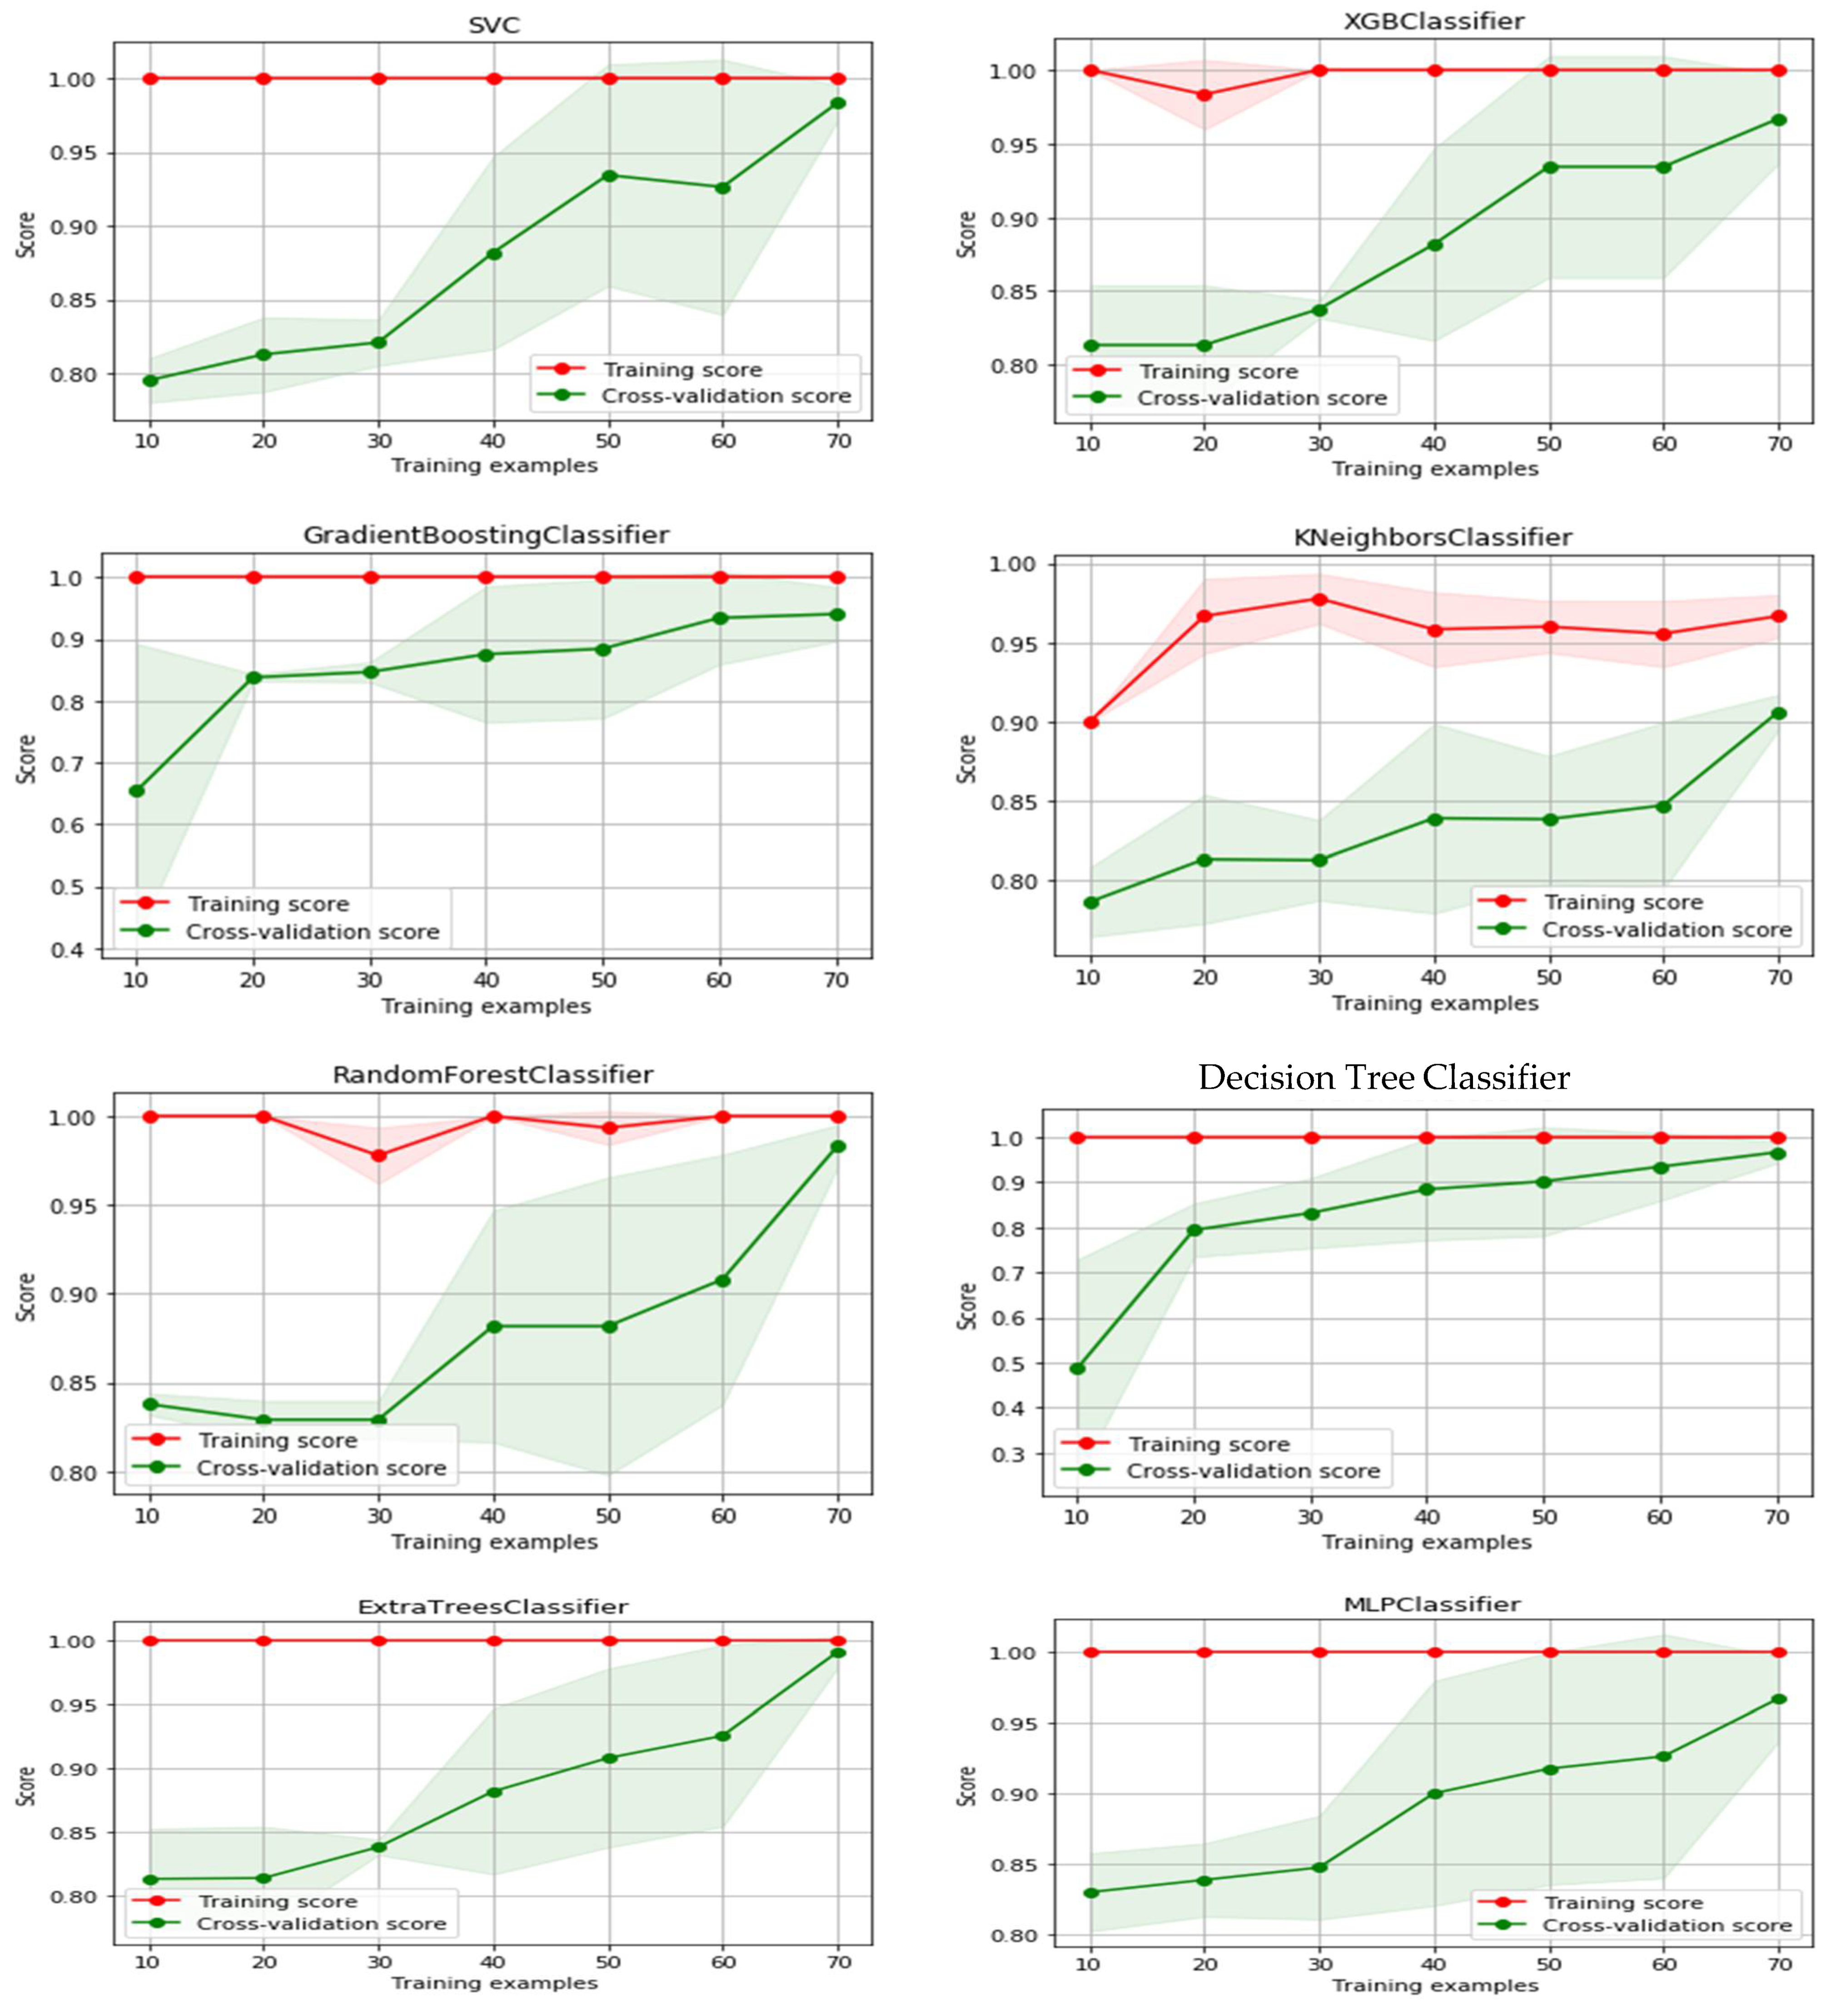
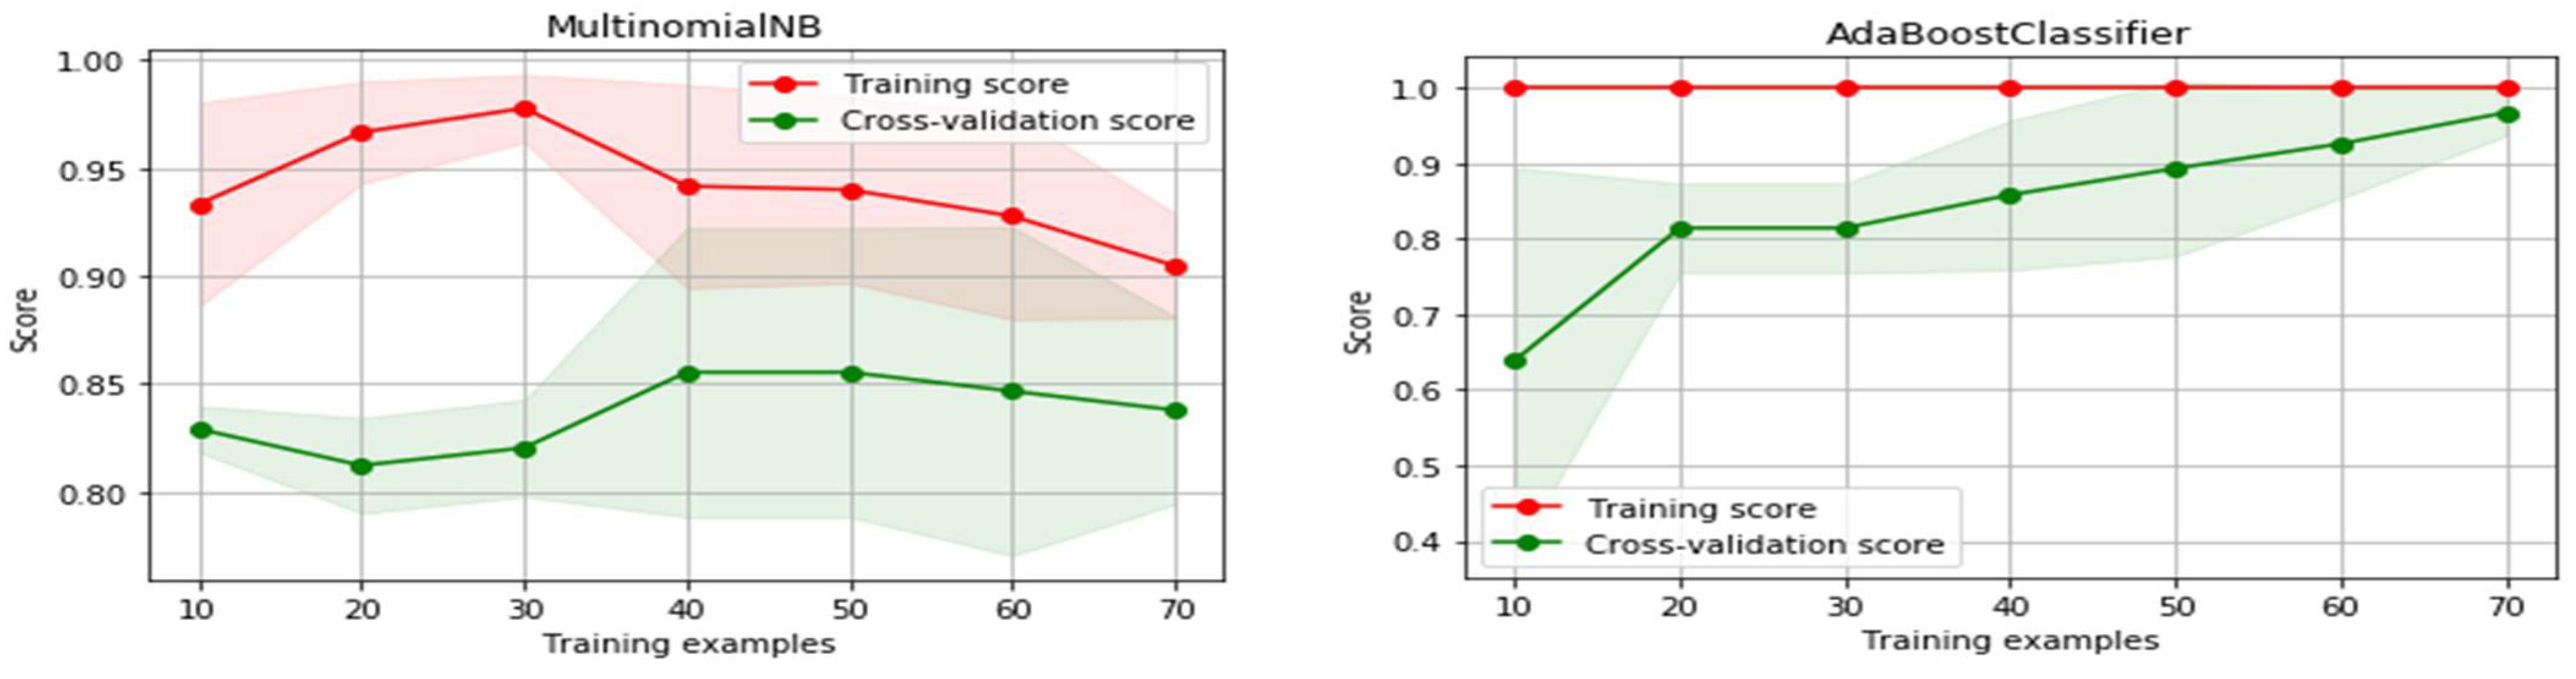
4.1. Training and Testing Phase

In the training phase, this study used ten classifiers to train the data. The procedure started by splitting the data into a 70% training dataset and a 30% testing dataset. Then, each approach built its model (with a specific structure). The models were then tested to check their effectiveness using measures such as accuracy, sensitivity, specificity, MSE, F1, micro-avg, macro-avg, and the ROC curve.

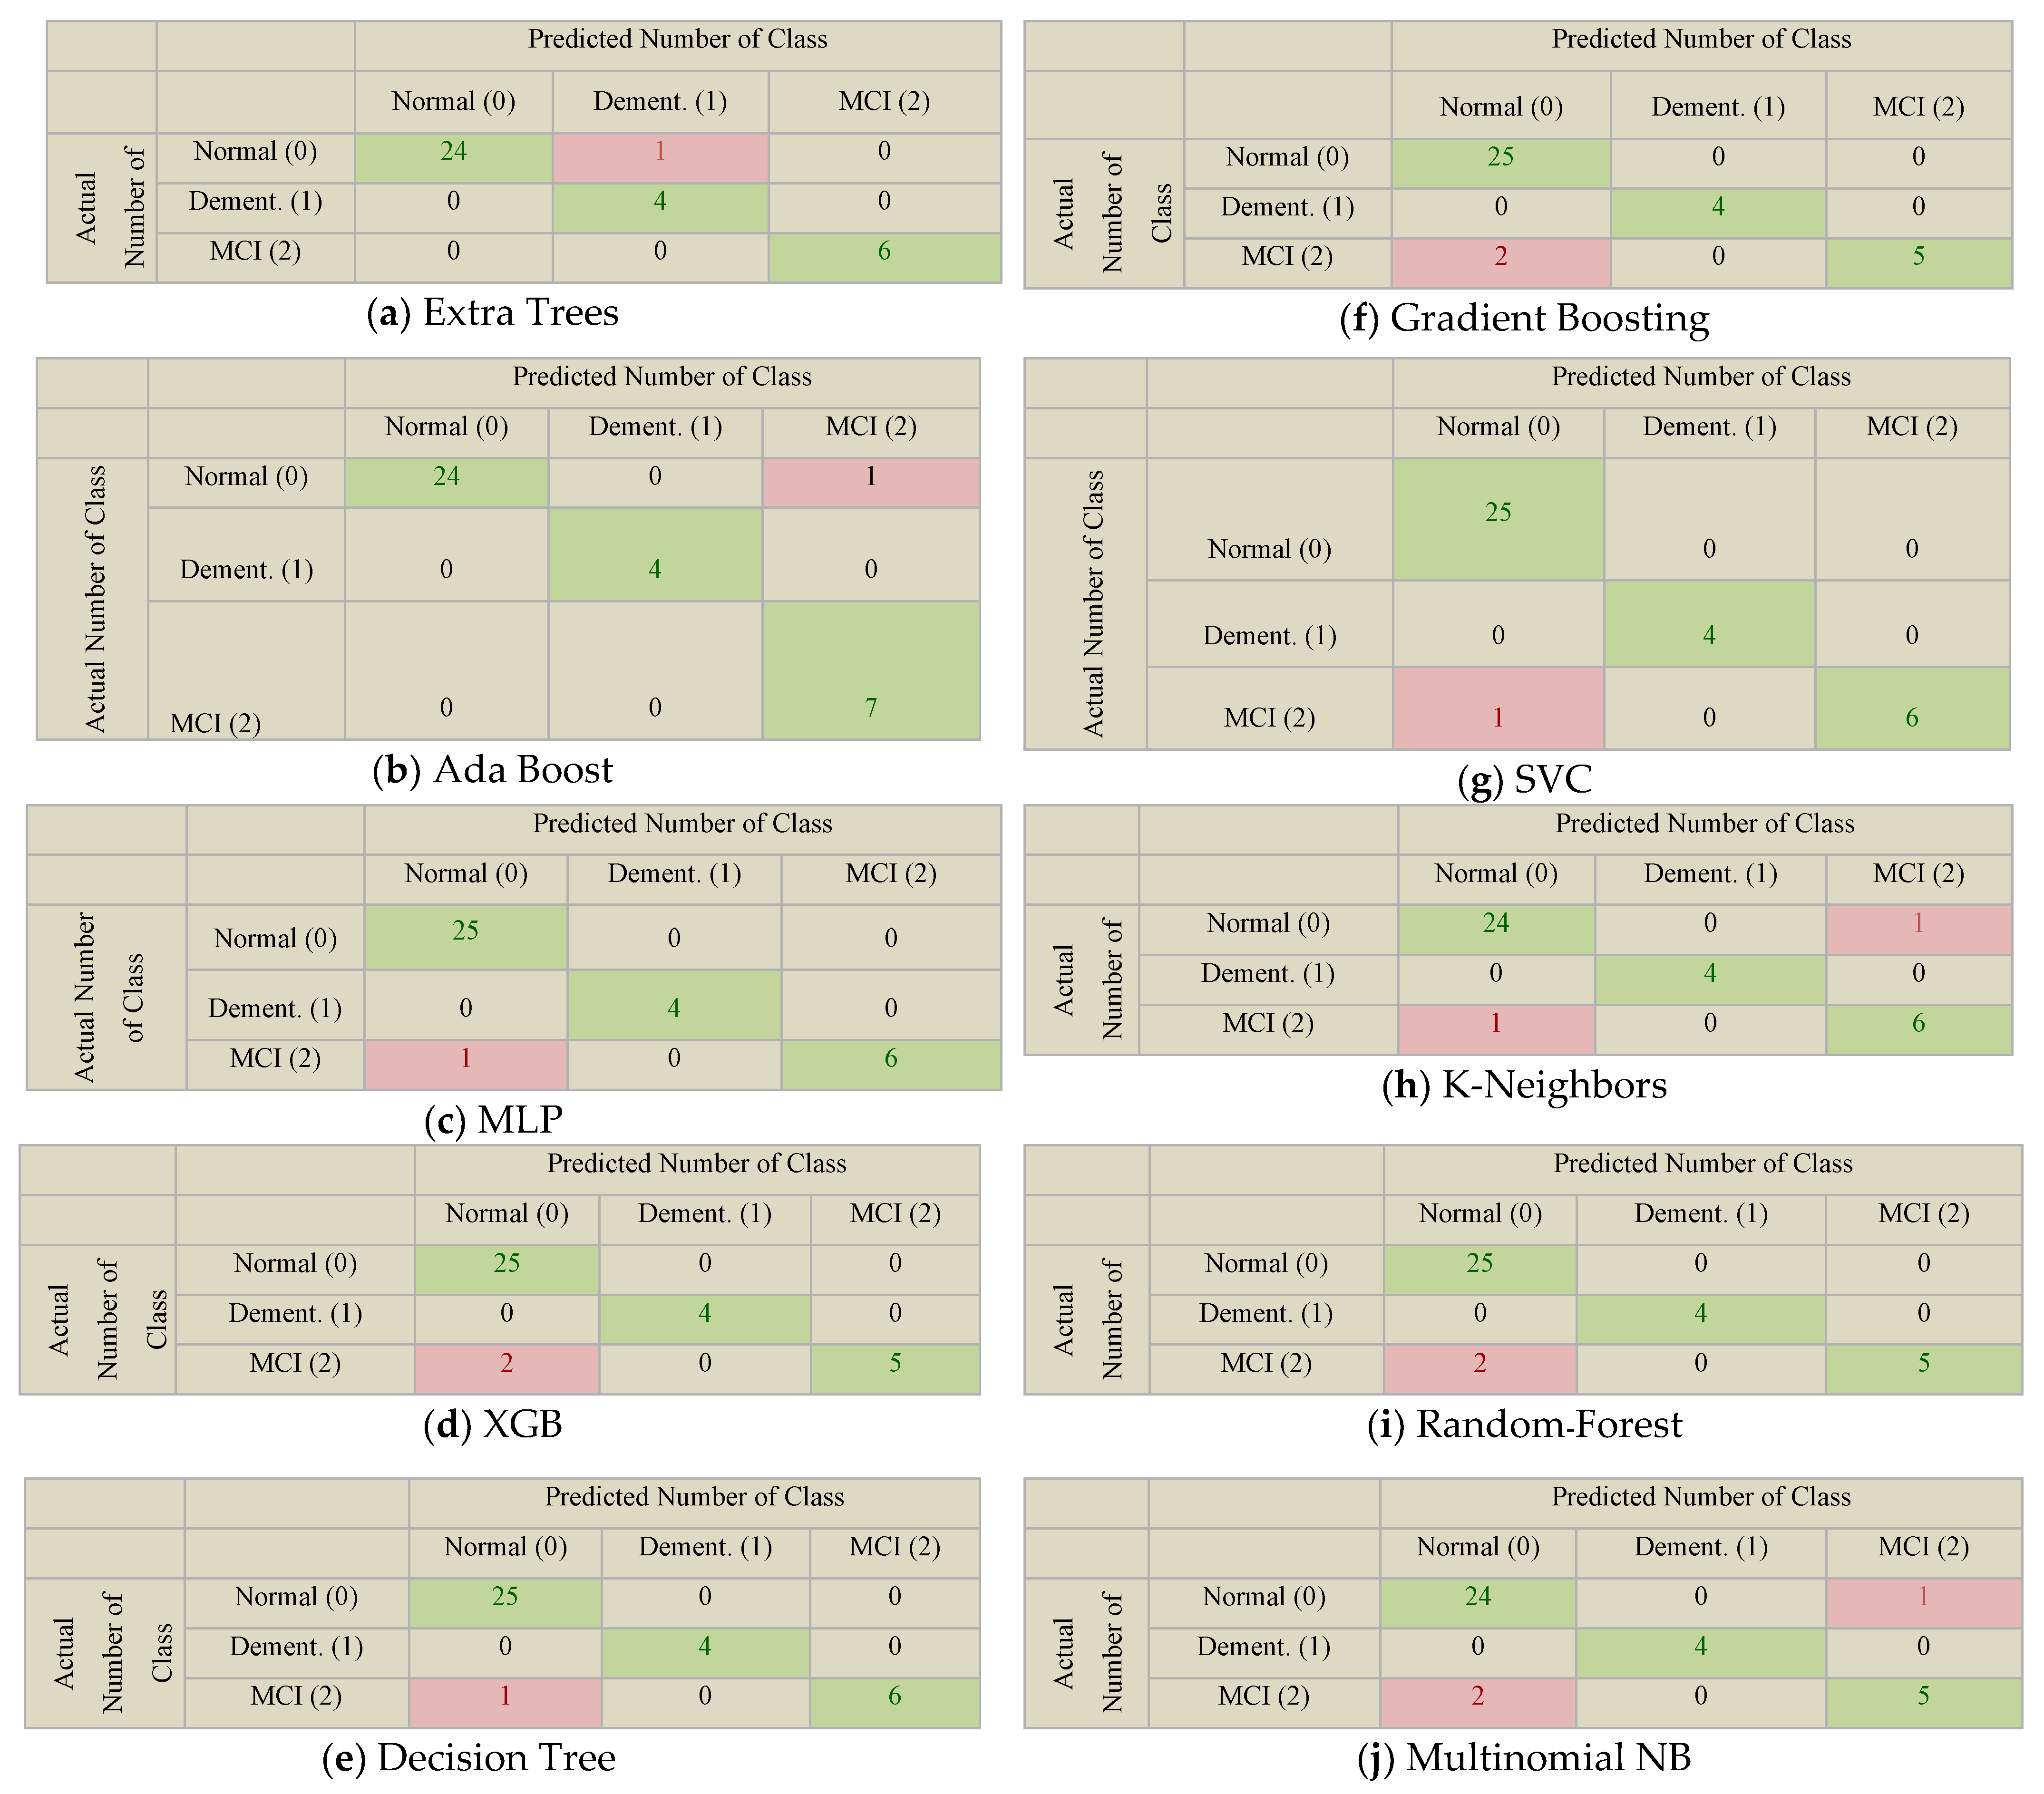
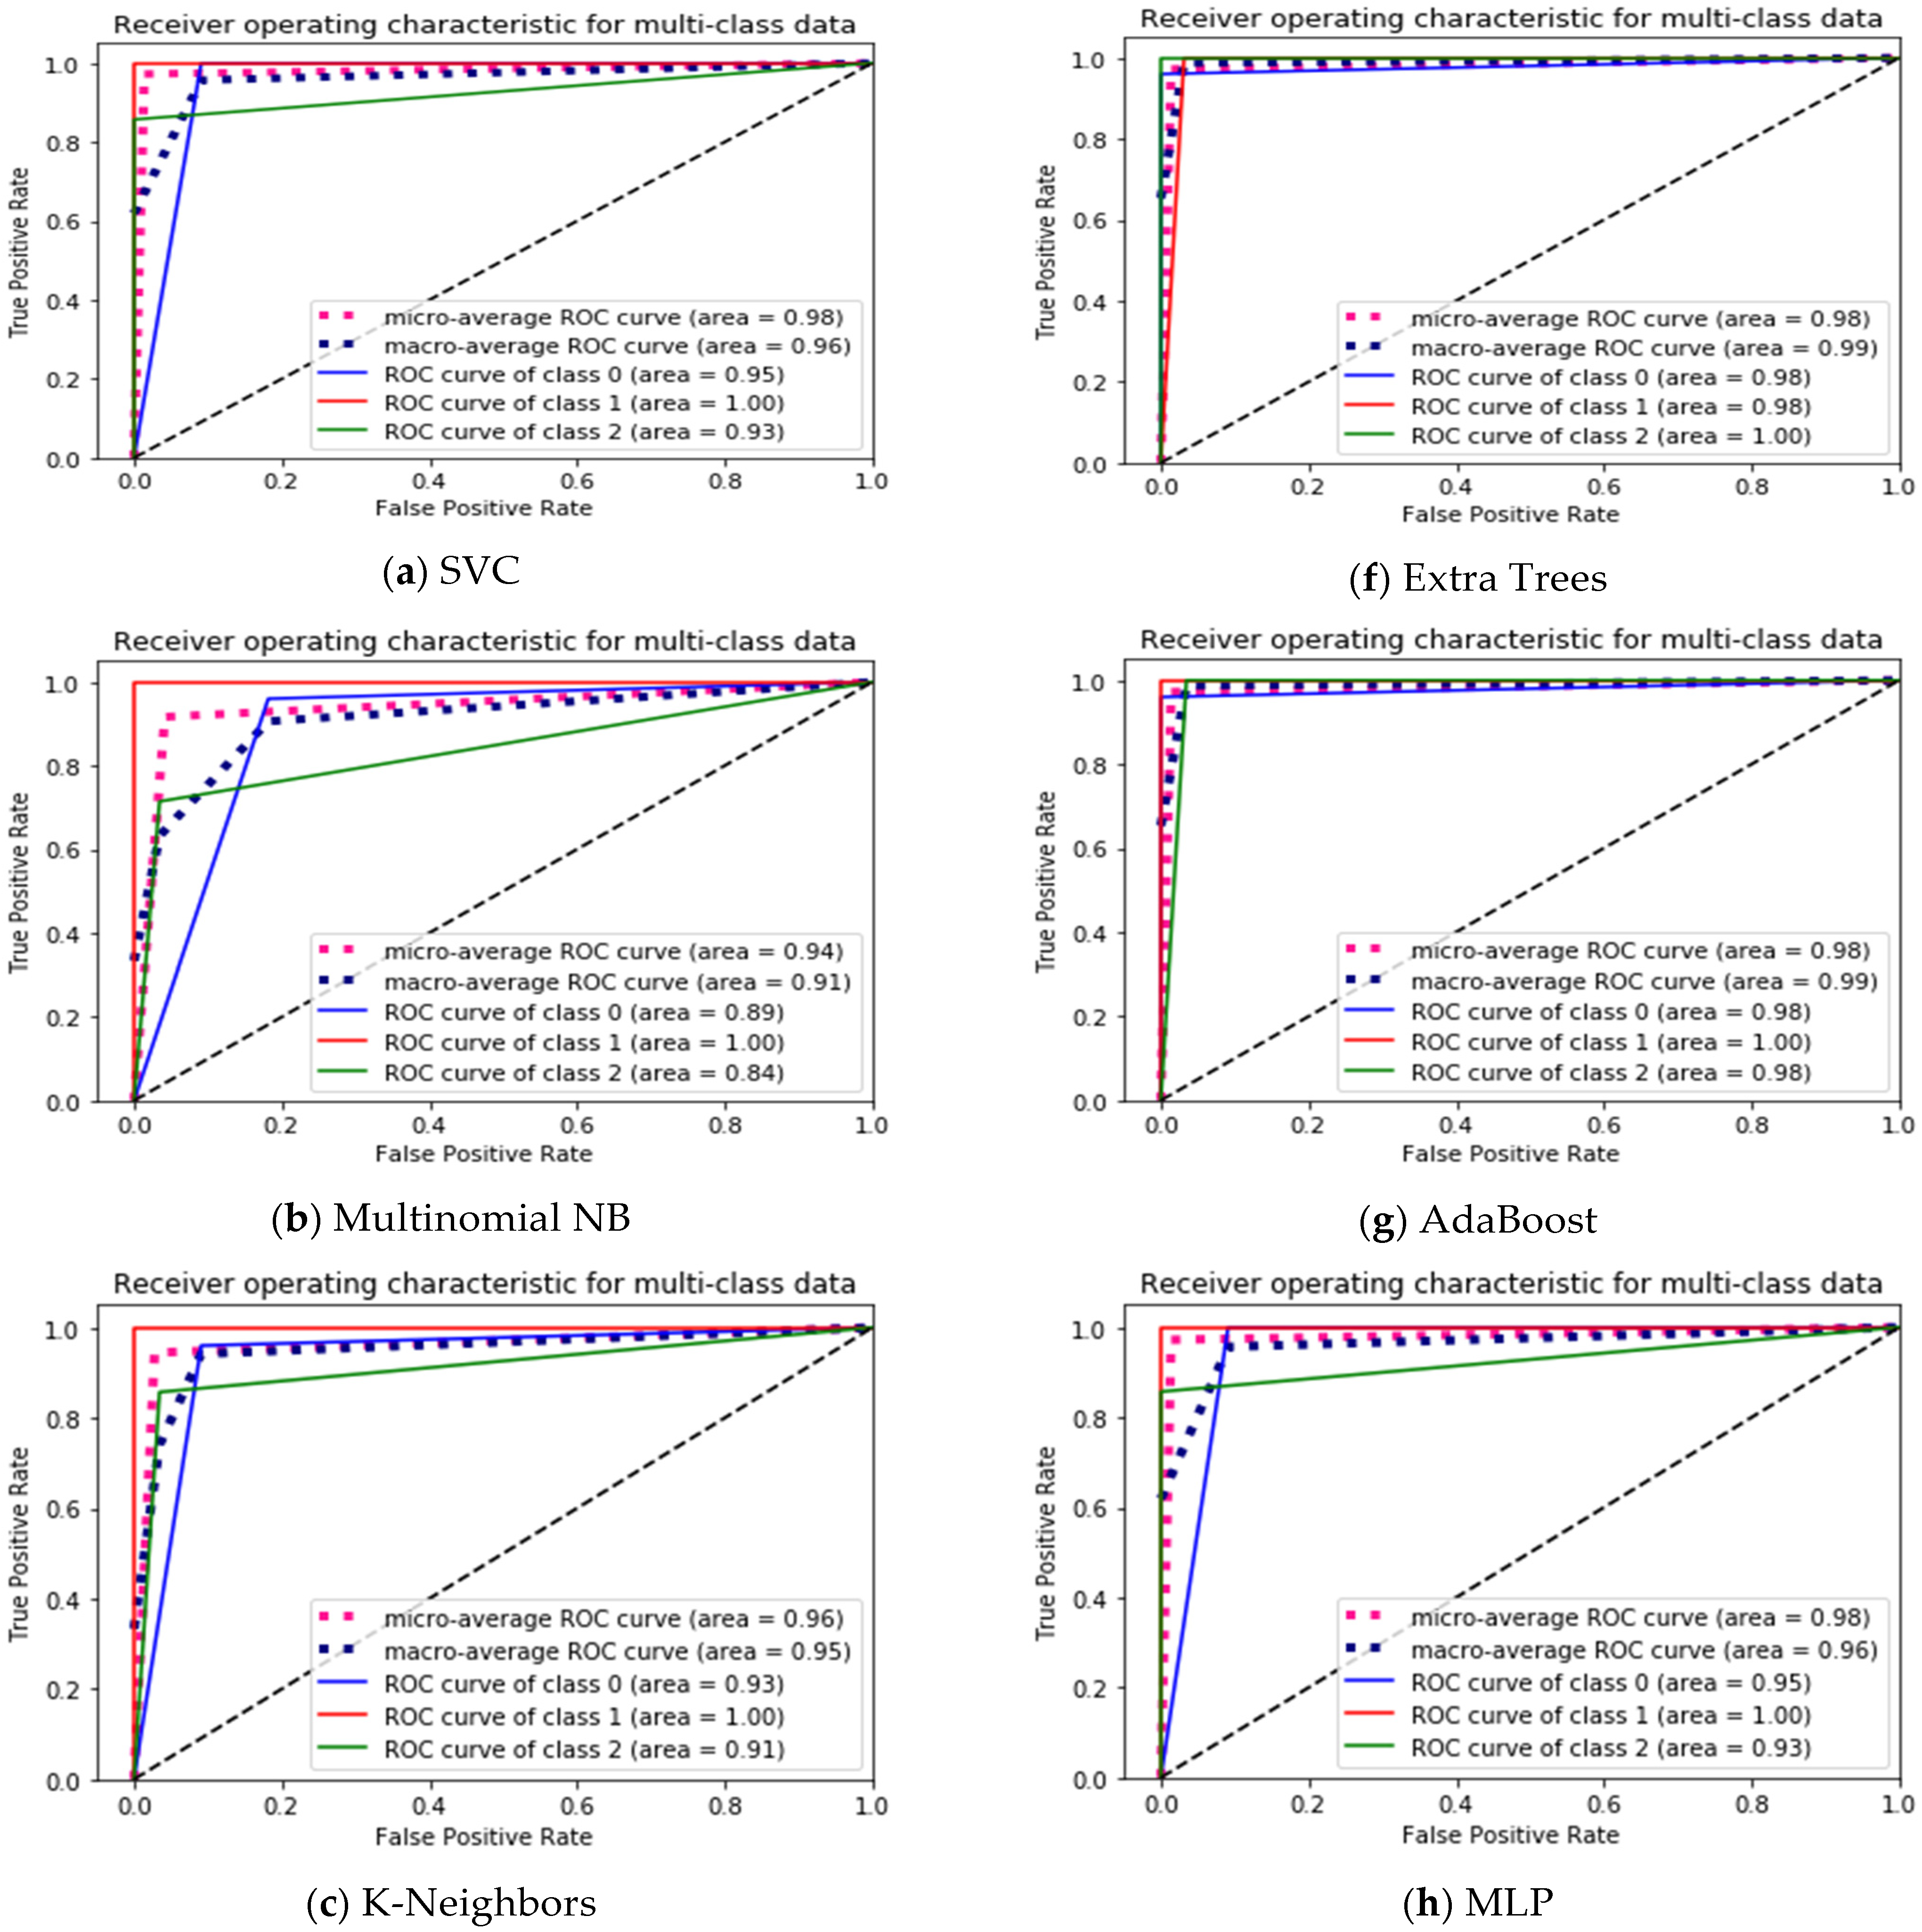
4.2. Evaluation Perfotrmance of ML Model

After the testing phase, different metrics were used to evaluate the performance of the ML models: sensitivity, specificity, accuracy, F1, precision, the ROC curve, MSE, micro-average, and macro-average. The evaluation metrics were extracted from a Confusion Matrix (CM), which gives a summary of the prediction results for a classification problem (see Figure 5). This study calculated the evaluation metrics for each class of multi-categorical classification model (normal = 0, dementia = 1, MCI = 2) to understand the actual prediction results. Furthermore, the CM shows the actual # of classes and the predicted # of classes.
As shown in Figure 5, the CM shows the number of false negative (FN), false positive (FP), true negative (TN), and true positive (TP) [44]. A true positive (TP) is a result where the positive class is correctly predicted by the model, and a true negative (TN) is a result where the negative class is correctly predicted by the model. In addition, a false positive (FP) is an outcome where the positive class is incorrectly predicted by the model, and a false negative (FN) is an outcome where the model wrongly predicts the negative class. As can be observed from Figure 5:
  • TP for Dementia class in SVC = CM [1][1] = 4,
  • FN for Dementia class in SVC = CM [1][0] + CM [1][2] = 0,
  • TN for Dementia class in SVC = CM [0][0] + CM [2][2] + CM [0][2] + CM [2][0] = 32,
  • FP for Dementia class in SVC = CM [0][1] + MC [2][1] = 0.
As shown in Table 1, most of the algorithms have high accuracy, of up to 97.22%, which means that most of the participants were assigned to the right class. The actual error rates are suggested as performance measures for the classification procedure. As shown in Table 1, the actual error rate was 0.11 ≤ AER ≤ 0.22, which is an acceptable misclassification rate. This study used 10-fold cross-validation procedures to train the data and to validate the model effectiveness. Cross-validation is a technique that trains a particular set from the whole dataset, while it reserves the remaining data by splitting it into 10 folds. Then, it builds the model on 10th folds of the dataset. After the model is built, it is tested to check the effectiveness for the 10th folds. This procedure is repeated with the latter steps while recording the accuracy and errors, until each of the ten folds has served as the test dataset. The performance metrics of the model were extracted from the average of k records. Ten-fold cross-validation procedures showed high values in most models where the dataset was split into 10 folds. The highest percentage was 99.14% for Random Forest and Extra Trees, as shown in Table 1.
The learning curve is measured according to the accuracy of testing data, based on the different percentages of training data. Varying sizes of the training data subset were used to train the classifier. Then, each training subset size was given a score and the test set was computed. Table 2 reveals that the accuracy increased when the size of the training data increased in all models. When the percentage was 10%, most of the models showed results between 49% and 84%, and when the percentage of training data was from 20% to 40%, the percentage of testing data was between 79% and 89%. In the same way, the percentage of testing data was between 84% to 93% when the percentage of training data was from 50% to 60%. Thereafter, most of the models showed high percentage values of 97% when the percentage of training data was 70%, such as XGB, Extra Trees, AdaBoost, MLP, and Decision Tree, whereas Random Forest and SVC showed the highest performance of 98%.
As can be observed from Figure 6, the learning curve of SVC, XGB, Extra Trees, AdaBoost, MLP, Decision Tree, and Random Forest showed an increase in the testing score when training data size was increased. In contrast, the training score and the testing score were both not very good in Multinomial NB, for which the training score was high at the beginning, then decreased when the training data increased. Moreover, the test score remained at the same level (i.e., it did not increase with increased training).
Other metrics used in this study were sensitivity, specificity, and precision. Sensitivity [45] is the proportion of true positives that are correctly identified by the test.
The sensitivity of cognitively healthy participants in all methods was between 0.96 to 1 (i.e., 100%), which means that most of the cognitively healthy participants were predicted to be cognitively healthy. The sensitivity of dementia patients (as shown in Table 3) was 100% for all models; in other words, the proportion of participants suffering from the disease who were correctly identified as those suffering from the disease was 100% for each of the models. Similarly, the sensitivity of cognitively impaired patients MCI was 100% in Extra Trees, AdaBoost, and Gradient Boosting, whereas the sensitivity of MCI was between 71% and 86% in the rest of the models.
Specificity [45], aka recall, is the proportion of true negatives that are correctly identified by the test. The specificity of cognitively healthy participants was 100% in Extra Trees, AdaBoost, and Gradient Boosting. Furthermore, the specificity of cognitively healthy participants in the rest of the models (as shown in Table 3) was 0.82 ≤ specificity ≤ 0.91. A higher value of specificity refers to a lower proportion of participants who are unhealthy but are predicted as being cognitively healthy [45]. Participants suffering from dementia had a higher value of specificity, equal to 1, in all models except Extra Trees, which means no classes other than dementia patients were labeled as belonging to dementia class. Similarly, the specificity of MCI class was equal to 1 in most of the models, revealing that no cognitively healthy or patients suffering from dementia were classified as MCI.
Precision [46] is the proportion of correctly predicted positive values against all the positive predictions. The higher the precision, the better. It helps when a model has very high precision. In contrast, if a model has low precision, it indicates that the rate of false positives is high, which signifies a misdiagnosis. As can be observed from Table 3, the precision of cognitively healthy participants showed the perfect percentage of 100% in AdaBoost, Extra Trees, and Gradient Boosting, whereas the precision of cognitively healthy participants in the rest of the MLAs ranged from 92% to 96%. Similarly, cognitively impaired patients showed the perfect percentage of 100% precision in all models except Extra Trees (as shown in Table 3). In the same way, the findings of precision showed a high percentage in most of the models in the MCI class.
The F1-Score is the equally weighted harmonic mean of recall and precision. F1-Scores in all MLAs ranged from 94% to 98%. Patients suffering from dementia showed the perfect percentage of 100% for all models except Extra Trees. Similar to the precision and recall results in the MCI class, F1-Scores showed high percentage in most of the models, i.e., most of the models yielded high values between 83% and 100%.
When the system classifies multiple class labels, it averages evaluation measures to generalize the results. Further, in order to ensure that there is a range for the measurement of the various metrics, micro-average and macro-average are used to view the average evaluation measures of the general results. The micro-average method is a useful measurement and makes sense when the data size is variant. As shown in Table 4, the micro-avg of recall, precision, and F1-Score revealed an accuracy of 97% or 94% in all models except the Multinomial NB model. In a multiclass setting, micro-averaged precision and recall are always the same. Therefore, each model has the same accuracy micro-avg of recall, precision, and F1-Score. Macro-average metrics are used to assess the system performance across variance datasets. Thus, the values of the macro-average F1-Score, which ranged from 91% to 97%, indicate that the models had high performance in classifying multiple class labels, depending on the average evaluation measures.
The receiver operating characteristic (ROC) curve for multiclass data measures the accuracy of rating and diagnostic test results. It is used to determine the optimal cut-off value that generates a curve in the unit square. The ROC curve is a graphical plot for multiclass data that measures the accuracy of the rating and illustrates the diagnostic test results. It is created by plotting the true positive rate (TPR) against the false positive rate (FPR) at various threshold settings [47]. The minimum acceptable of area under the curve should be 0.5 [47].
As can be observed from Figure 7, the ROC curve of the class of patients suffering from dementia is perfectly equal to 1 in all models except Extra Trees. Similarly, the ROC curve in the MCI class is perfect, and equal to 1.00 in Extra Trees. Furthermore, Ada Boost, Gradient Boosting, SVC, MLP, and Decision Tree are located progressively closer to the upper left-hand corner in the ROC space, with the values being equal to 0.93 or 0.98, which means the performance reflects the high quality of the prediction of disease diagnosis. Furthermore, the micro-avg ROC curve revealed high performance in all models, with values ranging between 94% and 98%. In the same way, the macro-avg ROC curve revealed performance between 91% and 99%. This indicates that the ROC curve of the class of patients suffering from dementia has a greater discrimination capacity than other classes and there is no overlap between them. Overall, the results of the ROC curve were very satisfactory and showed perfect values in disease classification.
As a conclusion, all evaluation metrics used to determine the performance of the ML models revealed that there were high levels of classification accuracy, sensitivity, specificity, precision, F1, ROC curve, micro-avg, and macro-avg. Furthermore, the ranking of the highest performance rates assessed from the SVC, MLP, AdaBoost, Extra Trees, Gradient Boosting, and Decision Tree models showed that there was no distinction between them.

4.3. Generalized MLA Results Using the Voting Approach

The VR machine learning system aims to combine multiple pieces of evidence to arrive at one prediction using a voting approach such as majority voting. An embodiment of this invention employs an applied Ensemble Vote [40,48] using all MLA methods that are mentioned above to obtain the accurate classification. When compared to a single model, this approach provides better predictive performance. As a result, ensemble methods have won numerous prestigious machine learning competitions. Ensemble methods are meta-algorithms that combine multiple machine learning techniques into a single predictive model to reduce variance or bias, or improve predictions [49]. When the quantity of patients’ data increases, using a single algorithm may yield a result opposite to that expected or lower accuracy, and the result may be inconsistent. Consequently, it is necessary to use the majority voting approach instead of choosing a single algorithm as a final result. Ensemble Vote is a list of classifiers that combines similar or different ML classifiers into a single model for classification via majority voting, as shown in Figure 8. After the voting-based ensemble model is constructed, it can be used to make a prediction on new data. Classification Voting Ensemble Predictions are the majority vote of contributing models where the latter classifiers can be implemented by two different techniques: hard and soft voting [40,48]. Hard voting predicts the class label based on the most frequently used label by the classification models, as in Equation (1), whereas soft voting predicts the class label based on averaging the class probabilities, as in Equation (2) [48].
Cx = arg   max i   j = 1 B I ( h j   ( x )   i )  
where hj are given different classification rules, and i is an indicator function [48]
Cx = arg   max i j = 1 B p i j  
where pij is the probability estimate from the jth classification rule for the cation rule for the ith class [48].
Table 5 shows the performance results based on the voting approach using the hard vote method and where all different classifiers have equal weight. The accuracy of classification is 97.22%, and the sensitivity of dementia patients and cognitively healthy patients is 100%, whereas the sensitivity of MCI patients is 86%. Specificity and precision of dementia patients and MCI patients are 100%. As shown in Figure 9, the micro-avg ROC curve and the macro-avg ROC curve are close to 1. Furthermore, the ROC curve for all classes shows high values between 0.93 and 1.00.
The classification accuracy of the traditional clinical diagnosis method vs. the VR + machine learning system was compared in this study. At the early stages of the disease, dementia diagnosis at the clinic (expert diagnosis) is based on functional evaluation and a cognitive test, such as the Mini-Cog test. In this experiment [50], it was discovered that patients’ classification at the clinic, which was based on the Mini-Cog test with functional evaluation, achieved 94% accuracy, whereas the VR system combined with navigational ability achieved 97.22% accuracy using the majority voting approach [50].
Overall, the highest performance was derived from Ensemble Vote, achieving a value equal to 97.22%, which confirms the reliability of the system. In addition, the dementia patients’ class had a greater discriminate capacity than other classes, with all performance results equal to 1. This led to the conclusion that there was no overlap between the classes.

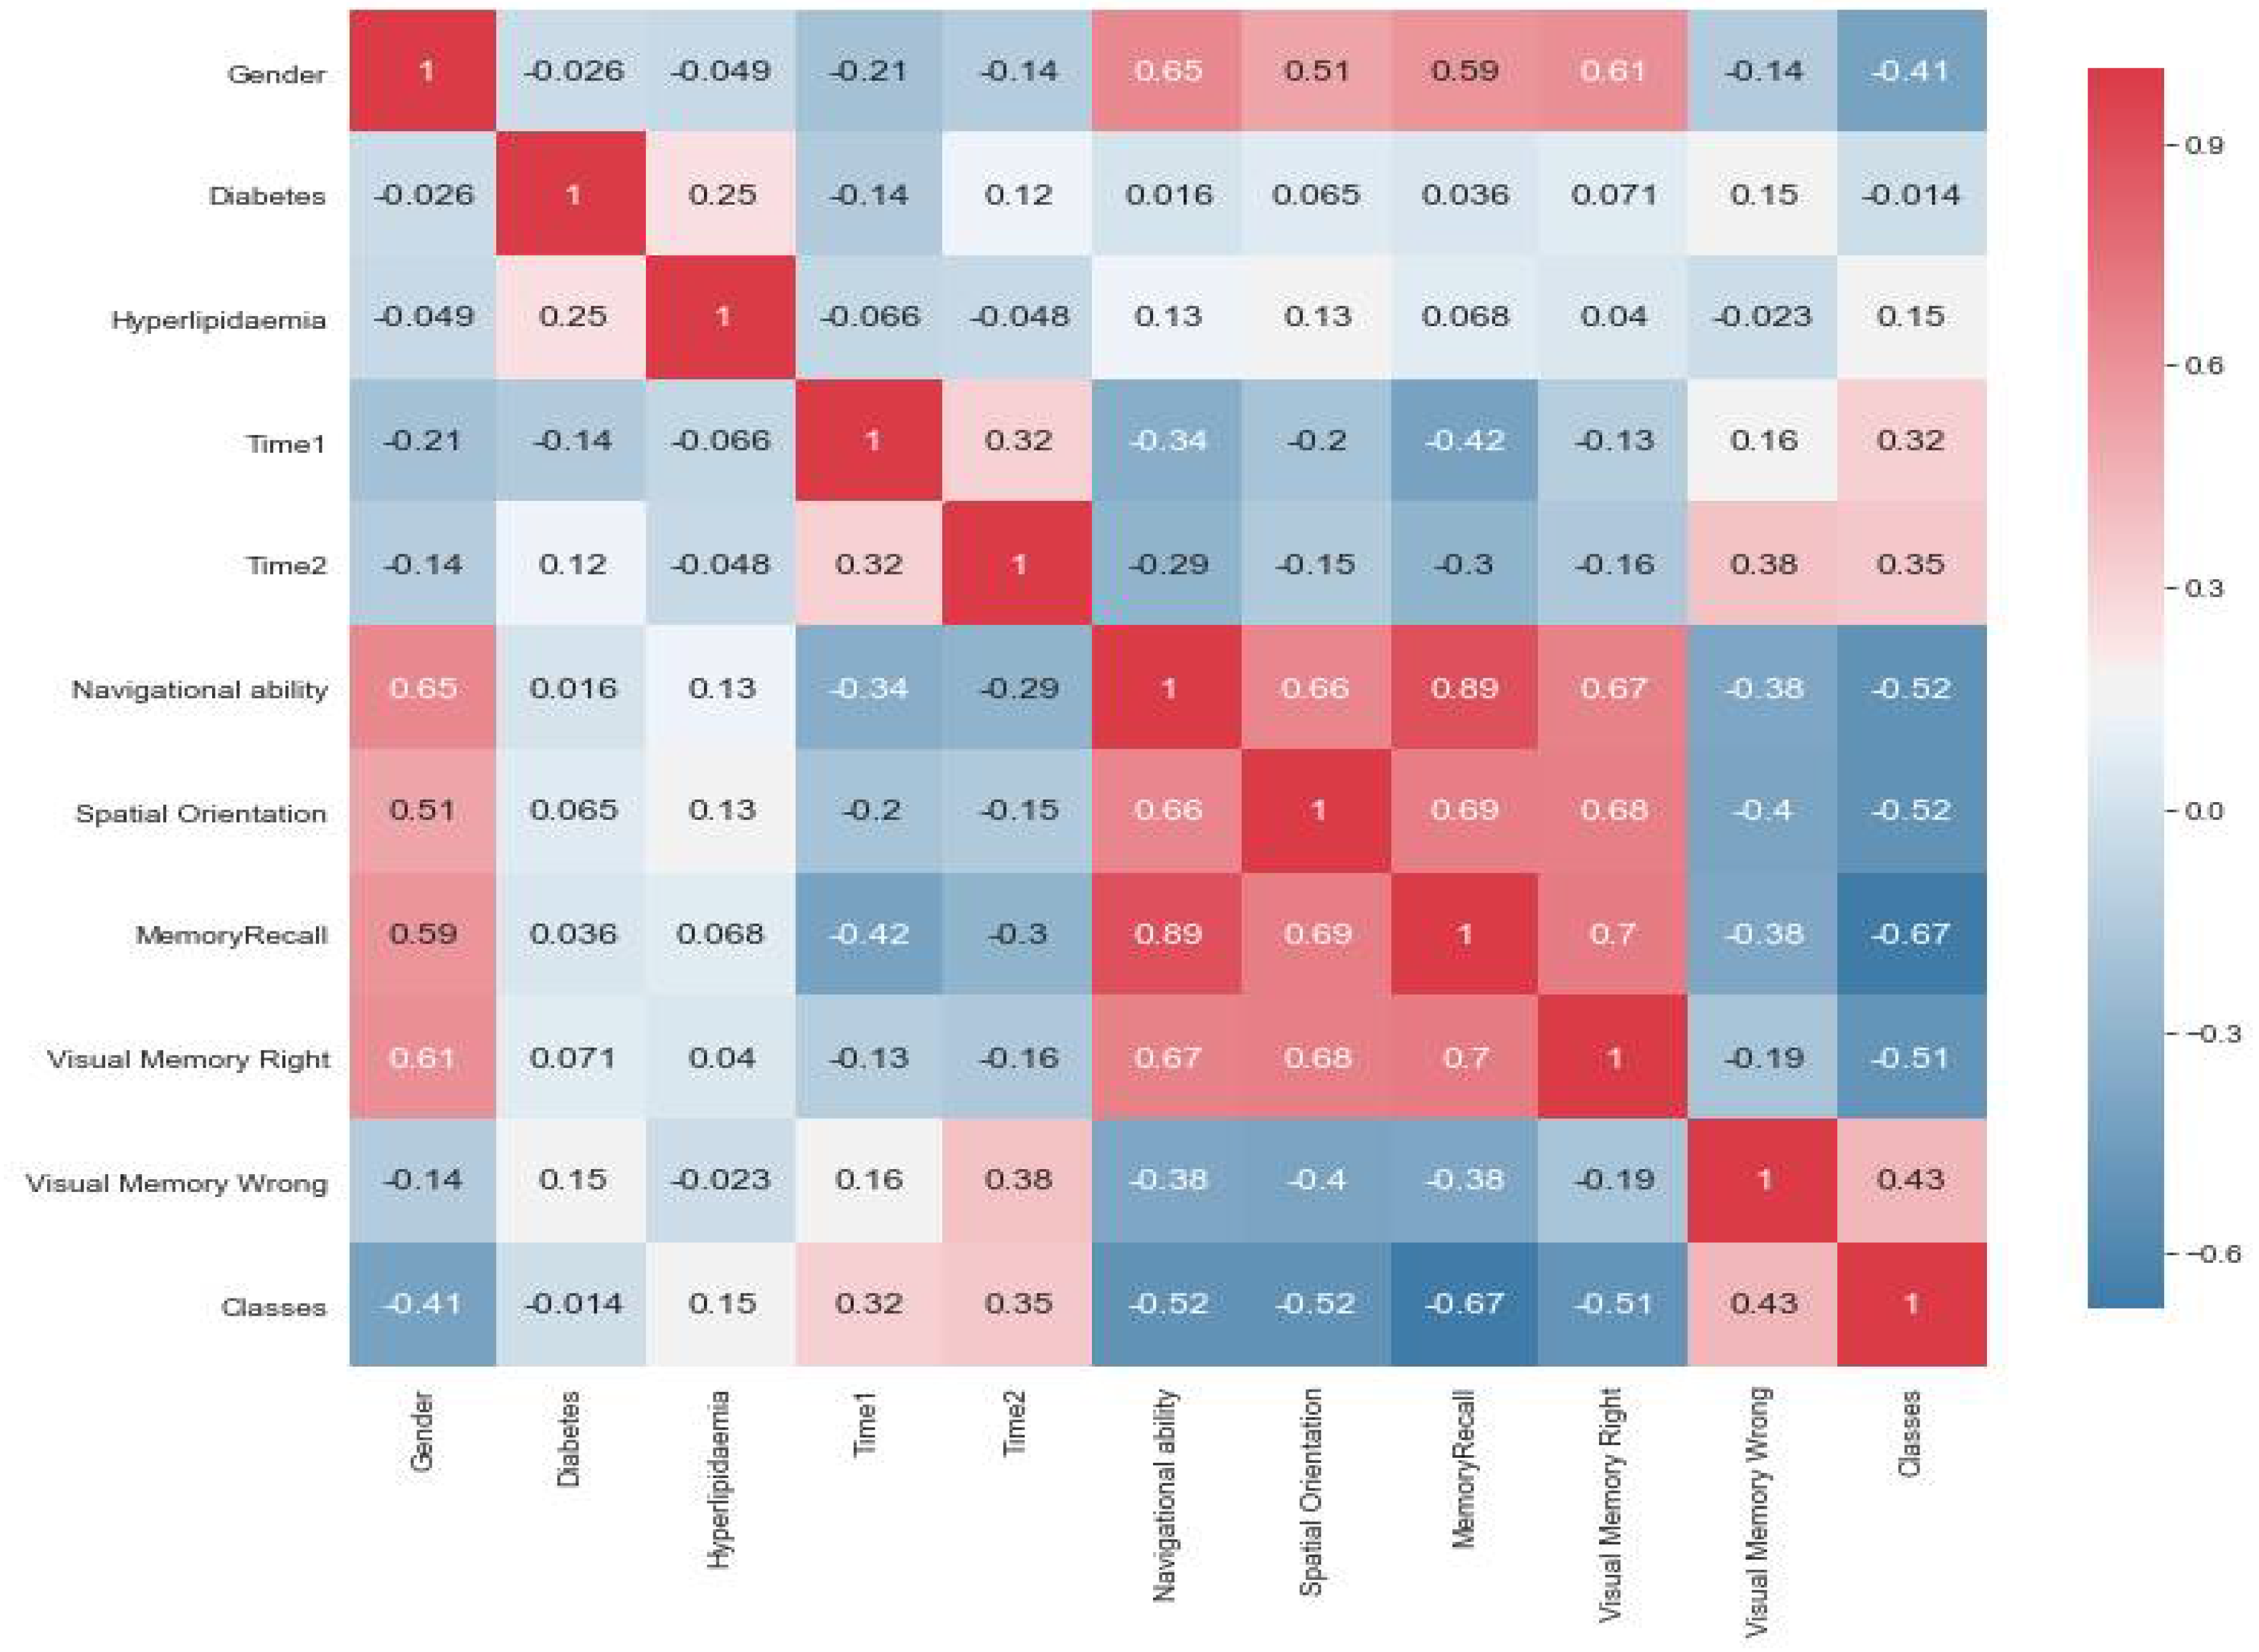
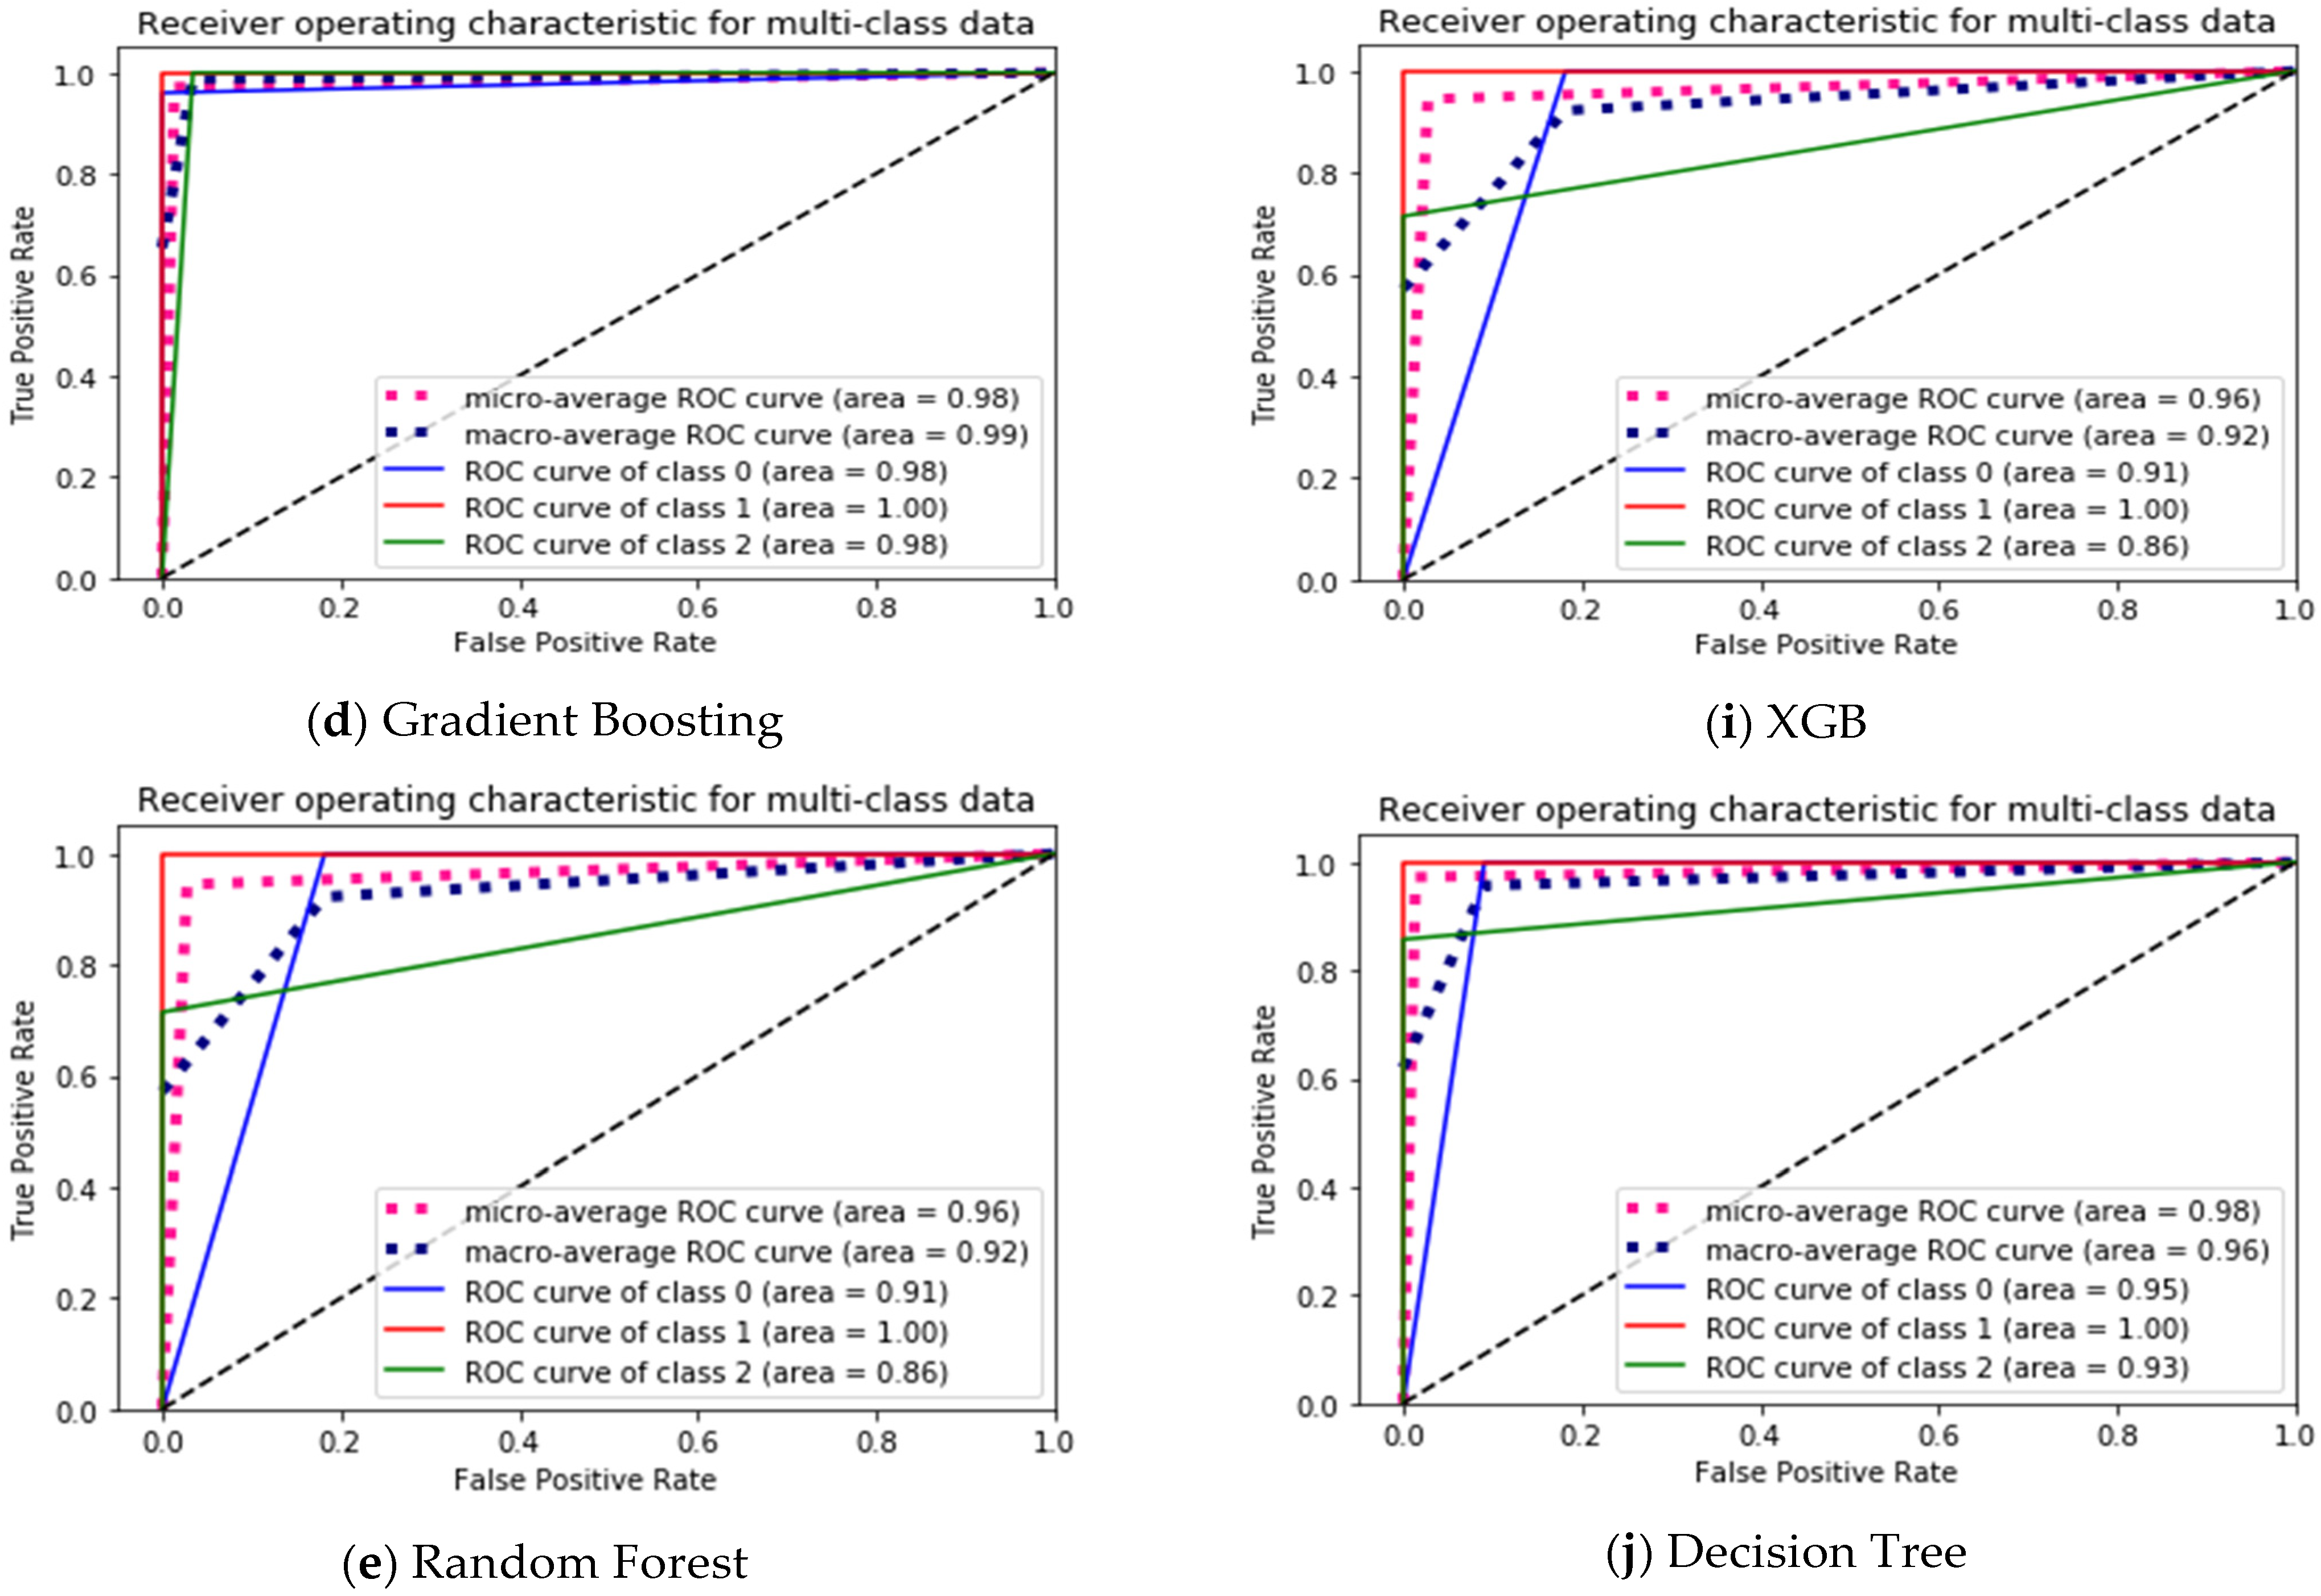
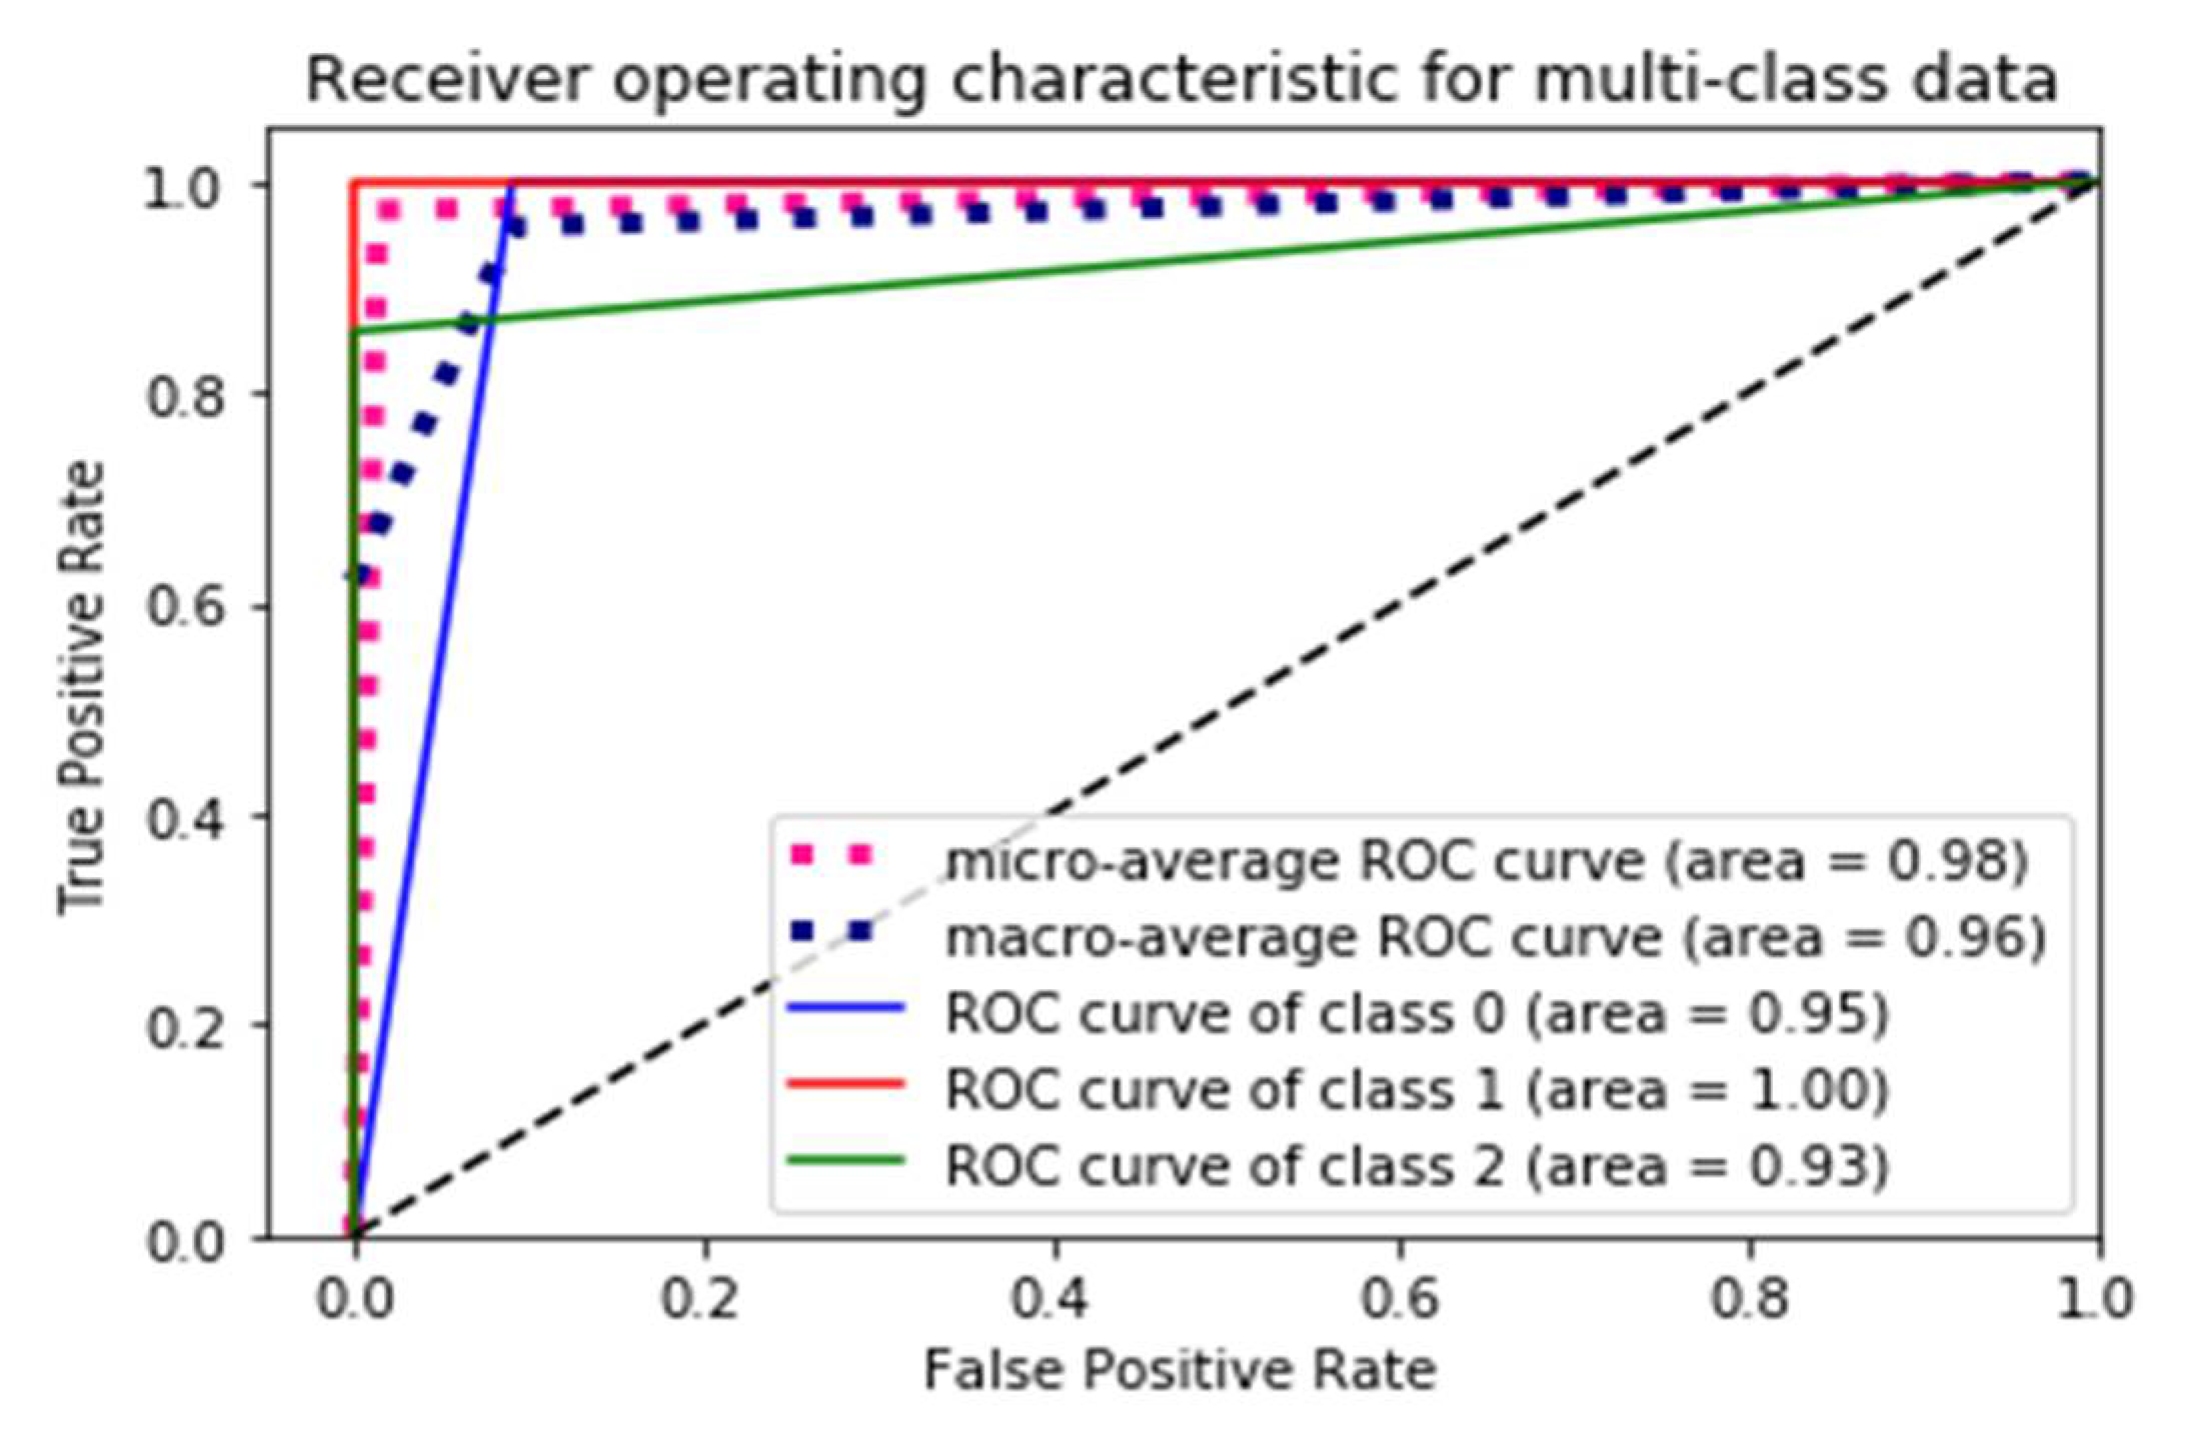
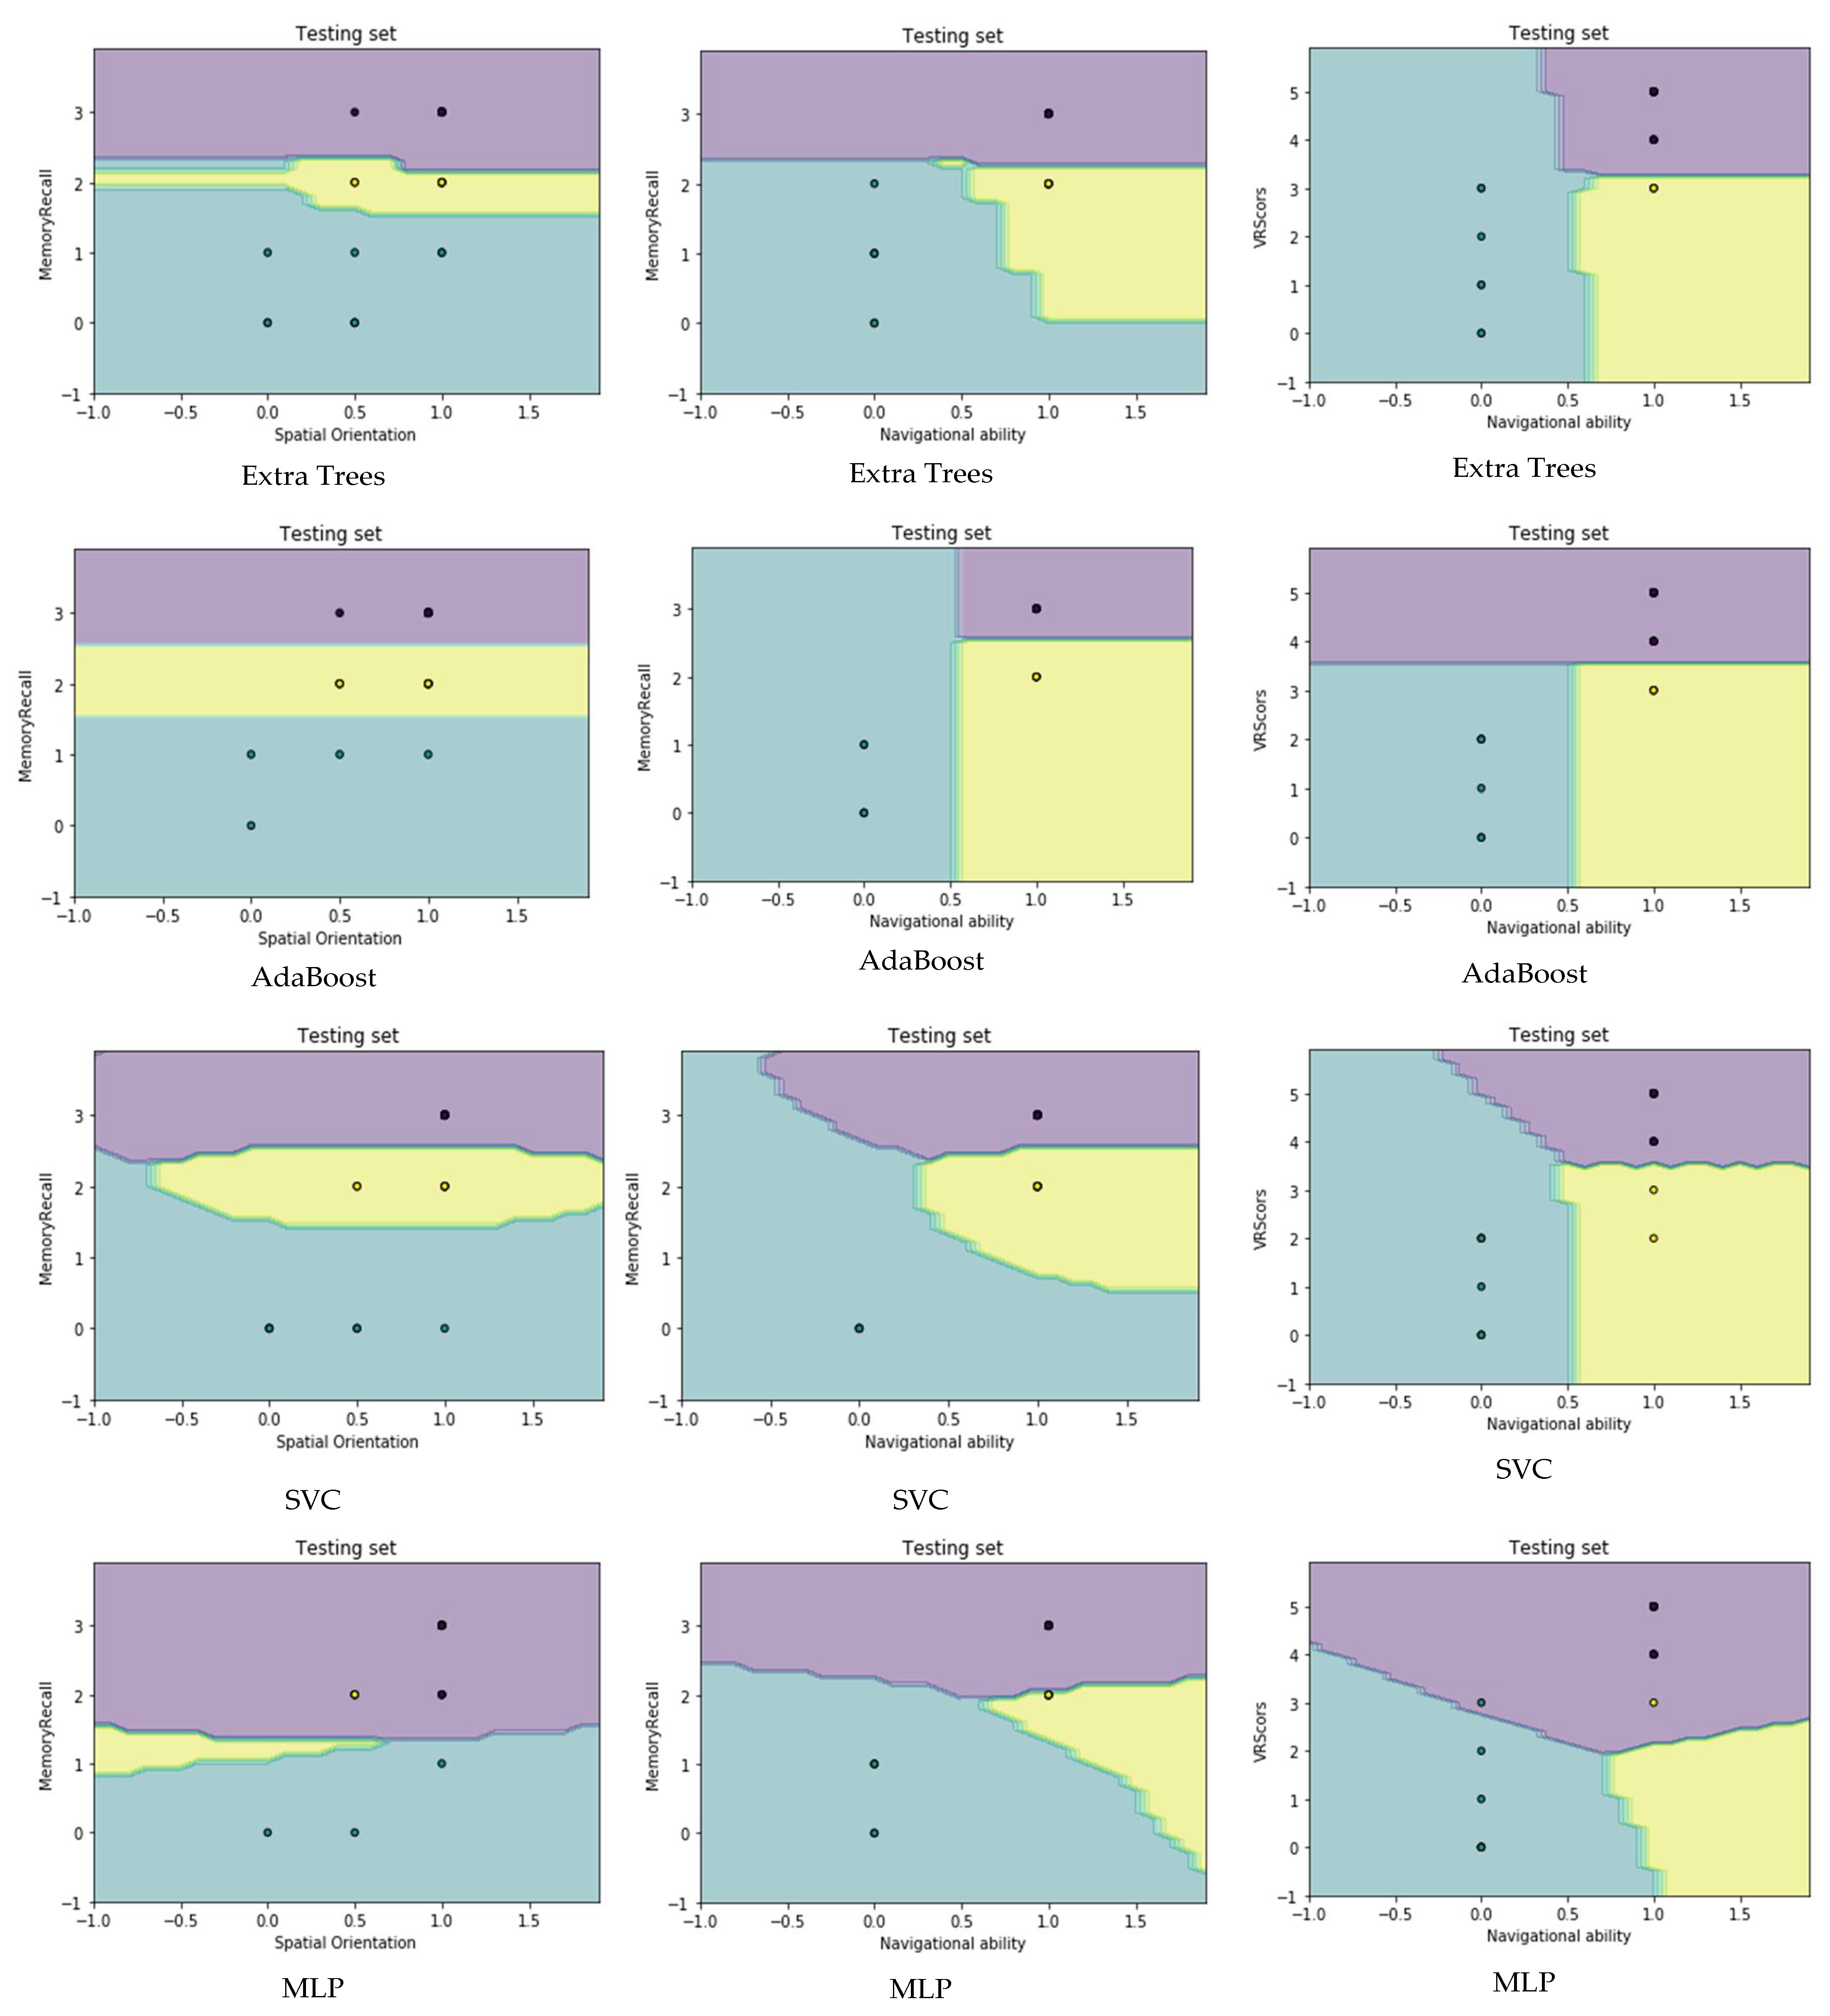
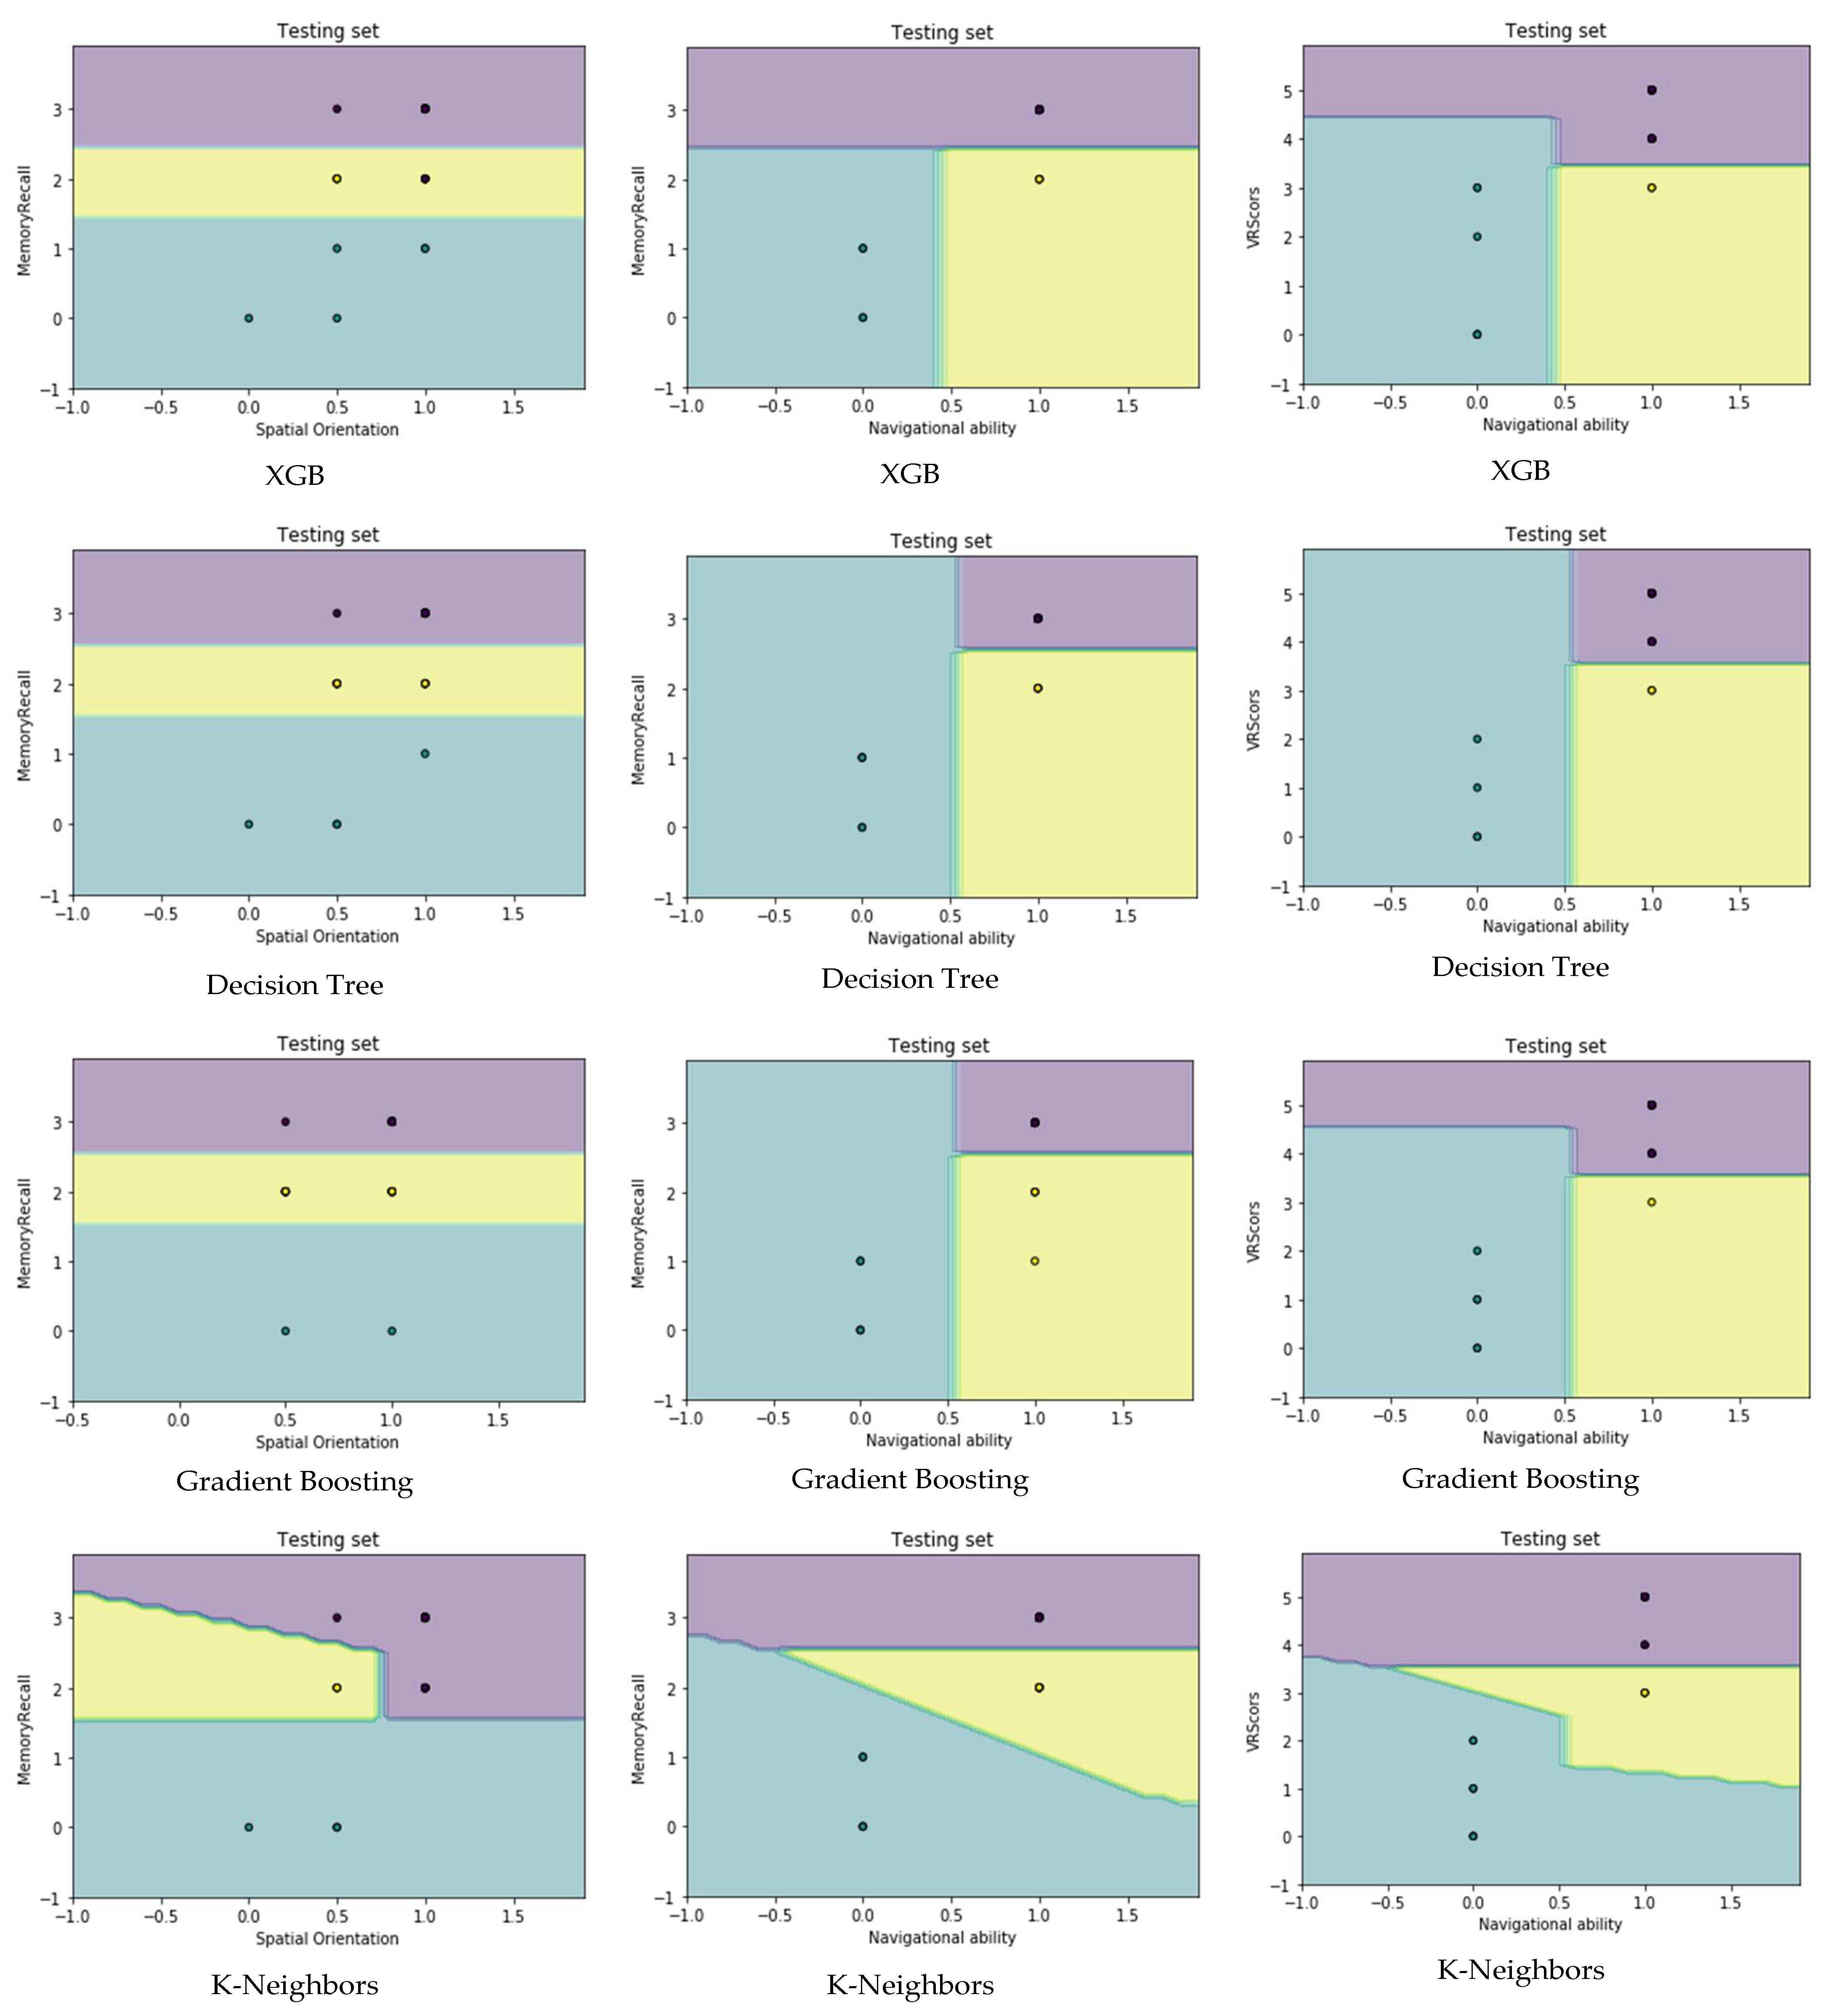
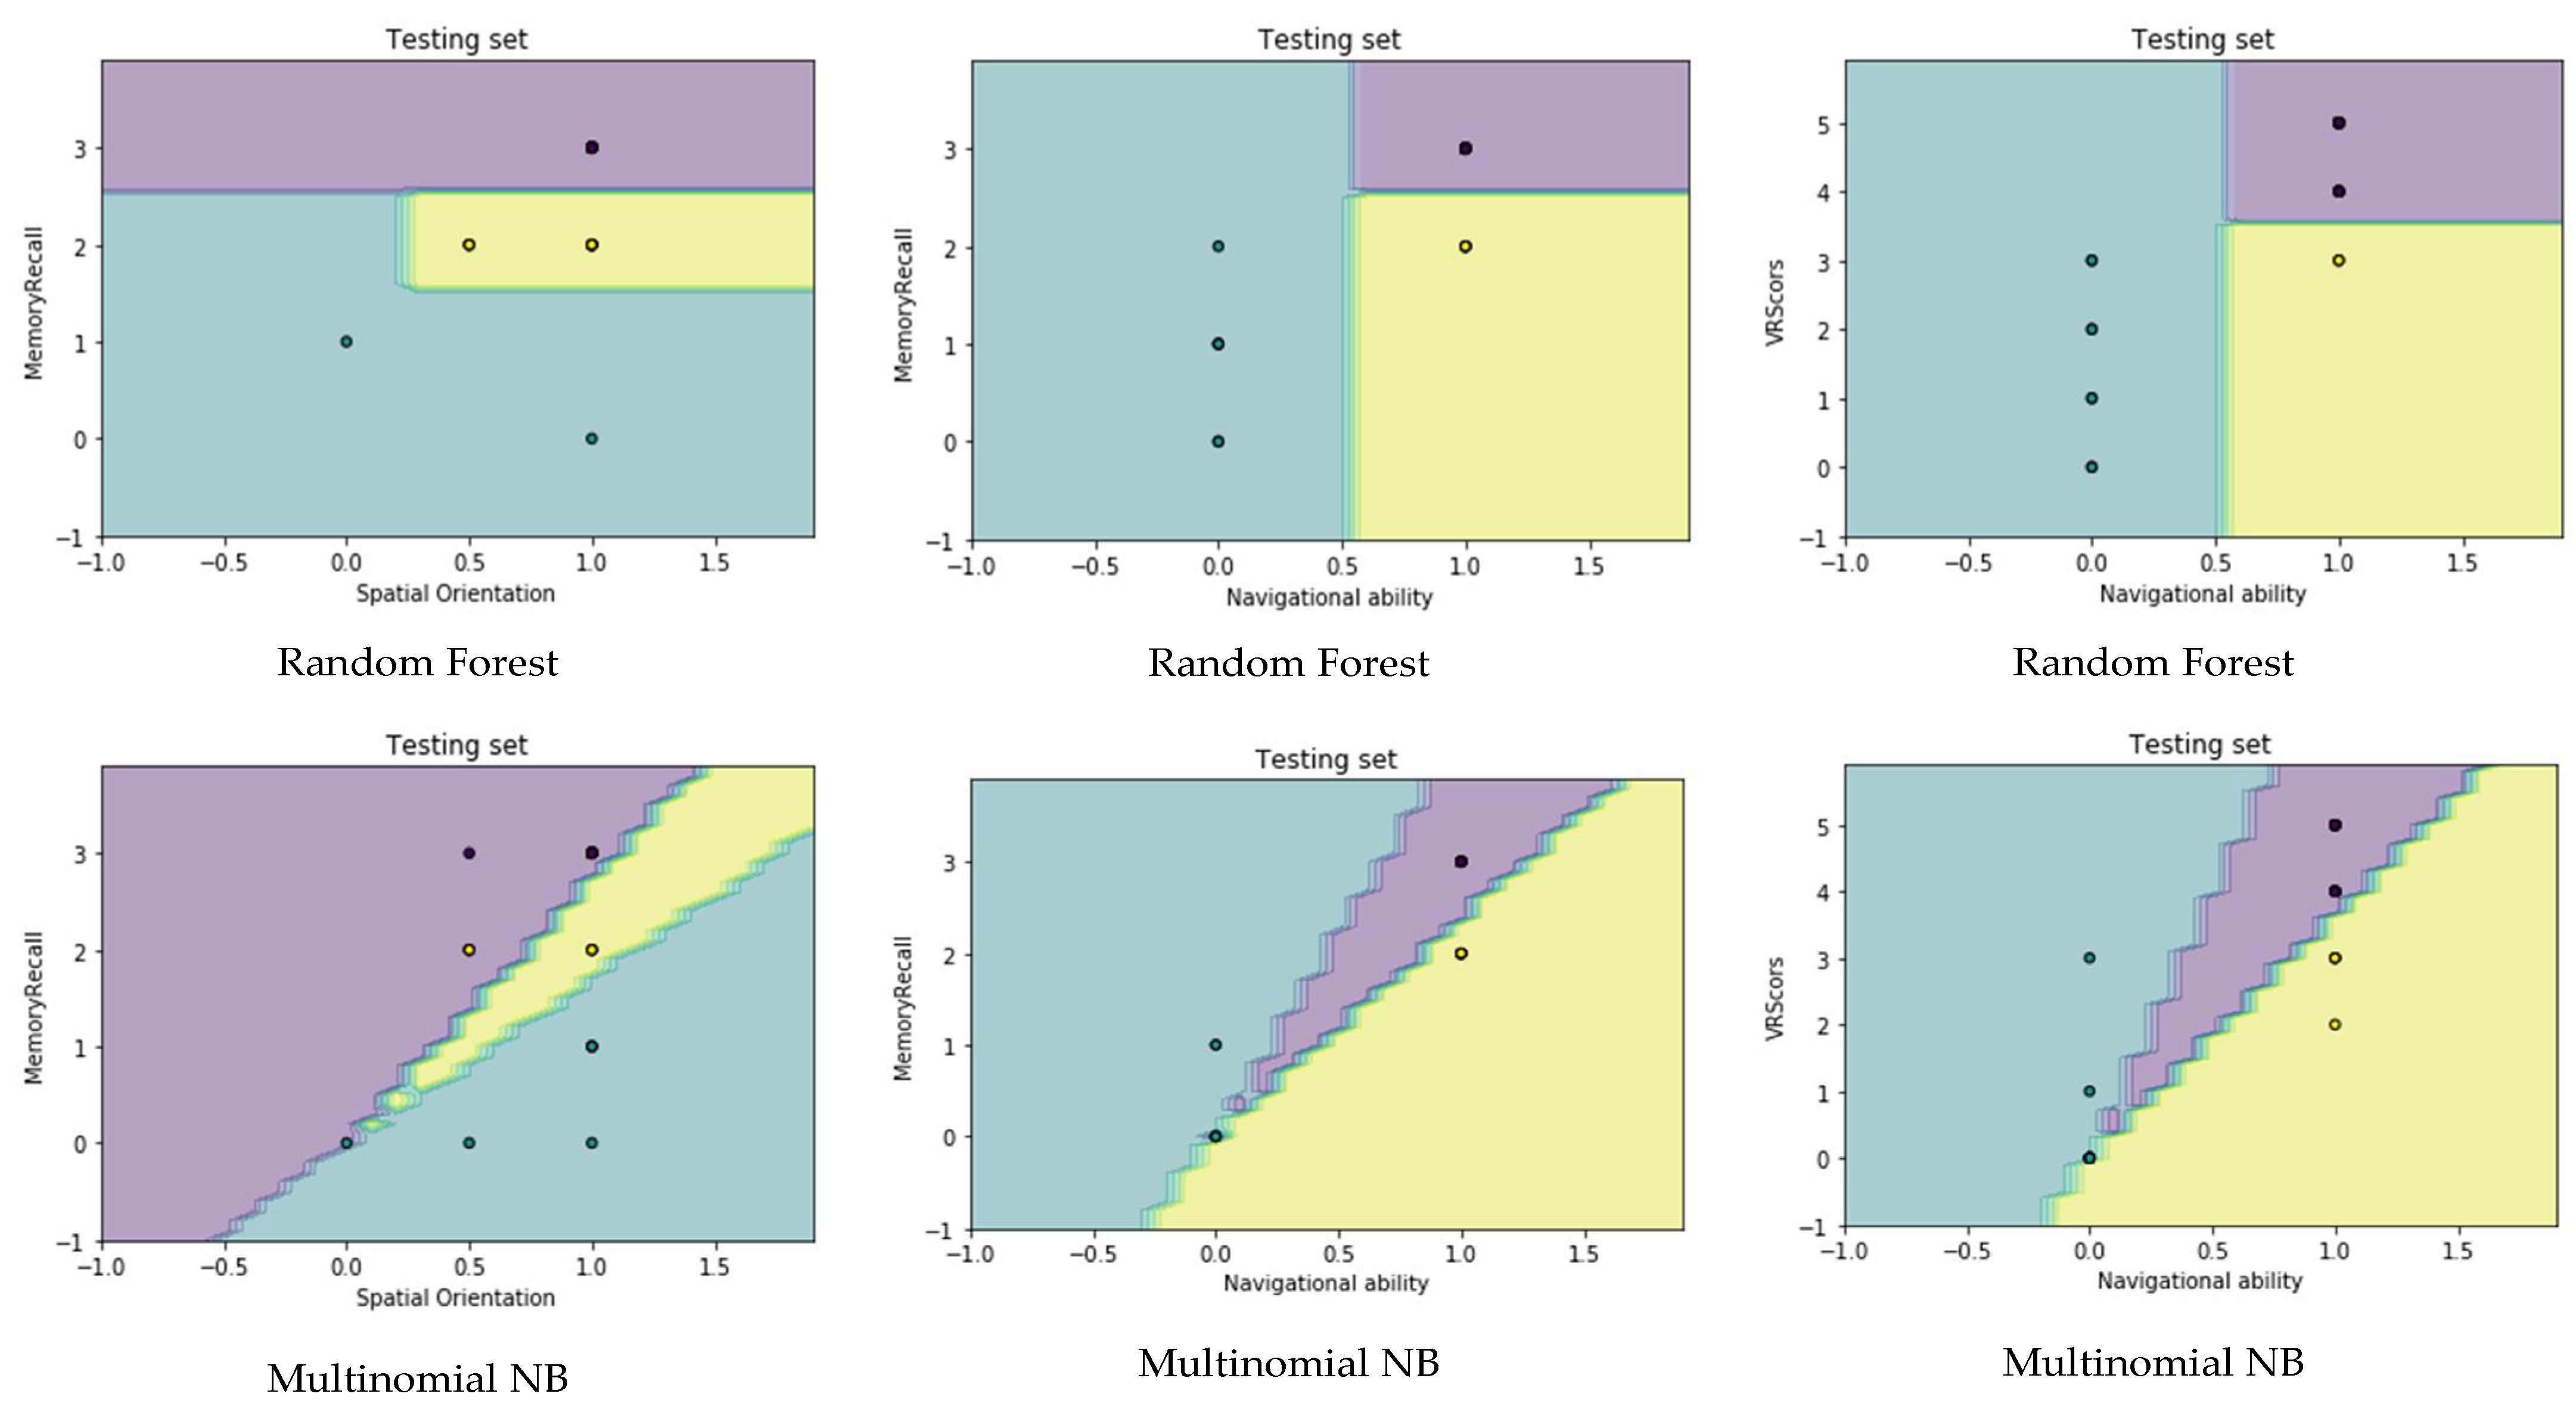
4.4. Visualization Data

Visualization of the decision boundary [51] in 2D feature space is a scatter plot where every dot describes a data-point in the dataset and each axis describes one feature. The decision boundary in 2D feature space has two attributes—one for the x-axis and the other for the y-axis—and splitting the points’ space into regions depends on classes. One of the strategies to draw classifier boundaries is the contour-based decision boundary. The significance of a decision boundary consists of visualizing the classification when drawing contours. This is preformed after training the model and then separating the data-points into regions that indicate the predicted classes.
Figure 10 reveals the decision boundaries of classifiers with spatial orientation on the x-axis and memory recall on the y-axis as 2D features, where all models show higher discrimination between the dementia class and other classes. Furthermore, some of the data-points that were considered for the MCI class were overlapped with those of other classes, such as MLP, Multinomial NB, and XGB. Figure 9 also shows the decision boundaries of classifiers with navigational ability on the x-axis and memory recall on the y-axis as 2D features, where all models except the MLP classifier show perfect discrimination in all classes, i.e., each data-point predicted is in the right region. Similarly, the latter figure reveals the decision boundaries of classifiers with navigational ability on the x-axis and VR scores on the y-axis as 2D features, where all models except the MLP classifier show perfect discrimination in all classes, i.e., each data-point predicted is in the correct region. The above results reveal that memory recall, navigational ability, and VR scores are very important features when there is reduction to two features.

5. Conclusions

Today, disease diagnosis is an important task. Computers play a vital role as a decision support system in disease diagnosis tests. This study designed a computer aided diagnosis (CAD) tool that combines a model for a cognitive test-based VR system, patient history storage and retrieval, and MLAs for classifying the patients’ condition. The proposed system was pilot tested. The system contains four basic tests with specific tasks for assessment in the human cognitive field. The system evaluates two human cognitive domains: memory and visuospatial function. Machine learning algorithms were used to classify patients into three classes as discussed earlier. The system relies on ten algorithms, where a vote is made between them to choose the most accurate classification using the Ensemble Vote approach. This project presented several challenges:
  • Transferring medically assessed tasks using paper and pencil to tasks that are electronically performed in a 3D virtual reality environment.
  • Creating computer aided diagnosis (CAD) tools that are useful and easy to use for people who have a reduced cognitive ability and have limited use of technology;
  • Dealing with elderly patients, especially when conducting tests;
  • Execution of VR experiment in different hospitals and associations; and
  • Analyzing real data from different hospitals and associations using the VR system.
The Medical Visuospatial Dementia Test (MVD Test) offers many advantages compared to other more traditional cognitive assessment tests: it is friendly to use and more ecologically valid, and requires less cost, time, and resource consumption. In addition, to provide consistency in assessment, it tests more than one cognitive area. This method is unique because the classification of patients relies on MLA. More research and development combining VR and machine learning is recommended.
The findings of the current study revealed that all machine learning algorithms achieved high levels of prediction, specificity, precision, and sensitivity. In addition, the findings showed a low percentage in a few of the models in the MCI class; this was because the sample size of the MCI class was very small compared to that of other groups.
In conclusion, all evaluation metrics used to determine the performance of the machine learning models revealed that there was a high level of accuracy in the classification of patients. Furthermore, the highest assessed performance, which was 97.22% accuracy from the SVC, MLP, AdaBoost, Extra Trees, Gradient Boosting, and Decision Tree models, showed that there was no distinction between them. Accordingly, after majority voting, the highest performance was derived from Ensemble Vote, and was equal to 97.22%, which confirmed the reliability of the system test. Moreover, the ROC curve of the dementia patients’ class had a greater discriminate capacity than that of the other classes, and there was no overlap between them.
In future works, the system can be used to conduct a range of experiments on a wider platform, involving specific sub-classes of dementia, such as Parkinson’s disease and Lewy Body disease, using an even greater diversity of data. One challenge that can be perceived as a result of such a wide and large-scale application is that more doctors, hospitals, and associations will need to be involved in order to provide clinical diagnoses for all participants enrolled in the study.

6. Patents

“Visuospatial Disorders Detection in Dementia using a Computer-Generated Environment based on Voting approach of Machine Learning Algorithms” from utility patent application transmittal under 15640027A, in the United States patent and trademark office application no. 17/088, 891, 2021.

Author Contributions

Data curation: A.Y.B.; formal analysis: A.Y.B.; investigation: A.Y.B.; methodology: A.Y.B.; resources: A.Y.B.; software: A.Y.B.; supervision: W.A. and S.H.A.; writing—original draft: A.Y.B.; writing—review and editing: A.Y.B. All authors have read and agreed to the published version of the manuscript.

Funding

King Abdulaziz University: KEP-Msc-7-611-38.

Institutional Review Board Statement

The study was conducted according to the guidelines of the Declaration of Helsinki, and the protocol was approved by the Institutional Review Board, Unit of Biomedical Ethics Research Committee of KAU, Jeddah, Saudi Arabia (reference No. 535-18) Cohort, 18 October 2018. This study was approved by KAU, DSFH and IMC to detect cognitive impairment in patients with dementia.

Informed Consent Statement

Informed consent was obtained from all subjects involved in the study.

Data Availability Statement

The data presented in this study are available on request from the corresponding author. The data are not publicly available due to privacy.

Acknowledgments

This work was supported by postgraduate studies and academic research, Deanship of Scientific Research, KAU [grant numbers (KEP-Msc-7-611-38)]. The authors, therefore, acknowledge with thanks Dr. Soliman Fakeeh Hospital (DSFH) and International Medical Centre (IMC), The authors of this article would like to thank Abdulrahman Ali and Eng. Mazen Al quality for their valuable suggestions and helpful comments.

Conflicts of Interest

The authors declare no conflict of interest.

References

  1. García-Betances, R.I.; Jiménez-Mixco, V.; Arredondo, M.T.; Cabrera-Umpiérrez, M.F. Using virtual reality for cognitive training of the elderly. Am. J. Alzheimer’s Dis. Other Dement. 2015, 30, 49–54. [Google Scholar] [CrossRef] [PubMed]
  2. Alzheimer’s, A. 2015 Alzheimer’s disease facts and figures. Alzheimer’s Dement. J. Alzheimer’s Assoc. 2015, 11, 332. [Google Scholar] [CrossRef] [PubMed]
  3. Rowe, P. Kaplan & Sadock′s Concise Textbook of Clinical Psychiatry. J. Ment. Health 2009, 18, 360–361. [Google Scholar] [CrossRef]
  4. Salimi, S.; Irish, M.; Foxe, D.; Hodges, J.R.; Piguet, O.; Burrell, J.R. Can visuospatial measures improve the diagnosis of Alzheimer’s disease? Alzheimer’s Dement. Diagn. Assess. Dis. Monit. 2017, 10, 66–74. [Google Scholar] [CrossRef] [PubMed]
  5. Montenegro, J.M.F.; Argyriou, V. Cognitive evaluation for the diagnosis of Alzheimer’s disease based on Turing Test and Virtual Environments. Physiol. Behav. 2017, 173, 42–51. [Google Scholar] [CrossRef] [Green Version]
  6. Geldmacher, D.S.; Whitehouse, P.J. Evaluation of dementia. N. Engl. J. Med. 1996, 335, 330–336. [Google Scholar] [CrossRef]
  7. Weakley, A.; Williams, J.A.; Schmitter-Edgecombe, M.; Cook, D.J. Neuropsychological test selection for cognitive impairment classification: A machine learning approach. J. Clin. Exp. Neuropsychol. 2015, 37, 899–916. [Google Scholar] [CrossRef] [Green Version]
  8. Silverberg, N.B.; Ryan, L.M.; Carrillo, M.C.; Sperling, R.; Petersen, R.C.; Posner, H.B.; Snyder, P.J.; Hilsabeck, R.; Gallagher, M.; Raber, J.; et al. Assessment of cognition in early dementia. Alzheimer’s Dement. 2011, 7, e60–e76. [Google Scholar] [CrossRef] [Green Version]
  9. Taekman, J.M.; Shelley, K. Virtual environments in healthcare: Immersion, disruption, and flow. Int. Anesthesiol. Clin. 2010, 48, 101–121. [Google Scholar] [CrossRef] [Green Version]
  10. García-Betances, R.; Arredondo Waldmeyer, M.; Fico, G.; Cabrera-Umpiérrez, M. A succinct overview of virtual reality technology use in Alzheimer’s disease. ICT Assess. Rehabil. Alzheimer’s Dis. Relat. Disord. 2015, 7, 80. [Google Scholar]
  11. Mihelj, M.; Novak, D.; Beguš, S. Virtual Reality Technology and Applications. 2014. Available online: https://www.researchgate.net/publication/293273379_Virtual_Reality_Technology_and_Applications (accessed on 14 February 2022).
  12. Cushman, L.A.; Stein, K.; Duffy, C.J. Detecting navigational deficits in cognitive aging and Alzheimer disease using virtual reality. Neurology 2008, 71, 888–895. [Google Scholar] [CrossRef] [PubMed] [Green Version]
  13. Zakzanis, K.K.; Quintin, G.; Graham, S.J.; Mraz, R. Age and dementia related differences in spatial navigation within an immersive virtual environment. Med. Sci. Monit. 2009, 15, CR140–CR150. [Google Scholar] [PubMed]
  14. Plancher, G.; Tirard, A.; Gyselinck, V.; Nicolas, S.; Piolino, P. Using virtual reality to characterize episodic memory profiles in amnestic mild cognitive impairment and Alzheimer’s disease: Influence of active and passive encoding. Neuropsychologia 2012, 50, 592–602. [Google Scholar] [CrossRef] [PubMed]
  15. Shamsuddin, S.N.W.; Ugail, H.; Lesk, V.; Walters, E. VREAD: A virtual simulation to investigate cognitive function in the elderly. In Proceedings of the 2012 International Conference on Cyberworlds, Darmstadt, Germany, 25 September 2012; pp. 215–220. [Google Scholar]
  16. Bayahya, A.Y.; AlHalabi, W.; Al-Amri, S.H.; Albeshri, A.A.; El-Missiry, A.A. Computer Generated Environment Utilizing Machine Learning Algorithms to Evaluate Dementia Patients. Procedia Comput. Sci. 2019, 163, 275–282. [Google Scholar] [CrossRef]
  17. Kononenko, I. Machine learning for medical diagnosis: History, state of the art and perspective. Artif. Intell. Med. 2001, 23, 89–109. [Google Scholar] [CrossRef] [Green Version]
  18. Fatima, M.; Pasha, M. Survey of machine learning algorithms for disease diagnostic. J. Intell. Learn. Syst. Appl. 2017, 9, 1. [Google Scholar] [CrossRef] [Green Version]
  19. Abdullah, M.; Bayahya, A.Y.; Shammakh, E.S.B.; Altuwairqi, K.A.; Alsaadi, A.A. A novel adaptive e-learning model matching educator-student learning styles based on machine learning. In Communication, Management and Information Technology; CRC Press: Boca Raton, FL, USA, 2017. [Google Scholar]
  20. Yeh, S.-C.; Huang, M.-C.; Wang, P.-C.; Fang, T.-Y.; Su, M.-C.; Tsai, P.-Y.; Rizzo, A. Machine learning-based assessment tool for imbalance and vestibular dysfunction with virtual reality rehabilitation system. Comput. Methods Programs Biomed. 2014, 116, 311–318. [Google Scholar] [CrossRef]
  21. Tu, S.; Wong, S.; Hodges, J.R.; Irish, M.; Piguet, O.; Hornberger, M. Lost in spatial translation—A novel tool to objectively assess spatial disorientation in Alzheimer’s disease and frontotemporal dementia. Cortex 2015, 67, 83–94. [Google Scholar] [CrossRef] [Green Version]
  22. Lesk, V.E.; Shamsuddin, S.N.W.; Walters, E.R.; Ugail, H. Using a virtual environment to assess cognition in the elderly. Virtual Real. 2014, 18, 271–279. [Google Scholar] [CrossRef] [Green Version]
  23. Pengas, G.; Patterson, K.; Arnold, R.J.; Bird, C.M.; Burgess, N.; Nestor, P.J. Lost and found: Bespoke memory testing for Alzheimer’s disease and semantic dementia. J. Alzheimer’s Dis. 2010, 21, 1347–1365. [Google Scholar] [CrossRef] [Green Version]
  24. Tarnanas, I.; Schlee, W.; Tsolaki, M.; Müri, R.; Mosimann, U.; Nef, T. Ecological validity of virtual reality daily living activities screening for early dementia: Longitudinal study. JMIR Serious Games 2013, 1, e1. [Google Scholar] [CrossRef] [PubMed] [Green Version]
  25. Allain, P.; Foloppe, D.A.; Besnard, J.; Yamaguchi, T.; Etcharry-Bouyx, F.; Le Gall, D.; Nolin, P.; Richard, P. Detecting everyday action deficits in Alzheimer’s disease using a nonimmersive virtual reality kitchen. J. Int. Neuropsychol. Soc. 2014, 20, 468–477. [Google Scholar] [CrossRef] [PubMed] [Green Version]
  26. Zucchella, C.; Sinforiani, E.; Tassorelli, C.; Cavallini, E.; Tost-Pardell, D.; Grau, S.; Pazzi, S.; Puricelli, S.; Bernini, S.; Bottiroli, S. Serious games for screening pre-dementia conditions: From virtuality to reality? A pilot project. Funct. Neurol. 2014, 29, 153. [Google Scholar] [PubMed]
  27. Lezak, M.; Howieson, D.; Loring, D. Neuropsychological Assessment, 5th ed.; Oxford University Press: Oxford, UK, 2012. [Google Scholar]
  28. Sathya, R.; Abraham, A. Comparison of supervised and unsupervised learning algorithms for pattern classification. Int. J. Adv. Res. Artif. Intell. 2013, 2, 34–38. [Google Scholar] [CrossRef] [Green Version]
  29. Kaur, G.; Chhabra, A. Improved J48 Classification Algorithm for the Prediction of Diabetes. Int. J. Comput. Appl. 2014, 98, 13–17. [Google Scholar] [CrossRef]
  30. Geurts, P.; Ernst, D.; Wehenkel, L. Extremely randomized trees. Mach. Learn. 2006, 63, 3–42. [Google Scholar] [CrossRef] [Green Version]
  31. Freund, Y.; Schapire, R.E. A decision-theoretic generalization of on-line learning and an application to boosting. J. Comput. Syst. Sci. 1997, 55, 119–139. [Google Scholar] [CrossRef] [Green Version]
  32. Chen, T.; Guestrin, C. Xgboost: A scalable tree boosting system. In Proceedings of the 22nd Acm Sigkdd International Conference on Knowledge Discovery and Data Mining, San Francisco, CA, USA, 13 August 2016; pp. 785–794. [Google Scholar]
  33. Ridgeway, G. The state of boosting. Comput. Sci. Stat. 1999, 172–181. [Google Scholar]
  34. Satyanarayana, N.; Ramalingaswamy, C.; Ramadevi, Y. Survey of Classification Techniques in Data Mining. In Proceedings of the International Multiconference of Engineers and Computer Scientists, Hong Kong, China, 18 March 2009. [Google Scholar]
  35. Pumpuang, P.; Srivihok, A.; Praneetpolgrang, P. Comparisons of classifier algorithms: Bayesian network, C4.5, decision forest and NBTree for Course Registration Planning model of undergraduate students. In Proceedings of the 2008 IEEE International Conference on Systems, Man and Cybernetics, Singapore, 12–15 October 2008; pp. 3647–3651. [Google Scholar]
  36. McCallum, A.; Nigam, K. A comparison of event models for naive bayes text classification. In Proceedings of the AAAI-98 Workshop on Learning for Text Categorization, Pittsburgh, PA, USA, 26 July 1998; pp. 41–48. [Google Scholar]
  37. Nurnberger, A.; Borgelt, C.; Klose, A. Improving naive Bayes classifiers using neuro-fuzzy learning. In Proceedings of the ANZIIS’99 & ANNES’99 & ACNN’99. 6th International Conference on Neural Information Processing, Perth, WA, Australia, 16 November 1999. [Google Scholar]
  38. Grother, P.J.; Candela, G.T.; Blue, J.L. Fast implementations of nearest neighbor classifiers. Pattern Recognit. 1997, 30, 459–465. [Google Scholar] [CrossRef]
  39. Windeatt, T. Ensemble MLP classifier design. In Computational Intelligence Paradigms; Springer: Berlin/Heidelberg, Germany, 2008; pp. 133–147. [Google Scholar]
  40. Pedregosa, F.; Varoquaux, G.; Gramfort, A.; Michel, V.; Thirion, B.; Grisel, O.; Blondel, M.; Prettenhofer, P.; Weiss, R.; Dubourg, V.; et al. Scikit-learn: Machine Learning in {P}ython. J. Mach. Learn. Res. 2011, 12, 2825–2830. [Google Scholar]
  41. Korting, T.S. C4. 5 Algorithm and Multivariate Decision Trees; Image Processing Division, National Institute for Space Research–INPE: Sao Jose dos Campos, SP, Brazil, 2006. [Google Scholar]
  42. Van Essen, B.; Macaraeg, C.; Gokhale, M.; Prenger, R. Accelerating a random forest classifier: Multi-core, GP-GPU, or FPGA? In Proceedings of the 2012 IEEE 20th International Symposium on Field-Programmable Custom Computing Machines, Toronto, ON, Canada, 29 April 2012; pp. 232–239. [Google Scholar]
  43. Pugazhenthi, D.; Rajagopalan, S. Machine learning technique approaches in drug discovery, design and development. Inf. Technol. J. 2007, 6, 718–724. [Google Scholar] [CrossRef] [Green Version]
  44. Manliguez, C. Generalized Confusion Matrix for Multiple Classes. 2016. Available online: https://www.researchgate.net/publication/310799885_Generalized_Confusion_Matrix_for_Multiple_Classes (accessed on 14 February 2022).
  45. Altman, D.G.; Bland, J.M. Diagnostic tests. 1: Sensitivity and specificity. BMJ Br. Med. J. 1994, 308, 1552. [Google Scholar] [CrossRef] [PubMed] [Green Version]
  46. Vafeiadis, T.; Diamantaras, K.I.; Sarigiannidis, G.; Chatzisavvas, K.C. A comparison of machine learning techniques for customer churn prediction. Simul. Model. Pract. Theory 2015, 55, 1–9. [Google Scholar] [CrossRef]
  47. Hajian-Tilaki, K. Receiver Operating Characteristic (ROC) Curve Analysis for Medical Diagnostic Test Evaluation. Casp. J. Intern. Med. 2013, 4, 627–635. [Google Scholar]
  48. James, G. Majority Vote Classifiers: Theory and Applications; Stanford University: Stanford, CA, USA, 1998. [Google Scholar]
  49. Smolyakov, V. Ensemble Learning to Improve Machine Learning Results. 2017. Available online: https://dzone.com/articles/ensemble-learning-to-improve-machine-learning-resu (accessed on 14 February 2022).
  50. Bayahya, A.Y.; Alhalabi, W.; AlAmri, S.H. Smart Health System to Detect Dementia Disorders Using Virtual Reality. Healthcare 2021, 9, 810. [Google Scholar] [CrossRef]
  51. Migut, M.; Worring, M.; Veenman, C. Visualizing multi-dimensional decision boundaries in 2D. Data Min. Knowl. Discov. 2013, 29, 273–295. [Google Scholar] [CrossRef] [Green Version]
Figure 1. Architecture model for classifying dementia patients.
Mathematics 10 01953 g001
Figure 2. VR system to diagnose dementia patients: (a) patients’ roams around the VR; (b) memory and delay recall task; (c) visual memory task.
Mathematics 10 01953 g002
Figure 3. Functionality of supervised classification.
Mathematics 10 01953 g003
Figure 4. Plot of the heatmap correlation between attribute features.
Mathematics 10 01953 g004
Figure 5. Confusion Matrix for multi-categorical classification models: (a) Extra Trees, (b) AdaBoost, (c) MLP=Multilayer Perceptron, (d) XGB = X-Gradient Boosting, (e) DT = Decision Tree; (f) GB = Gradient Boosting, (g) SVC = Support Vector Classifier, (h) K-N = K-Neighbors, (i) RF = Random Forest, (j) MNB = Multinomial Naive Bayes. Note: Correct class with green box, wrong class with red box.
Mathematics 10 01953 g005
Figure 6. Learning curve based on different percentages of training data for all MLAs.
Mathematics 10 01953 g006aMathematics 10 01953 g006b
Figure 7. Receiver operating characteristic (ROC) curve analysis of different MLAs: (a) SVC, (b) Multinomial NB, (c) K-Neighbors, (d) Gradient Boosting, (e) Random Forest, (f) Extra Trees, (g) AdaBoost, (h) MLP, (i) XGB, (j) Decision Tree.
Mathematics 10 01953 g007aMathematics 10 01953 g007b
Figure 8. Model of Ensemble Vote as majority voting.
Mathematics 10 01953 g008
Figure 9. ROC curve analysis of Ensemble Vote.
Mathematics 10 01953 g009
Figure 10. Decision boundaries of a classifier given 2D features. Note: purple color noted to cognitively health class, yellow color noted to MCI class, green color noted to demented class.
Mathematics 10 01953 g010aMathematics 10 01953 g010bMathematics 10 01953 g010c
Table 1. Evaluation metrics to determine the performance of the machine learning models.
Machine Learning AlgorithmsAccuracy Actual Error Rate (AER)Cross Validation
Accuracy
Extra Trees97.22%0.1199.14%
AdaBoost97.22%0.1197.43%
MLP97.22%0.1196.58%
XGB94.44%0.2297.43%
Decision Tree97.22%0.1197.43%
Gradient Boosting97.22%0.1198.29%
SVC97.22%0.1198.29%
K-Neighbors94.44%0.2289.74%
Random Forest94.44%0.2299.14%
Multinomial NB91.66%0.3385.47%
MLP = Multilayer Perceptron, XGB = X-Gradient Boosting, SVC = Support Vector Classifier, MNB = Multinomial Naive Bayes.
Table 2. Accuracy of testing data based on the percentage of training data.
Machine Learning AlgorithmsPercentage of Testing Data Based on Different Size of Training Data
10%20%30%40%50%60%70%80%
Extra Trees83%84%85%88%93%93%97%86%
AdaBoost64%81%81%86%89%93%97%86%
MLP82%86%84%89%93%91%97%85%
XGB81%81%84%88%93%93%97%90%
Decision Tree49%79%83%88%90%93%97%85%
Gradient Boosting65%83%85%87%93%93%95%91%
SVC80%81%82%88%93%93%98%90%
K-Neighbors79%81%81%84%84%85%91%85%
Random Forest84%83%83%88%88%91%98%90%
Multinomial NB83%81%82%86%86%85%84%82%
Table 3. Validation metrics to determine the performance of the machine learning models.
MLAPrecisionSensitivitySpecificity
HDMHDMHDM
ET 1.000.801.000.961.001.001.000.971.00
AB 1.001.000.880.961.001.001.001.000.97
MLP 0.961.001.001.001.000.860.911.001.00
XGB 0.931.001.001.001.000.710.821.001.00
DT0.961.001.001.001.000.860.911.001.00
GB 1.001.000.880.961.001.001.001.000.97
SVC0.961.001.001.001.000.860.911.001.00
K-N 0.961.000.860.961.000.860.911.000.97
RF0.931.001.001.001.000.710.821.001.00
MNB0.921.000.830.961.000.710.821.000.97
H = Cognitively Healthy, D = Dementia, M = MCI; ET = Extra Trees, AB = AdaBoost, MLP = Multilayer Perceptron, XGB = X-Gradient Boosting, DT = Decision Tree; GB = Gradient Boosting, SVC = Support Vector Classifier, K-N = K-Neighbors, RF = Random Forest, MNB = Multinomial Naive Bayes.
Table 4. Micro-avg and macro-avg metrics to determine the performance of the machine learning models.
MLARecallPrecisionF1-Score
ClassesMiMoMiMoF1MiMo
ETH0.970.990.930.990.980.970.96
D0.89
MCI1.00
ABH0.970.950.970.990.980.970.97
D1.00
MCI0.92
MLPH0.970.950.970.990.980.970.97
D1.00
MCI0.92
XGBH0.940.900.940.980.960.940.93
D1.00
MCI0.83
DTH0.970.950.970.990.980.970.97
D1.00
MCI0.92
GBH0.970.950.970.990.980.970.97
D1.00
MCI0.92
SVCH0.970.950.970.990.980.970.97
D1.00
MCI0.92
K-NH0.940.940.940.940.960.940.94
D1.00
MCI0.86
RFH0.940.900.940.980.960.940.93
D1.00
MCI0.83
MNBH0.920.920.920.910.940.920.91
D1.00
MCI0.77
H = Cognitively Healthy, D = Dementia, M = MCI; Mi = Micro avg, Mo = Macro avg; ET = Extra Trees, AB = AdaBoost, DT = Decision Tree, GB = Gradient Boosting, K-N = K-Neighbors, RF = Random Forest, MNB = Multinomial NB.
Table 5. Accuracy of testing data based on the percentage of training data.
Voting Algorithm (Ensemble Vote)
MetricsCognitively HealthyDement.MCI
Precision0.961.001.00
Sensitivity1.001.000.86
Specificity0.911.001.00
F1-Score0.981.000.92
ROC Curve0.951.000.93
Micro-avg ROC curve0.98
Macro-avg ROC curve0.96
Accuracy97.22%
AER0.11
(ROC) Receiver operating characteristic, (MCI) Mild Cognitive Impairment.
Publisher’s Note: MDPI stays neutral with regard to jurisdictional claims in published maps and institutional affiliations.

