
A Two-Sample Test of High Dimensional Means Based on Posterior Bayes Factor

Abstract
:1. Introduction
2. Test Based on Posterior Bayes Factor
- When no knowledge about the prior is available, a non-informative prior is suggested. A usual one is Jeffrey’s prior. As a result, for the parameters , , and the common parameter under the null hypothesis, we choose Jeffrey’s prior, i.e., Lebesgue measure.
- For the covariance matrix , the posterior distribution with Jeffrey’s prior does not exist when , where . Therefore, we take the inverse Wishart distribution, which is a conjugate for a normal covariance matrix.
- This paper aims to investigate whether the test with the posterior Bayes factor statistic in high dimensional settings performs better than the existing methods. If the results turn out to be as expected, the posterior Bayes factor could be suggested to be the test statistic for high dimensional datasets. Hence, we will take simple priors. Furthermore, we take in the priors for the covariance matrices with small k so that the variation of the is large.
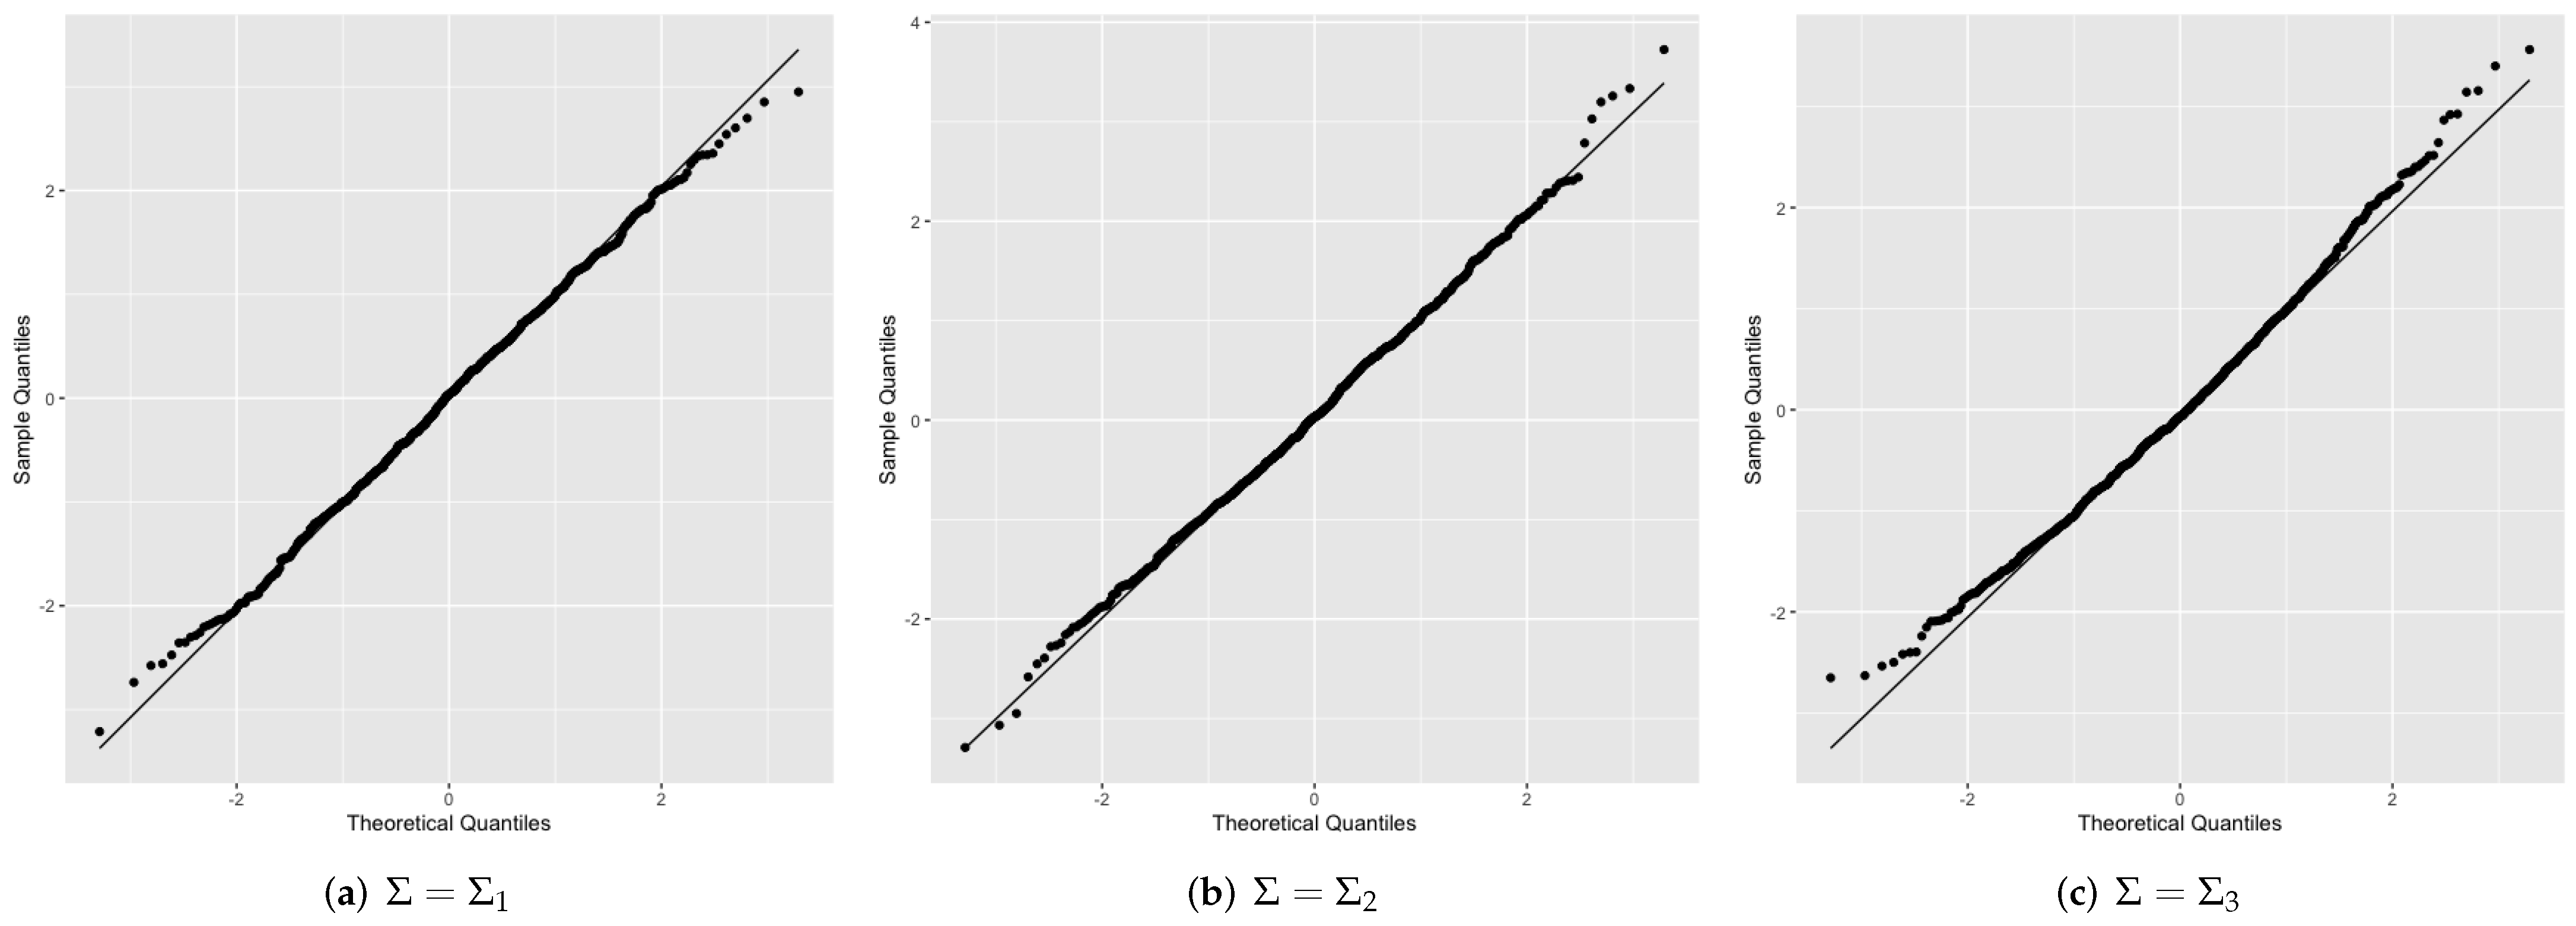
3. Simulation
- is the identity matrix.
- is a covariance matrix with .
- is block diagonal matrix, with block in which the diagonal entries are 1 and the off-diagonal entries are 0.15.
- Simulate , set randomly selected elements to 0, and scale so that .
- Simulate , set randomly selected elements to 0, and scale so that .
4. An Application Example
5. Conclusions
Author Contributions
Funding
Institutional Review Board Statement
Informed Consent Statement
Data Availability Statement
Acknowledgments
Conflicts of Interest
Appendix A. Proof
Appendix B. R code
| rm(list = ls(all = TRUE)) |
| library(MASS) |
| library(Matrix) |
| #install.packages("lava") |
| library(lava) |
| n1=70 |
| n2=70 |
| n=n1+n2 |
| p=1000 |
| M=1000 |
| m=2*p |
| mu1=rep(0,p) |
| #Sigma 1 |
| Sigma1=diag(1,p) |
| #Sigma 2 |
| #ro=0.4 |
| #Sigma2_0=matrix(1,p,p) |
| #for (i in 1:p) { |
| # for (j in 1:p) { |
| # k<-abs(j-i) |
| # Sigma2_0[i,j]=ro^{k} |
| # } |
| #} |
| #Sigma2<-Sigma2_0 |
| #Sigma 3 |
| #Sigma3_1=diag(0.85,25)+matrix(0.15,25,25) |
| #list2 <- NULL |
| #for (i in 1:(p/25)){ |
| # list2[[i]] <- Sigma3_1 |
| #} |
| #Sigma3<-as.matrix(bdiag(list2)) |
| Sigma=Sigma1 |
| delta=0.975 |
| t1=proc.time() |
| p0=delta*p |
| mu20=mvrnorm(1,rep(1,p),diag(rep(1, p))) |
| mu20_xiabiao=sort(sample(1:p,p0)) |
| for (i in 1:p0){mu20[mu20_xiabiao[i]]=0} |
| #alternative 1 |
| scal=sqrt((t(mu20)%*%solve(Sigma)%*%(mu20))/2) |
| #alternative 2 |
| #scal=sqrt(t(mu20)%*%(mu20)/sqrt(tr(t(Sigma)%*%Sigma))/0.1) |
| mu2=mu20/rep(scal,p) |
| c=0 |
| T_BF=rep(0,M) |
| for (q in 1:M) { |
| xi<-mvrnorm(n1,mu1,Sigma) |
| yi<-mvrnorm(n2,mu2,Sigma) |
| x_mean<-rep(0,p) |
| for(i in 1:p){ |
| x_mean[i]=mean(xi[,i]) |
| } |
| y_mean<-rep(0,p) |
| for(i in 1:p){ |
| y_mean[i]=mean(yi[,i]) |
| } |
| z1=matrix(0,n1,p) |
| for (l in 1:n1) { |
| z1[l,]=x_mean |
| } |
| z2=matrix(0,n2,p) |
| for (l in 1:n2) { |
| z2[l,]=y_mean |
| } |
| A<-t(xi-z1)%*%(xi-z1)+t(yi-z2)%*%(yi-z2) |
| k<-1/log10(n)/(eigen(A)$values[1])/(p) |
| V<-k*diag(rep(1, p)) |
| B=((m+2*(n))*solve(solve(V)+2*(A))-(m+n)/2*solve(solve(V)+A)) |
| T=n1*n2/(n)*(t(x_mean-y_mean)%*%B%*%(x_mean-y_mean)) |
| S_n<-A/(n-2) |
| mu_T=tr(B%*%S_n) |
| sigma_T<-tr((B%*%S_n)%*%(B%*%S_n))-1/(n-2)*(tr(B%*%S_n))^2 |
| T_BF[q]=(T-mu_T)/sqrt(2*sigma_T) |
| if(T_BF[q]>=qnorm(0.95)){c=c+1} |
| } |
| t2=proc.time() |
| t=t2-t1 |
| cat("power =", c/M,"time",t[3][[1]],"s","\n") |
References
- Bai, Z.; Saranadasa, H. Effect of high dimension: By an example of a two sample problem. Stat. Sin. 1996, 6, 311–329. [Google Scholar]
- Hotelling, H. The Generalization of Student’s Ratio. Ann. Math. Stat. 1931, 2, 360–378. [Google Scholar] [CrossRef]
- Anderson, T.W. An Introduction to Multivariate Statistical Analysis; Technical Report; John Wiley & Sons, Inc.: Hoboken, NJ, USA, 1958. [Google Scholar]
- Srivastava, M.S.; Du, M. A test for the mean vector with fewer observations than the dimension. J. Multivar. Anal. 2008, 99, 386–402. [Google Scholar] [CrossRef] [Green Version]
- Srivastava, M.S. A test for the mean vector with fewer observations than the dimension under non-normality. J. Multivar. Anal. 2009, 100, 518–532. [Google Scholar] [CrossRef] [Green Version]
- Srivastava, M.S.; Katayama, S.; Kano, Y. A two sample test in high dimensional data. J. Multivar. Anal. 2013, 114, 349–358. [Google Scholar] [CrossRef]
- Chen, S.X.; Qin, Y.L. A two-sample test for high-dimensional data with applications to gene-set testing. Ann. Stat. 2010, 38, 808–835. [Google Scholar] [CrossRef] [Green Version]
- Feng, L.; Zou, C.; Wang, Z.; Zhu, L. Two-sample Behrens-Fisher problem for high-dimensional data. Stat. Sin. 2015, 25, 1297–1312. [Google Scholar] [CrossRef] [Green Version]
- Cai, T.T.; Liu, W.; Xia, Y. Two-sample test of high dimensional means under dependence. J. R. Stat. Soc. Ser. B Stat. Methodol. 2014, 76, 349–372. [Google Scholar]
- Lopes, M.; Jacob, L.; Wainwright, M.J. A more powerful two-sample test in high dimensions using random projection. Adv. Neural Inf. Process. Syst. 2011, 24, 1206–1214. [Google Scholar]
- Srivastava, R.; Li, P.; Ruppert, D. RAPTT: An exact two-sample test in high dimensions using random projections. J. Comput. Graph. Stat. 2016, 25, 954–970. [Google Scholar] [CrossRef]
- Zoh, R.S.; Sarkar, A.; Carroll, R.J.; Mallick, B.K. A powerful Bayesian test for equality of means in high dimensions. J. Am. Stat. Assoc. 2018, 113, 1733–1741. [Google Scholar] [CrossRef] [PubMed]
- Wang, R.; Xu, X. On two-sample mean tests under spiked covariances. J. Multivar. Anal. 2018, 167, 225–249. [Google Scholar] [CrossRef]
- Kuelbs, J.; Vidyashankar, A.N. Asymptotic inference for high-dimensional data. Ann. Stat. 2010, 38, 836–869. [Google Scholar] [CrossRef] [Green Version]
- Thulin, M. A high-dimensional two-sample test for the mean using random subspaces. Comput. Stat. Data Anal. 2014, 74, 26–38. [Google Scholar] [CrossRef] [Green Version]
- Gregory, K.B.; Carroll, R.J.; Baladandayuthapani, V.; Lahiri, S.N. A two-sample test for equality of means in high dimension. J. Am. Stat. Assoc. 2015, 110, 837–849. [Google Scholar] [CrossRef] [PubMed]
- Yu, W.; Xu, W.; Zhu, L. A combined p-value test for the mean difference of high-dimensional data. Sci. China Math. 2018, 62, 961. [Google Scholar] [CrossRef]
- Chen, S.X.; Li, J.; Zhong, P.S. Two-sample and ANOVA tests for high dimensional means. Ann. Stat. 2019, 47, 1443–1474. [Google Scholar] [CrossRef] [Green Version]
- Zhang, J.T.; Guo, J.; Zhou, B.; Cheng, M.Y. A simple two-sample test in high dimensions based on L2-norm. J. Am. Stat. Assoc. 2020, 115, 1011–1027. [Google Scholar] [CrossRef]
- Zhu, Y.; Bradic, J. Significance testing in non-sparse high-dimensional linear models. Electron. J. Stat. 2018, 12, 3312–3364. [Google Scholar] [CrossRef]
- Aitkin, M. Posterior bayes factors. J. R. Stat. Soc. Ser. B Methodol. 1991, 53, 111–128. [Google Scholar] [CrossRef]
- Wang, R.; Xu, X. Least favorable direction test for multivariate analysis of variance in high dimension. Stat. Sin. 2021, 31, 723–747. [Google Scholar] [CrossRef]


| RMPBT | RMPBT | SD | CQ | ||
|---|---|---|---|---|---|
| 0.049 | 0.031 | 0.030 | 0.040 | 0.063 | |
| 0.052 | 0.038 | 0.035 | 0.037 | 0.049 | |
| 0.060 | 0.060 | 0.040 | 0.045 | 0.063 |
| RMPBT | RMPBT | SD | CQ | |||
|---|---|---|---|---|---|---|
| Alternative 1 | 0.975 | 0.470 | 0.332 | 0.309 | 0.384 | 0.450 |
| 0.950 | 0.478 | 0.388 | 0.339 | 0.423 | 0.474 | |
| 0.800 | 0.482 | 0.337 | 0.304 | 0.389 | 0.448 | |
| 0.750 | 0.482 | 0.348 | 0.294 | 0.401 | 0.470 | |
| 0.500 | 0.485 | 0.372 | 0.343 | 0.422 | 0.473 | |
| Alternative 2 | 0.975 | 0.764 | 0.685 | 0.612 | 0.722 | 0.761 |
| 0.950 | 0.797 | 0.694 | 0.612 | 0.741 | 0.775 | |
| 0.800 | 0.785 | 0.660 | 0.581 | 0.717 | 0.762 | |
| 0.750 | 0.806 | 0.695 | 0.616 | 0.756 | 0.789 | |
| 0.500 | 0.786 | 0.677 | 0.588 | 0.727 | 0.767 |
| RMPBT | RMPBT | SD | CQ | |||
|---|---|---|---|---|---|---|
| Alternative 1 | 0.975 | 0.269 | 0.259 | 0.243 | 0.219 | 0.266 |
| 0.950 | 0.277 | 0.249 | 0.232 | 0.209 | 0.258 | |
| 0.800 | 0.282 | 0.261 | 0.222 | 0.221 | 0.270 | |
| 0.750 | 0.299 | 0.264 | 0.236 | 0.242 | 0.284 | |
| 0.500 | 0.336 | 0.303 | 0.265 | 0.268 | 0.326 | |
| Alternative 2 | 0.975 | 0.783 | 0.791 | 0.738 | 0.722 | 0.768 |
| 0.950 | 0.780 | 0.786 | 0.734 | 0.718 | 0.766 | |
| 0.800 | 0.794 | 0.755 | 0.699 | 0.700 | 0.756 | |
| 0.750 | 0.792 | 0.772 | 0.722 | 0.730 | 0.785 | |
| 0.500 | 0.789 | 0.753 | 0.686 | 0.720 | 0.766 |
| RMPBT | RMPBT | SD | CQ | |||
|---|---|---|---|---|---|---|
| Alternative 1 | 0.975 | 0.296 | 0.315 | 0.278 | 0.245 | 0.294 |
| 0.950 | 0.303 | 0.335 | 0.307 | 0.270 | 0.311 | |
| 0.800 | 0.332 | 0.348 | 0.318 | 0.285 | 0.343 | |
| 0.750 | 0.357 | 0.327 | 0.294 | 0.278 | 0.331 | |
| 0.500 | 0.422 | 0.414 | 0.379 | 0.353 | 0.401 | |
| Alternative 2 | 0.975 | 0.785 | 0.836 | 0.776 | 0.716 | 0.755 |
| 0.950 | 0.801 | 0.827 | 0.776 | 0.730 | 0.782 | |
| 0.800 | 0.795 | 0.796 | 0.734 | 0.728 | 0.775 | |
| 0.750 | 0.793 | 0.790 | 0.727 | 0.718 | 0.764 | |
| 0.500 | 0.778 | 0.774 | 0.717 | 0.720 | 0.761 |
Publisher’s Note: MDPI stays neutral with regard to jurisdictional claims in published maps and institutional affiliations. |
© 2022 by the authors. Licensee MDPI, Basel, Switzerland. This article is an open access article distributed under the terms and conditions of the Creative Commons Attribution (CC BY) license (https://creativecommons.org/licenses/by/4.0/).
Share and Cite
Jiang, Y.; Xu, X. A Two-Sample Test of High Dimensional Means Based on Posterior Bayes Factor. Mathematics 2022, 10, 1741. https://doi.org/10.3390/math10101741
Jiang Y, Xu X. A Two-Sample Test of High Dimensional Means Based on Posterior Bayes Factor. Mathematics. 2022; 10(10):1741. https://doi.org/10.3390/math10101741
Chicago/Turabian StyleJiang, Yuanyuan, and Xingzhong Xu. 2022. "A Two-Sample Test of High Dimensional Means Based on Posterior Bayes Factor" Mathematics 10, no. 10: 1741. https://doi.org/10.3390/math10101741
APA StyleJiang, Y., & Xu, X. (2022). A Two-Sample Test of High Dimensional Means Based on Posterior Bayes Factor. Mathematics, 10(10), 1741. https://doi.org/10.3390/math10101741