1. Introduction
CRTS II longitudinally connected ballastless track on bridge is a new type of ballastless track, which was imported from the Max Bögl company in Germany. According to the characteristics of many long bridges and the great bridge ratio of the Beijing–Tianjin intercity high-speed railway, the continuous reinforced concrete baseplate was designed to bear the axial load, which realized the continuous laying of ballastless track on the long span bridge. The longitudinally connected ballastless track on bridge was widely used in many passenger-dedicated lines such as Beijing–Tianjin Intercity, Beijing–Shanghai, Shanghai–Hangzhou, Beijing–Shijiazhuang–Wuhan, Hangzhou–Changsha, etc. The actual laying mileage of the single track has exceeded 9703 km (statistics from the China Academy of Railway Sciences).
When the track slab and the baseplate are longitudinally connected and locked, with the change of the ambient temperature, not only the longitudinal temperature force exists in the rail, but also the great axial force exists in the track slab and the baseplate. Moreover, due to the poor thermal conductivity of concrete, there is a vertical temperature gradient in the track structure under the action of solar radiation. The coupling effect of temperature axial force and nonlinear temperature gradient increases the instability of continuous track structure, which is easy to cause repeated warping deformation of track slab, separation of mortar layer, arch of track slab and other diseases [
1,
2,
3,
4,
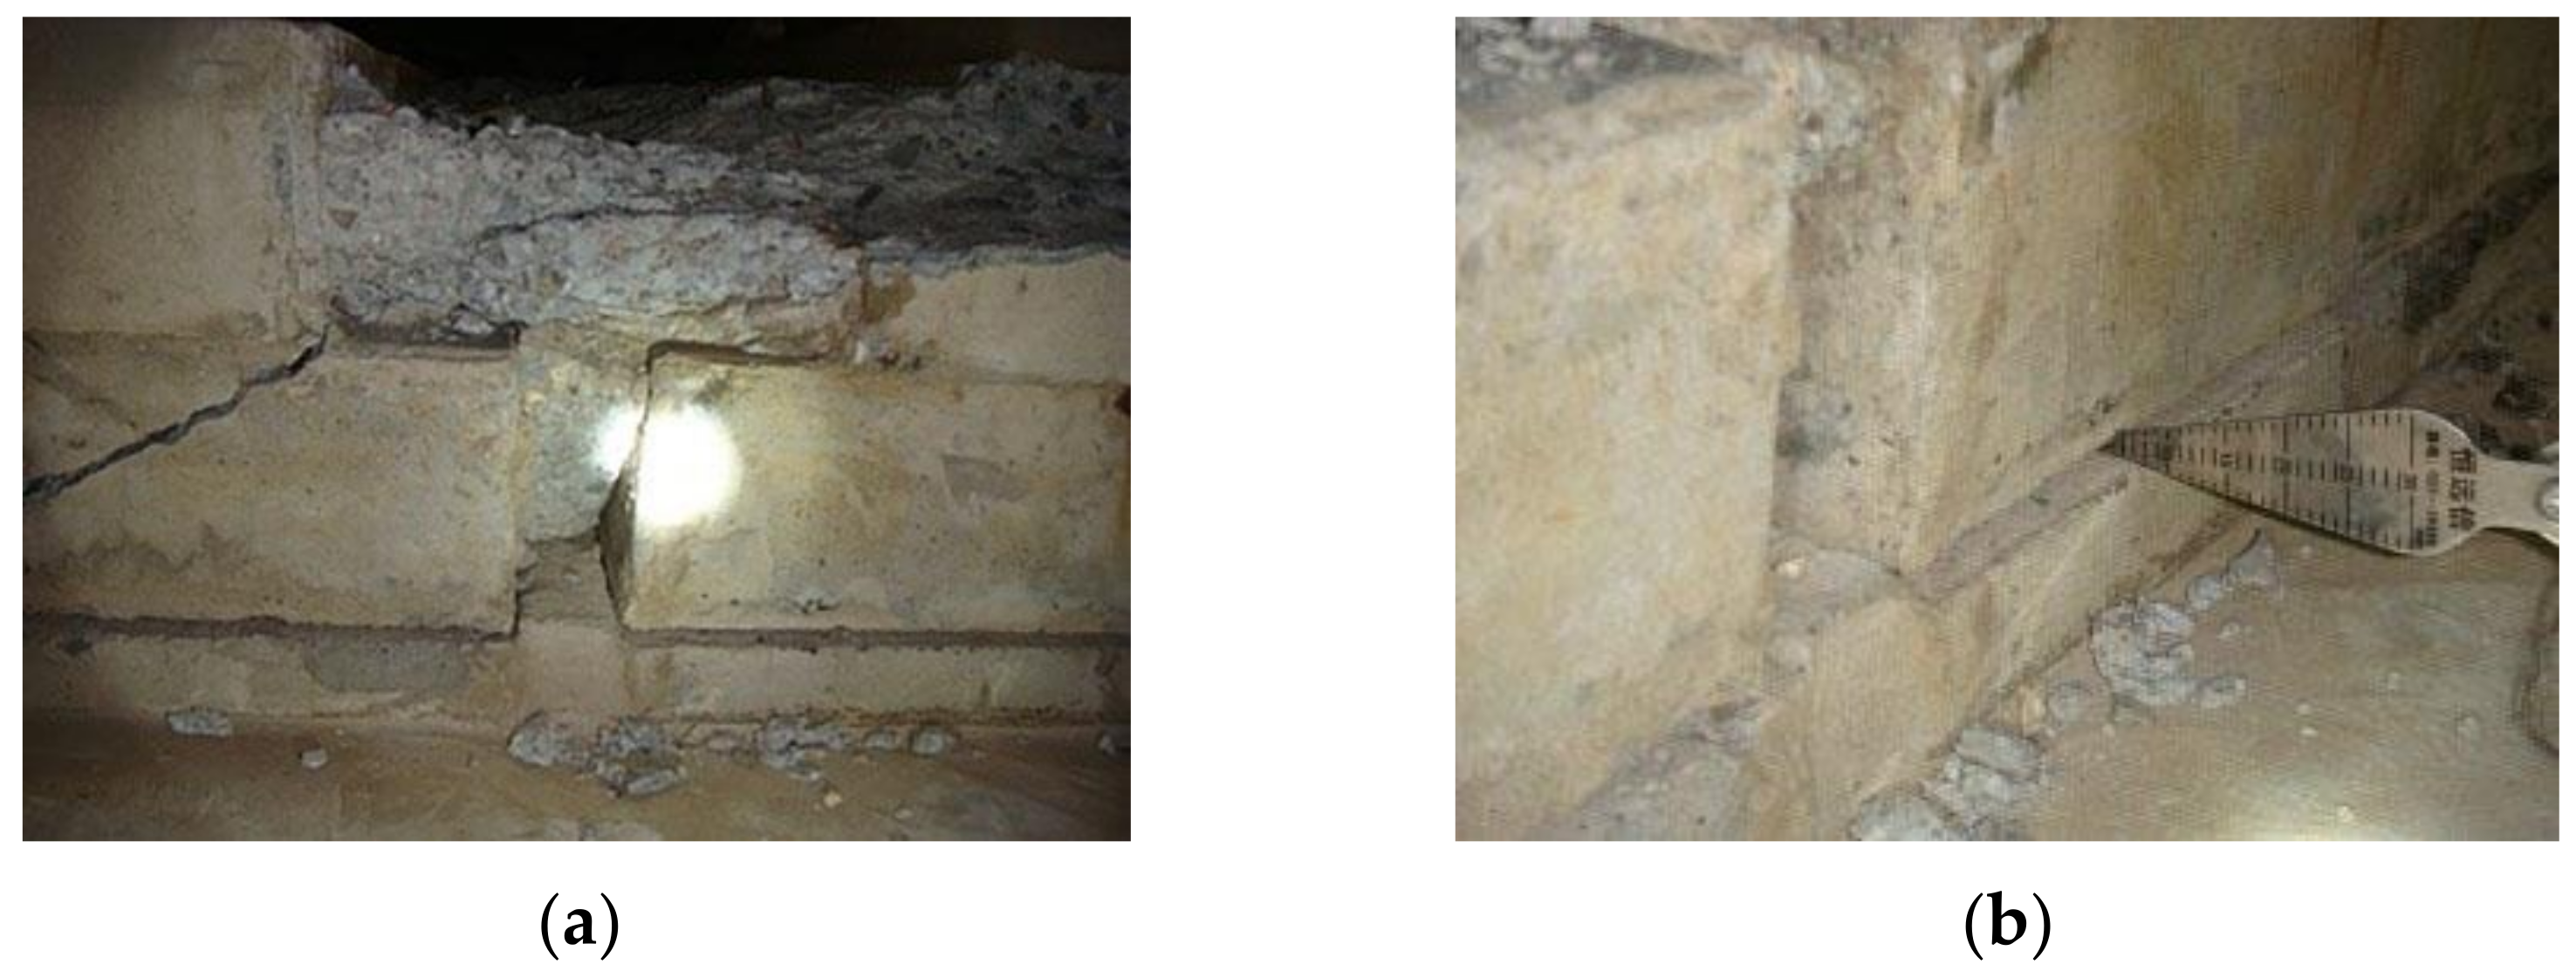
5]. It seriously affects the driving safety and track durability, and the maintenance is extremely difficult. Under the effect of continuous high temperature in the summer of 2013, more than 100 arches appeared on the longitudinally connected ballastless track of the Beijing–Shanghai high-speed railway bridge in service, resulting in the mortar layer emptying and track slab shear failure (
Figure 1). Therefore, the nonlinear temperature load mode of the longitudinally connected ballastless track on bridge becomes the key to study the ballastless track structure design and to explore track structure deformation and stability.
At present, in the analysis of continuous welded rail (CWR) on bridge, the existing specifications and research mostly use the integral temperature rise of the track and bridge structure to consider the expansion force [
6,
7,
8]. The influence of nonlinear temperature gradient of ballastless track is not taken into account, and it is unreasonable to adopt a single temperature load model in various regions. In recent years, domestic and foreign scholars have carried out a series of studies on the temperature field of bridges and track structures. The main analysis methods can be summarized into three categories: the first is statistical methods based on measured data [
9,
10,
11,
12,
13,
14], the second is theoretical analysis methods [
15,
16,
17,
18,
19,
20,
21] and the third is the numerical analysis method using finite element software [
22,
23,
24,
25,
26,
27,
28]. For instance, Liu H established an on-line monitoring system for the track plate temperature field, based on the BP neural network method, established the mapping relationship between environmental meteorological parameters and track plate temperature [
10]. Zhao L made a 1:4 scale test model of CRTS II slab ballastless track simply supported box girder, carried out temperature experiments in summer and winter and studied the temperature distribution patterns of ballastless track [
11]. Yang R analyzed the heat transfer mechanism between ballastless track and environment, and gave the bottom boundary conditions of track temperature field based on theoretical derivation. The three-dimensional model of track temperature distribution was established, and the temperature characteristics of ballastless track under continuous high temperature weather were analyzed [
22]. Mohan K analyzed the bridge temperature field distribution and the corresponding thermal stresses using the software ABAQUS [
23]. However, in some studies, the on-site measurement period is short (mostly several days or months), and the test data lacks completeness, which is difficult to reflect the impact of climate conditions and time on the temperature field of ballastless track. In some studies, the test or modeling analysis is aimed at specific weather conditions and engineering examples, and does not have wide applicability. Considering the need of constructing ballastless track on bridge domestically and abroad, it is required that the load mode and calculation method of the ballastless track on bridge have universal applicability.
In order to solve many difficulties in the application of traditional thermodynamic analysis to the study of ballastless track temperature gradient, the long-term observation and finite element numerical analysis of temperature field of longitudinally connected ballastless track on bridge were carried out. Based on the general finite element software ANSYS, a thermodynamic analysis model of temperature field of longitudinally connected ballastless track on bridge was established, and the accuracy of the analysis method was verified by the long-term observation data. On this basis, the regional distribution law of temperature gradient of ballastless track under different geographical coordinates and climatic conditions was studied, which overcomes the regional limitations of the existing research. The fitting formula of vertical temperature gradient of ballastless track was proposed, and the corresponding correction coefficient was put forward for the main cities of China. The proposed temperature load model makes up for the lack of refinement of climate division and temperature load model in relevant specifications to a certain extent, and has strong engineering application and popularization value.
2. Field Test Research on Temperature Field of Longitudinally Connected Ballastless Track on Bridge
Based on the long-term on-site observation, the annual change rule of the temperature field of the longitudinally connected ballastless track on bridge was studied. A large number of measured data was accumulated to provide data basis and verification conditions for further research on the temperature load mode of ballastless track through thermodynamic analysis.
2.1. Field Test on Temperature Field of Ballastless Track
The observation site is located at the multi-span long-link 32 m simply supported beam of the Xiaojia river curve section in the Hangzhou–Changsha section of the Shanghai–Kunming passenger dedicated line (one side of the baseplate is set with superelevation of 31 cm). The geographical coordinates are 28° N and 115° E, which represent the subtropical monsoon humid climate. Under the bridge is a field, and the axis direction of the bridge is 87.5°. The longitudinally connected ballastless track on bridge adopts 32 m of high-speed railway standard simply supported box girder, and the concrete grade is C50. The baseplate is 2.95 m wide and 0.3 m high, and C30 concrete is adopted. The track slab is 2.55 m wide and 0.2 m high, and is made of C55 concrete. HRB500 (hot rolled ribbed steel bar) is used for track structure reinforcement.
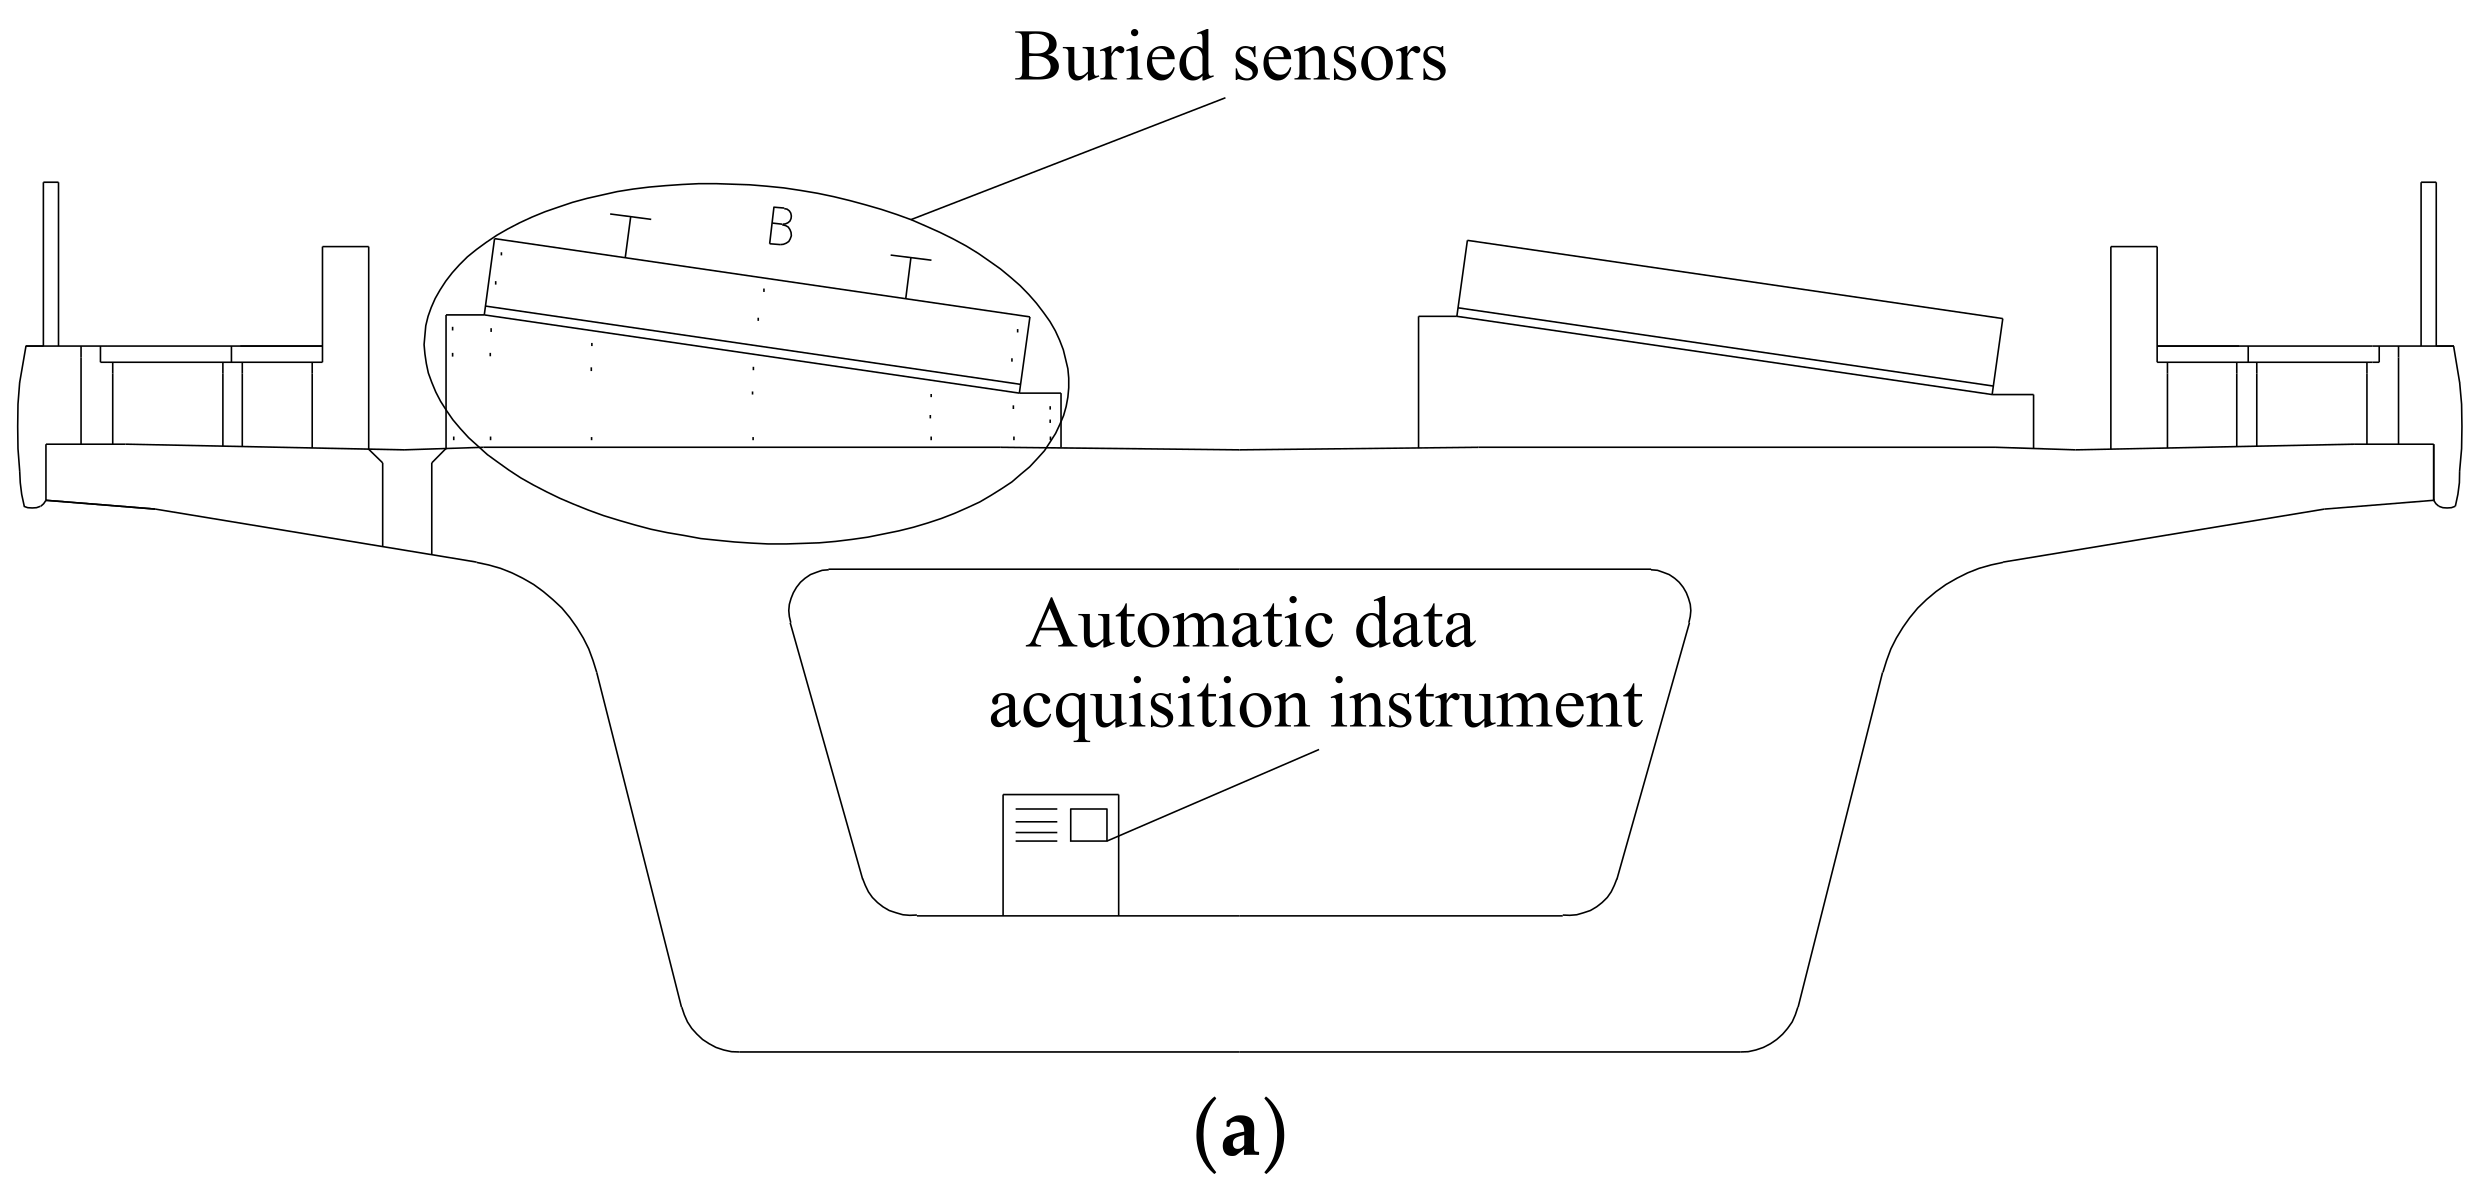
The joints of track slab near the fixed supports of simply supported beams are selected as the test section, and temperature sensors (28 in total) and data acquisition instruments are installed. In the observation scheme, 28 temperature sensors are embedded as shown in
Figure 2.
- (1)
As the main concern is the vertical temperature gradient that causes the warping deformation of the track slab, the temperature sensors are arranged in layers from top to bottom.
- (2)
The temperature sensor near the concrete surface should be encrypted because the temperature of the concrete surface changes dramatically.
- (3)
Considering the shielding effect of the track slab on the baseplate, temperature sensors shall be embedded under the track slab and the exposed part of the baseplate.
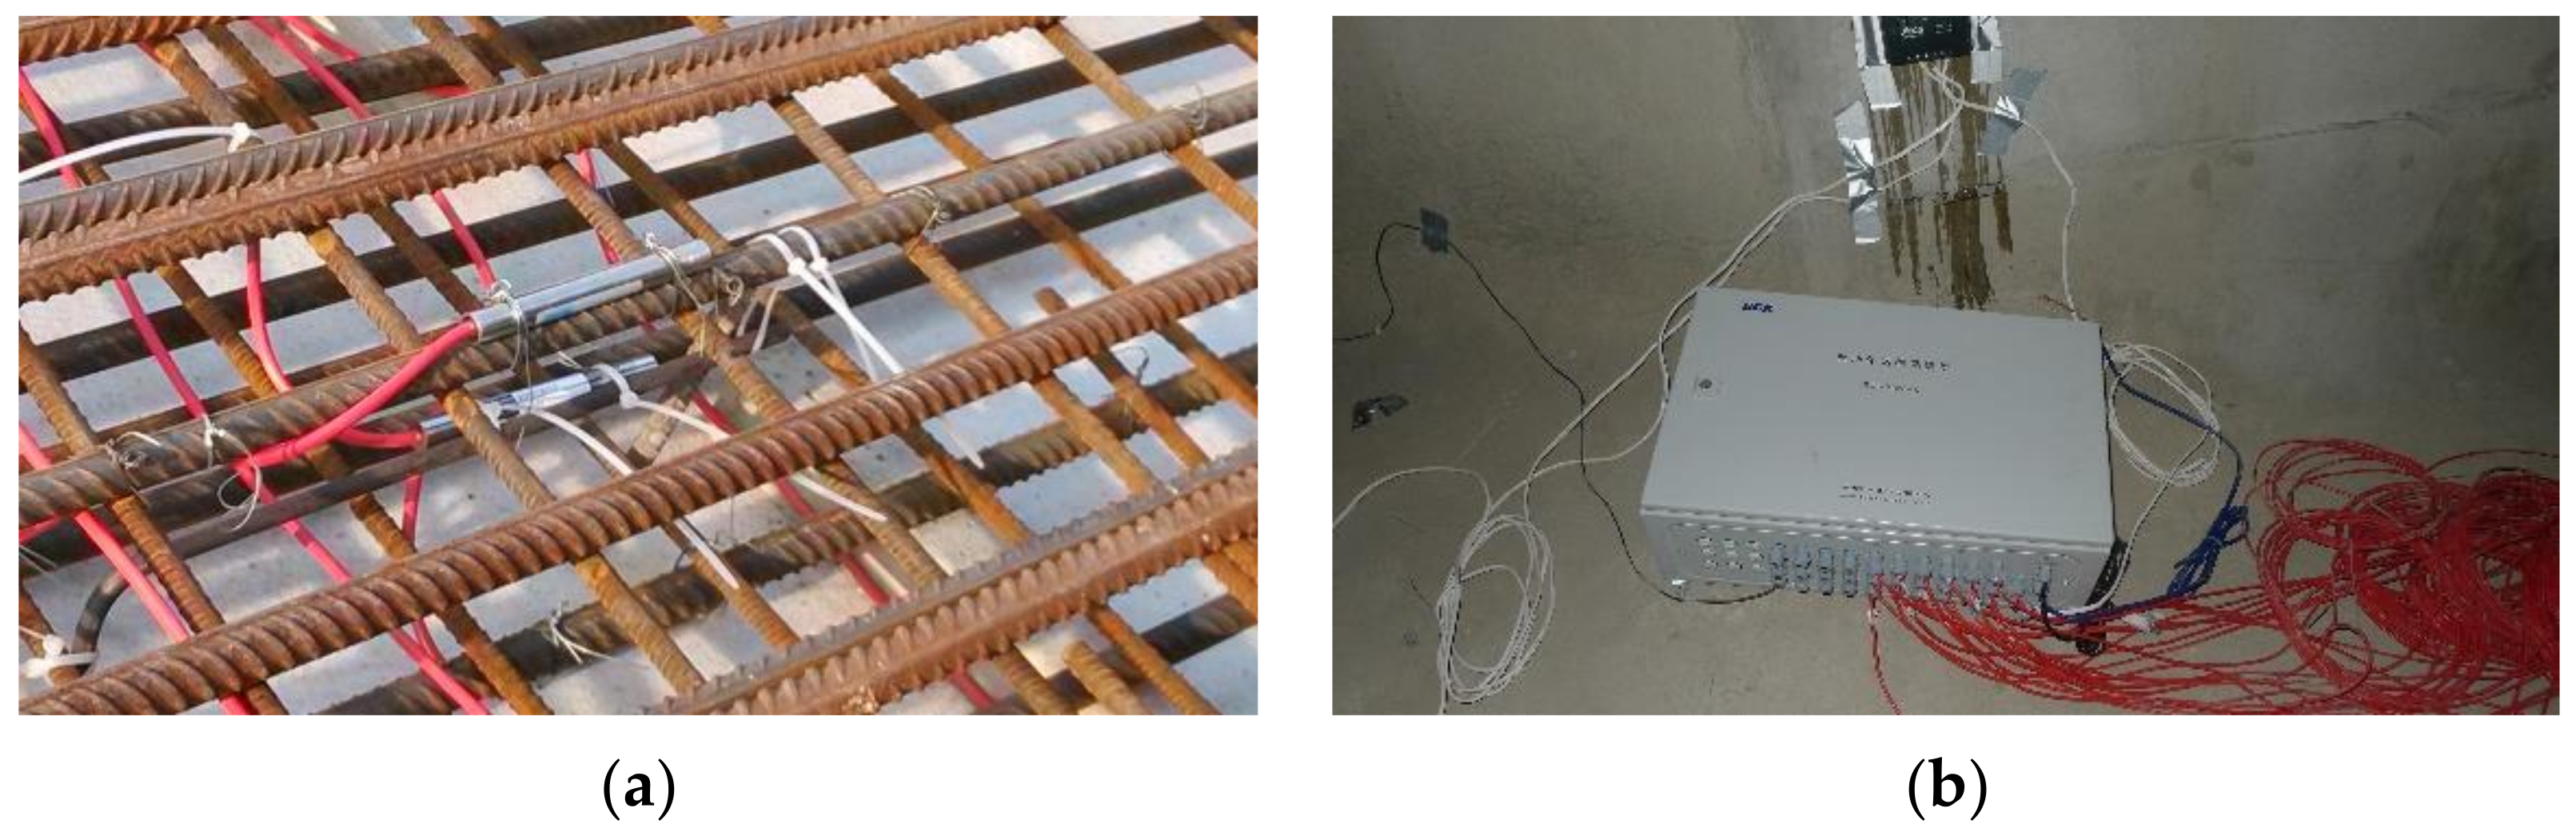
The temperature sensor is bundled with the longitudinal bar in the track slab and the rubber band is wound to make the two fully isolated, which is far away from the vertical bar, so as to prevent the rapid heat transfer of the vertical bar from affecting the test results. For the prefabricated track slab, the temperature field in the track slab is monitored by embedding temperature sensors at the wide joints. The data lines of each temperature sensor are tied tightly into bundles with binding tape, and then led into the data acquisition instrument inside the box girder through the drainage hole of the bridge deck and the vent hole of the web in turn (
Figure 3).
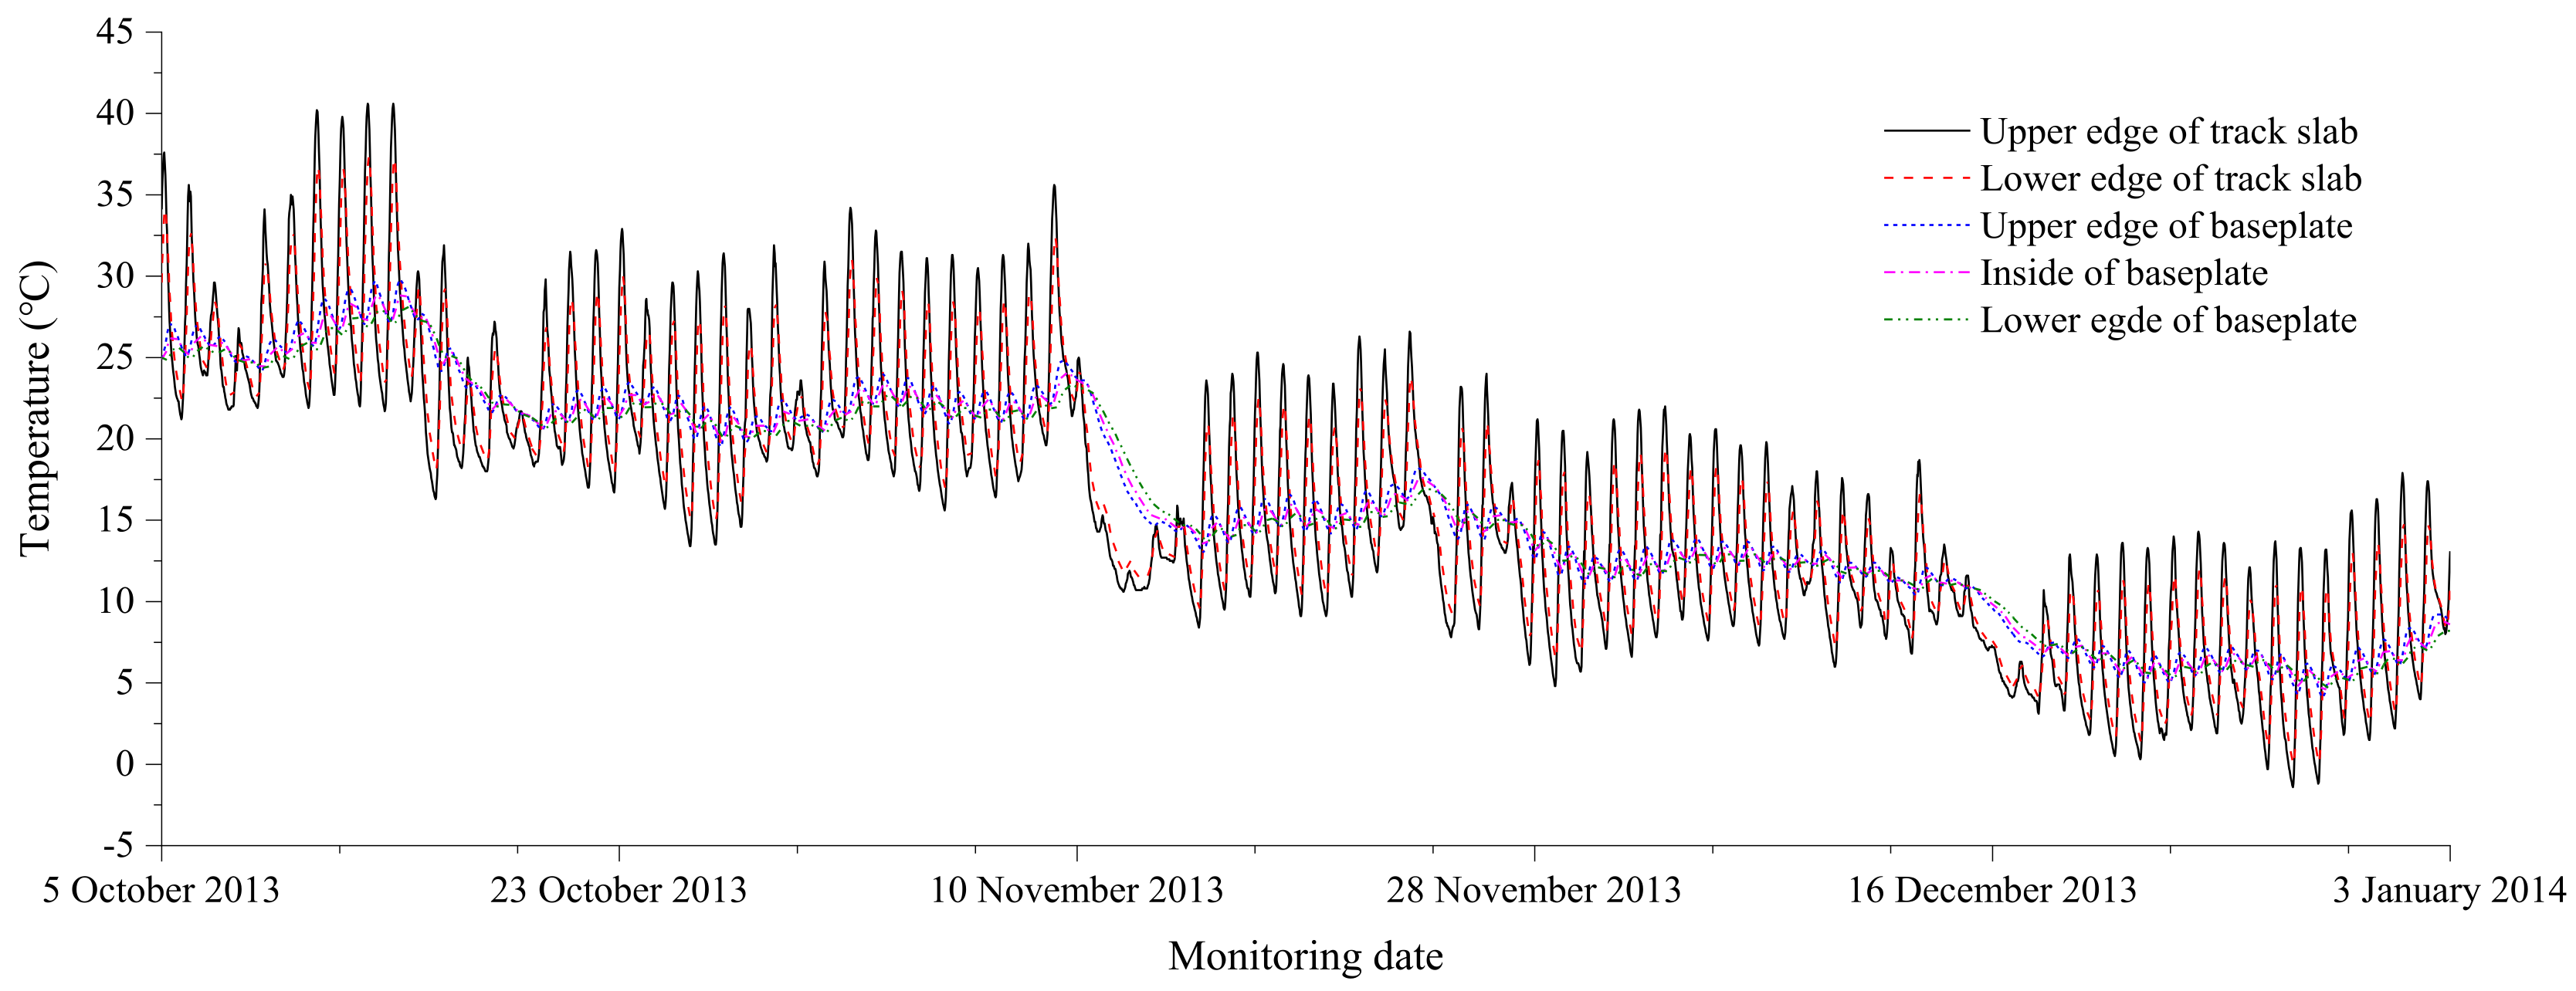
The data acquisition instrument in the box is connected with a large capacity battery. The battery is connected to the solar power panel on the top of the pier through wires to supply power for the data acquisition instrument. Taking Section II as an example, the selected observation data were plotted in
Figure 4.
As revealed in
Figure 4, due to direct solar radiation and convective heat transfer, the surface temperature of ballastless track varies significantly on a daily basis, and the maximum temperature differs from the daily maximum air temperature by 5–14 °C. The internal temperature of ballastless track lags behind that of the upper surface, and the variation range is small. The bottom surface temperature is 2–14 °C higher than the daily minimum air temperature.
The daily distribution of temperature difference between the upper and lower surfaces of the track during the observation period is shown in
Figure 5.
It can be seen from
Figure 5 that the temperature difference between the upper and lower surfaces of the track can reach between −10 and 15 °C, and the greater the daily air temperature difference, the greater the vertical temperature difference of the track slab. The maximum positive temperature difference appeared at 15:00 p.m., and the maximum negative temperature difference appeared at about 6 a.m.
2.2. Seasonal Characteristics of Temperature Gradient of Track Structure
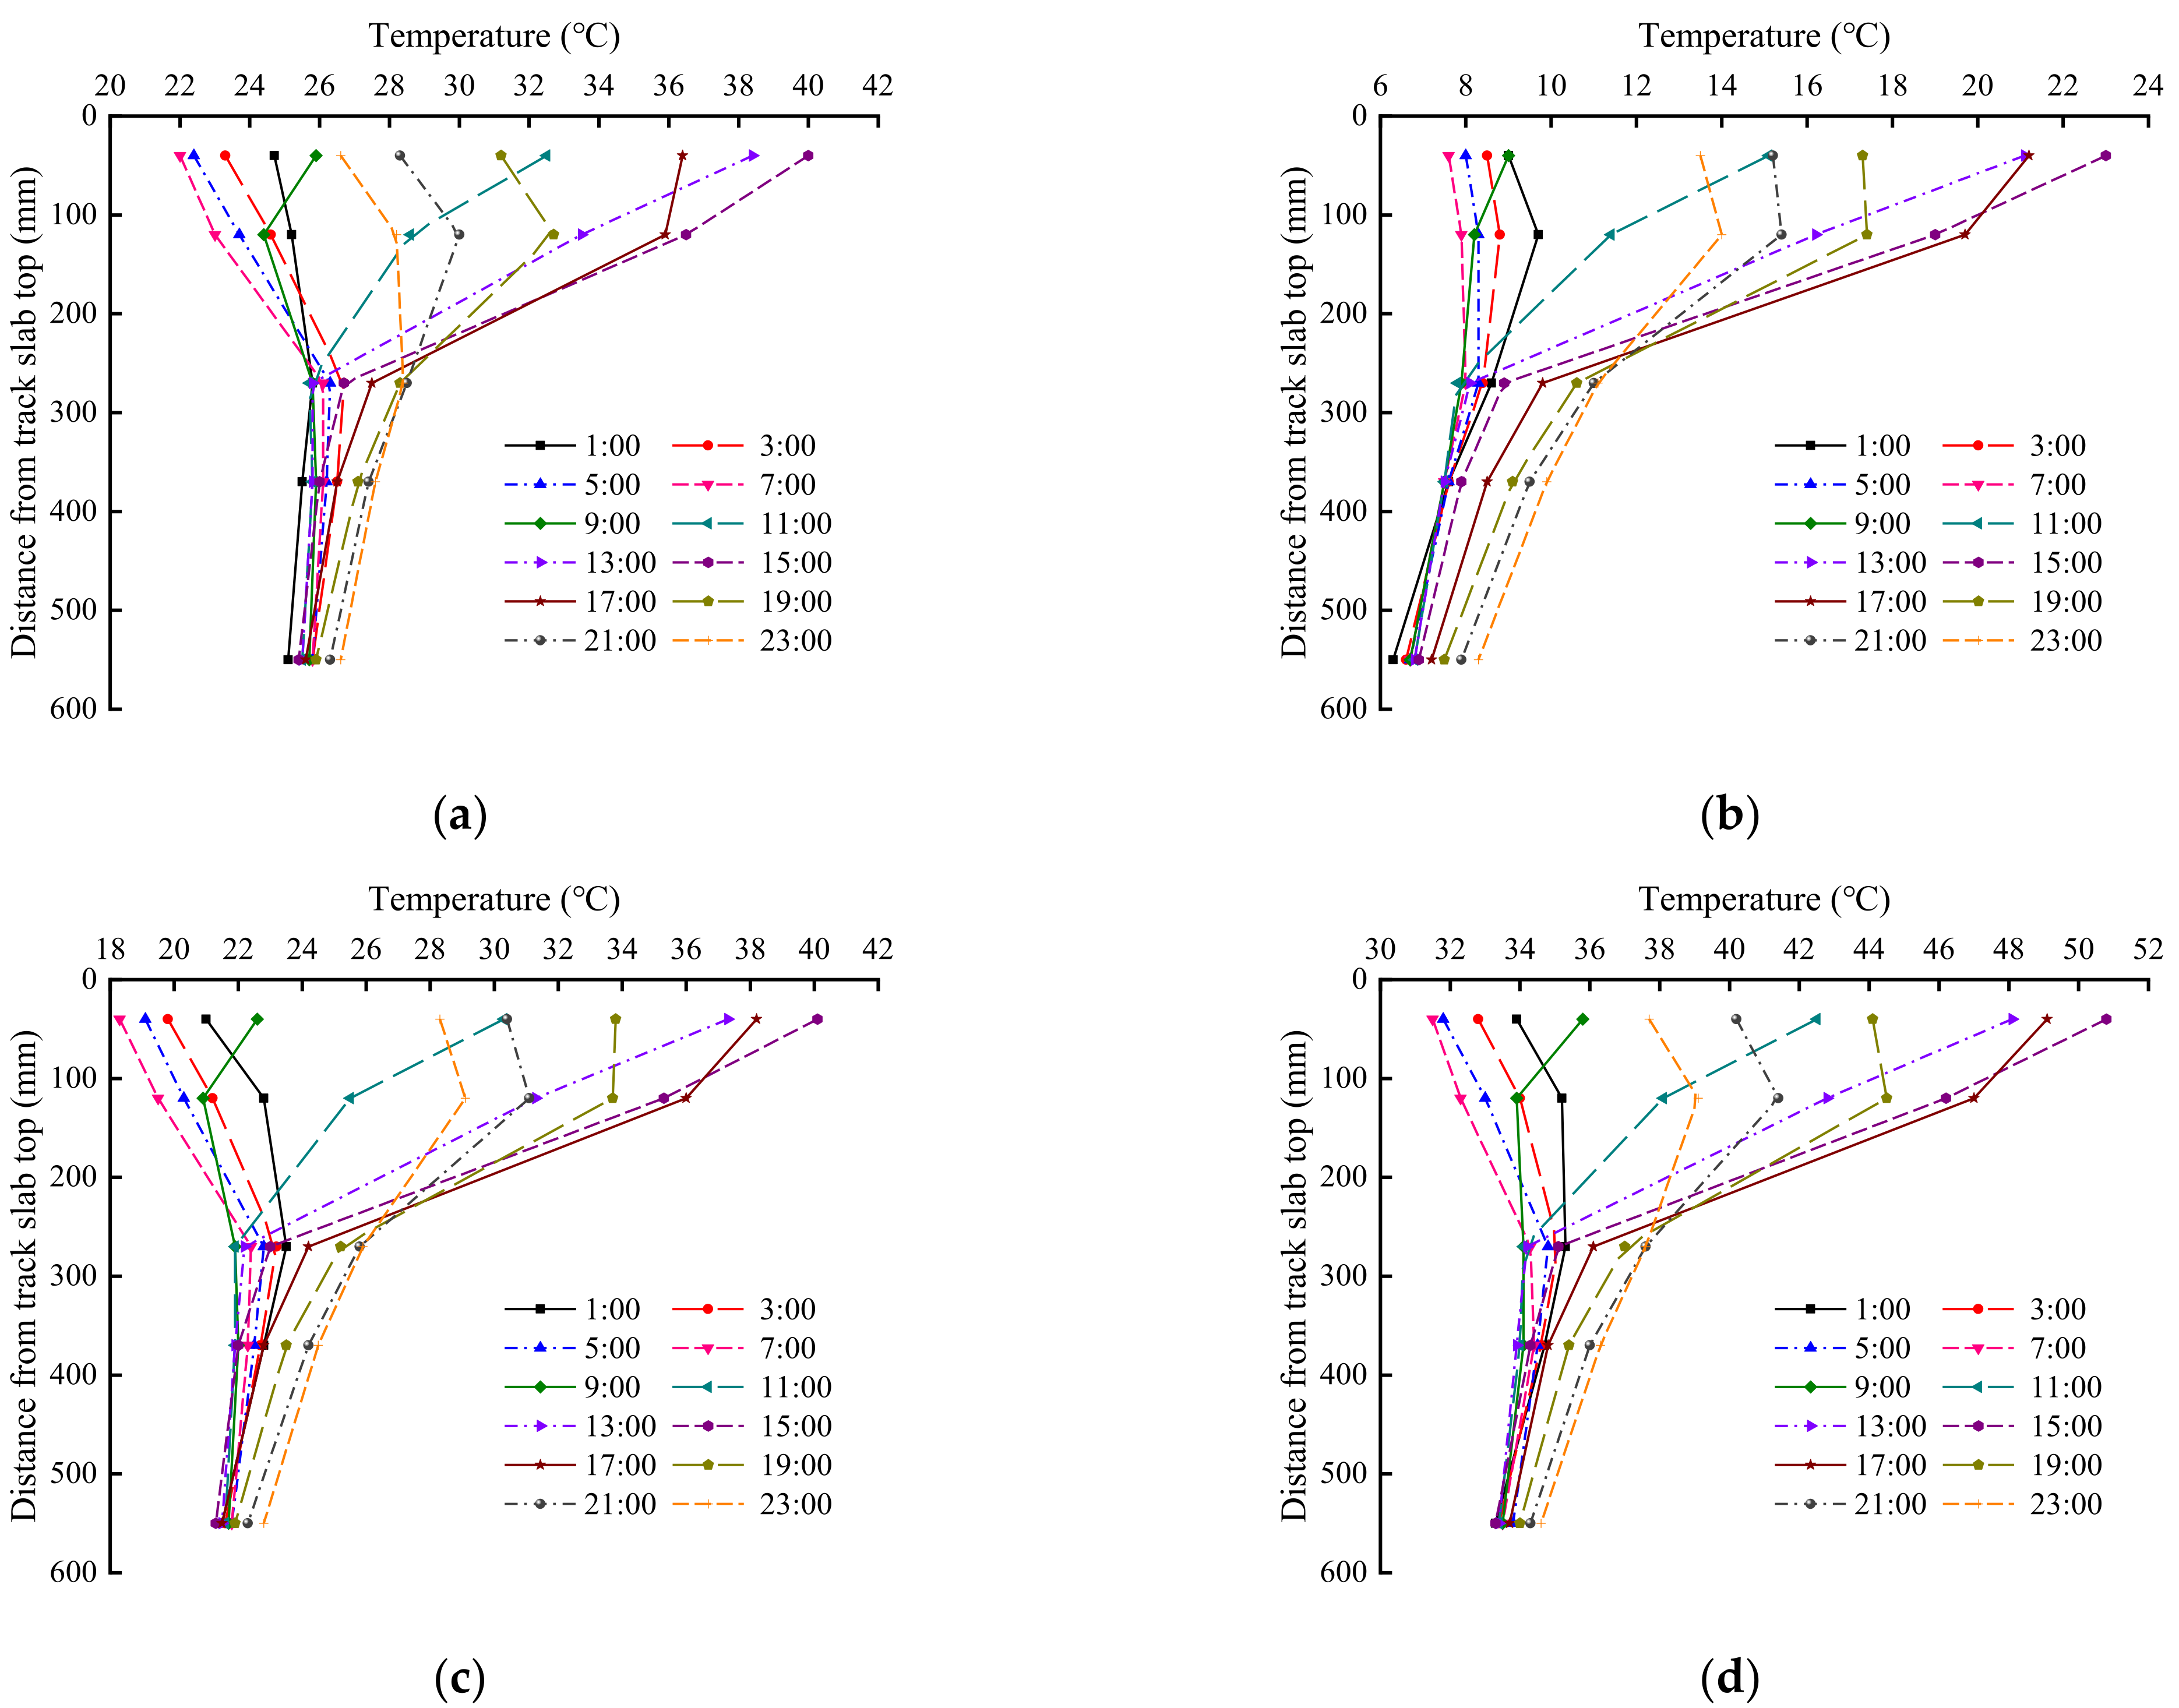
In order to further explore the temperature field distribution characteristics of ballast-less track structure, typical sunny days in four seasons of two test sites were selected respectively, and the daily vertical temperature variation diagram of Section II was drawn (
Figure 6). Among them, 11 October (sunny weather, temperature 23–32 °C) is selected in autumn, 22 February (sunny weather, temperature 6–16 °C) is selected in winter, 10 April (sunny weather, temperature 17–28 °C) is selected in spring, and 30 July (sunny weather, temperature 27–36 °C) is selected in summer.
It can be seen from
Figure 6 that in all four seasons, the maximum negative temperature difference occurs before and after sunrise in the morning. After two to three hours of solar radiation, the temperature inside the track is relatively uniform. Since then, the temperature of track structure keeps rising under the action of sunshine and the positive temperature gradient gradually increases, and the track structure usually reaches the maximum positive temperature difference in the afternoon. Then the temperature of the track structure begins to decrease with the decrease of the sunshine intensity, and reaches the uniform state around midnight, after which the negative temperature difference appears again. Under the action of sunlight, the heat transfer phenomenon is most obvious in the range of 0.1 m from the surface, and the temperature difference increases with the increase of thickness. When the thickness reaches 0.3 m, the range of temperature difference decreases with the decrease of heat transfer.
However, due to the lack of mapping between meteorological parameters and temperature gradient, it is difficult to ensure the completeness; the measured data is closely related to local climate conditions, so it does not have wide applicability. Therefore, the thermodynamic model needs to be established for further analysis.
3. Thermodynamic Model of Temperature Field of Ballastless Track and Its Verification
In order to solve the regional limitations of the research methods in the previous chapters and study the vertical temperature field distribution of ballastless track, the heat exchange process between concrete and environment was simplified into three types: solar radiation, radiant and heat dissipation, and the convective heat transfer. Based on the general finite element software ANSYS, the thermodynamic analysis model of the temperature field of longitudinally connected ballastless track on bridge was established, and the accuracy of the analysis was verified by the measured date.
3.1. Thermodynamic Analysis Theory of Temperature Field of Ballastless Track
Under the condition of clear sky, few clouds and low wind speed, the heat exchange process between the concrete ballastless track structure on bridge and the outside world can be divided into three parts: solar radiation, radiant heat transfer and convective heat transfer.
The solar thermal radiation reaches the surface of ballastless track after being absorbed, reflected and scattered by the atmosphere. The direct solar radiation intensity
received by the surface of ballastless track can be expressed as [
16]:
where
,
,
and
are solar constant, atmospheric transparency coefficient, solar altitude angle and solar incidence angle respectively.
The solar constant
is related to the calculation date. Let
represent the daily ordinal number from 1 January. The solar constant can be calculated by using the empirical formula of Formula (2) [
29].
The solar altitude angle
is related to the geographical latitude
, solar inclination
and solar time angle
of the concrete structure [
30].
Regardless of time difference, the relationship between solar time angle
and Beijing time
and geographic longitude
can be expressed as [
29]:
The atmosphere absorbs solar radiation and scatters, and some of the solar radiation reaches the surface of ballastless tracks again. The scattering intensity
can be expressed by empirical Formula (5) [
29].
where
is the angle between the normal outside the inclined plane and the horizontal plane.
Therefore, the radiation intensity absorbed by the surface of ballastless track is:
where
is the radiation absorption rate of concrete surface.
Under the action of a certain wind speed, the heat exchange between the surface of ballastless track and the outside atmosphere follows Newton’s cooling law.
where
is the convective heat exchange coefficient, which is related to the surface shape and wind speed;
is the temperature of the outside air; and
is the surface temperature of track structure.
It is generally considered that the transmittance of concrete material is 0 and conforms to the properties of ash [
29], and the emissivity is equal to the absorptivity
. The total effect
of thermal radiation emitted and absorbed by the surface of ballastless track can be expressed as:
where
is the radiation intensity of the atmosphere to the track and
is the outward radiation intensity of ballastless track surface.
The above analysis process shows that the temperature gradient distribution of ballastless track is related to the longitude and latitude, date, time, ambient temperature, wind speed, atmospheric transparency coefficient and concrete surface absorption rate of the structure.
3.2. Thermodynamic Model and Verification of Temperature Field of Ballastless Track
Existing research has shown that the temperature distribution of longitudinally continuous concrete structures (such as bridges) is extremely similar [
29], so the temperature field of ballastless track structure is simplified as a 2D transient nonlinear problem on the section.
Considering the influence of solar radiation, atmospheric temperature and wind speed on the temperature field, the third boundary condition (Equation (1)) is used [
29]:
where
T is the temperature;
t is the time;
is the thermal conductivity; and
x,
y is the spatial coordinate.
where
is the thermal conductivity;
n is the outer normal direction of the boundary;
is the surface heat transfer coefficient; and
and
are functions of time
t.
The values of
and
are as follows [
20]:
where
is the daily average wind speed (m/s).
where
is the daily average temperature,
;
is the daily temperature amplitude,
;
is the daily maximum temperature (°C);
is the daily minimum temperature (°C);
is the initial phase, generally 9h; and
is the angular frequency,
.
where
is the maximum solar radiation (J),
;
is the total daily solar radiation (J);
; and
c is the sunshine hours (h). When the above series term
k = 20, the calculation accuracy can meet the requirements.
Based on ANSYS, the thermodynamic analysis model of ballastless track considering bridge structure was established. In the model, the specific heat capacity of concrete is 960 J/(kg·K), the thermal conductivity is 10.8 KJ/(h·K·m), the volume weight of concrete is 2600 kg/m
3, the surface radiation absorption coefficient of concrete is 0.65 and the surface short wave reflectance is 0.3. The solar radiation, convective heat transfer and radiation heat transfer effects are transformed into radiation heat flow density, which is stored in a table indexed by time, track surface temperature and coordinates, and used as load boundary conditions for load calculation. There is a great correlation between the temperature and time of the concrete structure. In order to reduce the impact of the initial temperature field, it is necessary to carry out multiple iterations in the calculation process. After multiple iterations, the calculation results gradually stabilize [
29], where the number of iterations is taken as 10.
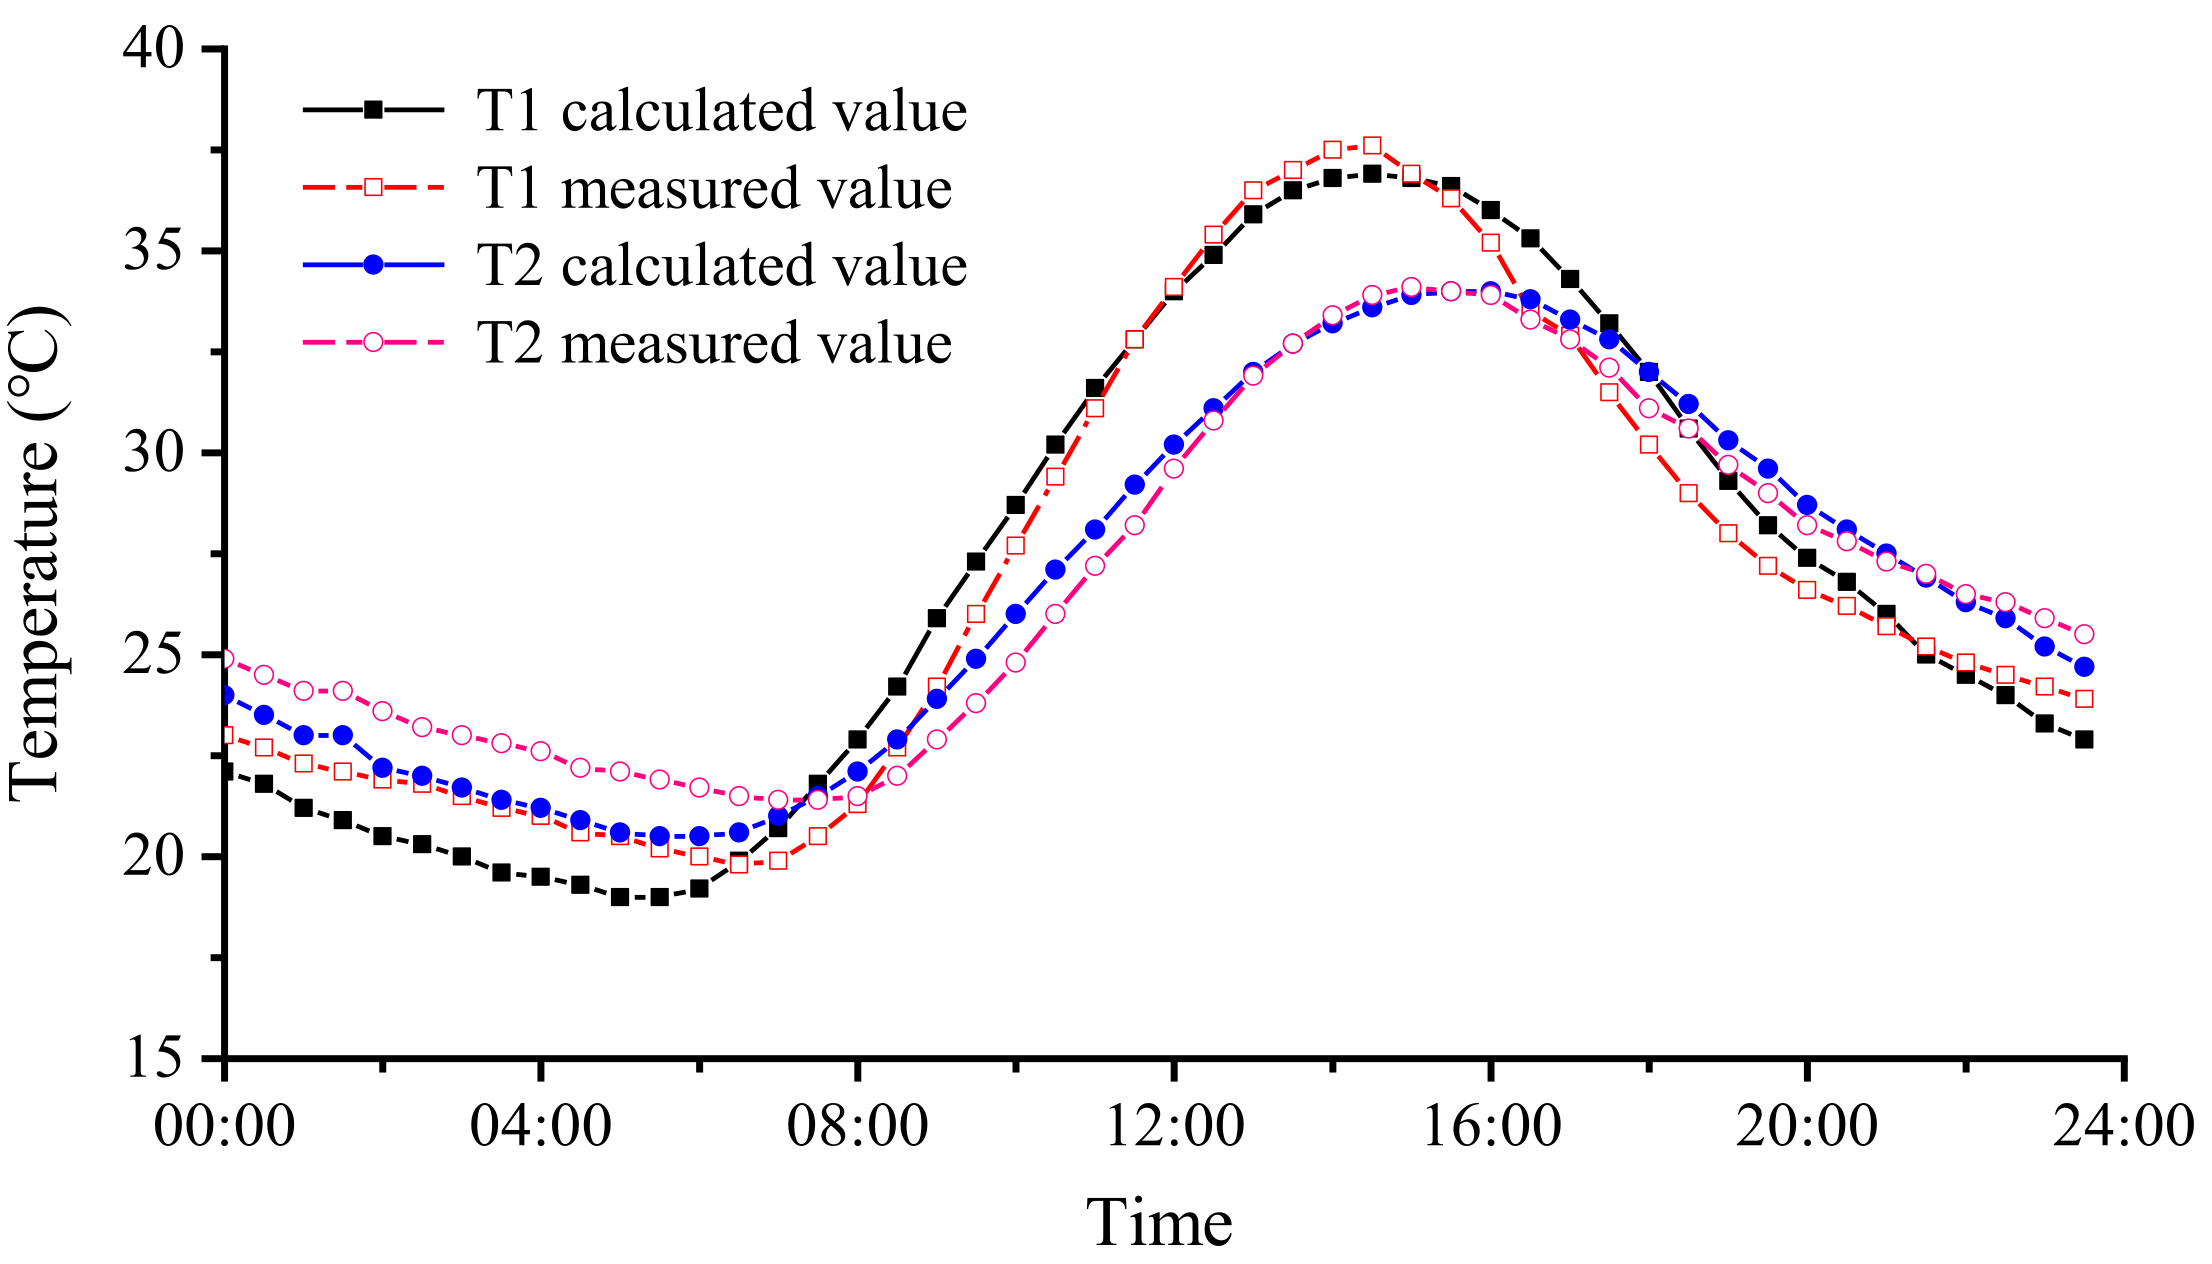
Taking the measured data of ballastless track temperature field as an example to verify the thermodynamic model of the ballastless track temperature field, temperature sensors are set in the wide and narrow joints of the track slab, where the measuring point T1 is 4 cm away from the upper surface of the track slab, and the measuring point T2 is 2 cm away from the lower surface of the track slab. The temperature record on October 5, 2013 is taken as an example to verify. The maximum temperature of the day is 27.6 °C, the minimum temperature is 18.1 °C, the average wind speed is 2.2 m/s and the atmospheric transparency coefficient is 0.85. The calculation results are shown in
Figure 7.
The maximum error between the calculated track slab temperature and the measured temperature is 1.8 °C, and the average relative error is 3.6%. It is proved that the algorithm has a relatively high accuracy and meets the engineering needs.
4. Temperature Gradient Distribution of Ballastless Track in China
In order to study the influence of latitude and longitude and local climate on the vertical temperature gradient of ballastless track, this paper took 33 cities such as Harbin, Urumqi, Lhasa, Beijing, Shanghai and Haikou as examples to analyze the vertical temperature distribution of ballastless track under different geographical locations and climate. Calculation parameters: assuming that the weather is clear and cloudless, the wind speed is taken as 2.2 m/s, the atmospheric transparency coefficient is 0.85 [
31] and the daily average maximum and minimum temperature of each month is taken as the ambient temperature. Taking the above meteorological parameters as the analysis input conditions, the temperature distribution of ballastless track in each region was analyzed by using the thermodynamic simulation model of ballastless track.
4.1. Distribution of Positive Temperature Gradient
Through thermodynamic simulation analysis, the maximum positive temperature gradient and occurrence time of ballastless track are summarized in
Figure 8. The maximum positive temperature gradient of ballastless track in China is 13:00–16:00 p.m. from May to August. The occurrence time of the maximum positive temperature gradient is related to latitude and longitude and local climate. Generally speaking, the month of the maximum positive temperature gradient appears earlier in the low latitude area, and time appears earlier in the eastern area.
The maximum positive temperature difference in each area of ballastless track is 15.8–19.5 °C, and its distribution is related to longitude and the positive temperature difference of ballastless track in the western area is relatively large.
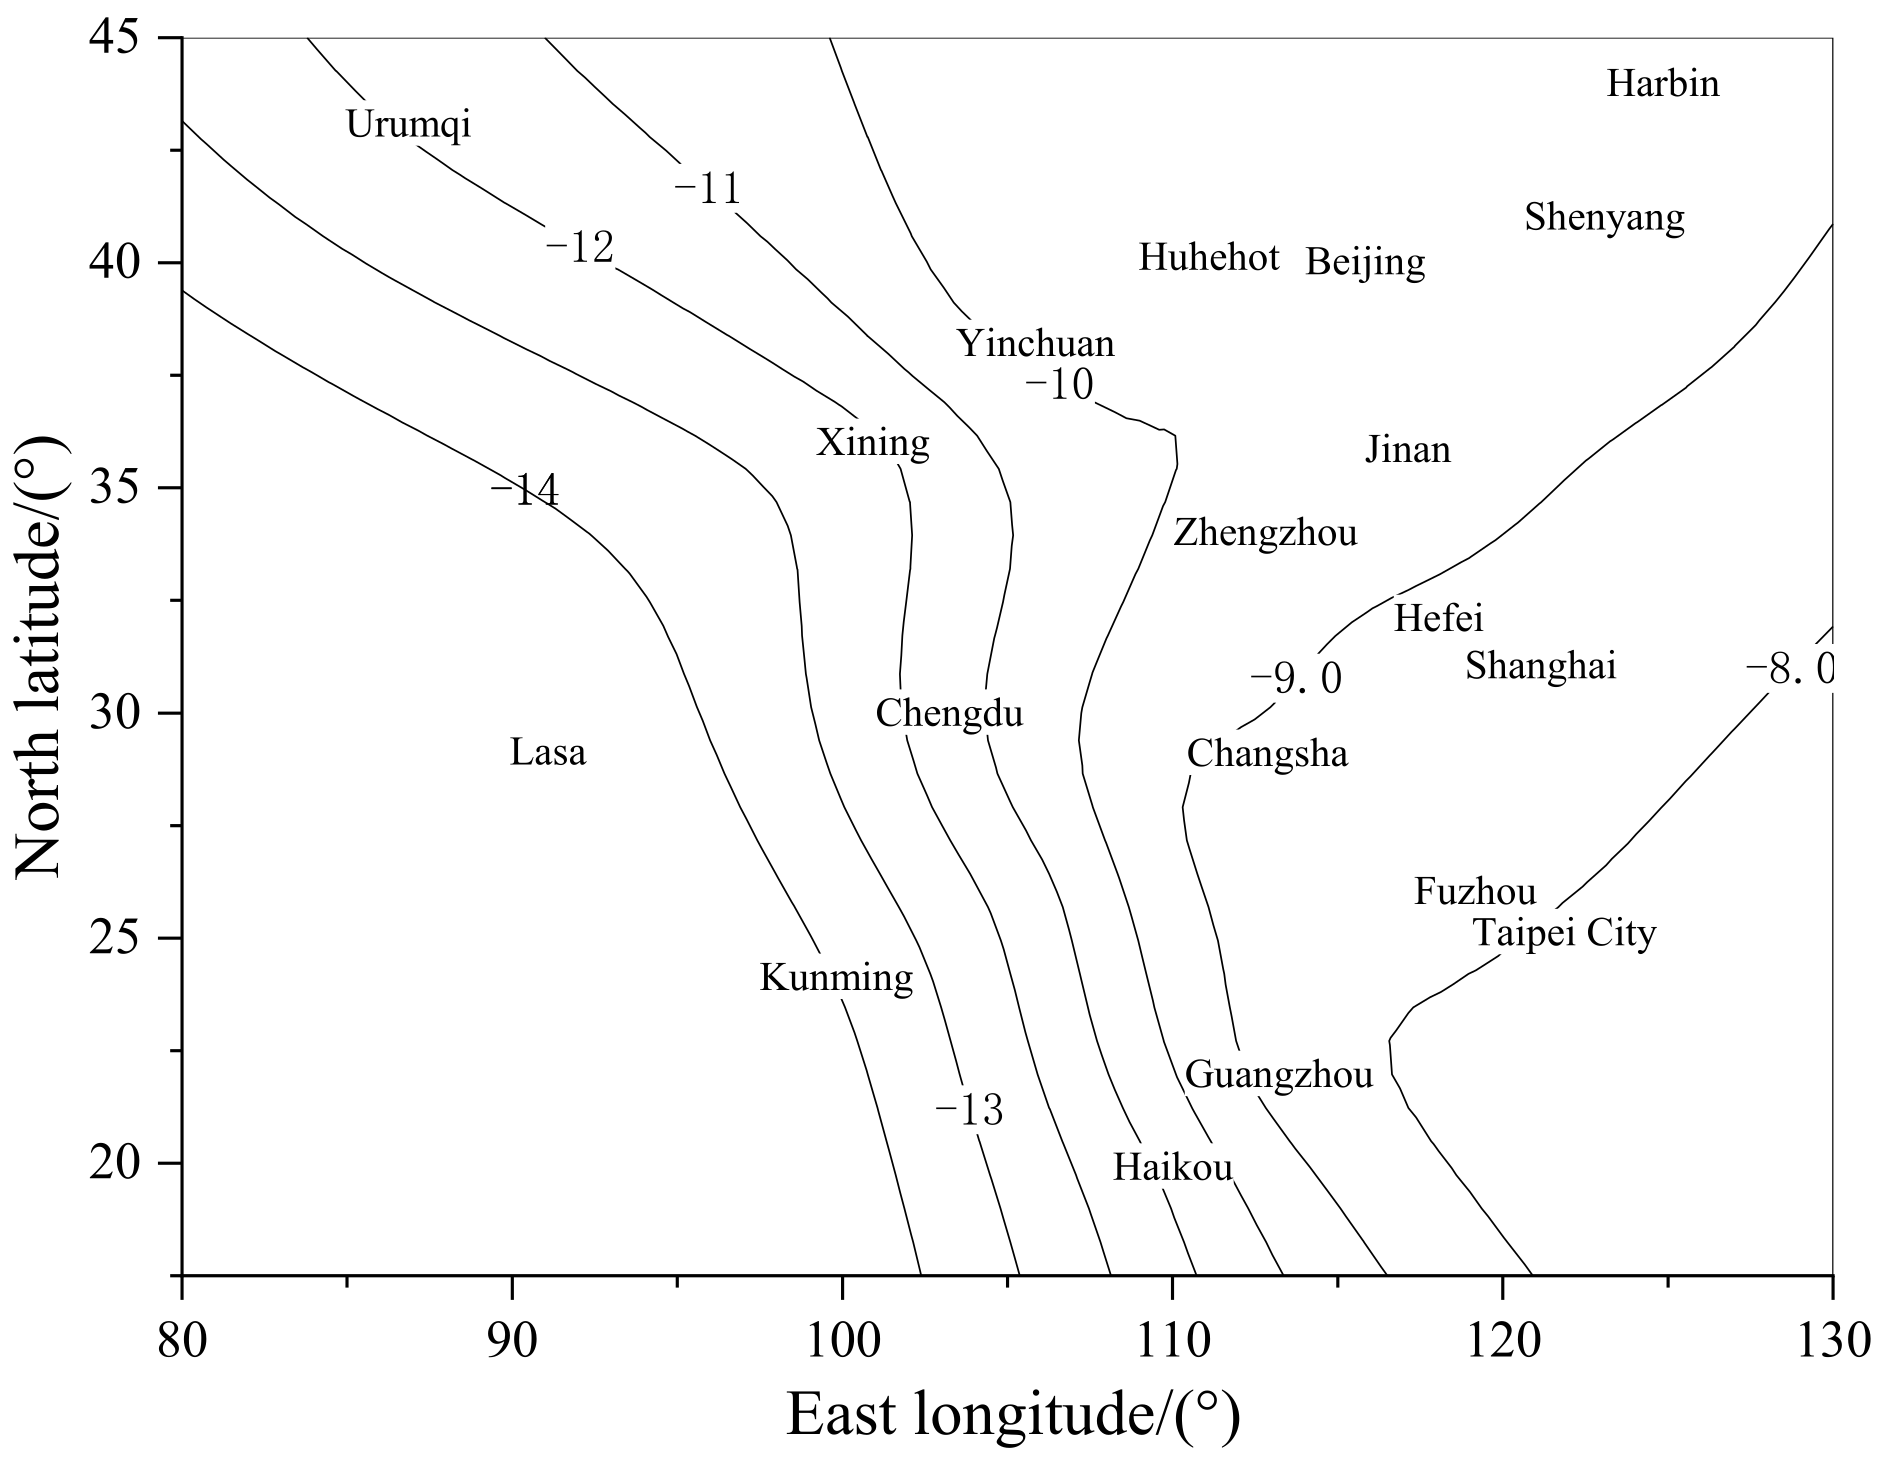
4.2. Distribution of Negative Temperature Gradient
According to the thermodynamic simulation analysis, except that the maximum negative temperature gradient of Fuzhou ballastless track appears at 5:00 a.m. in February, other areas appear at 5:00–5:30 a.m. in January, and the lowest temperature on the surface of track slab in the western region appears slightly later than that in the eastern region. The distribution of the maximum negative temperature difference of ballastless track is shown in
Figure 9.
The lowest surface temperature of track slab is −19.5 to 12.7 °C, and its distribution is related to latitude. The higher the latitude is, the lower the local winter average temperature is, and the lower the surface temperature of track slab is. Taking Harbin as an example, the average temperature in January is −24 to −13 °C, and the surface temperature of track slab is −19.5 to 4.9 °C.
The maximum negative temperature difference of ballastless track is 7.8 to 15.1 °C. The distribution of the maximum negative temperature difference of ballastless track is related to longitude and terrain environment. The maximum negative temperature difference of ballastless track in southeast coastal area is smaller than that in southwest area.
5. Temperature Load Mode of Ballastless Track System in China
Based on the study of the influence of longitude and latitude, ambient temperature on the temperature gradient of ballastless track, the vertical temperature gradient formula of ballastless track was fitted, and the corresponding adjustment coefficients were proposed for the main cities of our country, providing reference for the determination of the temperature load of ballastless track in China.
5.1. Temperature Load Mode of Ballastless Track in China
Based on a large number of thermodynamic simulation analysis, the vertical temperature load formula for ballastless track in typical areas of China is shown in
Figure 10.
Fitted as follows:
where the
is the slab temperature at different depths between the track structure and the surface (°C),
is positive temperature gradient,
is negative temperature gradient;
is the depth from the track slab surface (m); and
(
) is the regional adjustment coefficient of the positive (negative) temperature gradient obtained by fitting (
Table 1). The square of the correlation coefficients in the fitting results are all above 0.9, indicating that the fitting results are relatively reliable.
According to the climate characteristics, China’s climate zones can be divided into five types: tropical monsoon climate, subtropical monsoon climate, temperate monsoon climate, temperate continental climate and plateau mountain climate.
Table 1 lists the adjustment coefficients of typical representative cities in each climate zone, which can provide reference for the temperature load value of ballastless track in various regions of China.
Assuming that the thickness of the baseplate is 20 cm, it can be obtained from Formulas (15) and (16): the average vertical positive temperature difference of ballastless track in China is 17.0 °C, the negative temperature difference is 8.7 °C, in which the average positive temperature difference between the upper and lower surfaces of the track slab is 13.0 °C, and the negative temperature difference is 6.4 °C. The surface temperature of ballastless track in Chengdu, Changsha and southeast coastal areas exceeds 45 °C in summer, while the lowest surface temperature of track slab in Urumqi, Harbin and other places is lower than −16 °C.
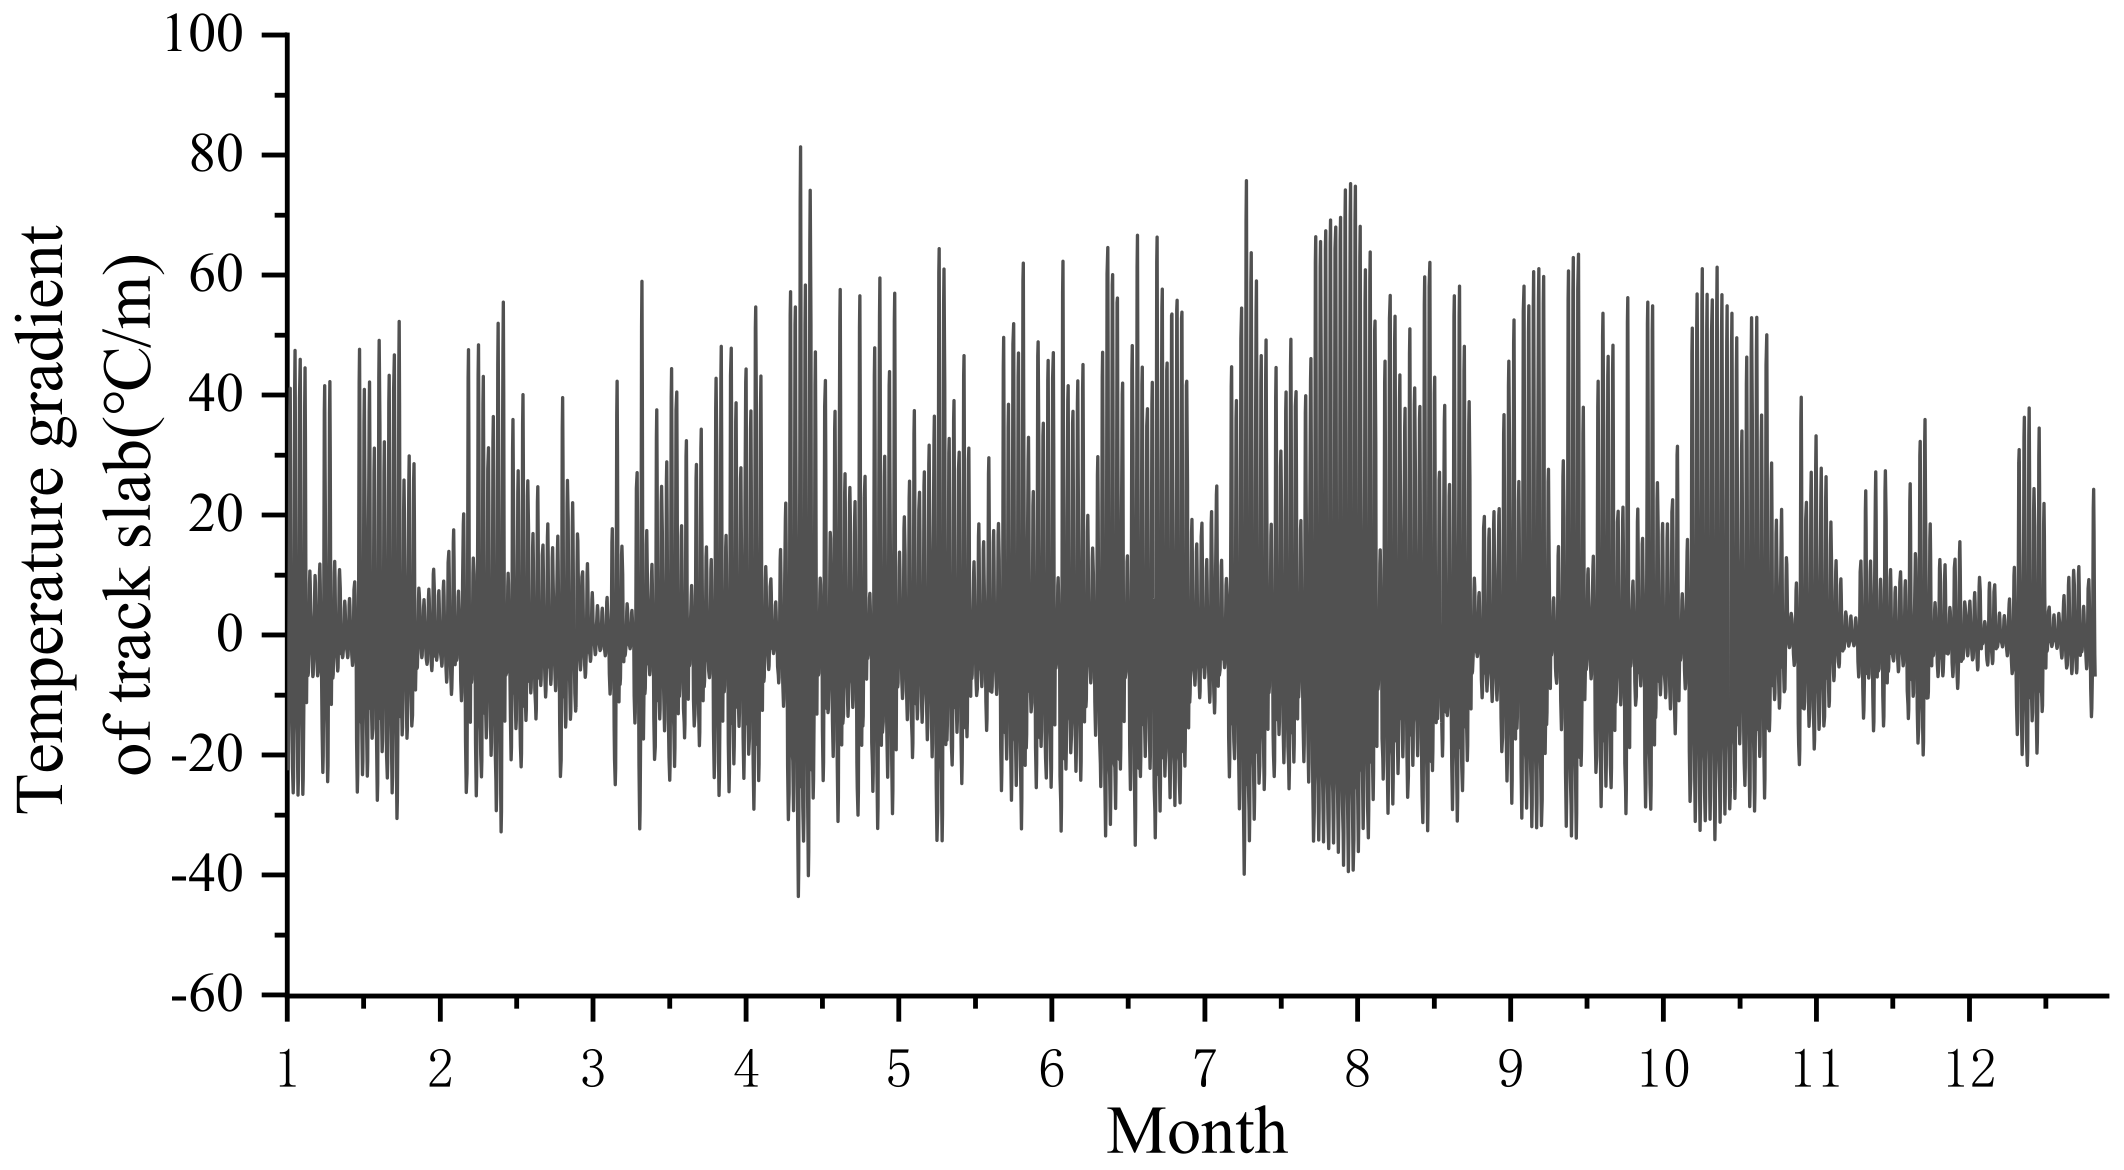
Taking the representative cities in China as an example, the maximum gradients of track slab in Harbin (north region), Nanchang (middle region) and Guangzhou (south region) throughout the year are shown in
Table 2. Taking Nanchang as an example, the annual temperature gradient changes are shown in
Figure 11.
5.2. Stress of Track Structure under Annual Temperature Gradient Load
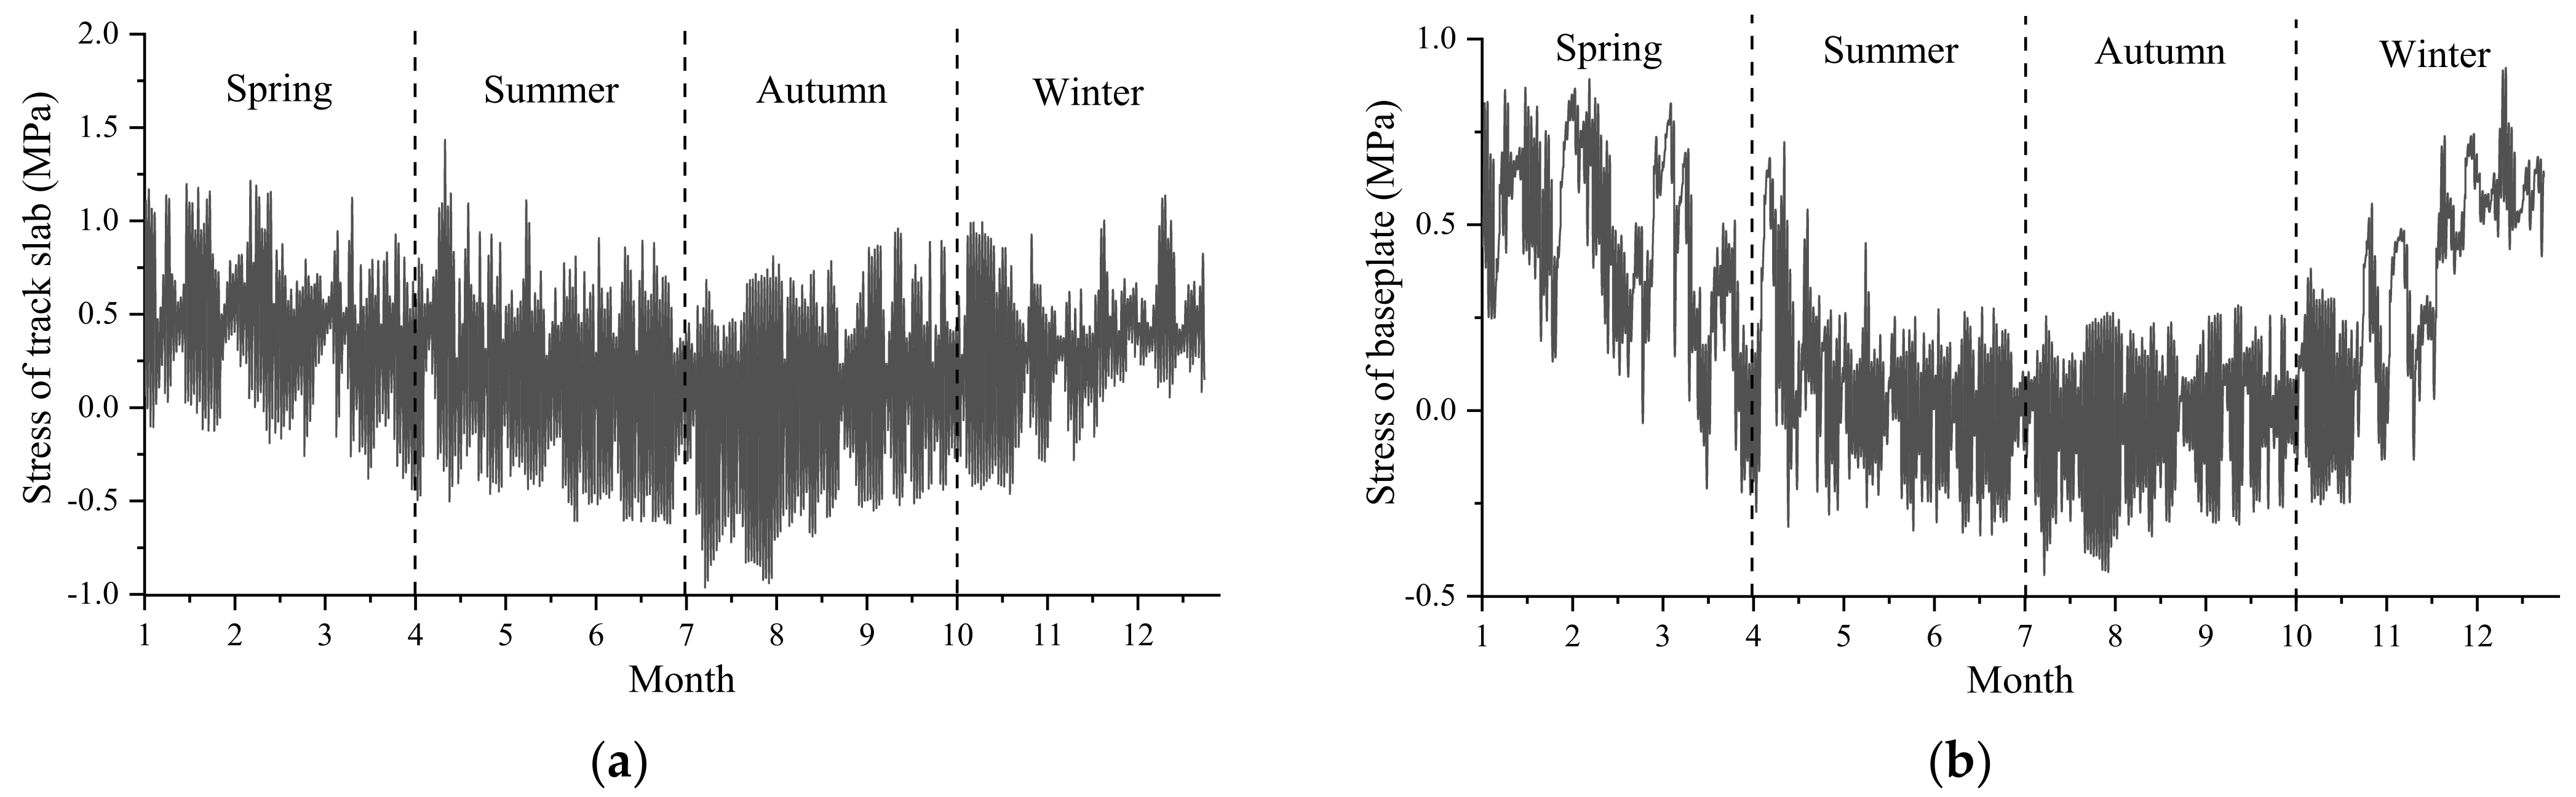
Based on the temperature conditions of Nanchang calculated in
Table 2, under the action of temperature gradient load, the annual stress of track slab and baseplate at the most unfavorable position is shown in
Figure 12.
It can be seen from
Figure 12 that due to the influence of temperature load, the track slab and baseplate are inclined to tensile stress in spring and winter, and to compressive stress in summer and autumn, and the temperature change of ballastless track will decrease with the increase of track structure depth. Therefore, for the ballastless track structure, the daily temperature gradient change of the track slab on the upper layer is greater than that of the baseplate on the lower layer, and the corresponding stress fluctuation amplitude and frequency of the track slab are also greater than that of the baseplate.
6. Discussion
In order to explore the nonlinear temperature load mode of ballastless track on bridge, a series of studies was carried out in this paper.
First, the long-term observation of the temperature field of the longitudinal slab ballastless track on bridge was carried out, a large number of measured data were obtained, and the seasonal variation characteristics of the temperature field of the ballastless track were preliminarily discussed through statistical analysis. The observation period is more than one year, which can fully reflect the impact of climate conditions, date and time on the temperature field of ballastless track, and provide data basis and verification conditions for subsequent simulation analysis.
Second, through theoretical derivation, it is found that the temperature gradient distribution of ballastless track is related to the longitude and latitude, date, time, ambient temperature, wind speed, atmospheric transparency coefficient and concrete surface absorption rate of the structure.
Third, the thermodynamic analysis model of ballast track on bridge was established based on the large-scale general finite element software ANSYS. The solar radiation, convective heat transfer and radiation heat transfer effects are transformed into radiation heat flux for loading calculation, and the accuracy was verified by the measured data. By calculating the temperature distribution of ballastless track in 33 cities, the effects of longitude, latitude and local climate on the vertical temperature gradient of ballastless track were studied. Based on a large number of thermodynamic simulation analyses, the positive (negative) temperature gradient of ballastless track was fitted in the form of a power function (quadratic function) plus a regional adjustment coefficient.
In summary, the nonlinear distribution law of temperature field of ballastless track on bridge was studied through the combination of field test, theoretical analysis and finite element numerical analysis. The thermodynamic analysis model fully considers the influence of geographical location and local climate conditions, which can accurately calculate the temperature field of ballastless track on bridge in any area and significantly improve the calculation efficiency. The proposed temperature load model overcomes the shortcomings of regional limitations in the existing research, and makes up for the lack of refinement of climate division and temperature load model in relevant specifications to a certain extent. It has strong engineering application value and can provide reference for ballastless track construction on bridges at home and abroad.
Furthermore, the three-dimensional temperature field of ballastless track and the temperature field distribution of ballastless track under extreme temperature conditions (such as continuous high temperature and cold wave) need to be further studied.
Author Contributions
Conceptualization, B.Y.; methodology, B.Y.; software, B.Y.; validation, B.Y., R.C. and H.X.; formal analysis, B.Y.; writing—original draft preparation, B.Y., R.C. and H.X.; writing—review and editing, R.C., H.X. and X.Z. All authors have read and agreed to the published version of the manuscript.
Funding
This research was funded by the National Key R&D Program of China (grant number 2017YFB1201204) and the Natural Science Foundation of Hunan Province (grant number 2017JJ3387).
Institutional Review Board Statement
Not applicable.
Informed Consent Statement
Not applicable.
Data Availability Statement
All data, models and code generated or used during the study appear in the submitted article.
Acknowledgments
The authors would like to thank the National Key R&D Program of China (Project No. 2017YFB1201204) and the Natural Science Foundation of Hunan Province (Project No. 2017JJ3387).
Conflicts of Interest
The authors declare no conflict of interest.
References
- Cui, X.; Du, B.; Xiao, H.; Zhou, R.; Guo, G.; Liu, H. Interface damage and arching mechanism of CRTS II slab track under temperature load. Constr. Build. Mater. 2021, 291, 123–258. [Google Scholar] [CrossRef]
- Li, Y.; Chen, J.; Wang, J.; Shi, X.; Chen, L. Study on the interface damage of CRTS Ⅱ slab track under temperature load. Structures 2020, 26, 224–236. [Google Scholar] [CrossRef]
- Huang, Y.; Gao, L.; Zhong, Y.; Zhou, C. Study on the damage evolution of the joint and the arching deformation of CRTS-II ballastless slab track under complex temperature loading. Constr. Build. Mater. 2021, 309, 125083. [Google Scholar] [CrossRef]
- Cai, X.; Luo, B.; Zhong, Y.; Zhang, Y.; Hou, B. Arching mechanism of the slab joints in CRTSII slab track under high temperature conditions. Eng. Fail. Anal. 2019, 98, 95–108. [Google Scholar] [CrossRef]
- Chen, Z.; Xiao, J.; Liu, X.; Qin, H.; Yang, R. Deformation behavior of slab warping for longitudinal continuous rigid slab under temperature effect. Adv. Struct. Eng. 2019, 22, 2823–2836. [Google Scholar] [CrossRef]
- Bridge Research Institute of Railway Bridge Authority. German Standard DS899/59: Special Procedures on Railway Shinkansen Bridge; Zhang, J., Ed.; Ministry of Railways Bridge Engineering Bureau: Beijing, China, 1991. (In Chinese) [Google Scholar]
- UIC, UIC 774-3 Track/Bridge Interaction. Recommendations for Calculations; International Union of Railways: Paris, France, 2001.
- Chinese National Standards, TB10015-2012; Code for Design of Railway Continuously Welded Rail. China Railway Publishing House: Beijing, China, 2013. (In Chinese)
- Lou, P.; Zhu, J.; Dai, G.; Yan, B. Experimental study on bridge–track system temperature actions for Chinese high-speed railway. Arch. Civ. Mech. Eng. 2018, 18, 451–464. [Google Scholar] [CrossRef]
- Liu, H.; Lu, H.; He, Y.; Li, Z. Neural Network Based Temperature Field Mapping Model for CRTS II Type Ballastless Track. IOP Conf. Ser. Mater. Sci. Eng. 2018, 435, 12042. [Google Scholar] [CrossRef]
- Zhao, L.; Zhou, L.; Zhang, G.; Wei, T.; Mahunon, A.D.; Jiang, L.; Zhang, Y. Experimental Study of the Temperature Distribution in CRTS-II Ballastless Tracks on a High-Speed Railway Bridge. Appl. Sci. 2020, 10, 1980. [Google Scholar] [CrossRef] [Green Version]
- Jiang, H.; Zhang, J.; Zhou, F.; Wang, Y. Optimization of PCM coating and its influence on the temperature field of CRTS II ballastless track slab. Constr. Build. Mater. 2020, 236, 117498. [Google Scholar] [CrossRef]
- Shi, T.; Zheng, J.; Deng, N.; Chen, Z.; Guo, X.; Wang, S. Temperature Load Parameters and Thermal Effects of a Long-Span Concrete-Filled Steel Tube Arch Bridge in Tibet. Adv. Mater. Sci. Eng. 2020, 2020, 9710613. [Google Scholar] [CrossRef] [Green Version]
- Xiao, F.; Hulsey, J.; Balasubramanian, R. Fiber optic health monitoring and temperature behavior of bridge in cold region. Struct. Control. Health Monit. 2017, 24, e2020. [Google Scholar] [CrossRef]
- Kell, B.; Liu, X. Influence of Solar Radiation on Bridge Structure; Liu, X., Translator; China Railway Publishing House: Beijing, China, 1981. [Google Scholar]
- Kennedy, J.; Soliman, M. Temperature distribution in composite bridges. J. Struct. Eng. 1987, 113, 475–482. [Google Scholar] [CrossRef]
- Branco, F.; Mendes, P. Thermal actions for concrete bridge design. J. Struct. Eng. 1993, 119, 2313–2331. [Google Scholar] [CrossRef]
- Ou, Z.; Sun, L.; Zhou, J.; Zhao, G. Probability Value of Temperature Loads for Ballastless Track Slab of High-Speed Railway: Axial Uniform Thermal Actions. J. China Railw. Soc. 2016, 38, 96–104. (In Chinese) [Google Scholar]
- Liu, X.; Li, J.; Kang, W.; Liu, X.; Yang, R. Simplified Calculation of Temperature in Concrete Slabs of Ballastless Track and Influence of Extreme Weather. J. Southwest Jiaotong Univ. 2017, 52, 1037–1045. (In Chinese) [Google Scholar]
- Kang, W.; Chen, S.; Wei, C.; Liu, X.; Li, J. Temperatures of Ballastless Track and Effect of Continuous Hot Weather. J. China Railw. Soc. 2019, 41, 127–134. (In Chinese) [Google Scholar]
- Xue, J.; Lin, J.; Briseghella, B.; Tabatabai, H.; Chen, B. Solar Radiation Parameters for Assessing Temperature Distributions on Bridge Cross-Sections. Appl. Sci. 2018, 8, 627. [Google Scholar] [CrossRef] [Green Version]
- Yang, R.; Li, J.; Kang, W.; Liu, X.; Cao, S. Temperature Characteristics Analysis of the Ballastless Track under Continuous Hot Weather. J. Transp. Eng. Part A Syst. 2017, 143, 04017048. [Google Scholar] [CrossRef]
- Mohan, K.; Sreemathy, J.; Saravanan, U. Numerical investigation into thermal load responses of steel railway bridge. IOP. Conf. Ser. Earth. Environ. Sci. 2017, 80, 012042. [Google Scholar] [CrossRef] [Green Version]
- Yan, B.; Liu, S.; Dai, G.; Pu, H. Vertical nonlinear temperature distribution and temperature mode of unballasted track in typical areas of China. J. Chin. Railw. Soc. 2016, 38, 81–86. [Google Scholar]
- Zeng, Z.; Huang, Z.; Yin, H.; Meng, X.; Wang, W.; Wang, J. Influence of track line environment on the temperature field of a double-block ballastless track slab. Adv. Mech. Eng. 2018, 10, 168781401881232. [Google Scholar] [CrossRef] [Green Version]
- Semendary, A.A.; Steinberg, E.P.; Walsh, K.K.; Barnard, E. Effects of Temperature Distributions on Thermally Induced Behavior of UHPC Shear Key Connections of an Adjacent Precast Prestressed Concrete Box Beam Bridge. J. Bridge Eng. 2018, 24, 4018115. [Google Scholar] [CrossRef]
- Gottsäter, E.; Ivanov, O.L.; Miklós, M.; Plos, M. Validation of Temperature Simulations in a Portal Frame Bridge. Structures 2018, 15, 341–348. [Google Scholar] [CrossRef]
- Song, L.; Liu, H.; Cui, C.; Yu, Z.; Li, Z. Thermal deformation and interfacial separation of a CRTS II slab ballastless track multilayer structure used in high-speed railways based on meteorological data. Constr. Build. Mater. 2020, 237, 117528. [Google Scholar] [CrossRef]
- Peng, Y. Studies on Theory of Solar Radiation Thermal Effects on Concrete Bridges with Application. Ph.D. Thesis, Southwest Jiaotong University, Sichuan, China, 2007. (In Chinese). [Google Scholar]
- Mirambell, E.; Aguado, A. Temperature and stress distributions in concrete box girder bridges. J. Struct. Eng. 1990, 116, 2388–2409. [Google Scholar] [CrossRef]
- Dai, G.; Zheng, P.; Yan, B.; Xiao, X. Longitudinal Force of CWR on Box Girder under Solar Radiation. J. Zhejiang Univ. 2013, 47, 609–614. (In Chinese) [Google Scholar]
| Publisher’s Note: MDPI stays neutral with regard to jurisdictional claims in published maps and institutional affiliations. |
© 2022 by the authors. Licensee MDPI, Basel, Switzerland. This article is an open access article distributed under the terms and conditions of the Creative Commons Attribution (CC BY) license (https://creativecommons.org/licenses/by/4.0/).


