PeptideWitch–A Software Package to Produce High-Stringency Proteomics Data Visualizations from Label-Free Shotgun Proteomics Data
Abstract
1. Introduction
2. Methods
2.1. Software Construction
2.2. Software Description
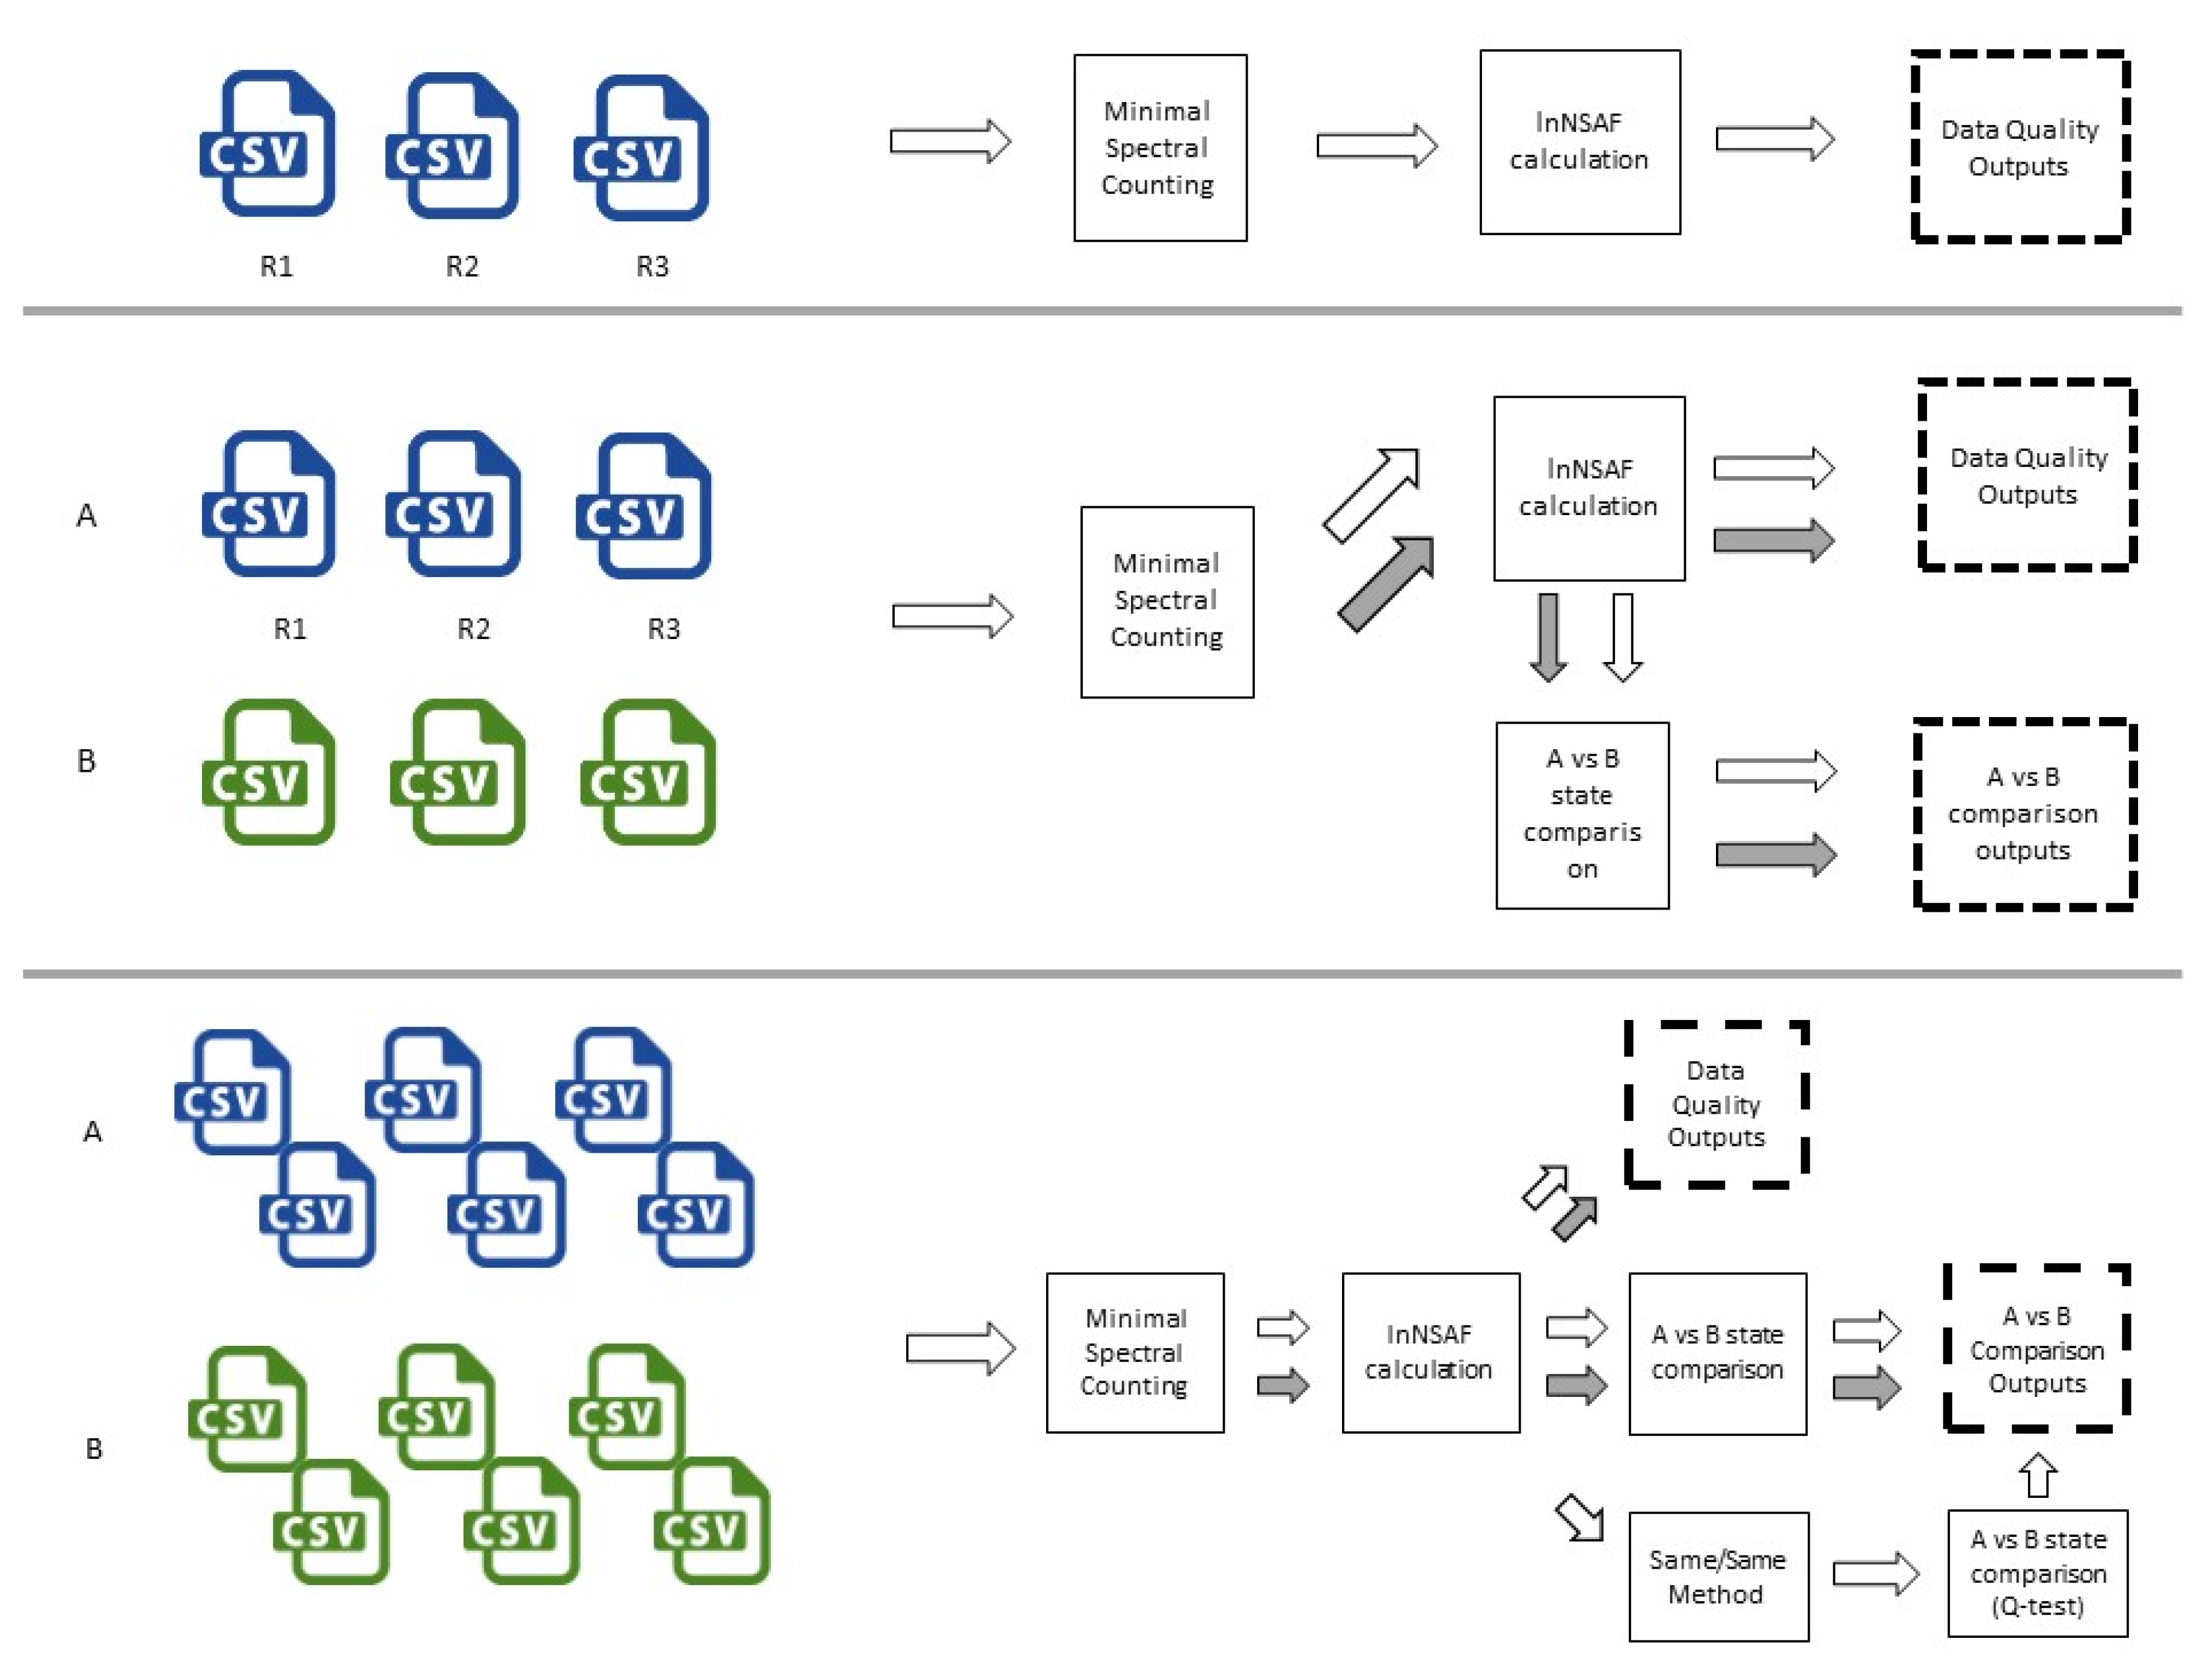
2.2.1. Data Quality Analysis
2.2.2. Control vs. Treatment Comparison Data
2.2.3. Same/Same Analysis Processing and Outputs
3. Results
3.1. Selected Examples of the Graphical Visualisation Data Outputs
3.1.1. Venn Diagrams
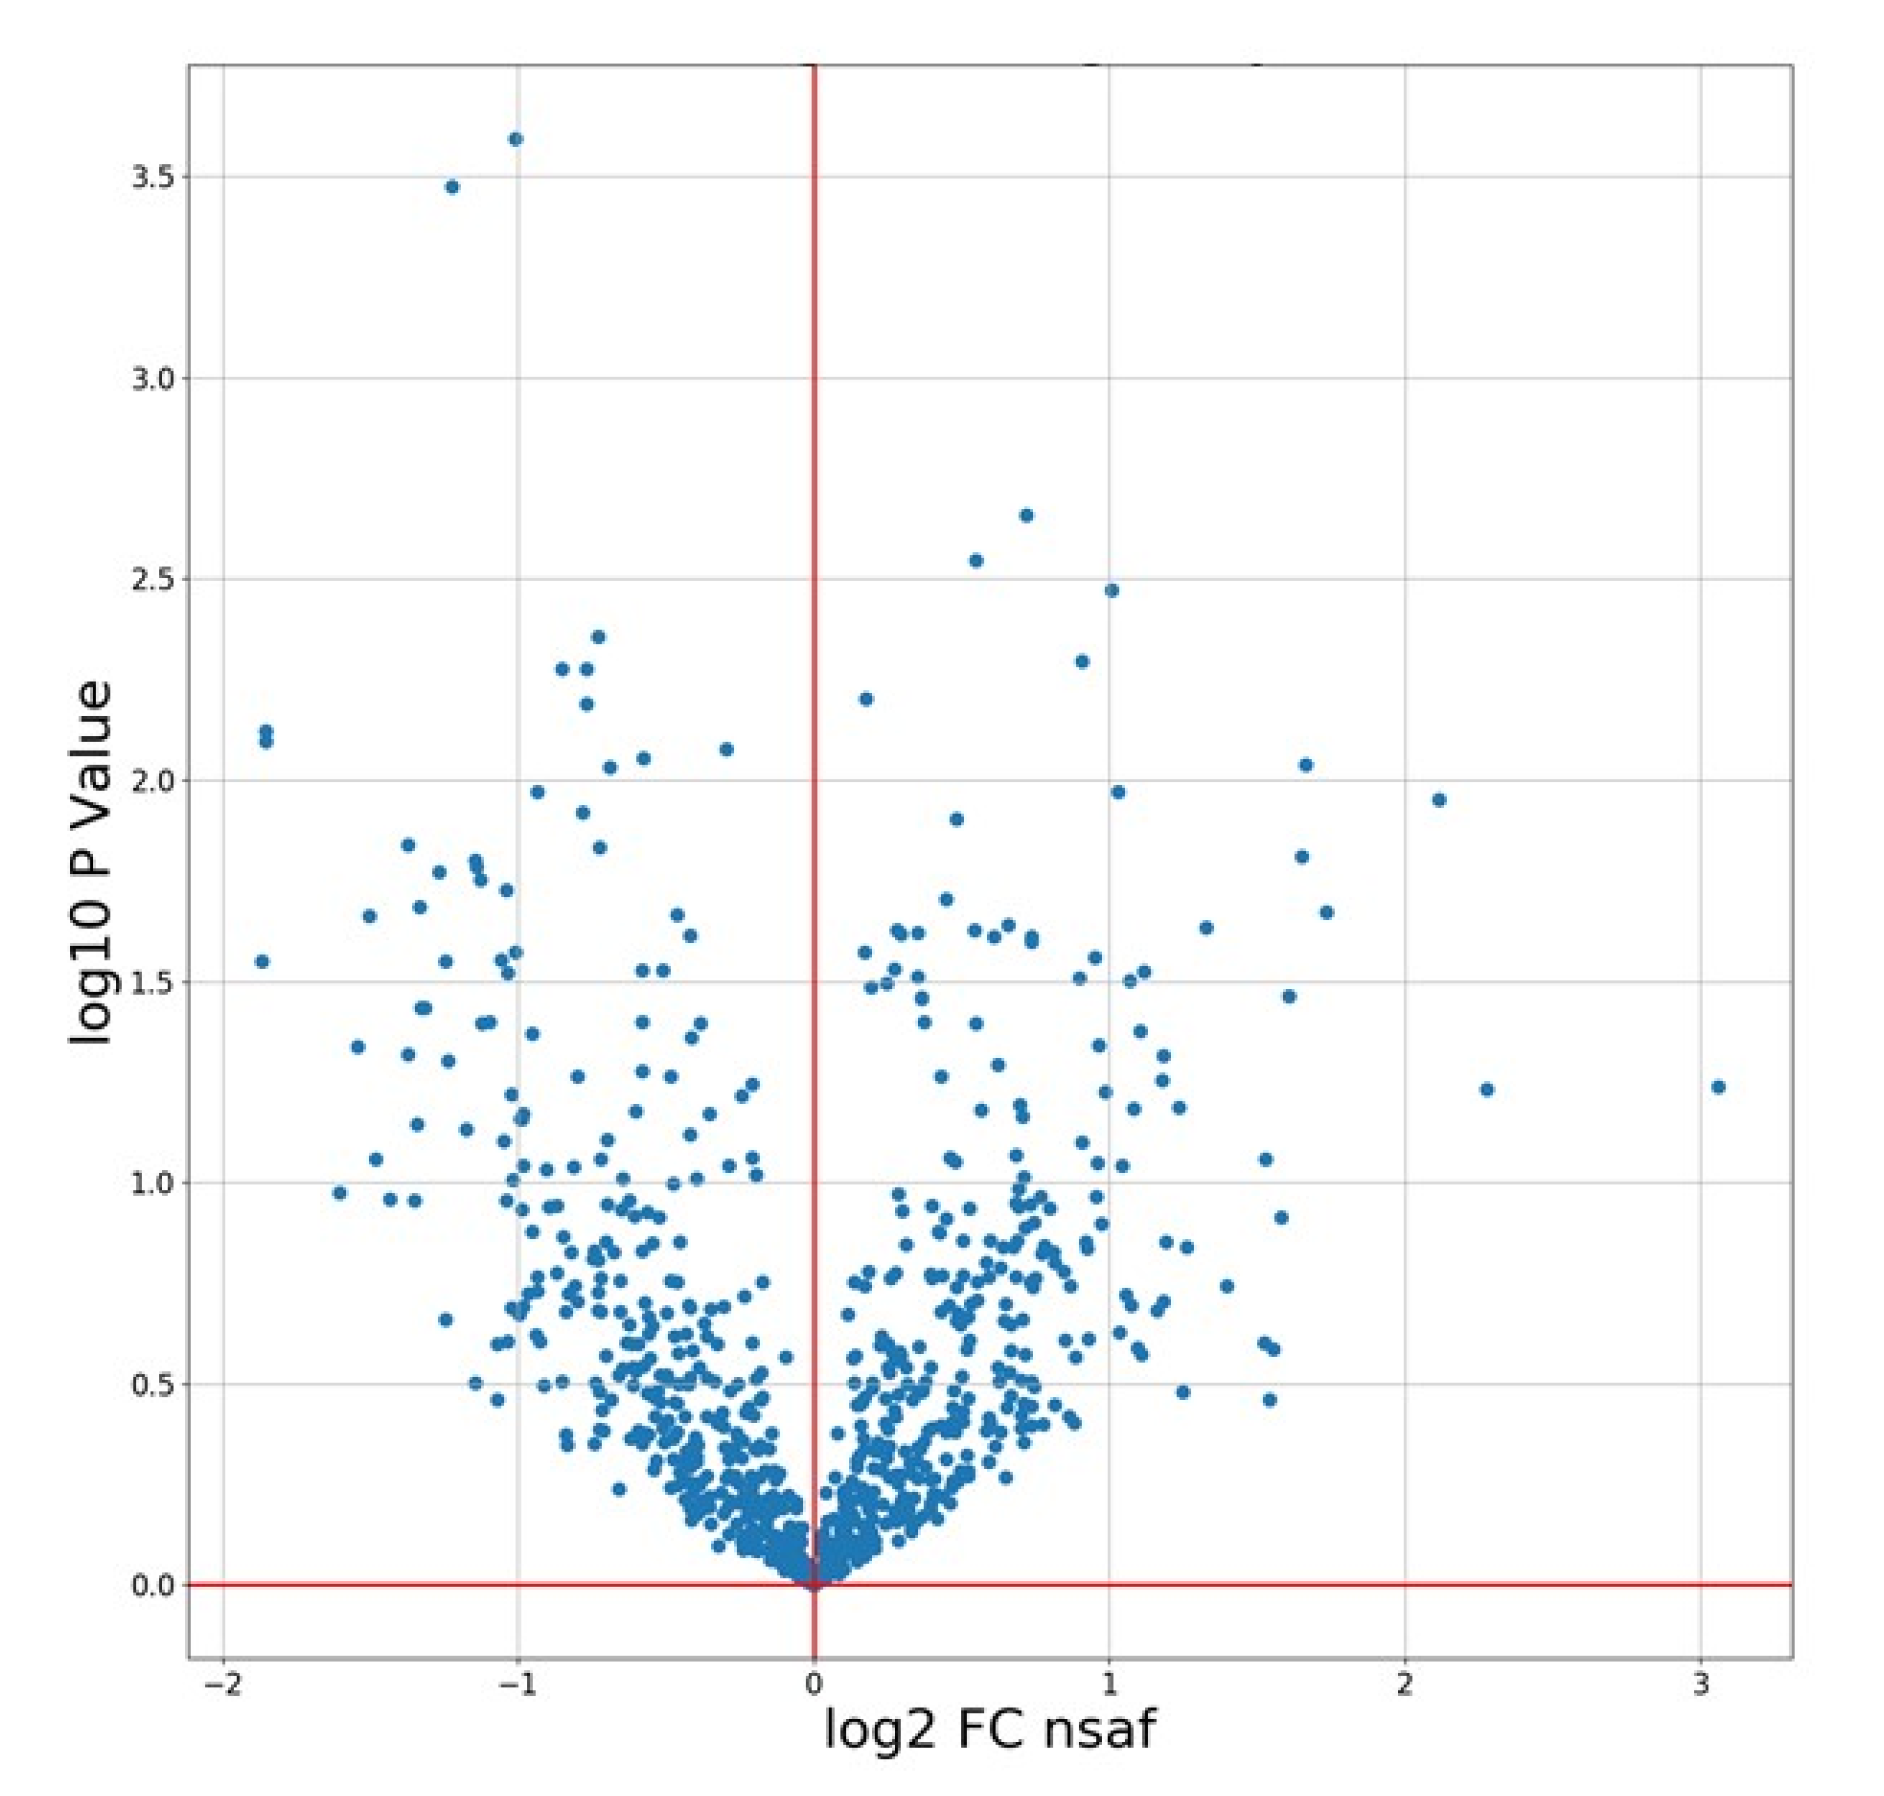
3.1.2. Volcano Plots
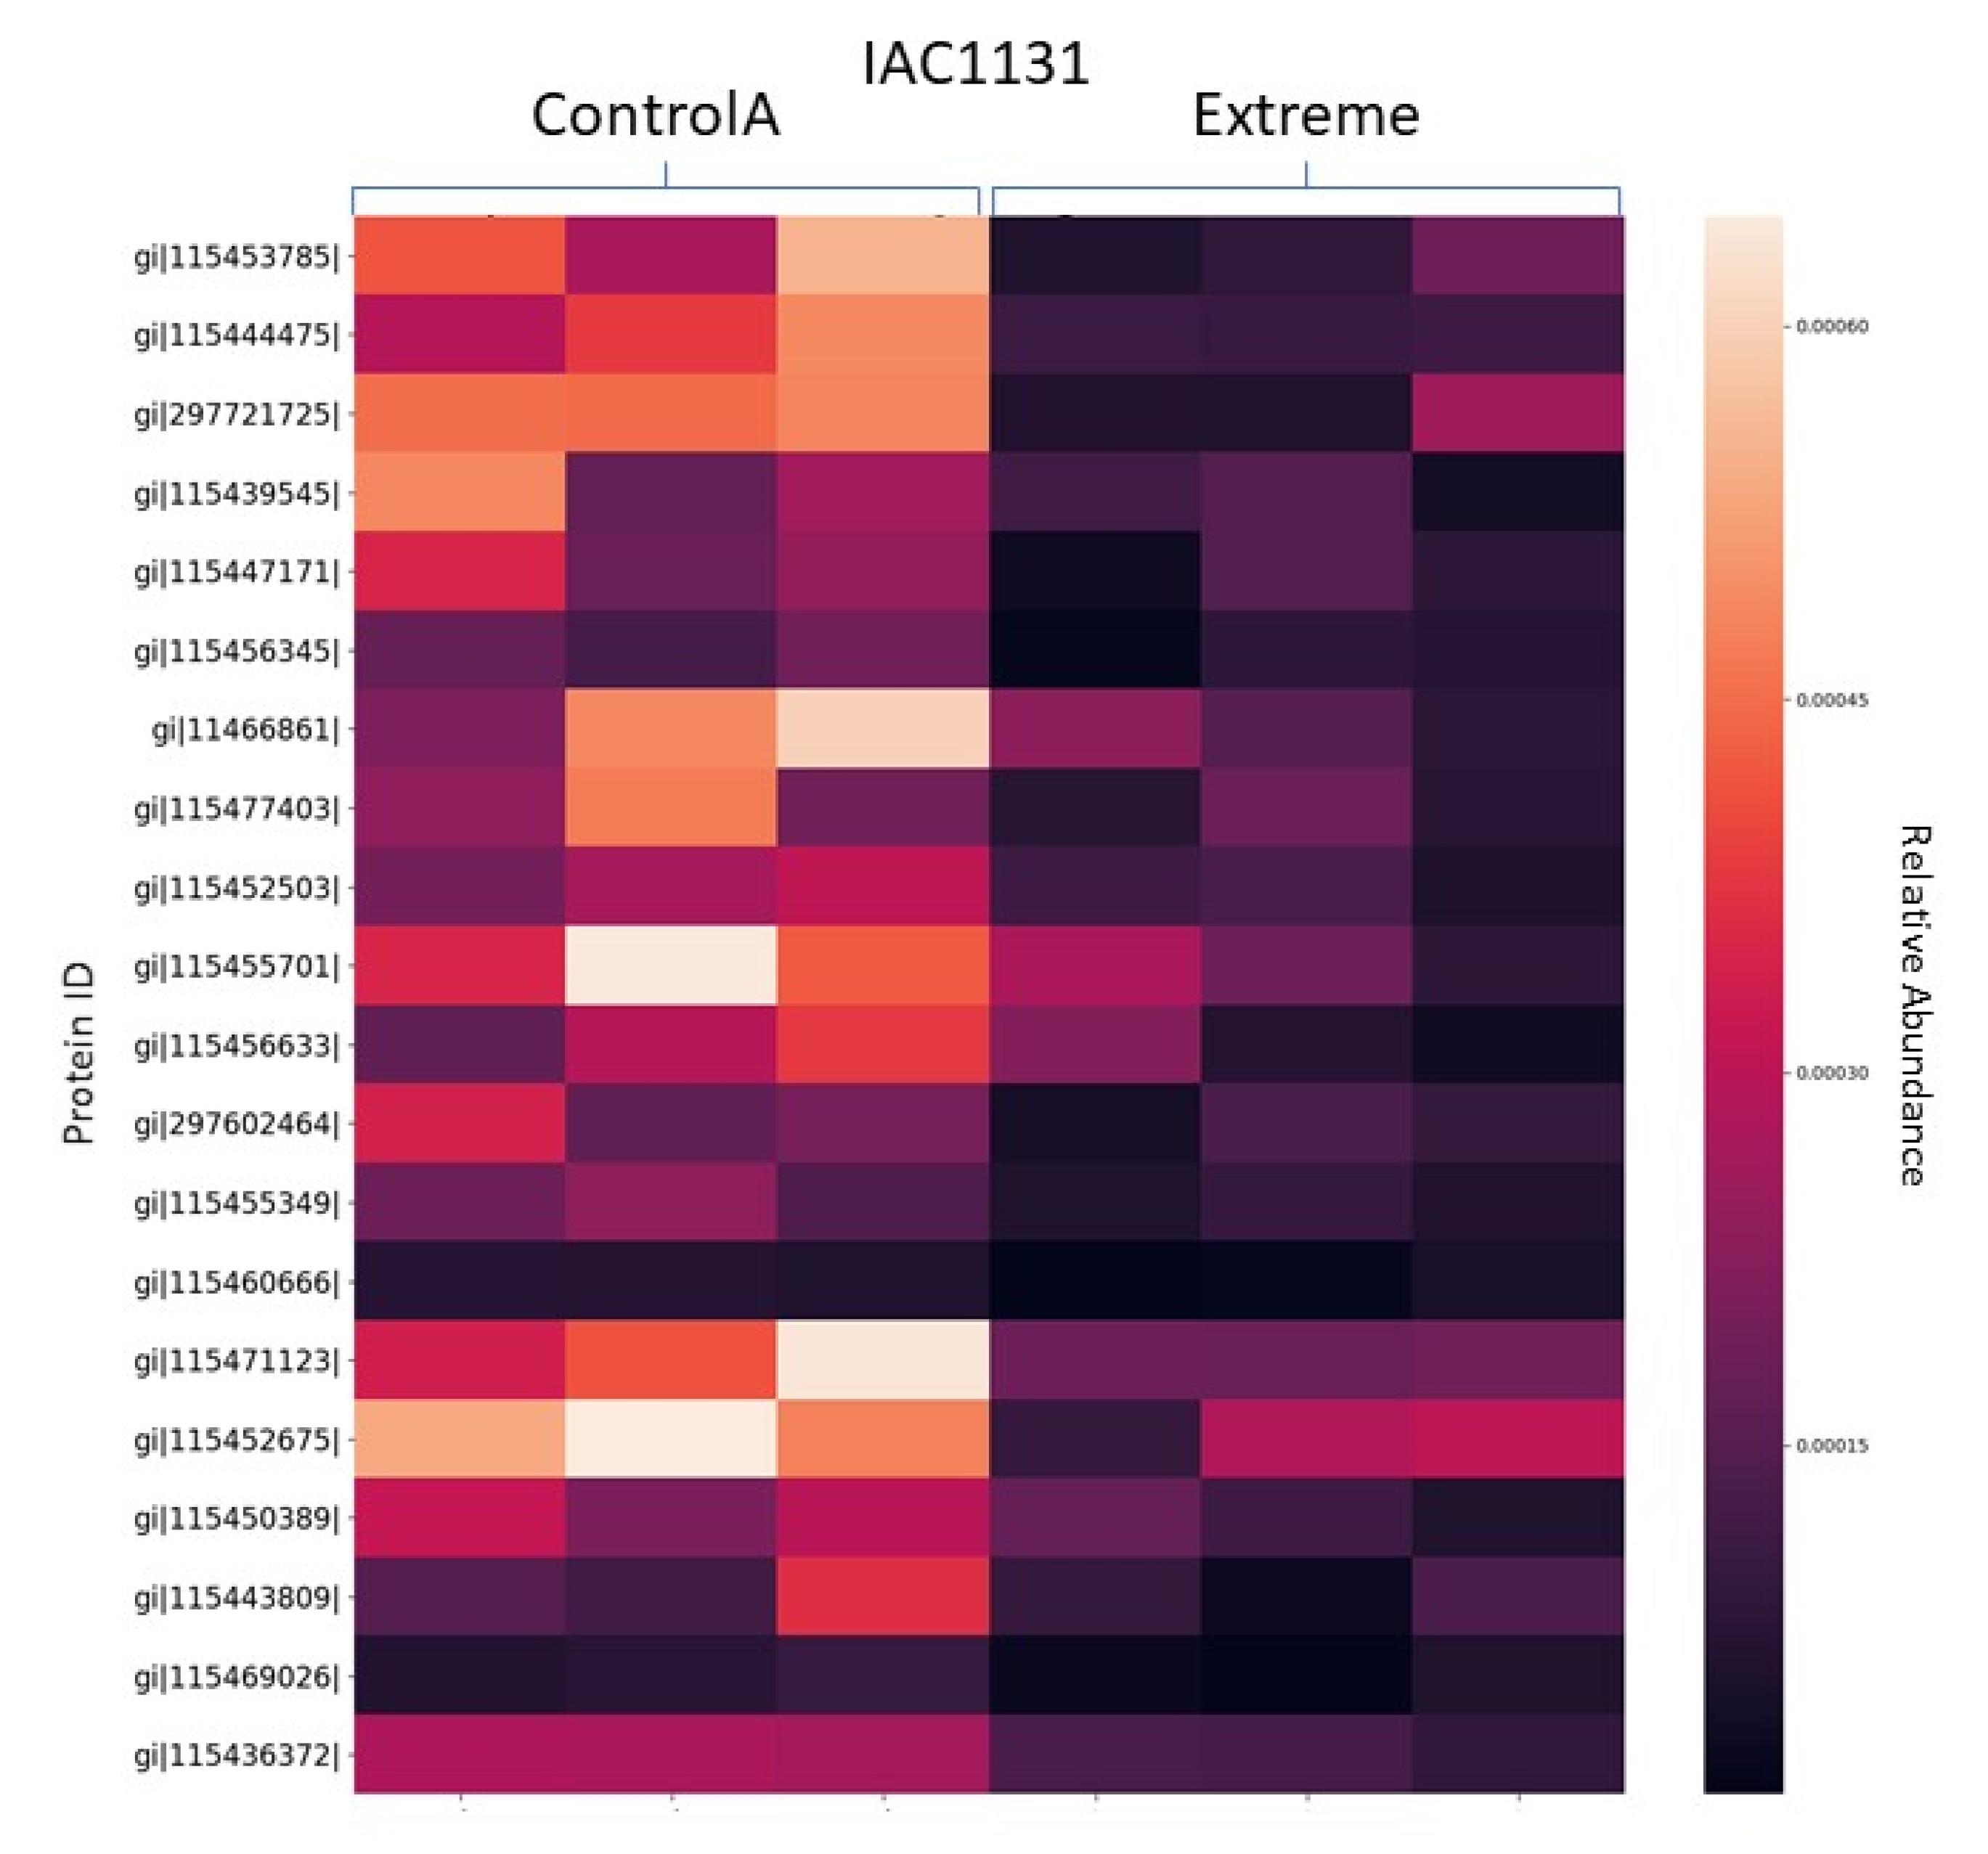
3.1.3. Heat Maps
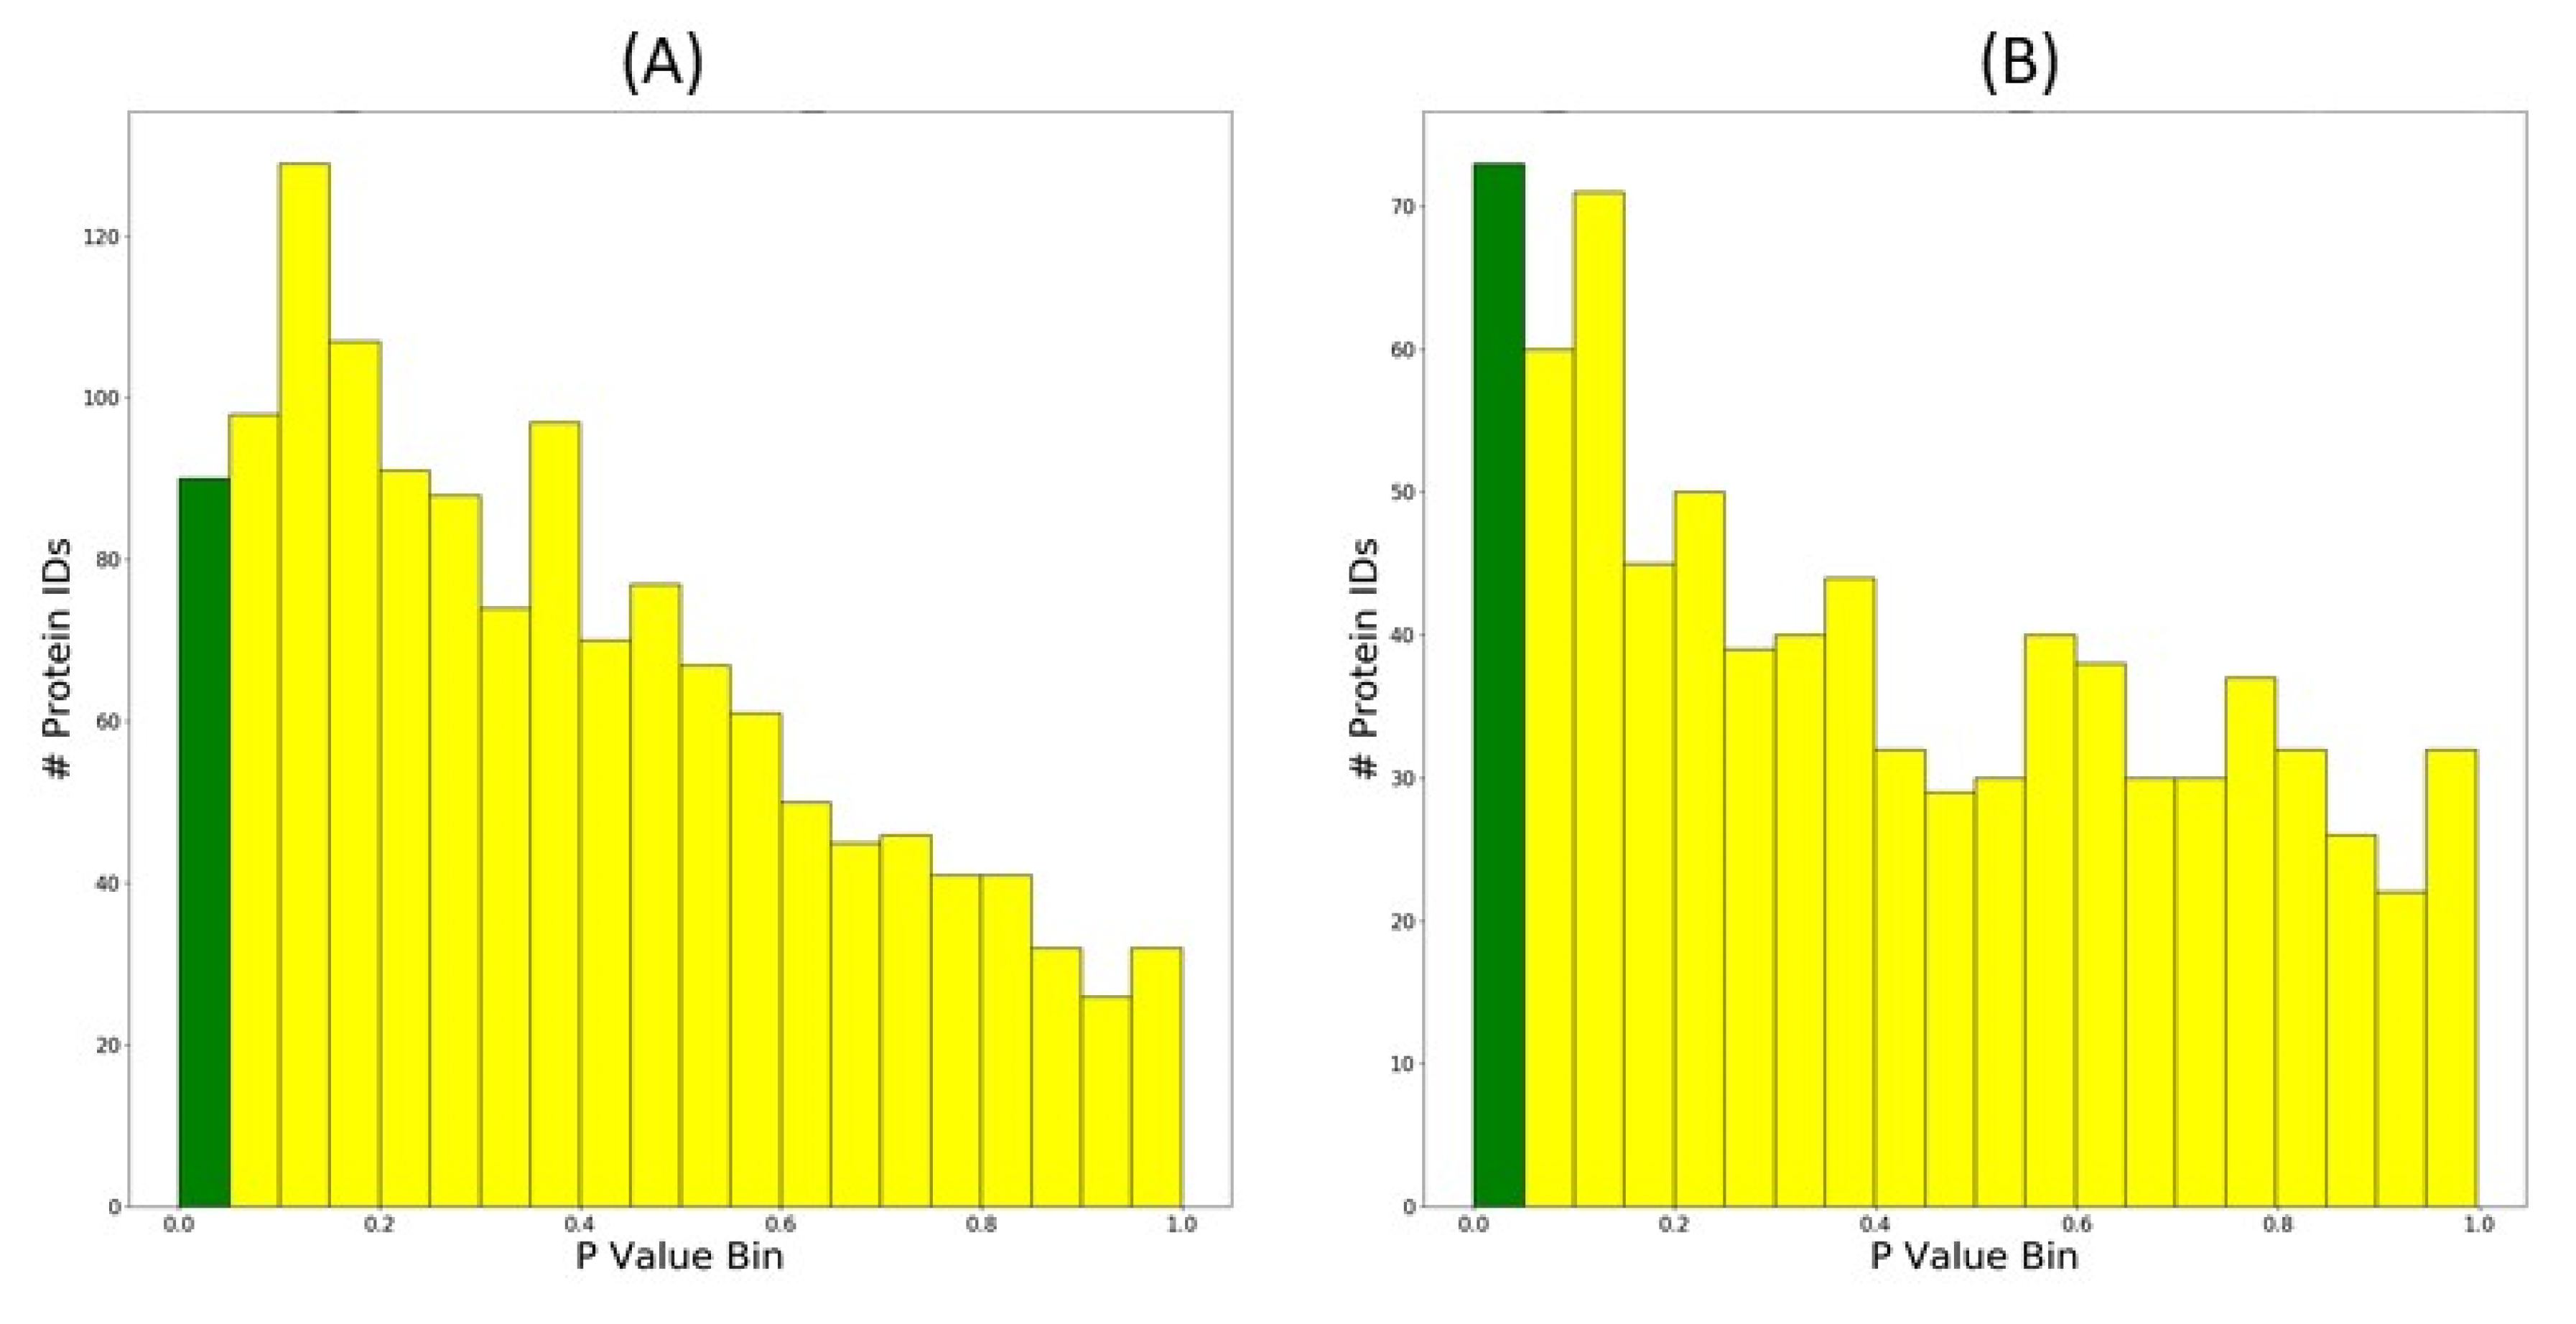
3.1.4. Histograms of p-Value Distributions
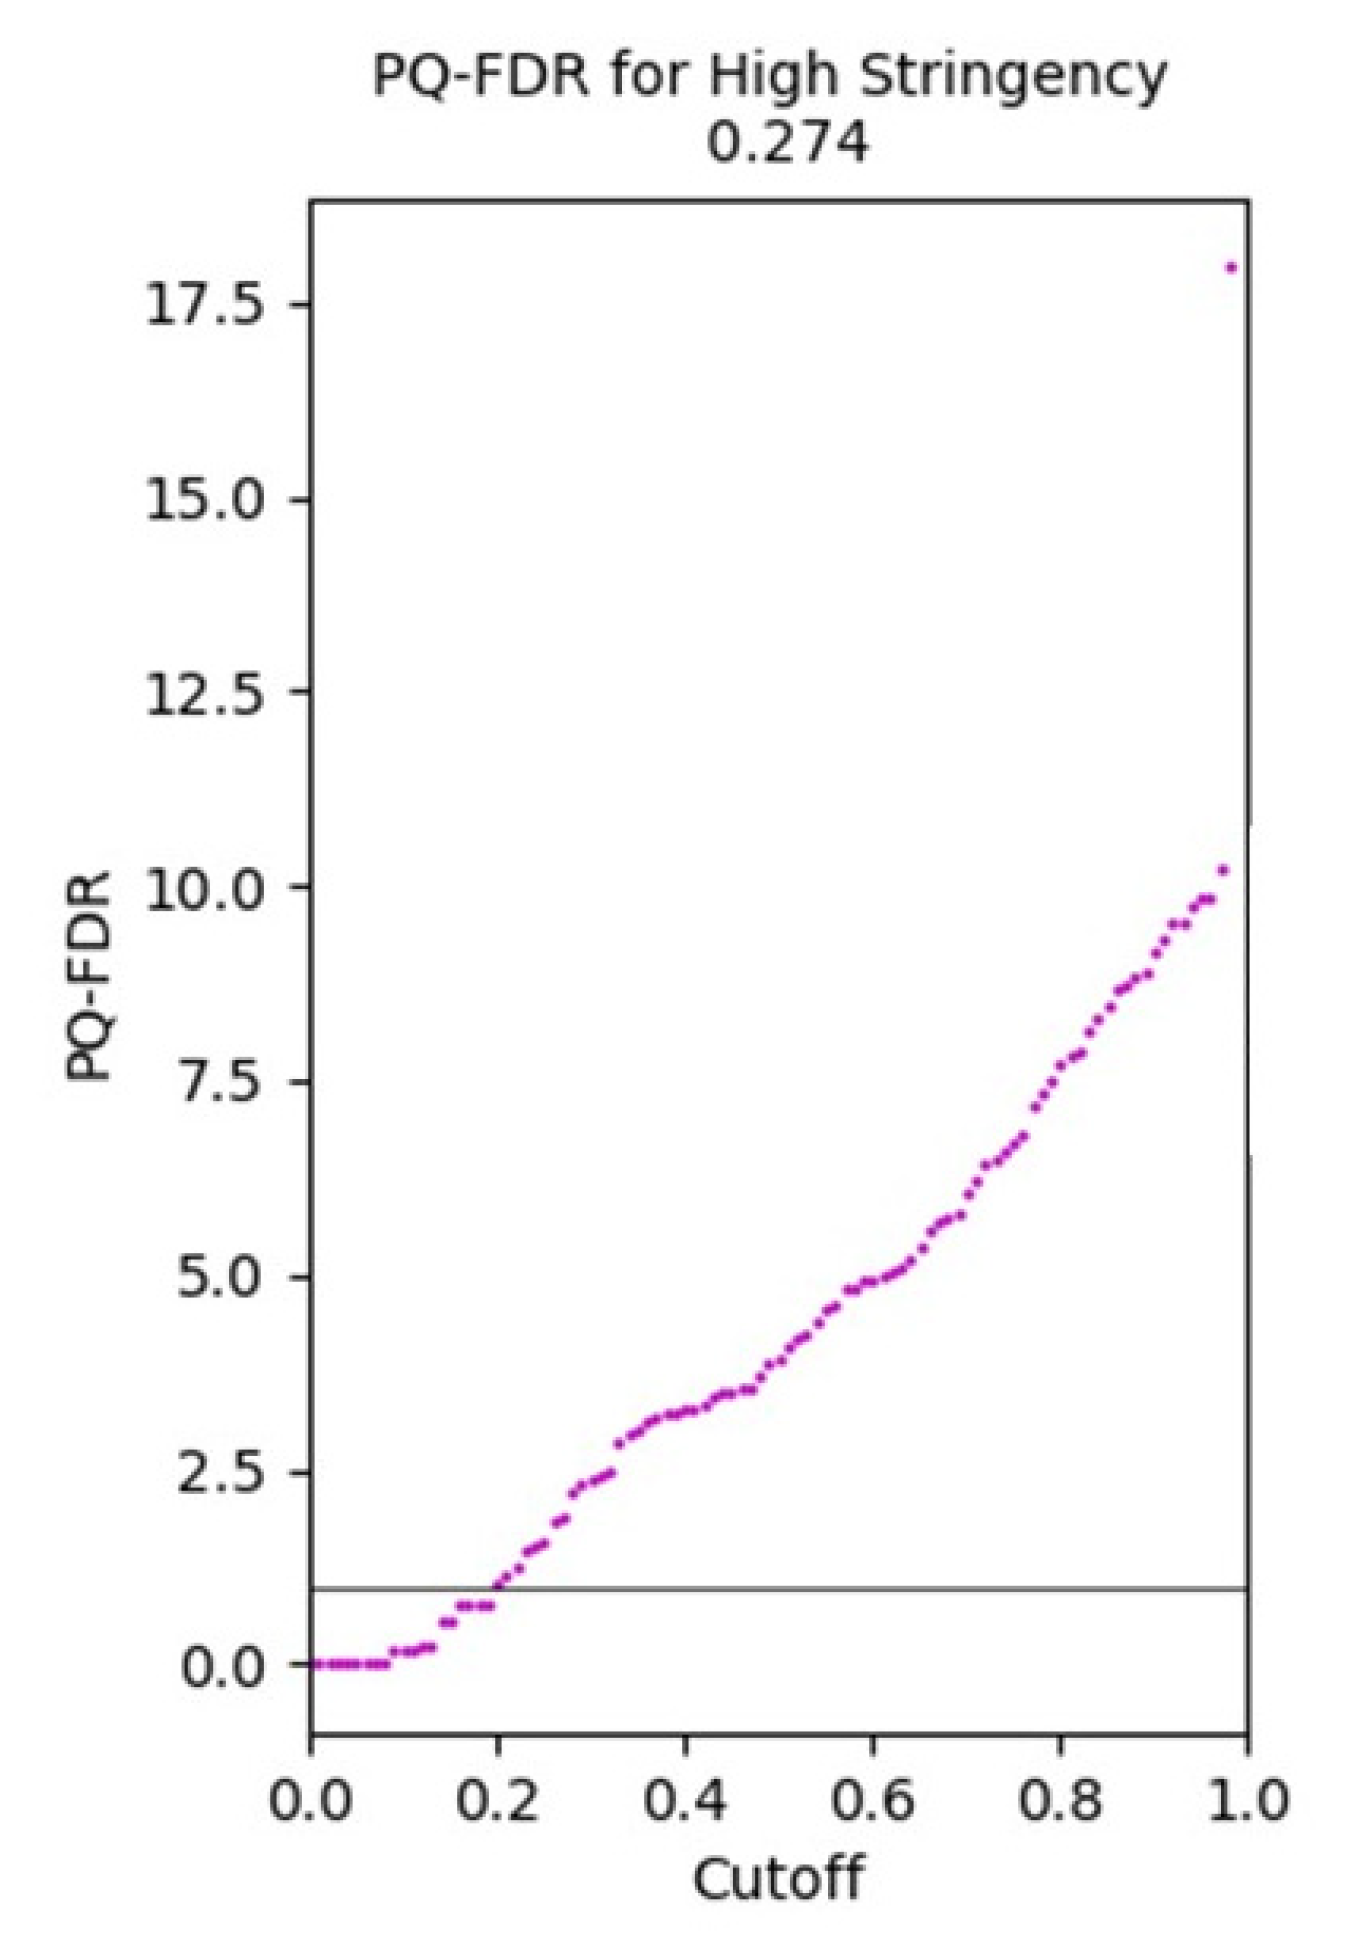
3.1.5. Protein Quantitation-False Discovery Rate Plot
4. Discussion
5. Conclusions
Author Contributions
Funding
Acknowledgments
Conflicts of Interest
Abbreviations
| AUC | Area Under the Curve |
| BH | Benjamini-Hochberg |
| FDR | False Discovery Rate |
| GPM | Global Proteome Machine |
| MSC | Minimum Spectral Counting |
| NSAF | Normalized Spectral Abundance Factors |
| PQ-FDR | Protein Quantitation-False Discovery Rate |
| SpC | Spectral Count |
References
- Lundgren, D.H.; Hwang, S.-I.; Wu, L.; Han, D. Role of spectral counting in quantitative proteomics. Expert Rev. Proteomics 2010, 7, 39–53. [Google Scholar] [CrossRef] [PubMed]
- Choi, M.; Eren-Dogu, Z.F.; Colangelo, C.; Cottrell, J.; Hoopmann, M.R.; Kapp, E.A.; Kim, S.; Lam, H.; Neubert, T.A.; Palmblad, M. ABRF Proteome Informatics Research Group (iPRG) 2015 study: Detection of differentially abundant proteins in label-free quantitative LC-MS/MS experiments. J. Proteome Res. 2017, 16, 945–957. [Google Scholar] [CrossRef] [PubMed]
- Dowle, A.A.; Wilson, J.; Thomas, J.R. Comparing the diagnostic classification accuracy of iTRAQ, peak-area, spectral-counting, and emPAI methods for relative quantification in expression proteomics. J. Proteome Res. 2016, 15, 3550–3562. [Google Scholar] [CrossRef]
- Old, W.M.; Meyer-Arendt, K.; Aveline-Wolf, L.; Pierce, K.G.; Mendoza, A.; Sevinsky, J.R.; Resing, K.A.; Ahn, N.G. Comparison of label-free methods for quantifying human proteins by shotgun proteomics. Mol. Cell. Proteomics 2005, 4, 1487–1502. [Google Scholar] [CrossRef] [PubMed]
- Paoletti, A.C.; Parmely, T.J.; Tomomori-Sato, C.; Sato, S.; Zhu, D.; Conaway, R.C.; Conaway, J.W.; Florens, L.; Washburn, M.P. Quantitative proteomic analysis of distinct mammalian mediator complexes using normalized spectral abundance factors. Proc. Natl. Acad. Sci. USA 2006, 103, 18928–18933. [Google Scholar] [CrossRef]
- Zybailov, B.; Mosley, A.L.; Sardiu, M.E.; Coleman, M.K.; Florens, L.; Washburn, M.P. Statistical analysis of membrane proteome expression changes in Saccharomyces cerevisiae. J. Proteome Res. 2006, 5, 2339–2347. [Google Scholar] [CrossRef]
- Neilson, K.A.; Keighley, T.; Pascovici, D.; Cooke, B.; Haynes, P.A. Label-Free Quantitative Shotgun Proteomics Using Normalized Spectral Abundance Factors. In Proteomics for Biomarker Discovery. Methods in Molecular Biology (Methods and Protocols); Zhou, M., Veenstra, T., Eds.; Humana Press: Totowa, NJ, USA, 2013. [Google Scholar] [CrossRef]
- Neilson, K.A.; Ali, N.A.; Muralidharan, S.; Mirzaei, M.; Mariani, M.; Assadourian, G.; Lee, A.; Van Sluyter, S.C.; Haynes, P.A. Less label, more free: Approaches in label-free quantitative mass spectrometry. Proteomics 2011, 11, 535–553. [Google Scholar] [CrossRef]
- George, I.S.; Fennell, A.Y.; Haynes, P.A. Shotgun proteomic analysis of photoperiod regulated dormancy induction in grapevine. J. Proteomics 2018, 187, 13–24. [Google Scholar] [CrossRef]
- George, I.S.; Fennell, A.Y.; Haynes, P.A. Protein identification and quantification from riverbank grape, Vitis riparia: Comparing SDS-PAGE and FASP-GPF techniques for shotgun proteomic analysis. Proteomics 2015, 15, 3061–3065. [Google Scholar] [CrossRef]
- Wu, Y.; Mirzaei, M.; Pascovici, D.; Chick, J.M.; Atwell, B.J.; Haynes, P.A. Quantitative proteomic analysis of two different rice varieties reveals that drought tolerance is correlated with reduced abundance of photosynthetic machinery and increased abundance of ClpD1 protease. J. Proteomics 2016, 143, 73–82. [Google Scholar] [CrossRef]
- Vaibhav, V.; Thompson, E.L.; Raftos, D.A.; Haynes, P.A. Potential protein biomarkers of QX disease resistance in selectively bred Sydney Rock Oysters. Aquaculture 2018, 495, 144–152. [Google Scholar] [CrossRef]
- Muralidharan, S.; Thompson, E.; Raftos, D.; Birch, G.; Haynes, P.A. Quantitative proteomics of heavy metal stress responses in Sydney rock oysters. J. Proteomics 2012, 12, 906–921. [Google Scholar] [CrossRef] [PubMed]
- Mirzaei, M.; Pascovici, D.; Atwell, B.J.; Haynes, P.A. Differential regulation of aquaporins, small GTP ases and V-ATP ases proteins in rice leaves subjected to drought stress and recovery. Proteomics 2012, 12, 864–877. [Google Scholar] [CrossRef] [PubMed]
- Emery, S.J.; Lacey, E.; Haynes, P.A. Quantitative proteomic analysis of Giardia duodenalis Assemblage A: A baseline for host, assemblage, and isolate variation. Proteomics 2015, 15, 2281–2285. [Google Scholar] [CrossRef] [PubMed]
- Emery, S.J.; Lacey, E.; Haynes, P.A. Data from a proteomic baseline study of Assemblage A in Giardia duodenalis. Data Brief 2015, 5, 23–27. [Google Scholar] [CrossRef] [PubMed][Green Version]
- Emery, S.J.; Pascovi, D.; Lacey, E.; Haynes, P.A. The generation gap: Proteome changes and strain variation during encystation in Giardia duodenalis. Mol. Biochem. Parasitol. 2015, 201, 47–56. [Google Scholar] [CrossRef] [PubMed]
- Emery, S.J.; van Sluyter, S.; Haynes, P.A. Proteomic analysis in Giardia duodenalis yields insights into strain virulence and antigenic variation. Proteomics 2014, 14, 2523–2534. [Google Scholar] [CrossRef]
- Taleahmad, S.; Mirzaei, M.; Parker, L.M.; Hassani, S.-N.; Mollamohammadi, S.; Sharifi-Zarchi, A.; Haynes, P.A.; Baharvand, H.; Salekdeh, G.H. Proteome analysis of ground state pluripotency. Sci. Rep. 2015, 5, 17985. [Google Scholar] [CrossRef]
- Francis, H.M.; Mirzaei, M.; Pardey, M.C.; Haynes, P.A.; Cornish, J.L. Proteomic analysis of the dorsal and ventral hippocampus of rats maintained on a high fat and refined sugar diet. Proteomics 2013, 13, 3076–3091. [Google Scholar] [CrossRef]
- Franklin, J.L.; Mirzaei, M.; Wearne, T.A.; Sauer, M.K.; Homewood, J.; Goodchild, A.K.; Haynes, P.A.; Cornish, J.L. Quantitative shotgun proteomics reveals extensive changes to the proteome of the orbitofrontal cortex in rats that are hyperactive following withdrawal from a high sugar diet. Proteomics 2016, 16, 657–673. [Google Scholar] [CrossRef]
- Handler, D.C.L.; Haynes, P.A. An experimentally-derived measure of inter-replicate variation in reference samples: The same-same permutation methodology. bioRxiv. 2019. [Google Scholar] [CrossRef]
- Bender, R.; Lange, S. Adjusting for multiple testing–when and how? J. Clin. Epidemiol. 2001, 54, 343–349. [Google Scholar] [CrossRef]
- Benjamini, Y.; Hochberg, Y. Controlling the false discovery rate: A practical and powerful approach to multiple testing. J. R. Stat. Soc. Series B 1995, 57, 289–300. [Google Scholar] [CrossRef]
- Storey, J.D.; Tibshirani, R. Statistical significance for genomewide studies. Proc. Natl. Acad. Sci. USA 2003, 100, 9440–9445. [Google Scholar] [CrossRef] [PubMed]
- Bitbucket. Available online: www.bitbucket.com/peptidewitch/peptidewitch (accessed on 21 August 2020).
- Craig, R.; Beavis, R.C. TANDEM: Matching proteins with tandem mass spectra. Bioinformatics 2004, 20, 1466–1467. [Google Scholar] [CrossRef]
- Solntsev, S.K.; Shortreed, M.R.; Frey, B.L.; Smith, L.M. Enhanced global post-translational modification discovery with MetaMorpheus. J. Proteome Res. 2018, 17, 1844–1851. [Google Scholar] [CrossRef]
- Locard-Paulet, M.; Bouyssie, D.; Froment, C.; Burlet-Schiltz, O.; Jensen, L.J. Comparing 22 popular phosphor proteomics pipelines for peptide identification and site localization. J. Proteome Res. 2020, 19, 1338–1345. [Google Scholar] [CrossRef]
- Pascovici, D.; Handler, D.C.; Wu, J.X.; Haynes, P.A. Multiple testing corrections in quantitative proteomics: A useful but blunt tool. Proteomics 2016, 16, 2448–2453. [Google Scholar] [CrossRef]
- Shah, A.D.; Goode, R.J.A.; Huang, C.; Powell, D.R.; Schittenhelm, R.B. LFQ-analyst: An Easy-to-use interactive web platform to analyze and visualize label-free proteomics data preprocessed with MaxQuant. J. Proteome Res. 2020, 19, 204–211. [Google Scholar] [CrossRef]
- Chang, C.; Xu, K.; Guo, C.; Wang, J.; Yan, Q.; Zhang, J.; He, F.; Zhu, Y. PANDA-view: An easy-to-use tool for statistical analysis and visualization of quantitative proteomics data. Bioinformatics 2018, 34, 3594–3596. [Google Scholar] [CrossRef]
- Lee, H.Y.; Kim, E.G.; Jung, H.R.; Jung, J.W.; Kim, H.B.; Cho, J.W.; Kim, K.M.; Yi, E.C. Refinements of LC-MS/MS spectral counting statistics improve quantification of low abundance proteins. Sci. Rep. 2019, 9, 13653. [Google Scholar] [CrossRef] [PubMed]
- Zhang, Y.; Wen, Z.; Washburn, M.P.; Florens, L. Improving label-free quantitative proteomics strategies by distributing shared peptides and stabilizing variance. Anal. Chem. 2015, 87, 4749–4756. [Google Scholar] [CrossRef] [PubMed]

| Number of States | Two + States Upload | Single State Upload | ||
|---|---|---|---|---|
| Number of Replicates | <6 Replicates | 6 Replicates | <6 Replicates | 6 Replicates |
| Upregulated Protein ID csv files | ✅ | ✅ | ||
| Downregulated Protein ID csv files | ✅ | ✅ | ||
| Unchanged Protein ID csv files | ✅ | ✅ | ||
| Unique Protein ID csv files | ✅ | ✅ | ||
| Venn Diagrams | ✅ | ✅ | ||
| Volcano Plots | ✅ | ✅ | ||
| Top 20 Heatmap | ✅ | ✅ | ||
| p-value Histograms | ✅ | ✅ | ||
| Inter-state PCAs of lnNSAF and SpC | ✅ | ✅ | ||
| Same-Same combinatorial PCAs | ✅ | ✅ | ||
| PQ-FDR plot | ✅ | ✅ | ||
| List of All Protein IDs | ✅ | ✅ | ✅ | ✅ |
| List of High Stringency protein IDs | ✅ | ✅ | ✅ | ✅ |
© 2020 by the authors. Licensee MDPI, Basel, Switzerland. This article is an open access article distributed under the terms and conditions of the Creative Commons Attribution (CC BY) license (http://creativecommons.org/licenses/by/4.0/).
Share and Cite
Handler, D.C.L.; Cheng, F.; Shathili, A.M.; Haynes, P.A. PeptideWitch–A Software Package to Produce High-Stringency Proteomics Data Visualizations from Label-Free Shotgun Proteomics Data. Proteomes 2020, 8, 21. https://doi.org/10.3390/proteomes8030021
Handler DCL, Cheng F, Shathili AM, Haynes PA. PeptideWitch–A Software Package to Produce High-Stringency Proteomics Data Visualizations from Label-Free Shotgun Proteomics Data. Proteomes. 2020; 8(3):21. https://doi.org/10.3390/proteomes8030021
Chicago/Turabian StyleHandler, David C. L., Flora Cheng, Abdulrahman M. Shathili, and Paul A. Haynes. 2020. "PeptideWitch–A Software Package to Produce High-Stringency Proteomics Data Visualizations from Label-Free Shotgun Proteomics Data" Proteomes 8, no. 3: 21. https://doi.org/10.3390/proteomes8030021
APA StyleHandler, D. C. L., Cheng, F., Shathili, A. M., & Haynes, P. A. (2020). PeptideWitch–A Software Package to Produce High-Stringency Proteomics Data Visualizations from Label-Free Shotgun Proteomics Data. Proteomes, 8(3), 21. https://doi.org/10.3390/proteomes8030021


