
A Proof of Concept to Bridge the Gap between Mass Spectrometry Imaging, Protein Identification and Relative Quantitation: MSI~LC-MS/MS-LF

 , and
, and
Abstract
:
1. Introduction
2. Materials and Methods
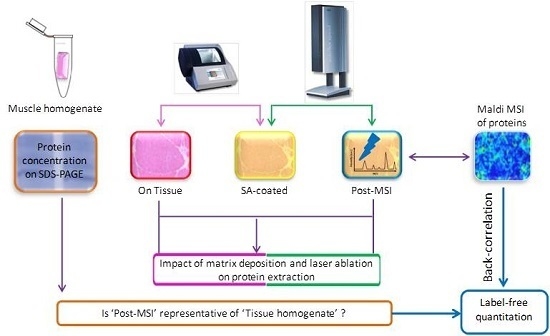
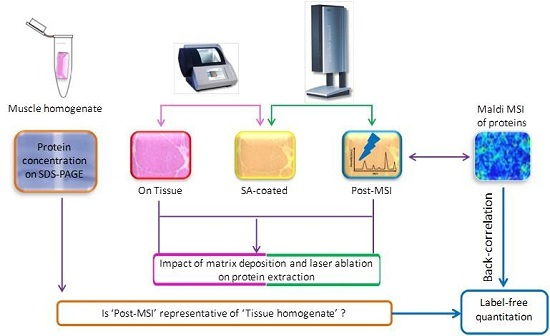
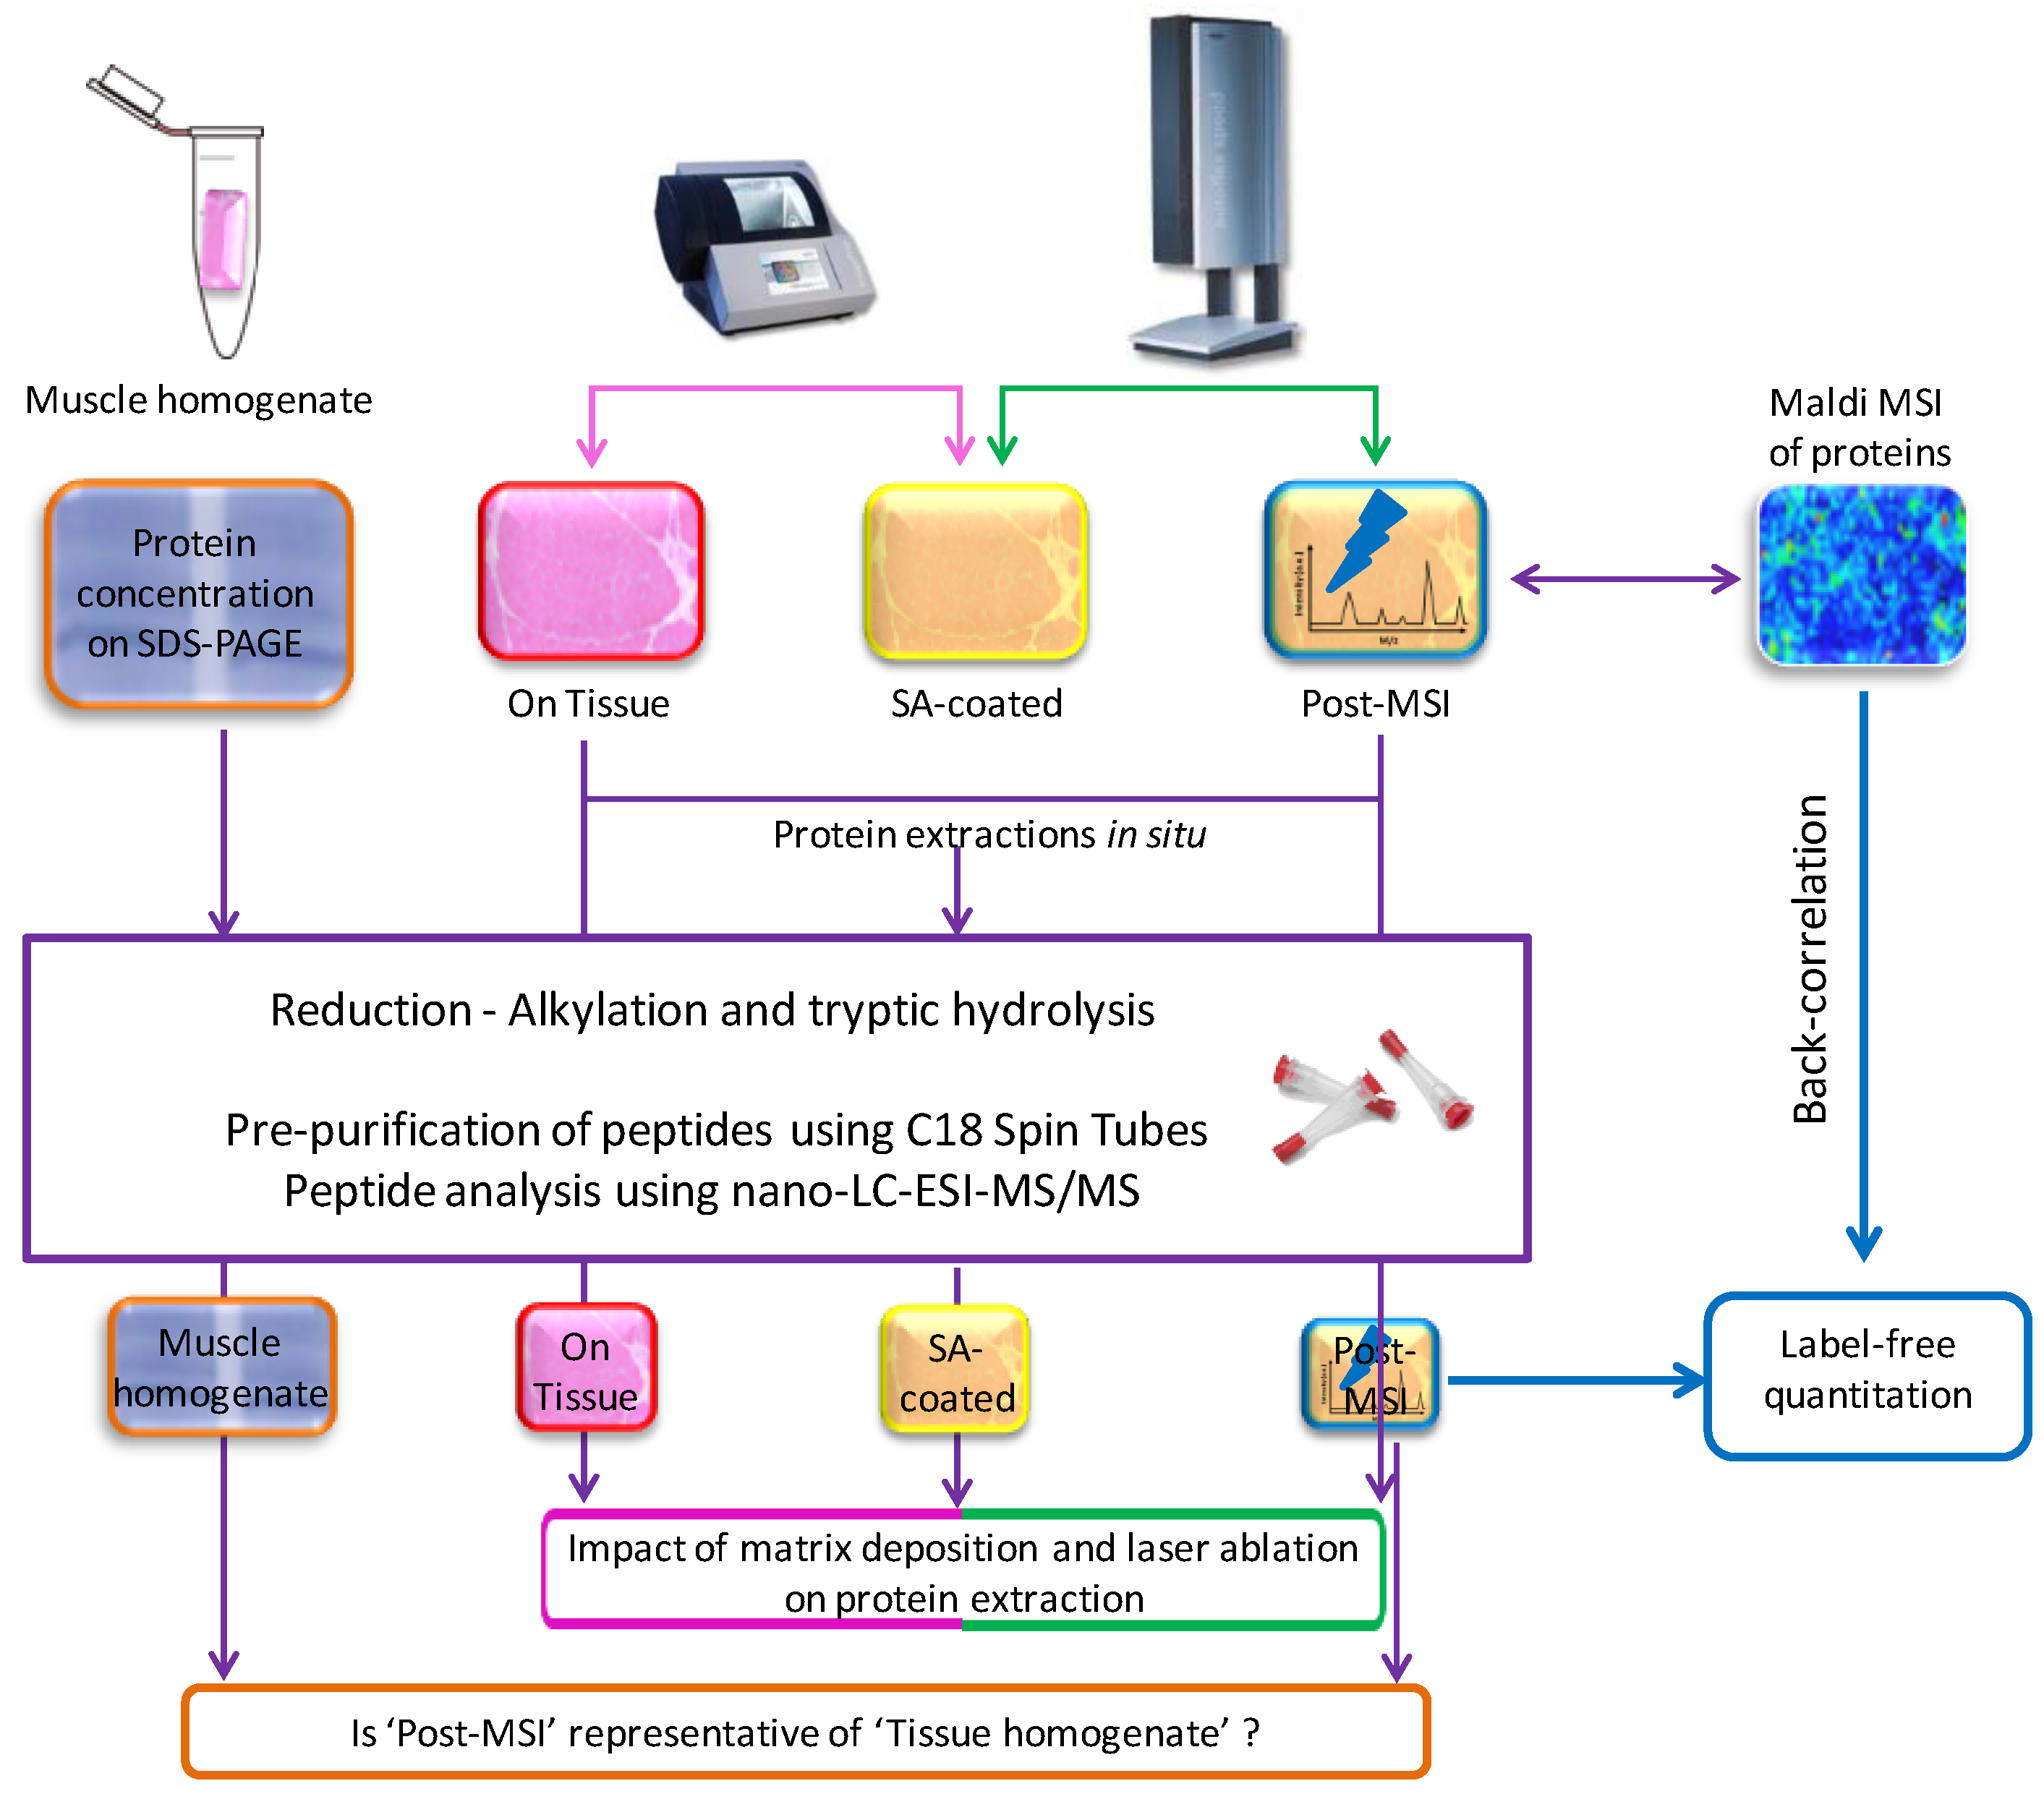
2.1. Experiment Summary
2.2. Reagents
2.3. Subjects and Tissue Preparation
2.4. MALDI Mass Spectrometry Imaging
2.5. ‘On Tissue’, ‘SA-Coated’, and ‘Post-MSI’ Sample Preparation
2.6. ‘Muscle Homogenate’ Preparation
2.7. LC-MS/MS Sample Preparation, Data Acquisition, Database Search and Protein Identification
2.8. Label-Free Protein Quantitation
2.9. MALDI Data Analysis
2.10. LC-MS Data Analysis
2.11. Back-Correlation of MALDI and LC-MS Data
3. Results
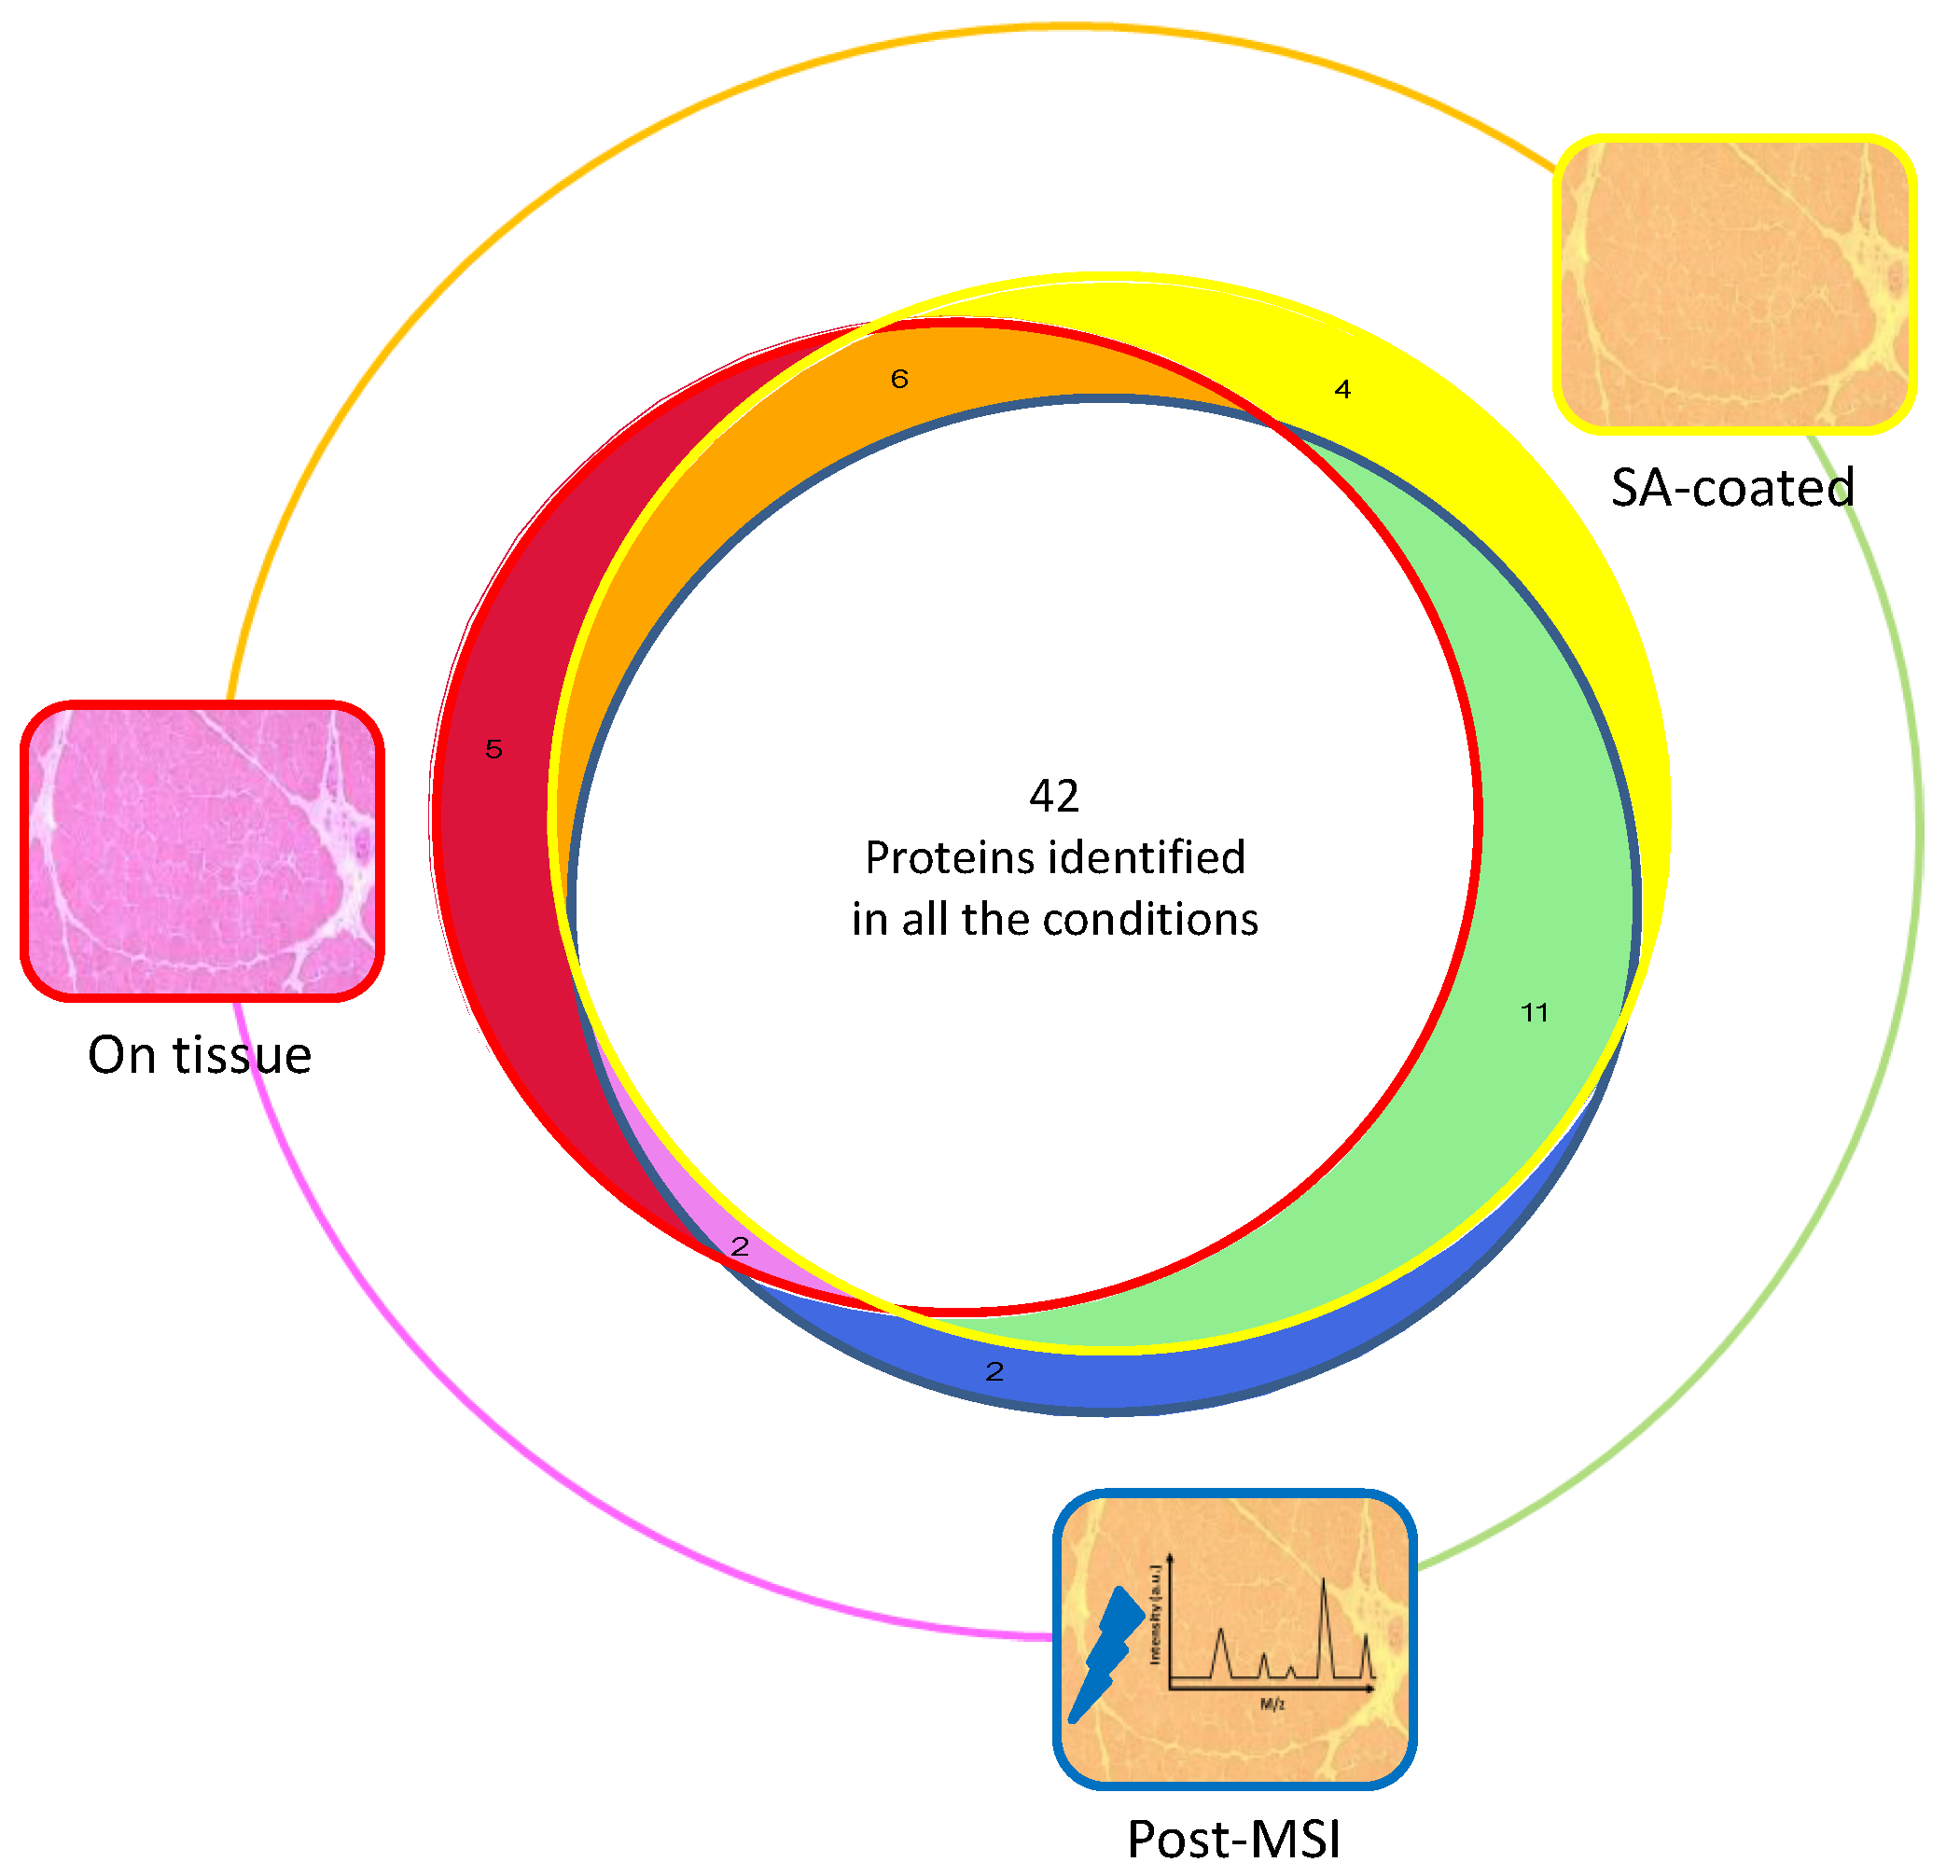
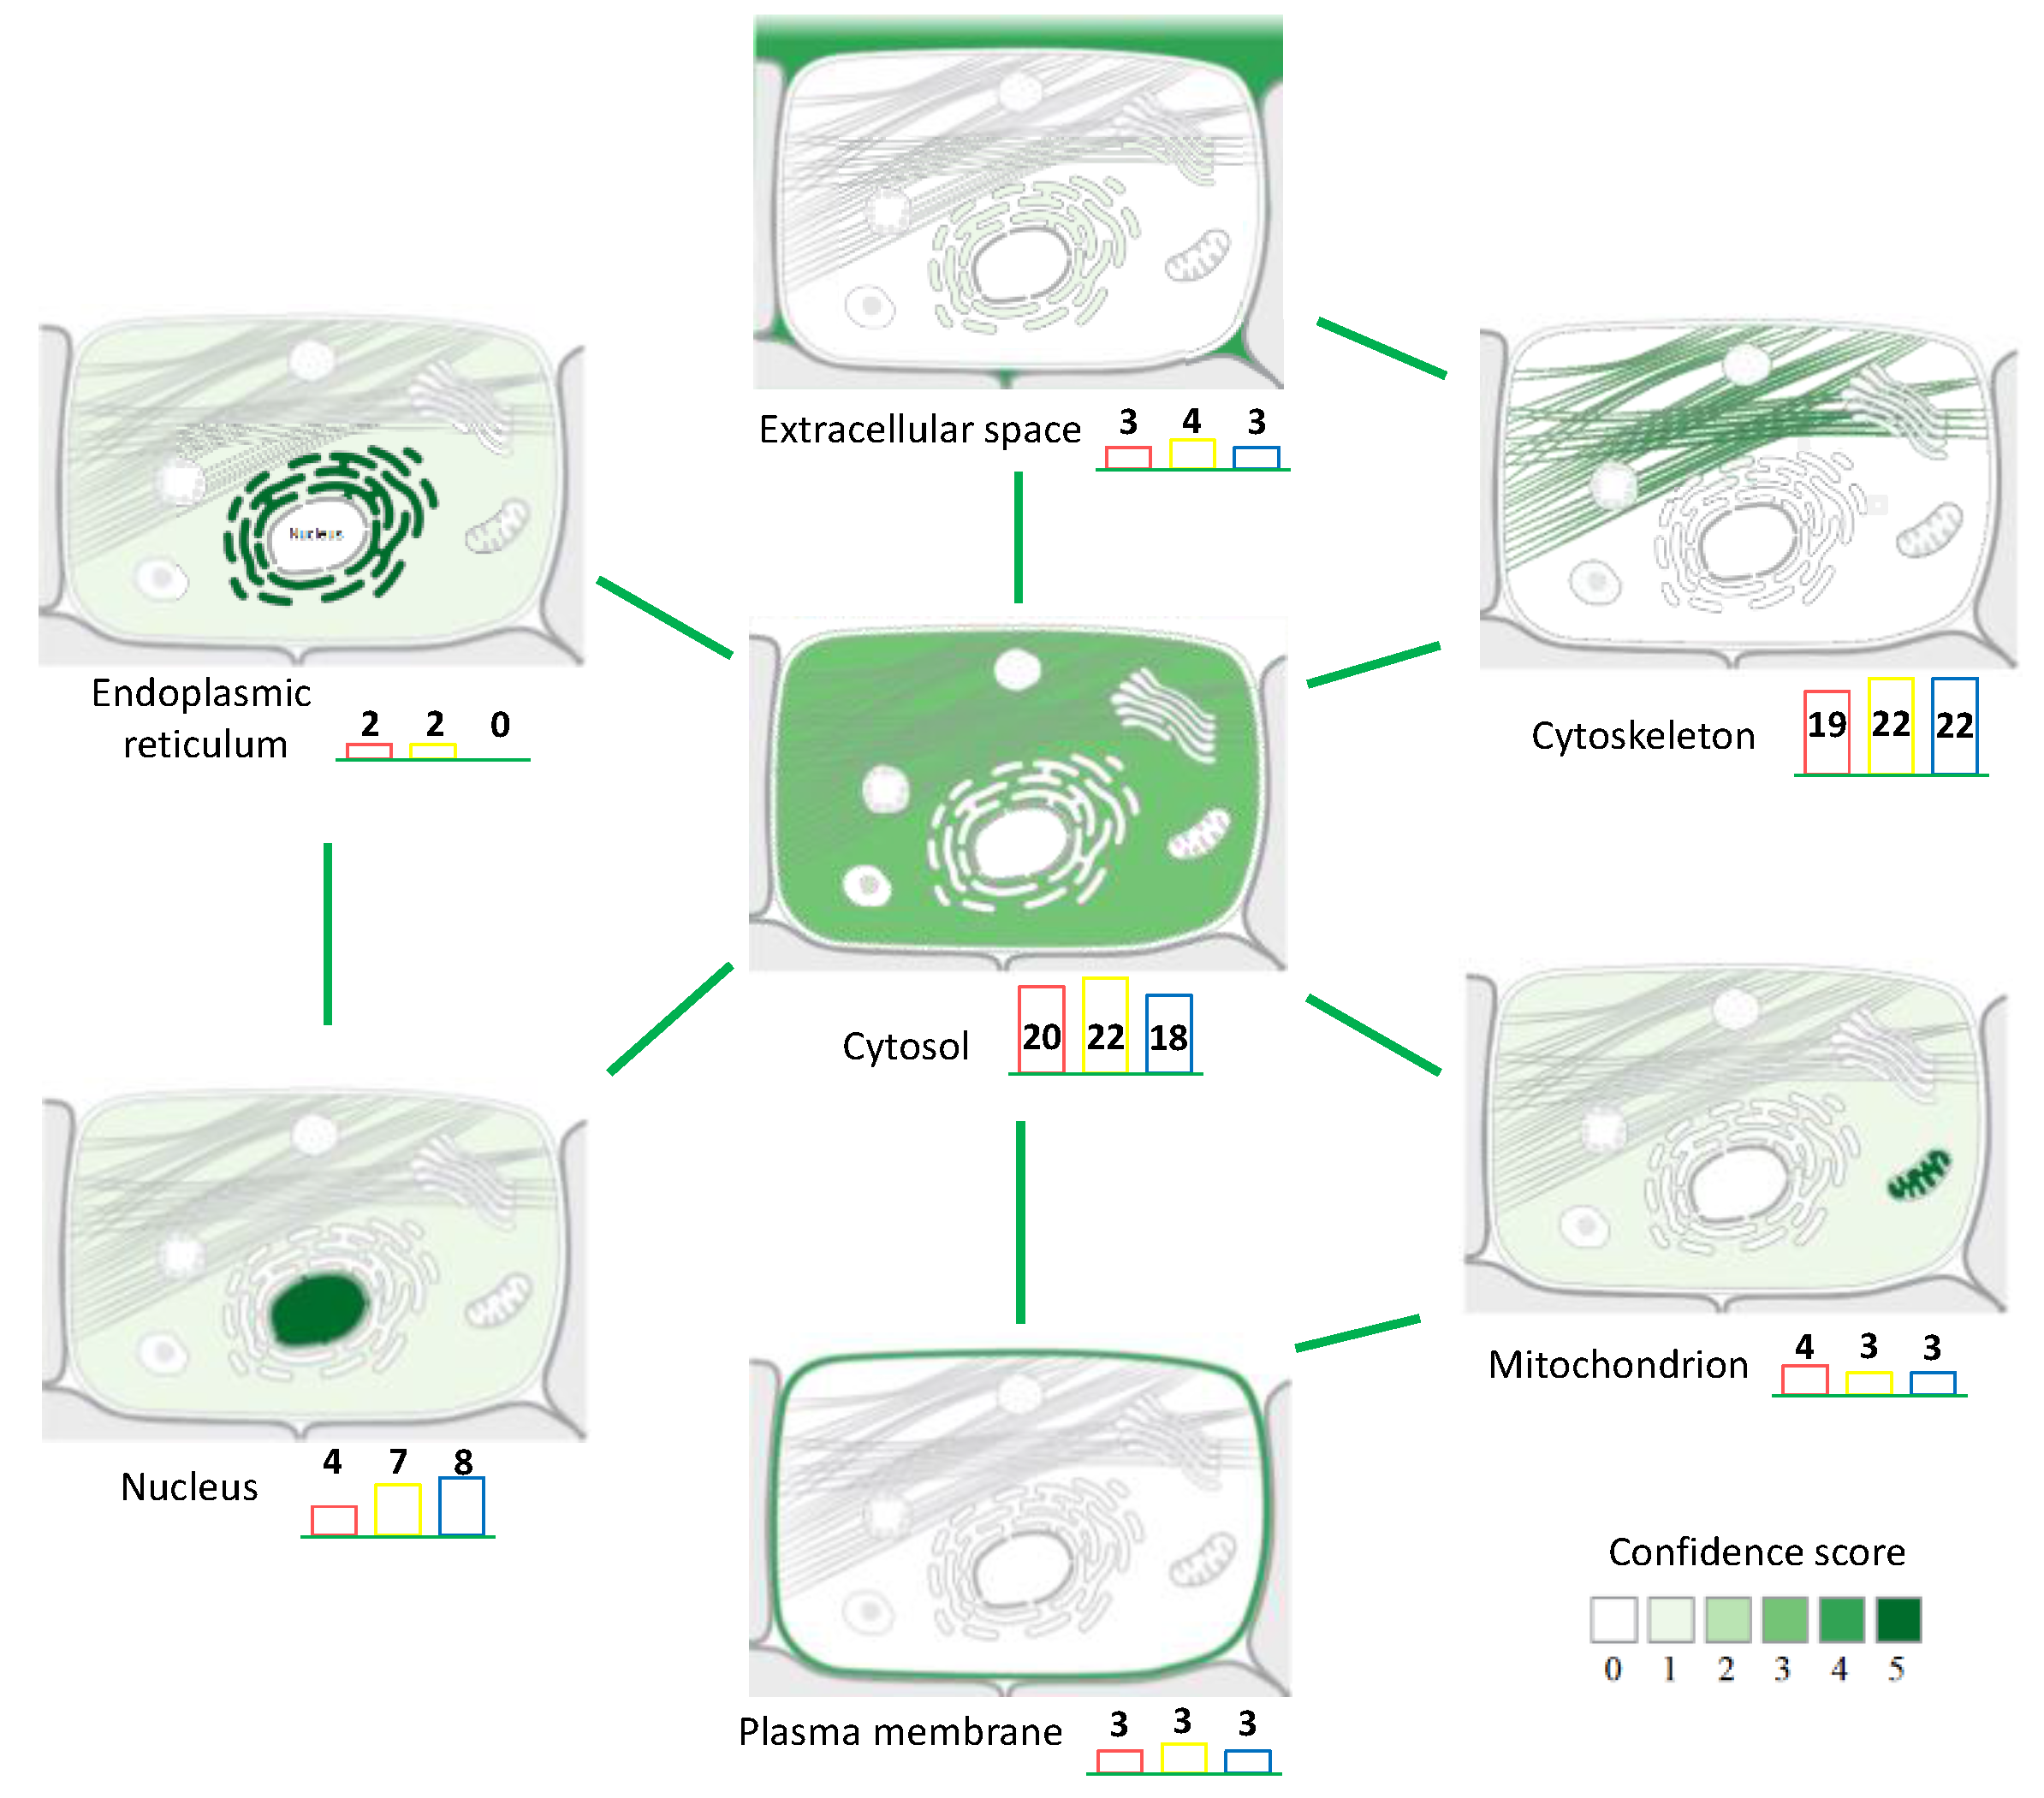
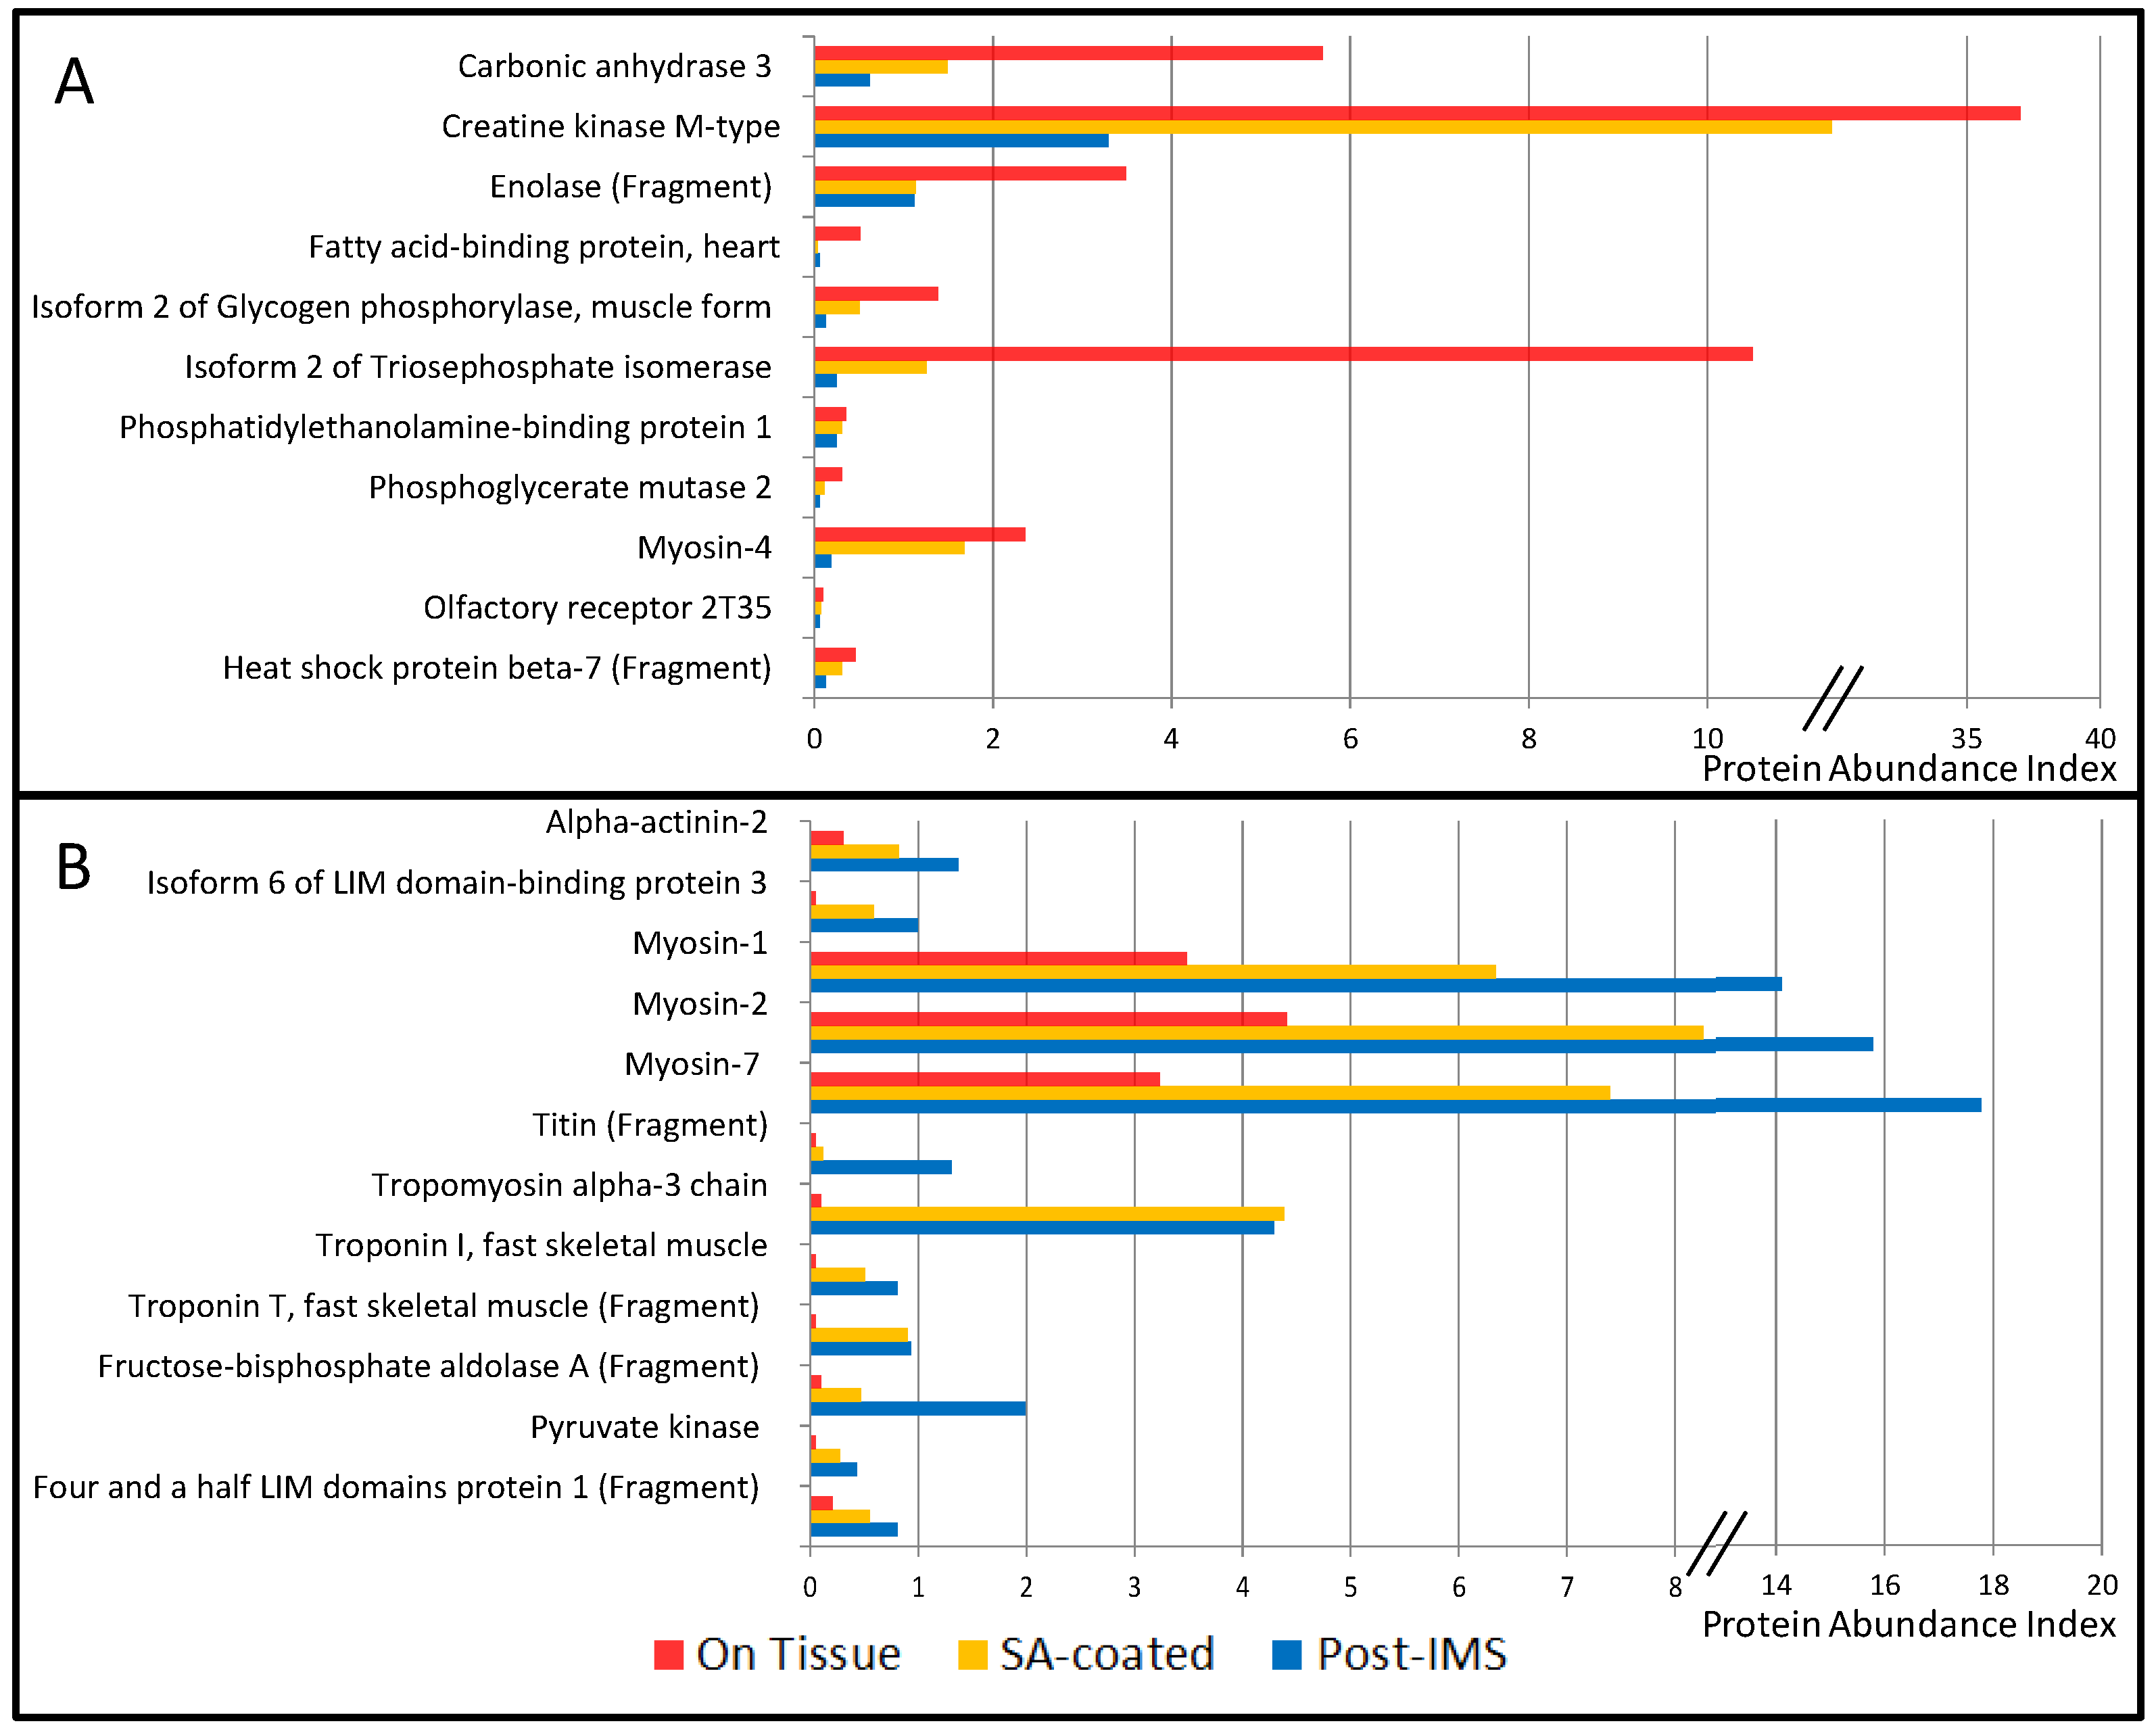
3.1. Protein Extraction Procedures and Identification
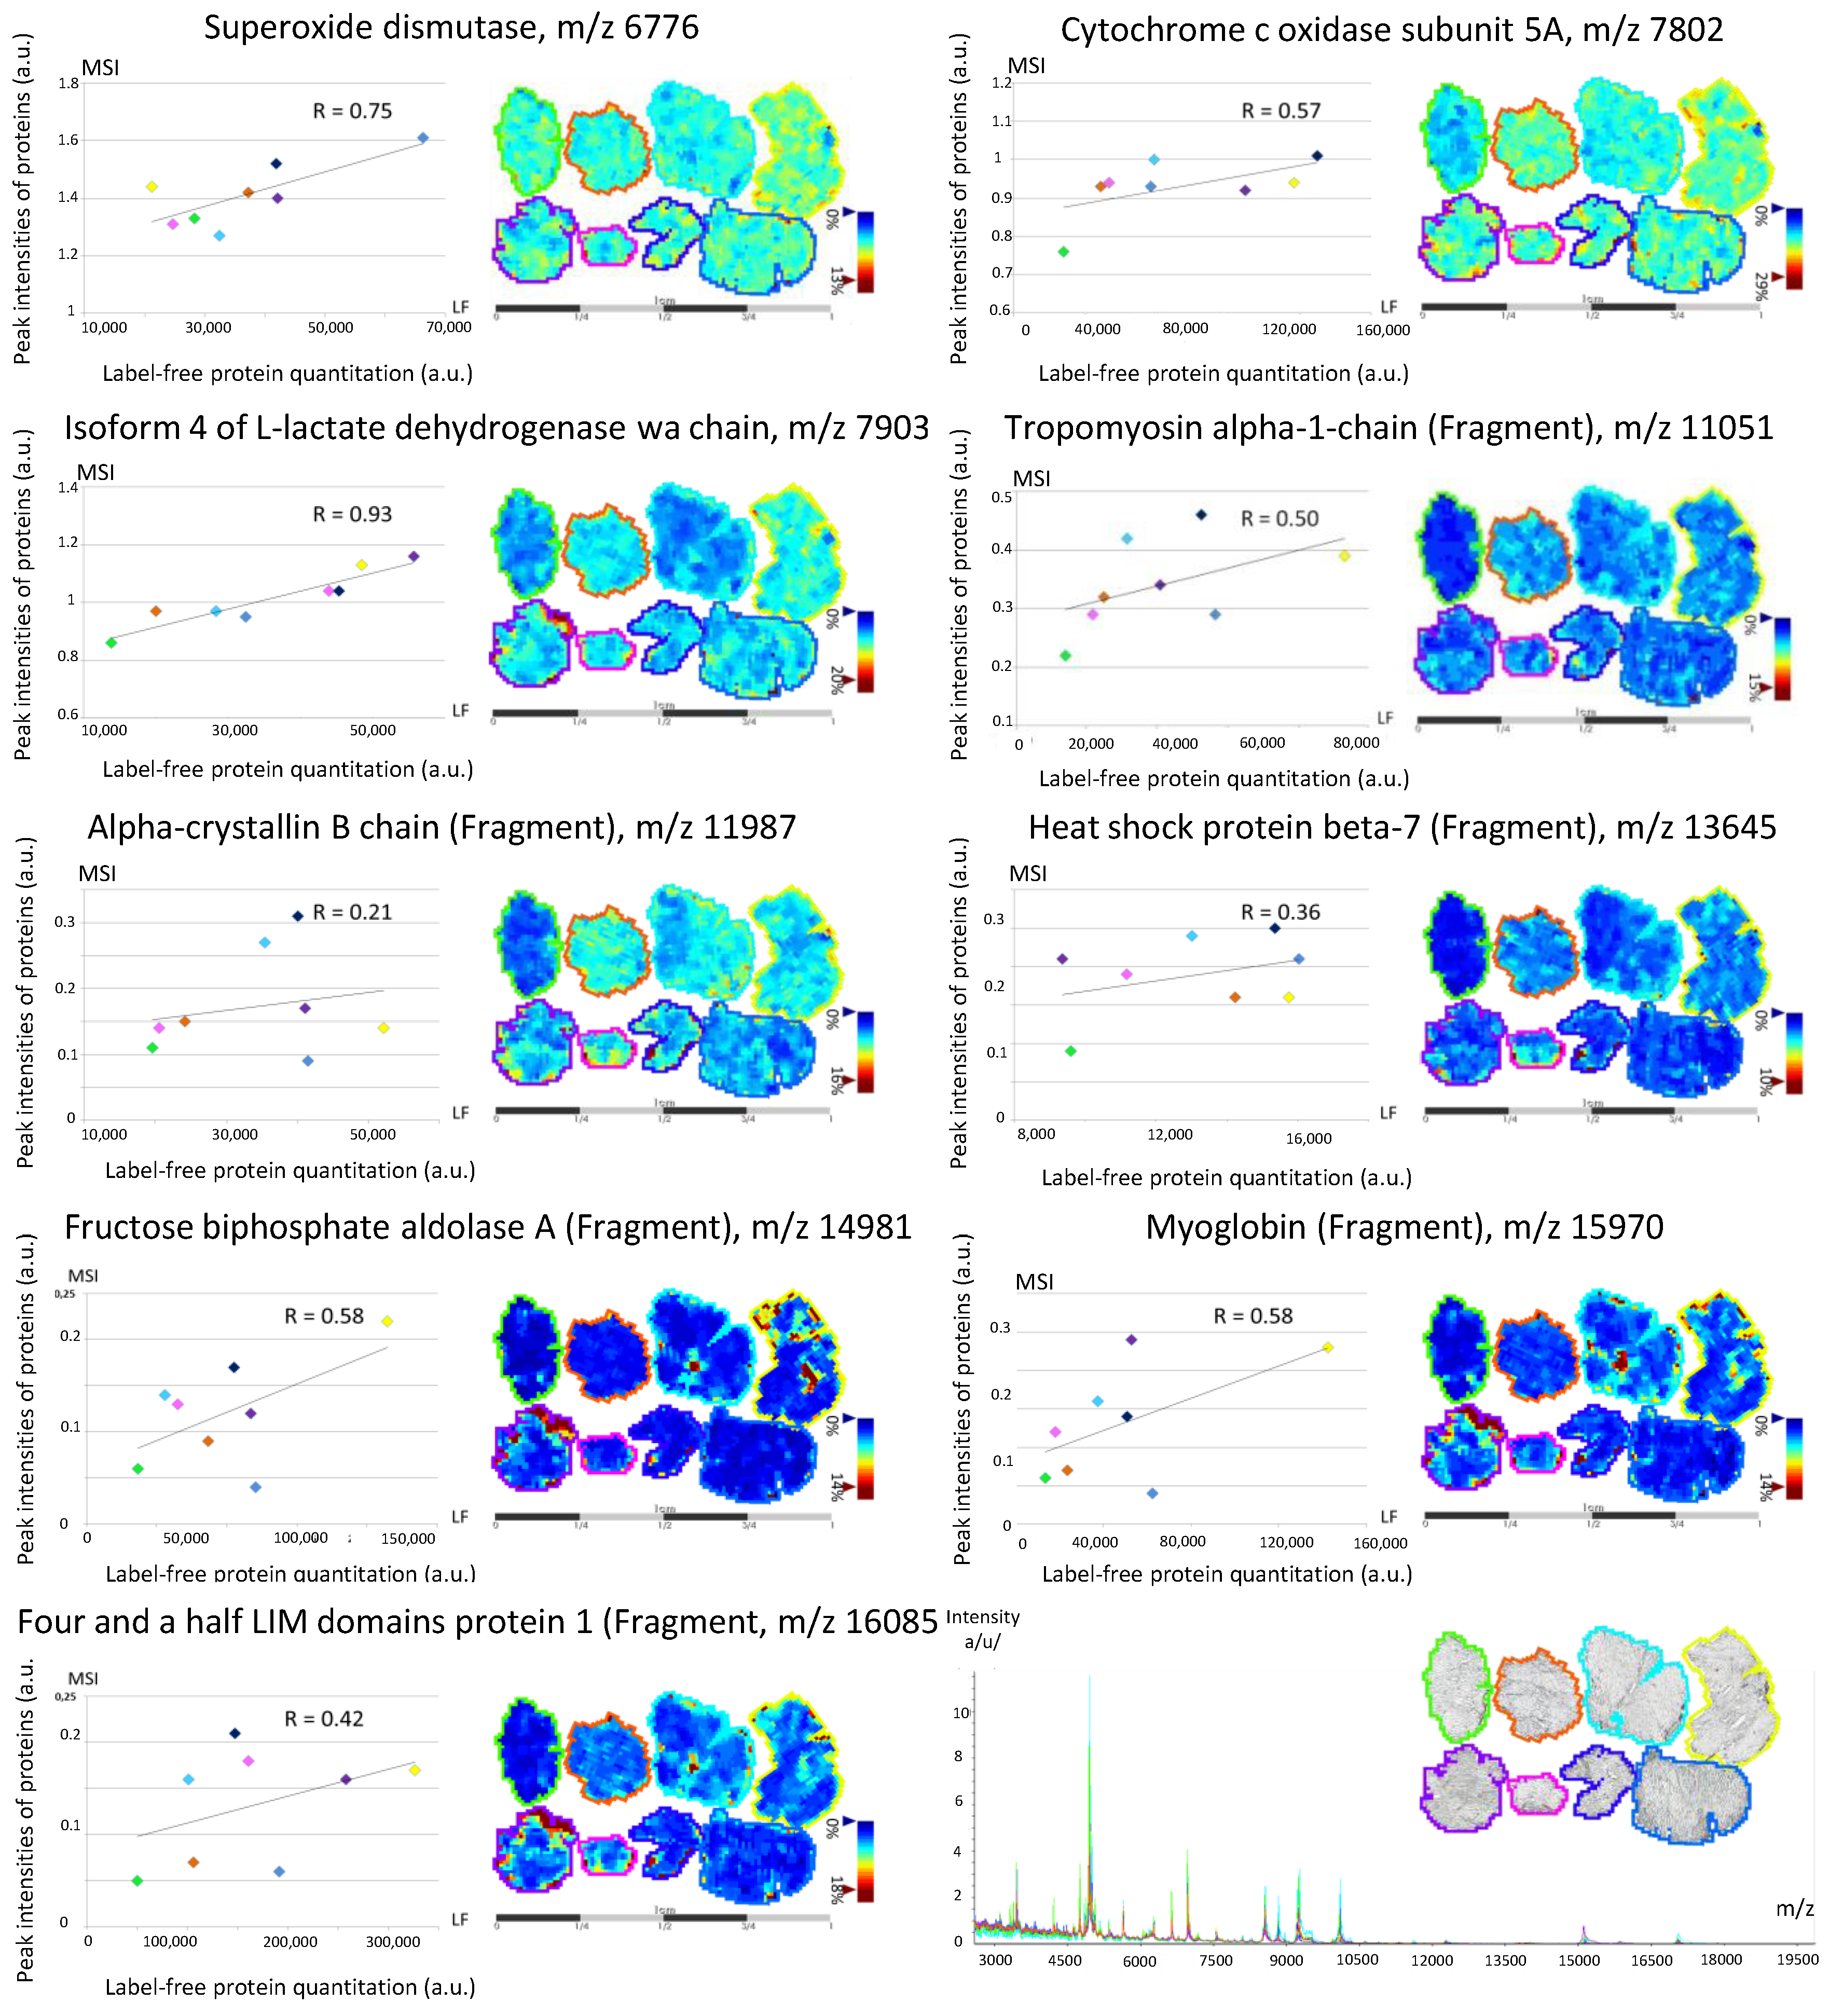
3.2. Back-Correlation of the m/z of the Off-Tissue Identified Proteins to Those of the Proteins Detected by MALDI-MSI
4. Discussion
5. Conclusions
Supplementary Materials
Acknowledgments
Author Contributions
Conflicts of Interest
Abbreviations
| MALDI | Matrix Assisted Laser Desorption Ionization |
| LC-MS | Liquid Chromatography – Mass Spectrometry |
| LF | Label-Free |
| MSI | Mass Spectrometry Imaging |
| ISD | In-Source Decay |
| SA | Sinapinic Acid |
| ACN | Acetonitrile |
| TFA | Trifluoroacetic Acid |
| PSM | Peptide Spectrum Match |
| C | Cytosol |
| Ck | Cytoskeleton |
| ER | Endoplasmic Reticulum |
| ES | Extracellular Space |
| M | Mitochondria |
| Mb | Plasma Membrane |
| N | Nucleus |
References
- Caprioli, R.M.; Farmer, T.B.; Gile, J. Molecular imaging of biological samples: Localization of peptides and proteins using MALDI-TOF MS. Anal. Chem. 1997, 69, 4751–4760. [Google Scholar] [CrossRef] [PubMed]
- Gueugneau, M.; Coudy-Gandilhon, C.; Théron, L.; Meunier, B.; Barboiron, C.; Combaret, L.; Taillandier, D.; Polge, C.; Attaix, D.; Picard, B.; et al. Skeletal muscle lipid content and oxidative activity in relation to muscle fiber type in aging and metabolic syndrome. J. Gerontol. Ser. A Biol. Sci. Med. Sci. 2015, 70, 566–576. [Google Scholar] [CrossRef] [PubMed]
- Gueugneau, M.; Coudy-Gandilhon, C.; Gourbeyre, O.; Chambon, C.; Combaret, L.; Polge, C.; Taillandier, D.; Attaix, D.; Friguet, B.; Maier, A.B.; et al. Proteomics of muscle chronological ageing in post-menopausal women. BMC Genom. 2014. [Google Scholar] [CrossRef] [PubMed]
- Theron, L.; Gueugneau, M.; Coudy, C.; Viala, D.; Bijlsma, A.; Butler-Browne, G.; Maier, A.; Bechet, D.; Chambon, C. Label-free quantitative protein profiling of vastus lateralis muscle during human aging. Mol. Cell. Proteom. 2013, 13, 283–294. [Google Scholar] [CrossRef] [PubMed]
- Mascini, N.E.; Heeren, R.M.A. Protein identification in mass-spectrometry imaging. Trends Anal. Chem. 2012, 40, 28–37. [Google Scholar] [CrossRef]
- Groseclose, M.R.; Andersson, M.; Hardesty, W.M.; Caprioli, R.M. Identification of proteins directly from tissue: In situ tryptic digestions coupled with imaging mass spectrometry. J. Mass Spectrom. 2007, 42, 254–262. [Google Scholar] [CrossRef] [PubMed]
- Goodwin, R.J.A. Sample preparation for mass spectrometry imaging: Small mistakes can lead to big consequences. J. Proteom. 2012, 75, 4893–4911. [Google Scholar] [CrossRef] [PubMed]
- Chughtai, K.; Heeren, R.M.A. Mass spectrometric imaging for biomedical tissue analysis. Chem. Rev. 2010, 110, 3237–3277. [Google Scholar] [CrossRef] [PubMed]
- Debois, D.; Bertrand, V.; Quinton, L.; De Pauw-Gillet, M.C.; De Pauw, E. MALDI-in source decay applied to mass spectrometry imaging: A new tool for protein identification. Anal. Chem. 2010, 82, 4036–4045. [Google Scholar] [CrossRef] [PubMed]
- Hardouin, J. Protein sequence information by matrix-assisted laser desorption/ionization in-source decay mass spectrometry. Mass Spectrom. Rev. 2007, 26, 672–682. [Google Scholar] [CrossRef] [PubMed]
- Quanico, J.; Franck, J.; Dauly, C.; Strupat, K.; Dupuy, J.; Day, R.; Salzet, M.; Fournier, I.; Wisztorski, M. Development of Liquid Microjunction Extraction Strategy for Improving Protein Identification from Tissue Sections. J. Proteom. 2013, 79, 200–218. [Google Scholar] [CrossRef] [PubMed]
- Schey, K.L.; Anderson, D.M.; Rose, K.L. Spatially-directed protein identification from tissue sections by top-down LC-MS/MS with electron transfer dissociation. Anal. Chem. 2013, 85, 6767–6774. [Google Scholar] [CrossRef] [PubMed]
- Maier, S.K.; Hahne, H.; Gholami, A.M.; Balluff, B.; Meding, S.; Schoene, C.; Walch, A.K.; Kuster, B. Comprehensive identification of proteins from MALDI imaging. Mol. Cell. Proteom. 2013, 12, 2901–2910. [Google Scholar] [CrossRef] [PubMed]
- Spraggins, J.M.; Rizzo, D.R.; Moore, J.L.; Rose, K.L.; Hammer, N.D.; Skaar, E.P.; Caprioli, R.M. MALDI FTICR IMS of Intact Proteins: Using Mass Accuracy to Link Protein Images with Proteomics Data. J. Am. Soc. Mass Spectrom. 2015, 26, 974–985. [Google Scholar] [CrossRef] [PubMed]
- Ferreira Aquino, P.; Borges Lima, D.; De Saldanha da Gama Fischer, J.; Donadelli Melani, F.C.S.; Nogueira, R.; Chalub, S.R.S.; Soares, E.R.; Barbosa, V.C.; Domont, G.B.; Carvalho, P.C. Exploring the Proteomic Landscape of a Gastric Cancer Biopsy with the Shotgun Imaging Analyzer. J. Proteome Res. 2014, 13, 314–320. [Google Scholar] [CrossRef] [PubMed]
- Franck, J.; Quanico, J.; Wisztorski, M.; Day, R.; Salzet, M.; Fournier, I. Quantification-based mass spectrometry imaging of proteins by parafilm assisted microdissection. Anal. Chem. 2013, 85, 8127–8134. [Google Scholar] [CrossRef] [PubMed]
- Binder, J.X.; Pletscher-Frankild, S.; Tsafou, K.; Stolte, C.; O’Donoghue, S.I.; Schneider, R.; Jensen, L.J. COMPARTMENTS: Unification and visualization of protein subcellular localization evidence. Database 2014. [Google Scholar] [CrossRef] [PubMed]
- Nicklay, J.J.; Harris, G.A.; Schey, K.L.; Caprioli, R.M. MALDI imaging and in situ identification of integral membrane proteins from rat brain tissue sections. Anal. Chem. 2013, 85, 7191–7196. [Google Scholar] [CrossRef] [PubMed]
- Chaurand, P.; Fouchecourt, S.; Dague, B.B.; Xu, B.J.; Reyzer, M.L.; Orgebin-Crist, M.C.; Caprioli, R.M. Profiling and imaging proteins in the mouse epididymis by imaging mass spectrometry. Proteomics 2003, 3, 2221–2239. [Google Scholar] [CrossRef] [PubMed]
- Hardesty, W.M.; Kelley, M.C.; Mi, D.; Low, R.L.; Caprioli, R.M. Protein signatures for survival and recurrence in metastatic melanoma. J. Proteom. 2011, 74, 1002–1014. [Google Scholar] [CrossRef] [PubMed]
- Lagarrigue, M.; Alexandrov, T.; Dieuset, G.; Perrin, A.; Lavigne, R.; Baulac, S.; Thiele, H.; Martin, B.; Pineau, C. New analysis workflow for MALDI imaging mass spectrometry: Application to the discovery and identification of potential markers of childhood absence epilepsy. J. Proteome Res. 2012, 11, 5453–5463. [Google Scholar] [CrossRef] [PubMed]
- Harris, G.A.; Nicklay, J.J.; Caprioli, R.M. Localized in situ hydrogel-mediated protein digestion and extraction technique for on-tissue analysis. Anal. Chem. 2013, 85, 2717–2723. [Google Scholar] [CrossRef] [PubMed]
- Hojlund, K.; Yi, Z.; Zwang, H.; Bowen, B.; Lefort, N.; Flynn, C.R.; Langlais, P.; Weintraub, S.T.; Mandarino, L.J. Characterization of the human skeletal muscle proteome by one-dimensional gel electrophoresis and HPLC-ESI-MS/MS. Mol. Cell. Proteom. 2008, 7, 257–267. [Google Scholar] [CrossRef] [PubMed]
- McDonnell, L.A.; Walch, A.; Stoeckli, M.; Corthals, G.L. MSiMass List: A Public Database of Identifications for Protein MALDI MS Imaging. J. Proteome Res. 2013, 13, 1138–1142. [Google Scholar] [CrossRef] [PubMed]
- Minerva, L.; Boonen, K.; Menschaert, G.; Landuyt, B.; Baggerman, G.; Arckens, L. Linking mass spectrometric imaging and traditional peptidomics: A validation in the obese mouse model. Anal. Chem. 2011, 83, 7682–7691. [Google Scholar] [CrossRef] [PubMed]
- Kanski, J.; Alterman, M.A.; Schöneich, C. Proteomic identification of age-dependent protein nitration in rat skeletal muscle. Free Radic. Biol. Med. 2003, 35, 1229–1239. [Google Scholar] [CrossRef]
- Piec, I.; Listrat, A.; Alliot, J.; Chambon, C.; Taylor, R.G.; Bechet, D. Differential proteome analysis of aging in rat skeletal muscle. FASEB J. 2005, 19, 1143–1145. [Google Scholar] [CrossRef] [PubMed]
- Doran, P.; Gannon, J.; O’Connell, K.; Ohlendieck, K. Aging skeletal muscle shows a drastic increase in the small heat shock proteins αB-crystallin/HspB5 and cvHsp/HspB7. Eur. J. Cell. Biol. 2007, 86, 629–640. [Google Scholar] [CrossRef] [PubMed]
- Doran, P.; O’Connell, K.; Gannon, J.; Kavanagh, M.; Ohlendieck, K. Opposite pathobiochemical fate of pyruvate kinase and adenylate kinase in aged rat skeletal muscle as revealed by proteomic DIGE analysis. Proteomics 2008, 8, 364–377. [Google Scholar] [CrossRef] [PubMed]
- Gannon, J.; Staunton, L.; O’Connell, K.; Doran, P.; Ohlendieck, K. Phosphoproteomic analysis of aged skeletal muscle. Int. J. Mol. Med. 2008, 22, 33–42. [Google Scholar] [CrossRef] [PubMed]
- Lombardi, A.; Silvestri, E.; Cioffi, F.; Senese, R.; Lanni, A.; Goblia, F.; De Lange, P.; Moreno, M. Defining the trascriptomic and proteomic profiles of rat ageing skeletal muscle by the use of a cDNA array, 2D- and Blue native-PAGE approach. J. Proteom. 2009, 72, 708–721. [Google Scholar] [CrossRef] [PubMed]
- McDonagh, B.; Sakellariou, G.K.; Jackson, M.J. Application of redox proteomics to skeletal muscle aging and exercise. Biochem. Soc. Trans. 2014, 42, 965–970. [Google Scholar] [CrossRef] [PubMed]
- Jia, L.; Xu, L.; Jiang, M.; Gu, Y.; Zhang, Z. Protein abnormality in denervated skeletal muscles from patients with brachial injury. Microsurgery 2005, 25, 316–321. [Google Scholar] [CrossRef] [PubMed]
- Kramerova, I.; Kudryashova, E.; Wu, B.; Germain, S.; Vandenborne, K.; Romain, N.; Haller, R.G.; Verity, M.A.; Spencer, M.J. Mitochondrial abnormalities, energy deficit and oxidative stress are features of calpain 3 deficiency in skeletal muscle. Hum. Mol. Gen. 2009, 18, 3194–3205. [Google Scholar] [CrossRef] [PubMed]
- Sato, Y.; Shimizu, M.; Mizunoya, W.; Wariishi, H.; Tatsumi, R.; Buchman, V.L.; Ikeuchi, Y. Differential Expression of Sarcoplasmic and Myofibrillar Proteins of Rat Soleus Muscle during Denervation Atrophy. Biosci. Biotech. Biochem. 2009, 73, 1748–1756. [Google Scholar] [CrossRef] [PubMed]
- Maerkens, A.; Kley, R.A.; Olive, M.; Theis, V.; van der Ven, P.F.M.; Reimann, J.; Milting, H.; Schreiner, A.; Uszkoreit, J.; Eisenacher, M.; et al. Differential proteomic analysis of abnormal intramyoplasmic aggregates in desminopathy. J. Proteom. 2013, 90, 14–27. [Google Scholar] [CrossRef] [PubMed]


| Phase | Sensor | Nebulization | Incubation | Drying |
|---|---|---|---|---|
| 1 | 15 cycles | 25% ± 30% power with fixed spray time of 2.2 s | 15 s | 50 s |
| 2 | 0.1 V within 5–10 cycles | 25% ± 30% power with 0.05 V sensor controlled spray time | 30 s ± 30 s | Complete dry every cycle, safe dry 20 s |
| 3 | 0.1 V within 6–18 cycles | 25% ± 30% power with 0.10 V sensor controlled spray time | Grade 20% ± 60% complete dry every 2 cycles, safe dry 20 s | |
| 4 | 0.3 V within 12–40 cycles | 25% ± 30% power with 0.2 V sensor controlled spray time | Grade 20% ± 60% complete dry every 4 cycles, safe dry 50 s | |
| 5 | 0.35 V ± 0.30 V, within 12–64 cycles | 25% ± 35% power with 0.3 V sensor controlled spray time | Grade 20% ± 60% complete dry every 4 cycles, safe dry 60 s |
| Symbol | Accession | Description | Abundance Index (%) | References | Main Cellular Compartment | ||
|---|---|---|---|---|---|---|---|
| On Tissue | SA-Coated | After-MSI | |||||
| ACTA1 | P68133 | Actin, α skeletal muscle | 4.31 | 3.01 | 3.42 | [9] | Ck |
| ACTN2 | P35609 | A-actinin-2 | 0.31 | 0.82 | 1.37 | [9] | Ck |
| ATP5B | P06576 | ATP synthase subunit β, mitochondrial (Fragment) | 0.15 | 0.16 | 0.12 | [9] | Mb |
| CA3 | P07451 | Carbonic anhydrase 3 | 5.69 | 1.49 | 0.62 | [9] | C |
| CKM | P06732 | Creatine kinase M-type | 37.0 | 11.4 | 3.29 | [9] | C |
| DES | P17661 | Desmin | 0.10 | 0.08 | 0.44 | [9] | Ck |
| ENO3 | P06733 | Enolase (Fragment) | 3.49 | 1.14 | 1.12 | [9] | C |
| FABP3 | P05413 | Fatty acid-binding protein, heart | 0.51 | 0.04 | 0.06 | [9] | C |
| FHL1 | Q5JXI0 | Four and a half LIM domains protein 1 (Fragment) | 0.21 | 0.55 | 0.81 | [9] | N |
| ALDOA | P04075-H3BR68 | Fructose-bisphosphate aldolase A (Fragment) | 0.10 | 0.47 | 1.99 | [9] | C |
| ALDOC | P09972 | Fructose-bisphosphate aldolase C (Fragment) | 0.05 | 0.39 | 0.06 | [9] | C |
| GAPDH | P04406 | Glyceraldehyde-3-phosphate dehydrogenase | 0.97 | 1.45 | 0.12 | [9] | C |
| HSPB1 | P04792 | Heat shock protein β-1 | 0.10 | 0.59 | 0.12 | [9] | N |
| HSSPB7 | C9J5A3-E9PN25 | Heat shock protein β-7 (Fragment) | 0.46 | 0.31 | 0.12 | [9] | N |
| HBA1 | P69905 | Hemoglobin subunit α | 0.26 | 2.11 | 0.56 | [16] | ES |
| HBB | P68871 | Hemoglobin subunit β | 1.13 | 4.46 | 2.05 | [16] | ES |
| PYGM | P11217-2 | Isoform 2 of Glycogen phosphorylase, muscle form | 1.38 | 0.51 | 0.12 | [9] | C |
| TRDX | P10599-2 | Isoform 2 of Thioredoxin | 0.26 | 0.08 | 0.19 | [17] | C |
| TPI1 | P60174-1 | Isoform 2 of Triosephosphate isomerase | 10.51 | 1.25 | 0.25 | [9,16] | C |
| LDHA | P00338-4 | Isoform 4 of L-lactate dehydrogenase A chain | 0.05 | 0.16 | 0.06 | [9] | C |
| LDB3 | O75112-6 | Isoform 6 of LIM domain-binding protein 3 | 0.05 | 0.59 | 0.99 | [9] | Ck |
| MB | B0QYF8 | Myoglobin (Fragment) | 4.72 | 4.66 | 3.67 | [9] | C |
| MYBPC1 | G3V1V7 | Myosin binding protein C, slow type, isoform CRA_e | 0.05 | 0.23 | 0.19 | [9] | C |
| MYL1 | P05976 | Myosin light chain 1/3, skeletal muscle isoform | 5.84 | 6.73 | 1.86 | [9] | Ck |
| MYL3 | P08590 | Myosin light chain 3 | 1.18 | 2.47 | 1.86 | [9] | Ck |
| MYLPF | Q96A32 | Myosin regulatory light chain 2, skeletal muscle isoform | 0.56 | 1.57 | 0.68 | [9] | Ck |
| MYH1 | P12882 | Myosin-1 | 3.49 | 6.34 | 14.11 | [9] | Ck |
| MYH2 | Q9UKX2 | Myosin-2 | 4.41 | 8.26 | 15.79 | [9] | Ck |
| MYH4 | Q9Y623 | Myosin-4 | 2.36 | 1.68 | 0.19 | [9] | Ck |
| MYHCB | P12883 | Myosin-7 | 3.23 | 7.40 | 17.78 | [9] | Ck |
| NEB | F8WCL5 | Nebulin | 0.05 | 0.04 | 0.19 | [9] | Ck |
| OR2T35 | Q8NGX2 | Olfactory receptor 2T35 | 0.10 | 0.08 | 0.06 | Mb | |
| PEBP1 | P30086 | Phosphatidylethanolamine-binding protein 1 | 0.36 | 0.31 | 0.25 | [9,15] | C |
| PGAM2 | P15259 | Phosphoglycerate mutase 2 | 0.31 | 0.12 | 0.06 | [9] | C |
| PKM | H3BQ34 | Pyruvate kinase | 0.05 | 0.27 | 0.44 | [9] | C |
| TTN | Q8WZ42 | Titin (Fragment) | 0.05 | 0.12 | 1.31 | [9] | Ck |
| TPM1 | P09493-H0YK20 | Tropomyosin α-1 chain (Fragment) | 0.77 | 6.03 | 5.22 | [9] | Ck |
| TPM3 | P06753 | Tropomyosin α-3 chain | 0.10 | 4.39 | 4.29 | [9] | Ck |
| TPM2 | P07951 | Tropomyosin β chain | 1.74 | 10.02 | 5.90 | [9] | Ck |
| TNNC2 | P02585 | Troponin C, skeletal muscle | 0.36 | 0.94 | 0.44 | [9] | Ck |
| TNNI2 | P48788 | Troponin I, fast skeletal muscle | 0.05 | 0.51 | 0.81 | [9] | Ck |
| TNNT3 | C9JCA5 | Troponin T, fast skeletal muscle (Fragment) | 0.05 | 0.90 | 0.93 | [9] | Ck |
| IFIT2 | P09913 | Interferon-induced protein with tetratricopeptide repeats 2 | 0.15 | 0.04 | [9] | ER | |
| IDH2 | B4DFL2 | Isocitrate dehydrogenase [NADP] (fragment) | 0.10 | 0.16 | [9] | M | |
| KIDINS220 | Q9ULH0-3 | Isoform 3 of Kinase D-interacting substrate of 220 kDa | 0.05 | 0.04 | Mb | ||
| PGM1 | P36871 | Phosphoglucomutase-1 | 1.49 | 0.08 | [9] | C | |
| S100A1 | P23297 | Protein S100-A1 | 0.15 | 0.20 | [9,16] | ER | |
| ALB | P02768 | Serum albumin | 0.15 | 0.16 | [9,15] | ES | |
| COX5A | H3BRM5 | Cytochrome c oxidase subunit 5A, mitochondrial | 0.05 | 0.06 | [9] | M | |
| SOD2 | B4E3K9-H7BYH4 | Superoxide dismutase | 0.15 | 0.12 | [9] | M | |
| GSTP1 | A8MX94 | Glutathione S-transferase P | 0.05 | [9,15] | C | ||
| AKR1B15 | C9JRZ8-2 | Isoform 2 of Aldo-keto reductase family 1 member B15 | 0.10 | C | |||
| XPC | Q01831-2 | Isoform 2 of DNA repair protein complementing XP-C cells | 0.05 | N | |||
| HEBP2 | Q9Y5Z4-2 | Isoform 2 of Heme-binding protein 2 | 0.10 | [9] | M | ||
| PGK1 | B7Z7A9 | Phosphoglycerate kinase | 0.46 | C | |||
| PFKM | P08237 | 6-phosphofructokinase, muscle type (Fragment) | 0.04 | 0.06 | [9] | C | |
| HSPB5 | E9PR44-E9PNH7 | A-crystallin B chain (Fragment) | 0.23 | 0.37 | [9] | N | |
| COL1A2 | P08123 | Collagen α-2(I) chain | 0.04 | 0.06 | [9] | ES | |
| HIST1H1T | P22492 | Histone H1t | 0.12 | 0.12 | [15,18] | N | |
| H2AFV | A8MQC5 | Histone H2A | 0.04 | 0.06 | [9] | N | |
| FNC | Q14315-2 | Isoform 2 of Filamin-C | 0.04 | 0.25 | [9] | C | |
| MYOZ1 | Q9NP98 | Myozenin-1 | 0.31 | 0.25 | [9] | N | |
| SERCO1 | B3KY17 | Sarcoplasmic/endoplasmic reticulum calcium ATPase 1 | 0.04 | 0.25 | [9] | Mb | |
| TPM3 | Q5VU72 | Tropomyosin 3, isoform CRA_a | 3.37 | 2.86 | [9] | Ck | |
| TNNC1 | P63316 | Troponin C, slow skeletal and cardiac muscles | 0.31 | 0.68 | [9] | Ck | |
| TNNI1 | P19237 | Troponin I, slow skeletal muscle | 0.27 | 0.75 | [9] | Ck | |
| CASQ1 | P31415 | Calsequestrin-1 | 0.08 | [9] | M | ||
| CSRP3 | P50461 | Cysteine and glycine-rich protein 3 | 0.12 | [9] | C | ||
| KIF15 | Q9NS87-3 | Isoform 3 of Kinesin-like protein KIF15 | 0.12 | C | |||
| USMG5 | Q96IX5 | Up-regulated during skeletal muscle growth protein 5 | 0.08 | [9] | M | ||
| UQCRB | P14927 | Cytochrome b-c1 complex subunit 7 | 0.06 | [1] | M | ||
| UBB | J3QSA3 | Ubiquitin (Fragment) | 0.12 | [9,15,16] | N | ||
© 2016 by the authors; licensee MDPI, Basel, Switzerland. This article is an open access article distributed under the terms and conditions of the Creative Commons Attribution (CC-BY) license (http://creativecommons.org/licenses/by/4.0/).
Share and Cite
Théron, L.; Centeno, D.; Coudy-Gandilhon, C.; Pujos-Guillot, E.; Astruc, T.; Rémond, D.; Barthelemy, J.-C.; Roche, F.; Feasson, L.; Hébraud, M.; et al. A Proof of Concept to Bridge the Gap between Mass Spectrometry Imaging, Protein Identification and Relative Quantitation: MSI~LC-MS/MS-LF. Proteomes 2016, 4, 32. https://doi.org/10.3390/proteomes4040032
Théron L, Centeno D, Coudy-Gandilhon C, Pujos-Guillot E, Astruc T, Rémond D, Barthelemy J-C, Roche F, Feasson L, Hébraud M, et al. A Proof of Concept to Bridge the Gap between Mass Spectrometry Imaging, Protein Identification and Relative Quantitation: MSI~LC-MS/MS-LF. Proteomes. 2016; 4(4):32. https://doi.org/10.3390/proteomes4040032
Chicago/Turabian StyleThéron, Laëtitia, Delphine Centeno, Cécile Coudy-Gandilhon, Estelle Pujos-Guillot, Thierry Astruc, Didier Rémond, Jean-Claude Barthelemy, Frédéric Roche, Léonard Feasson, Michel Hébraud, and et al. 2016. "A Proof of Concept to Bridge the Gap between Mass Spectrometry Imaging, Protein Identification and Relative Quantitation: MSI~LC-MS/MS-LF" Proteomes 4, no. 4: 32. https://doi.org/10.3390/proteomes4040032
APA StyleThéron, L., Centeno, D., Coudy-Gandilhon, C., Pujos-Guillot, E., Astruc, T., Rémond, D., Barthelemy, J.-C., Roche, F., Feasson, L., Hébraud, M., Béchet, D., & Chambon, C. (2016). A Proof of Concept to Bridge the Gap between Mass Spectrometry Imaging, Protein Identification and Relative Quantitation: MSI~LC-MS/MS-LF. Proteomes, 4(4), 32. https://doi.org/10.3390/proteomes4040032