
Identification of Biomarkers for Resistance to Fusarium oxysporum f. sp. cubense Infection and in Silico Studies in Musa paradisiaca Cultivar Puttabale through Proteomic Approach

Abstract
:
1. Introduction
2. Results
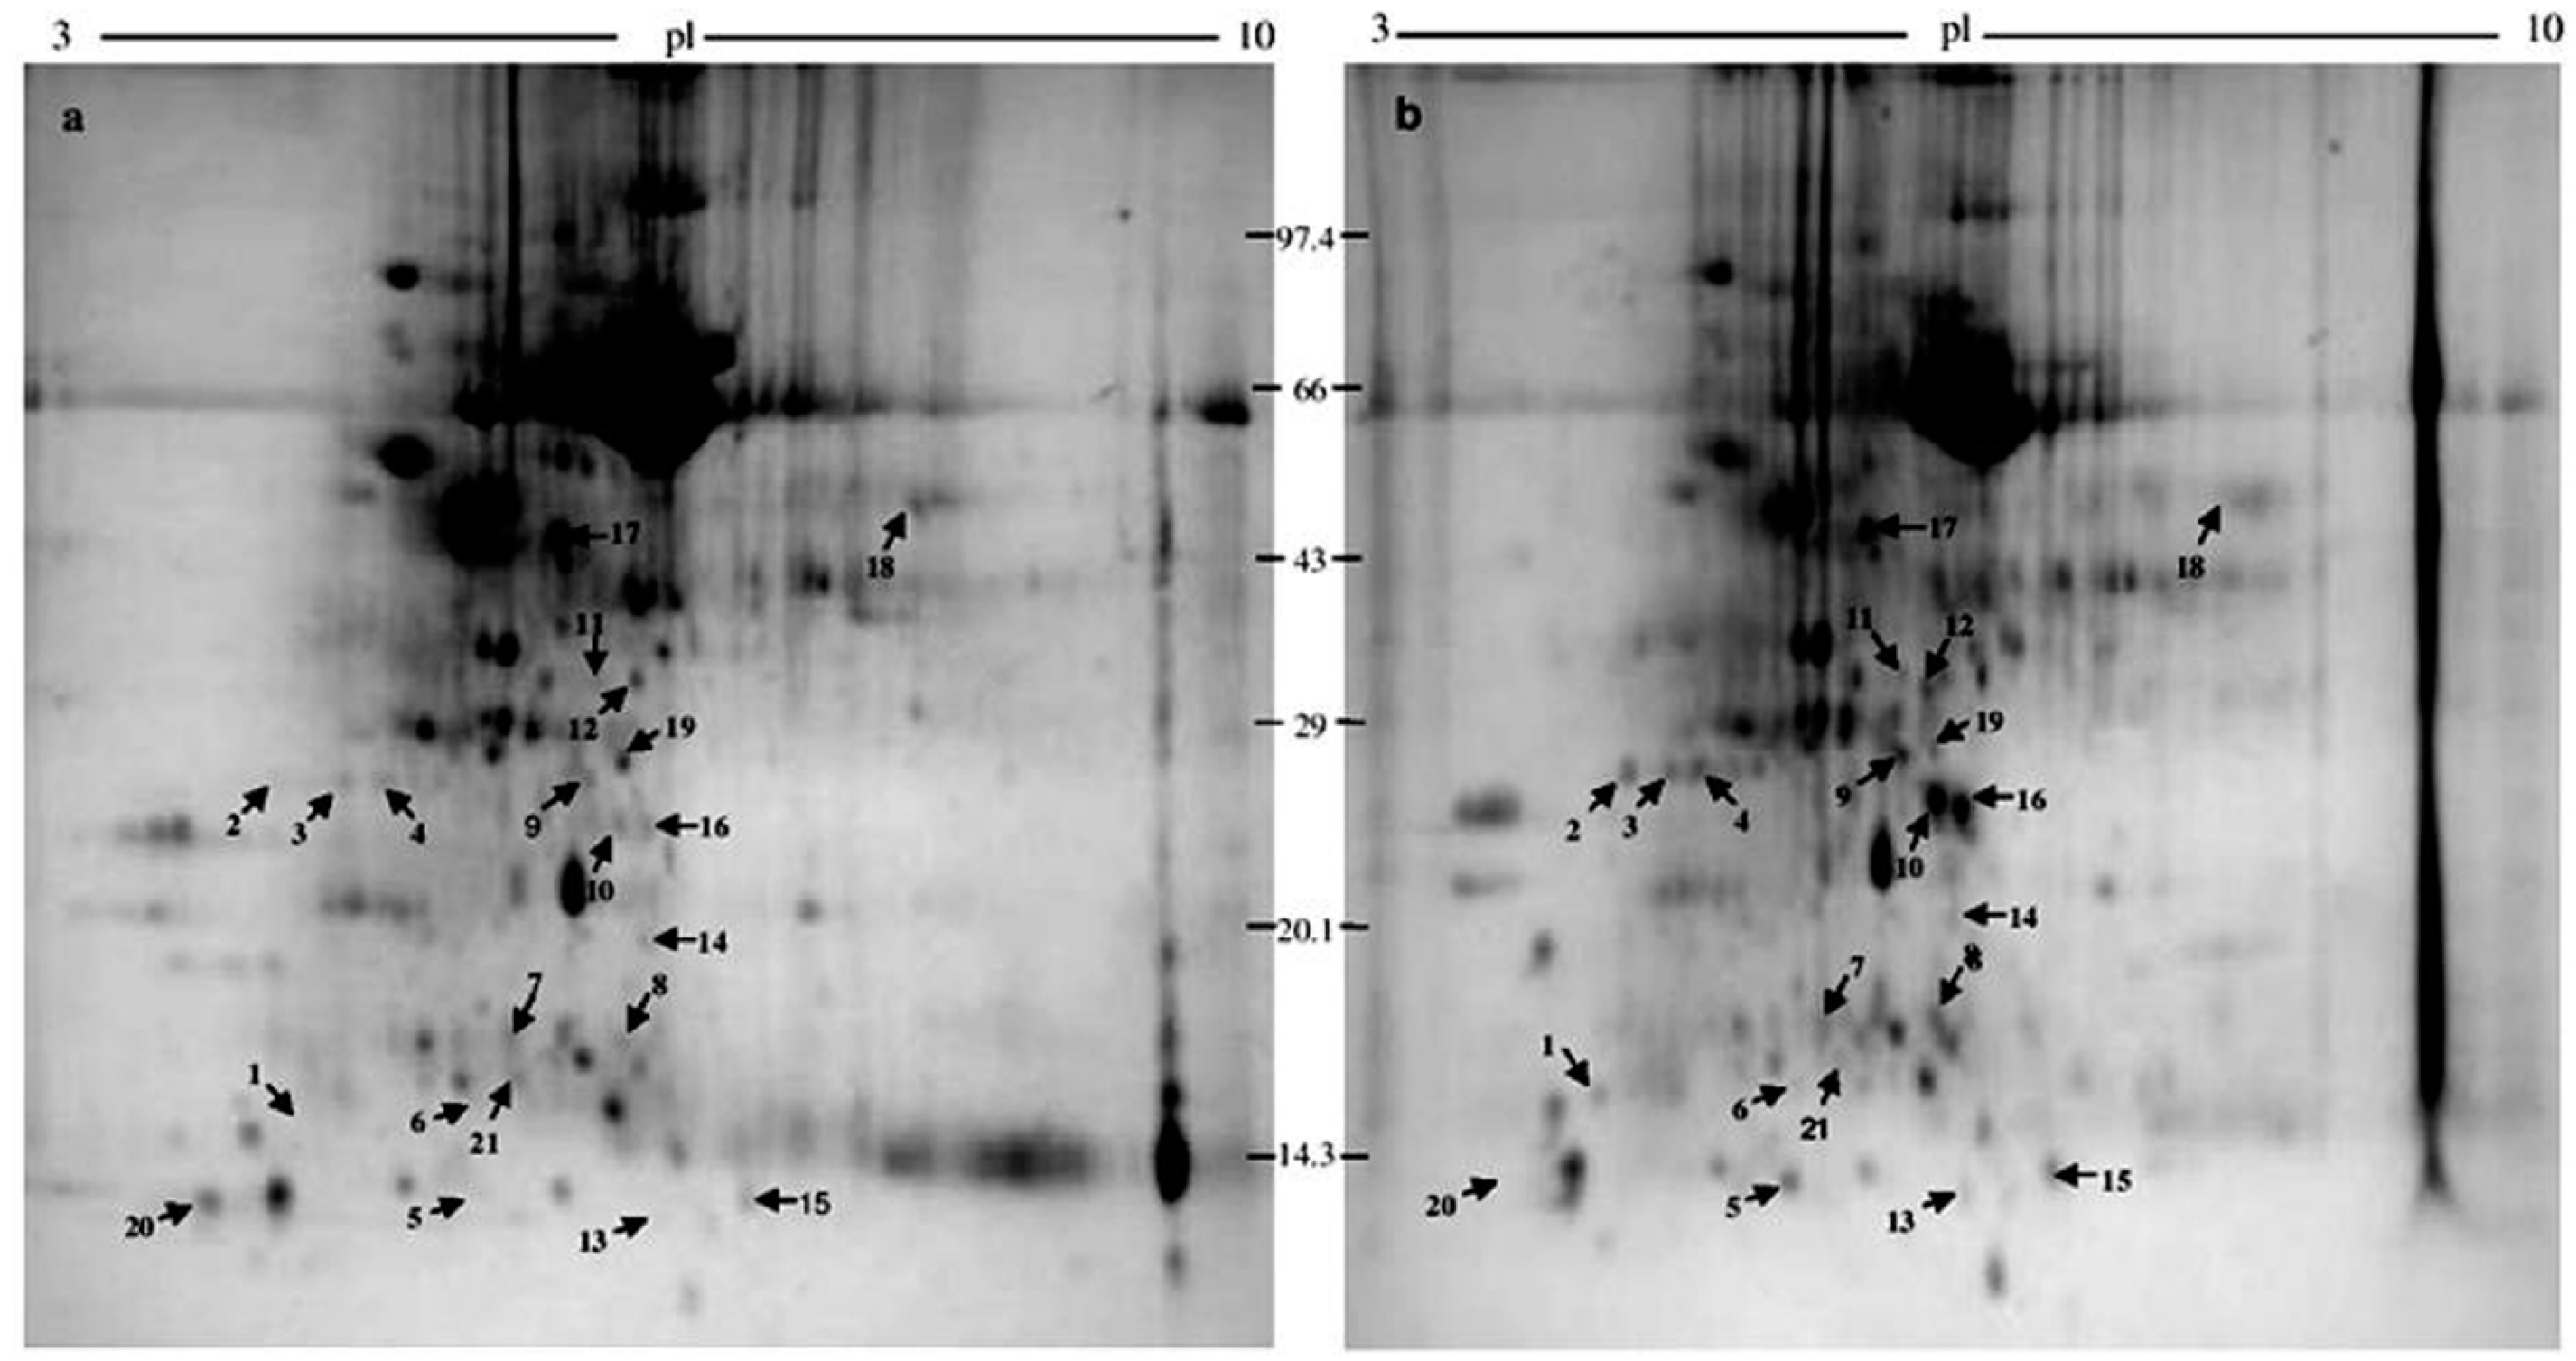
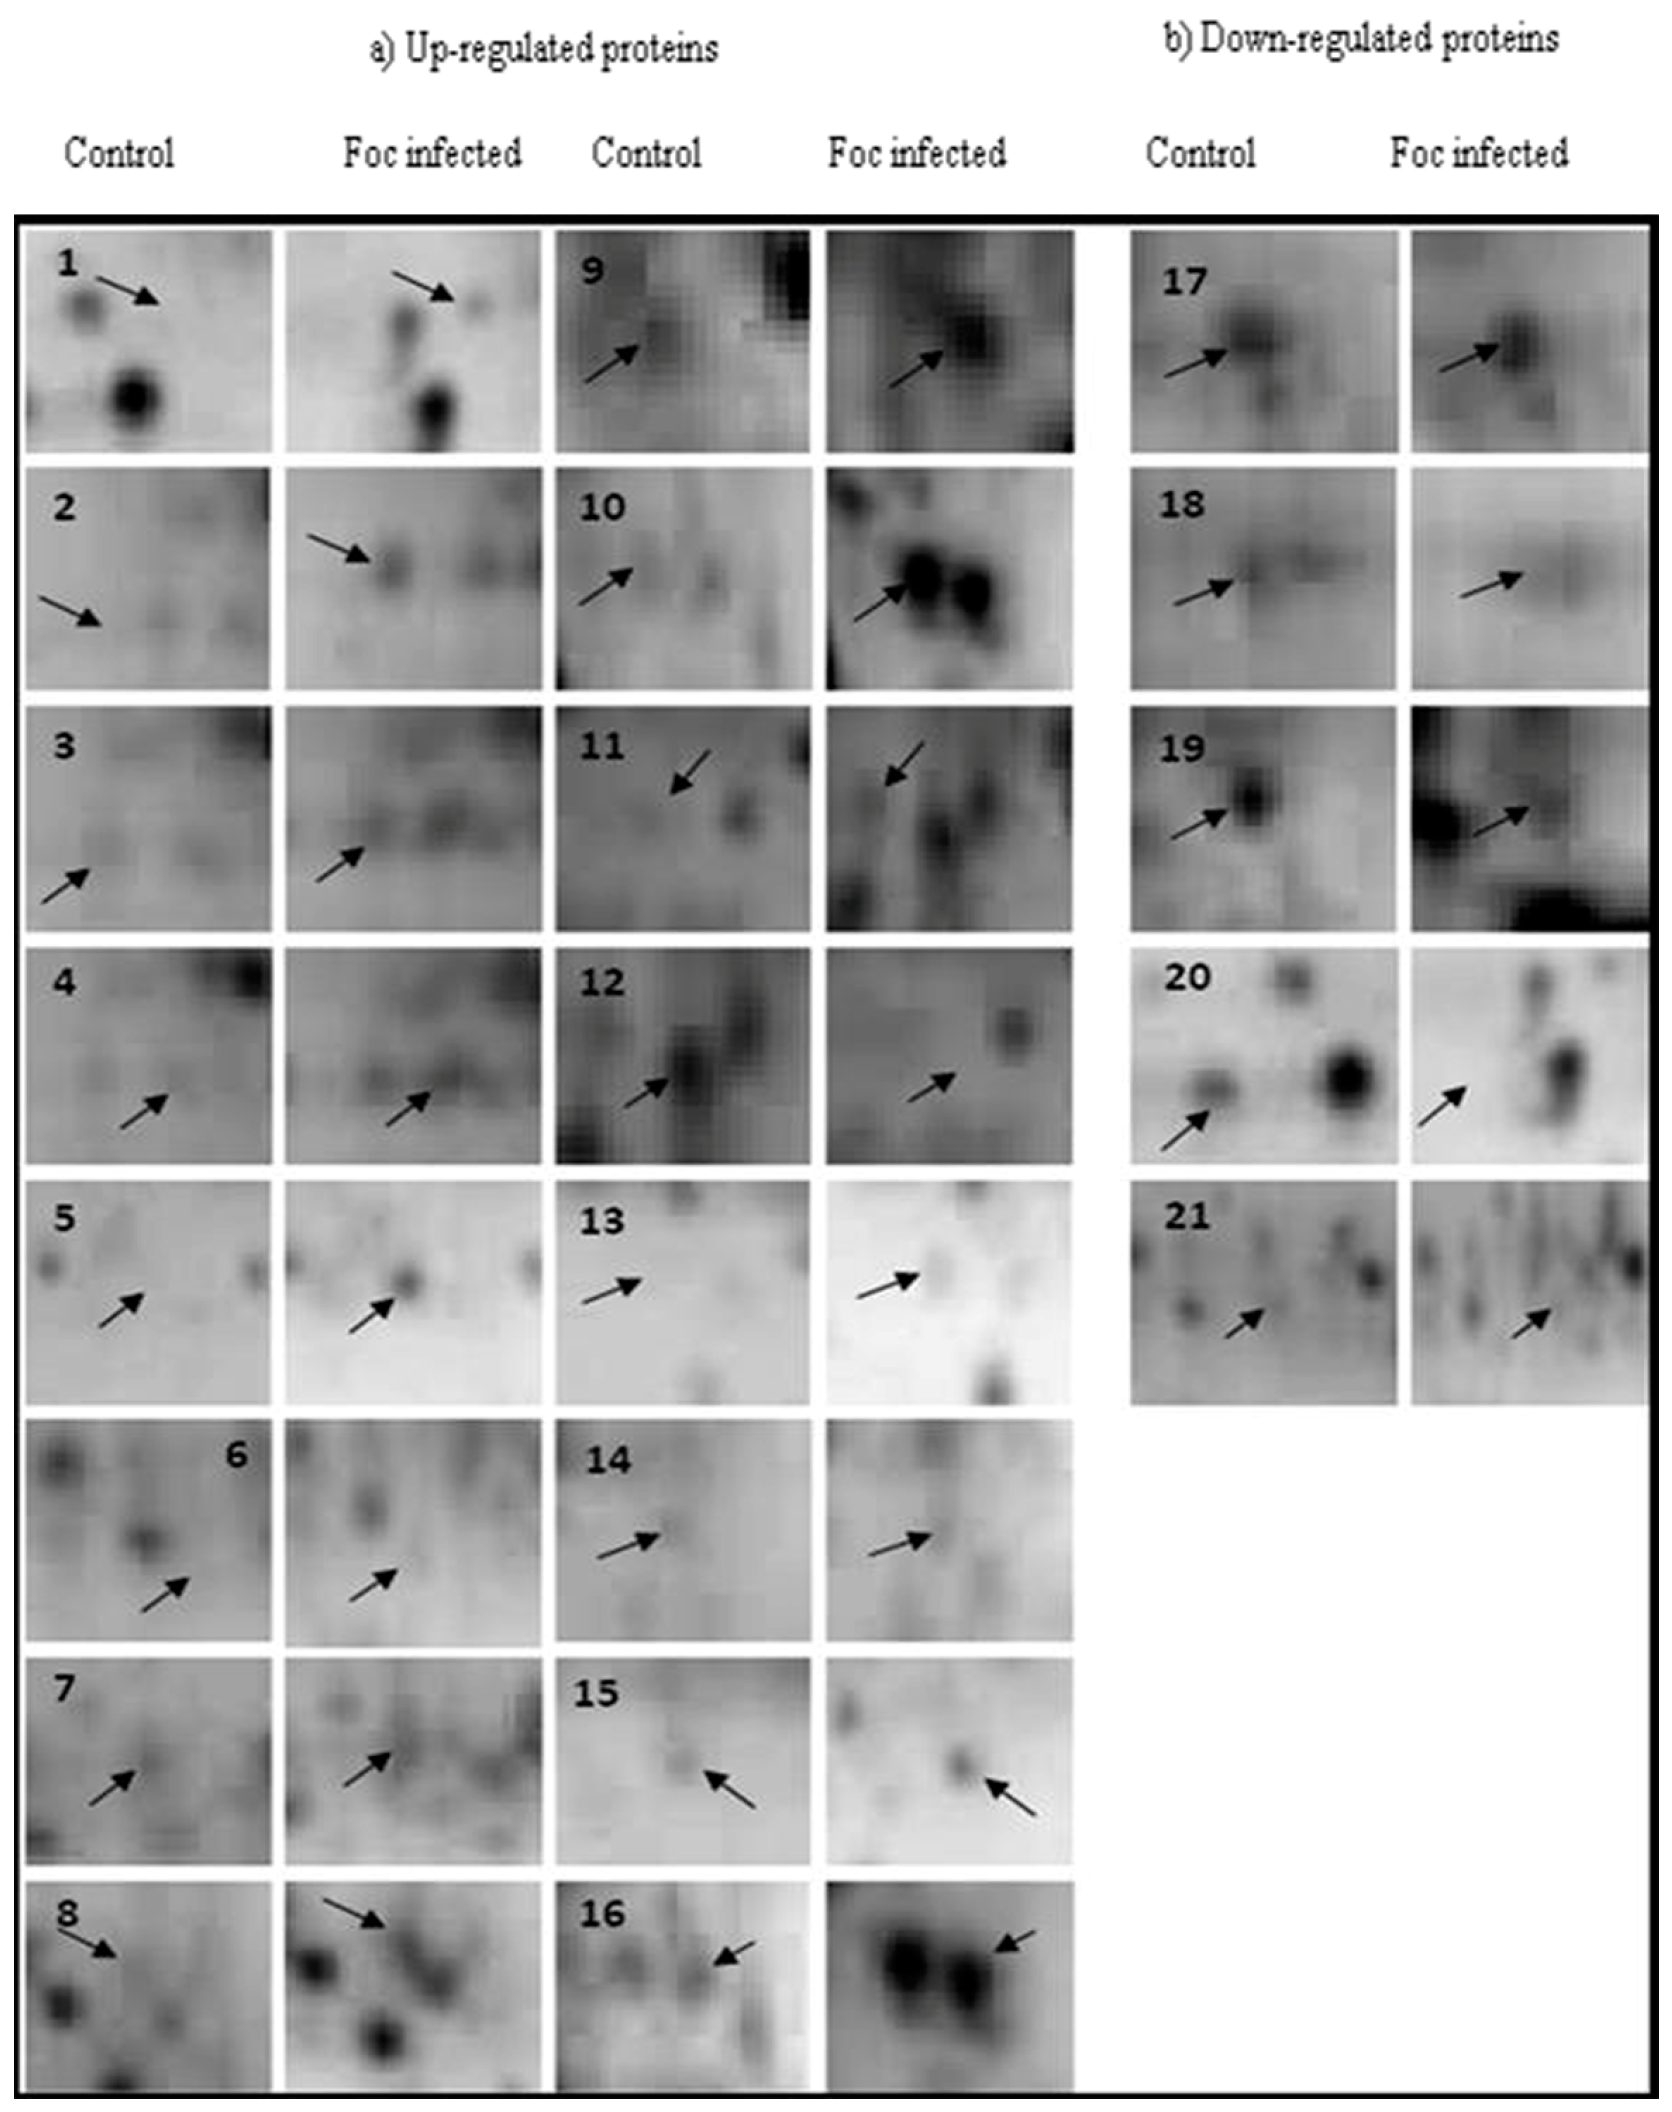
2.1. 2-DE
2.2. Protein Identification
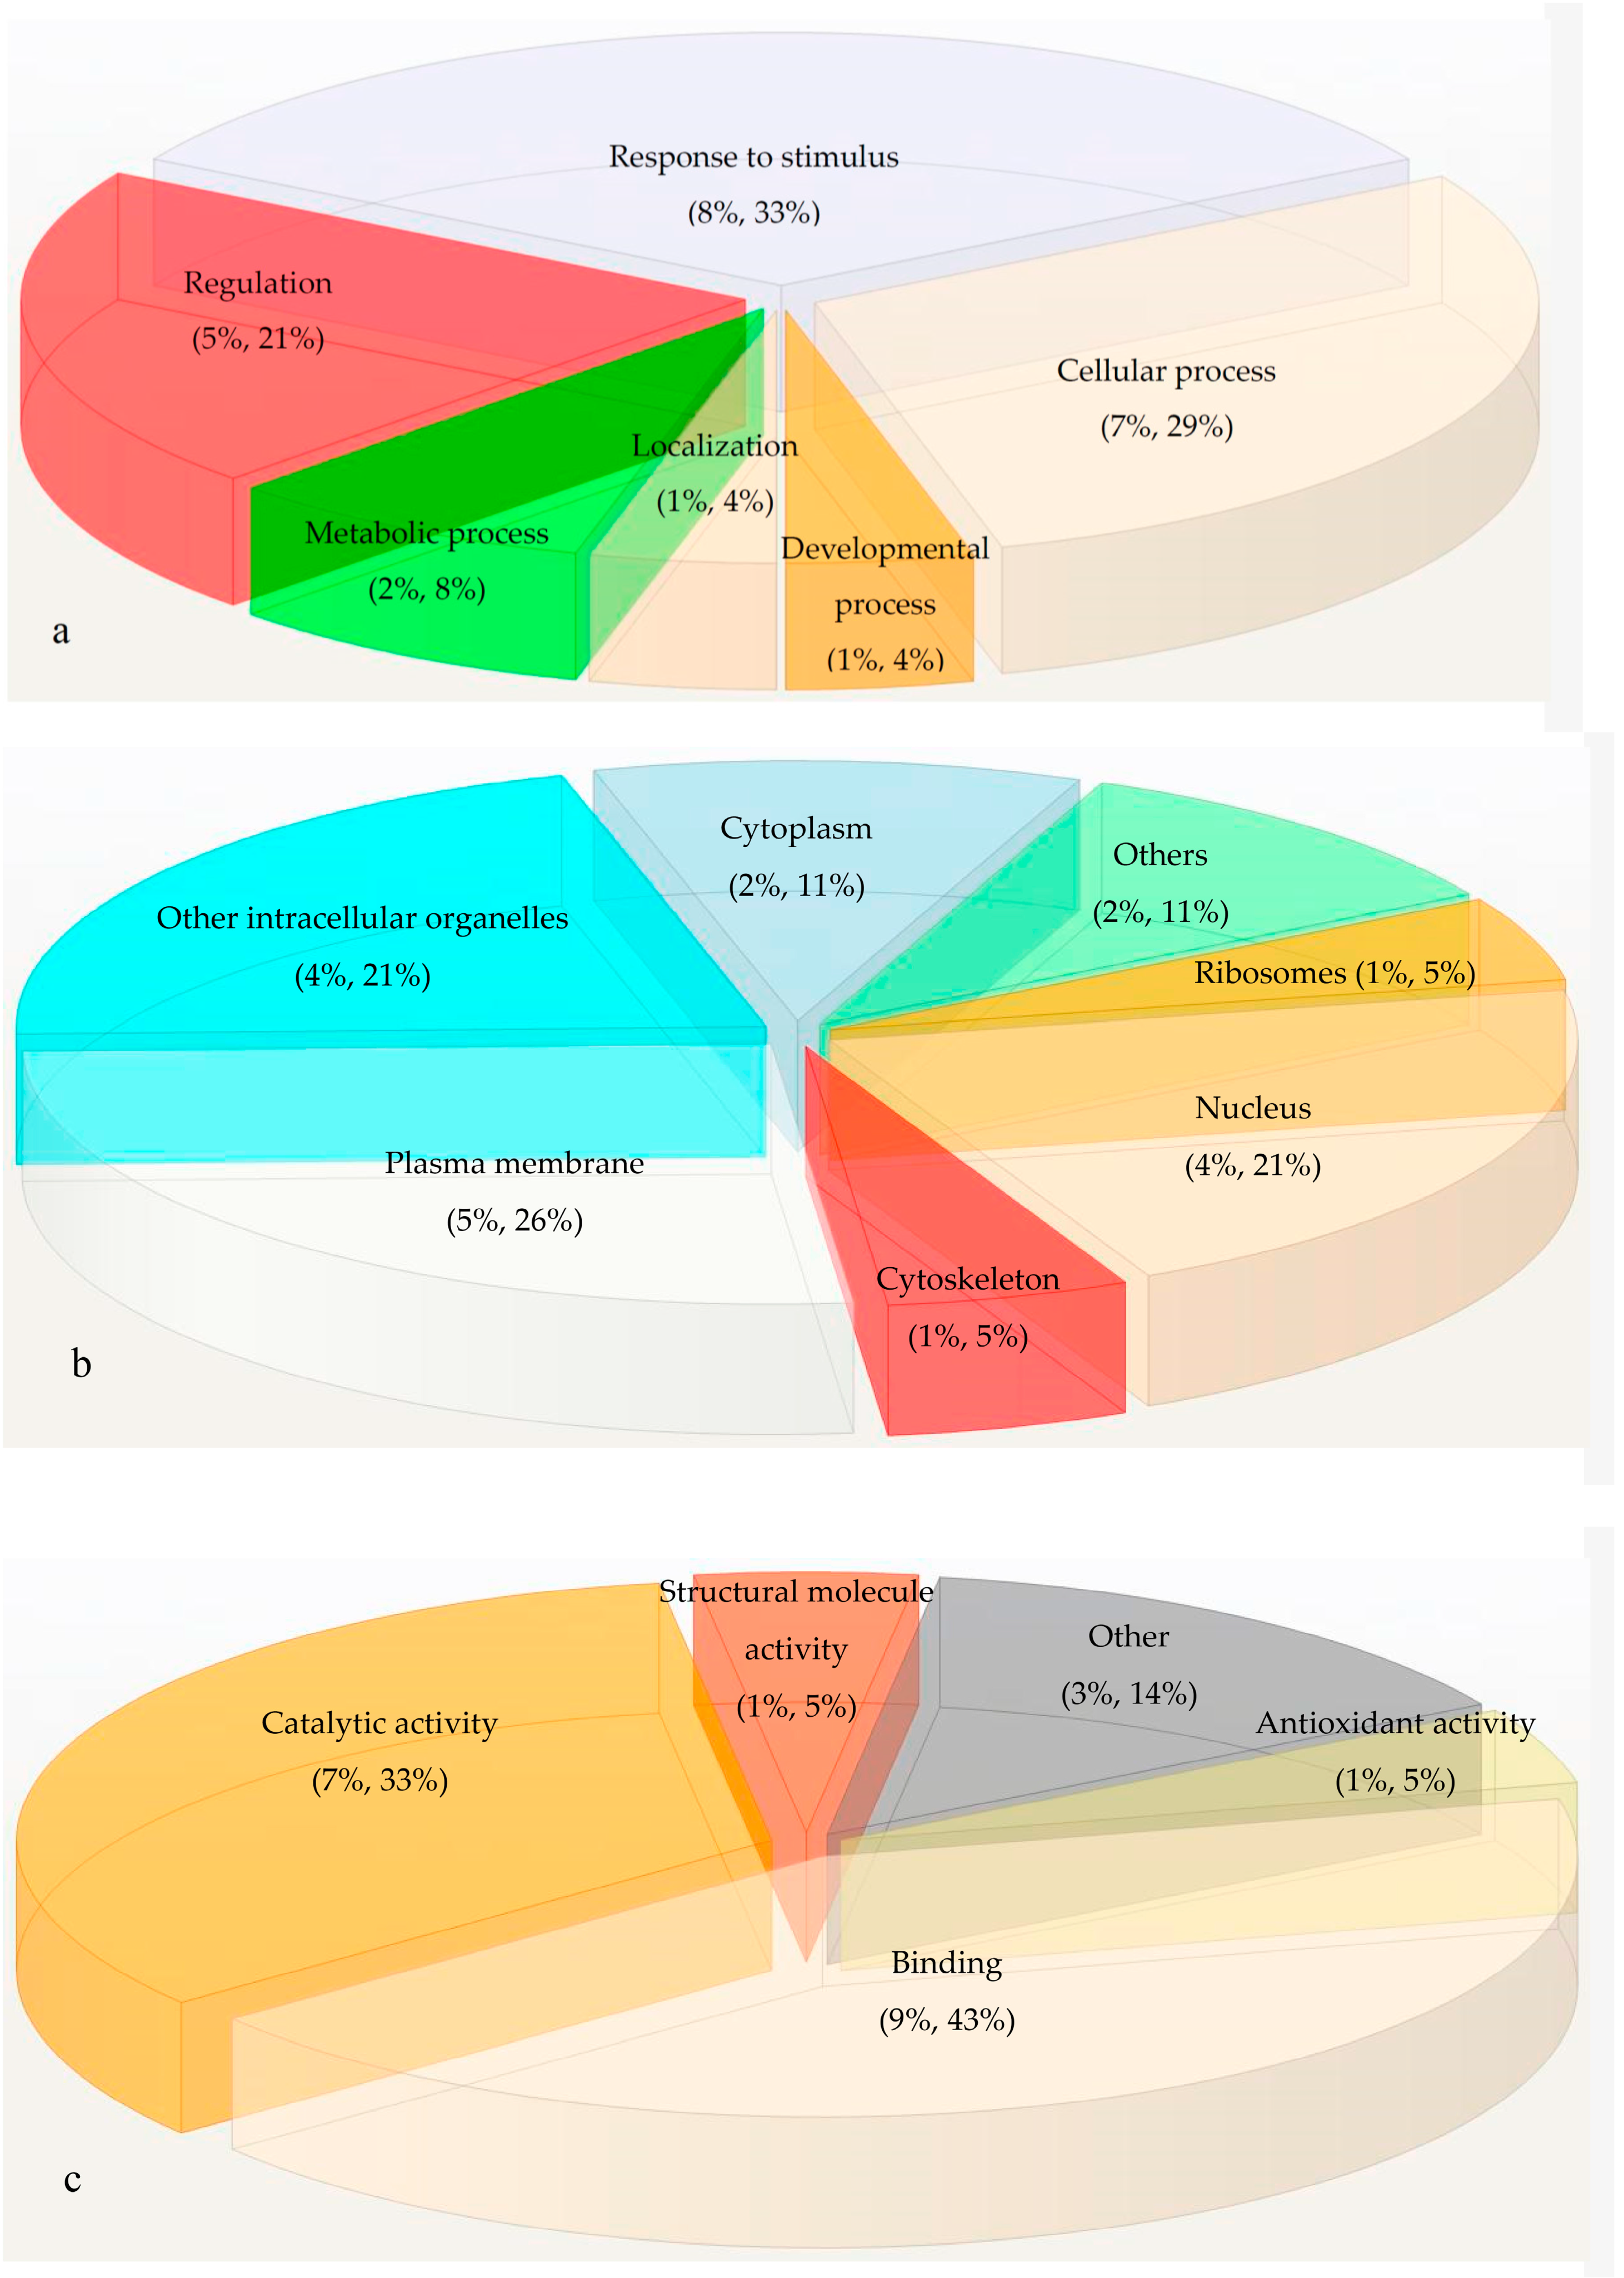
2.3. Gene Ontology
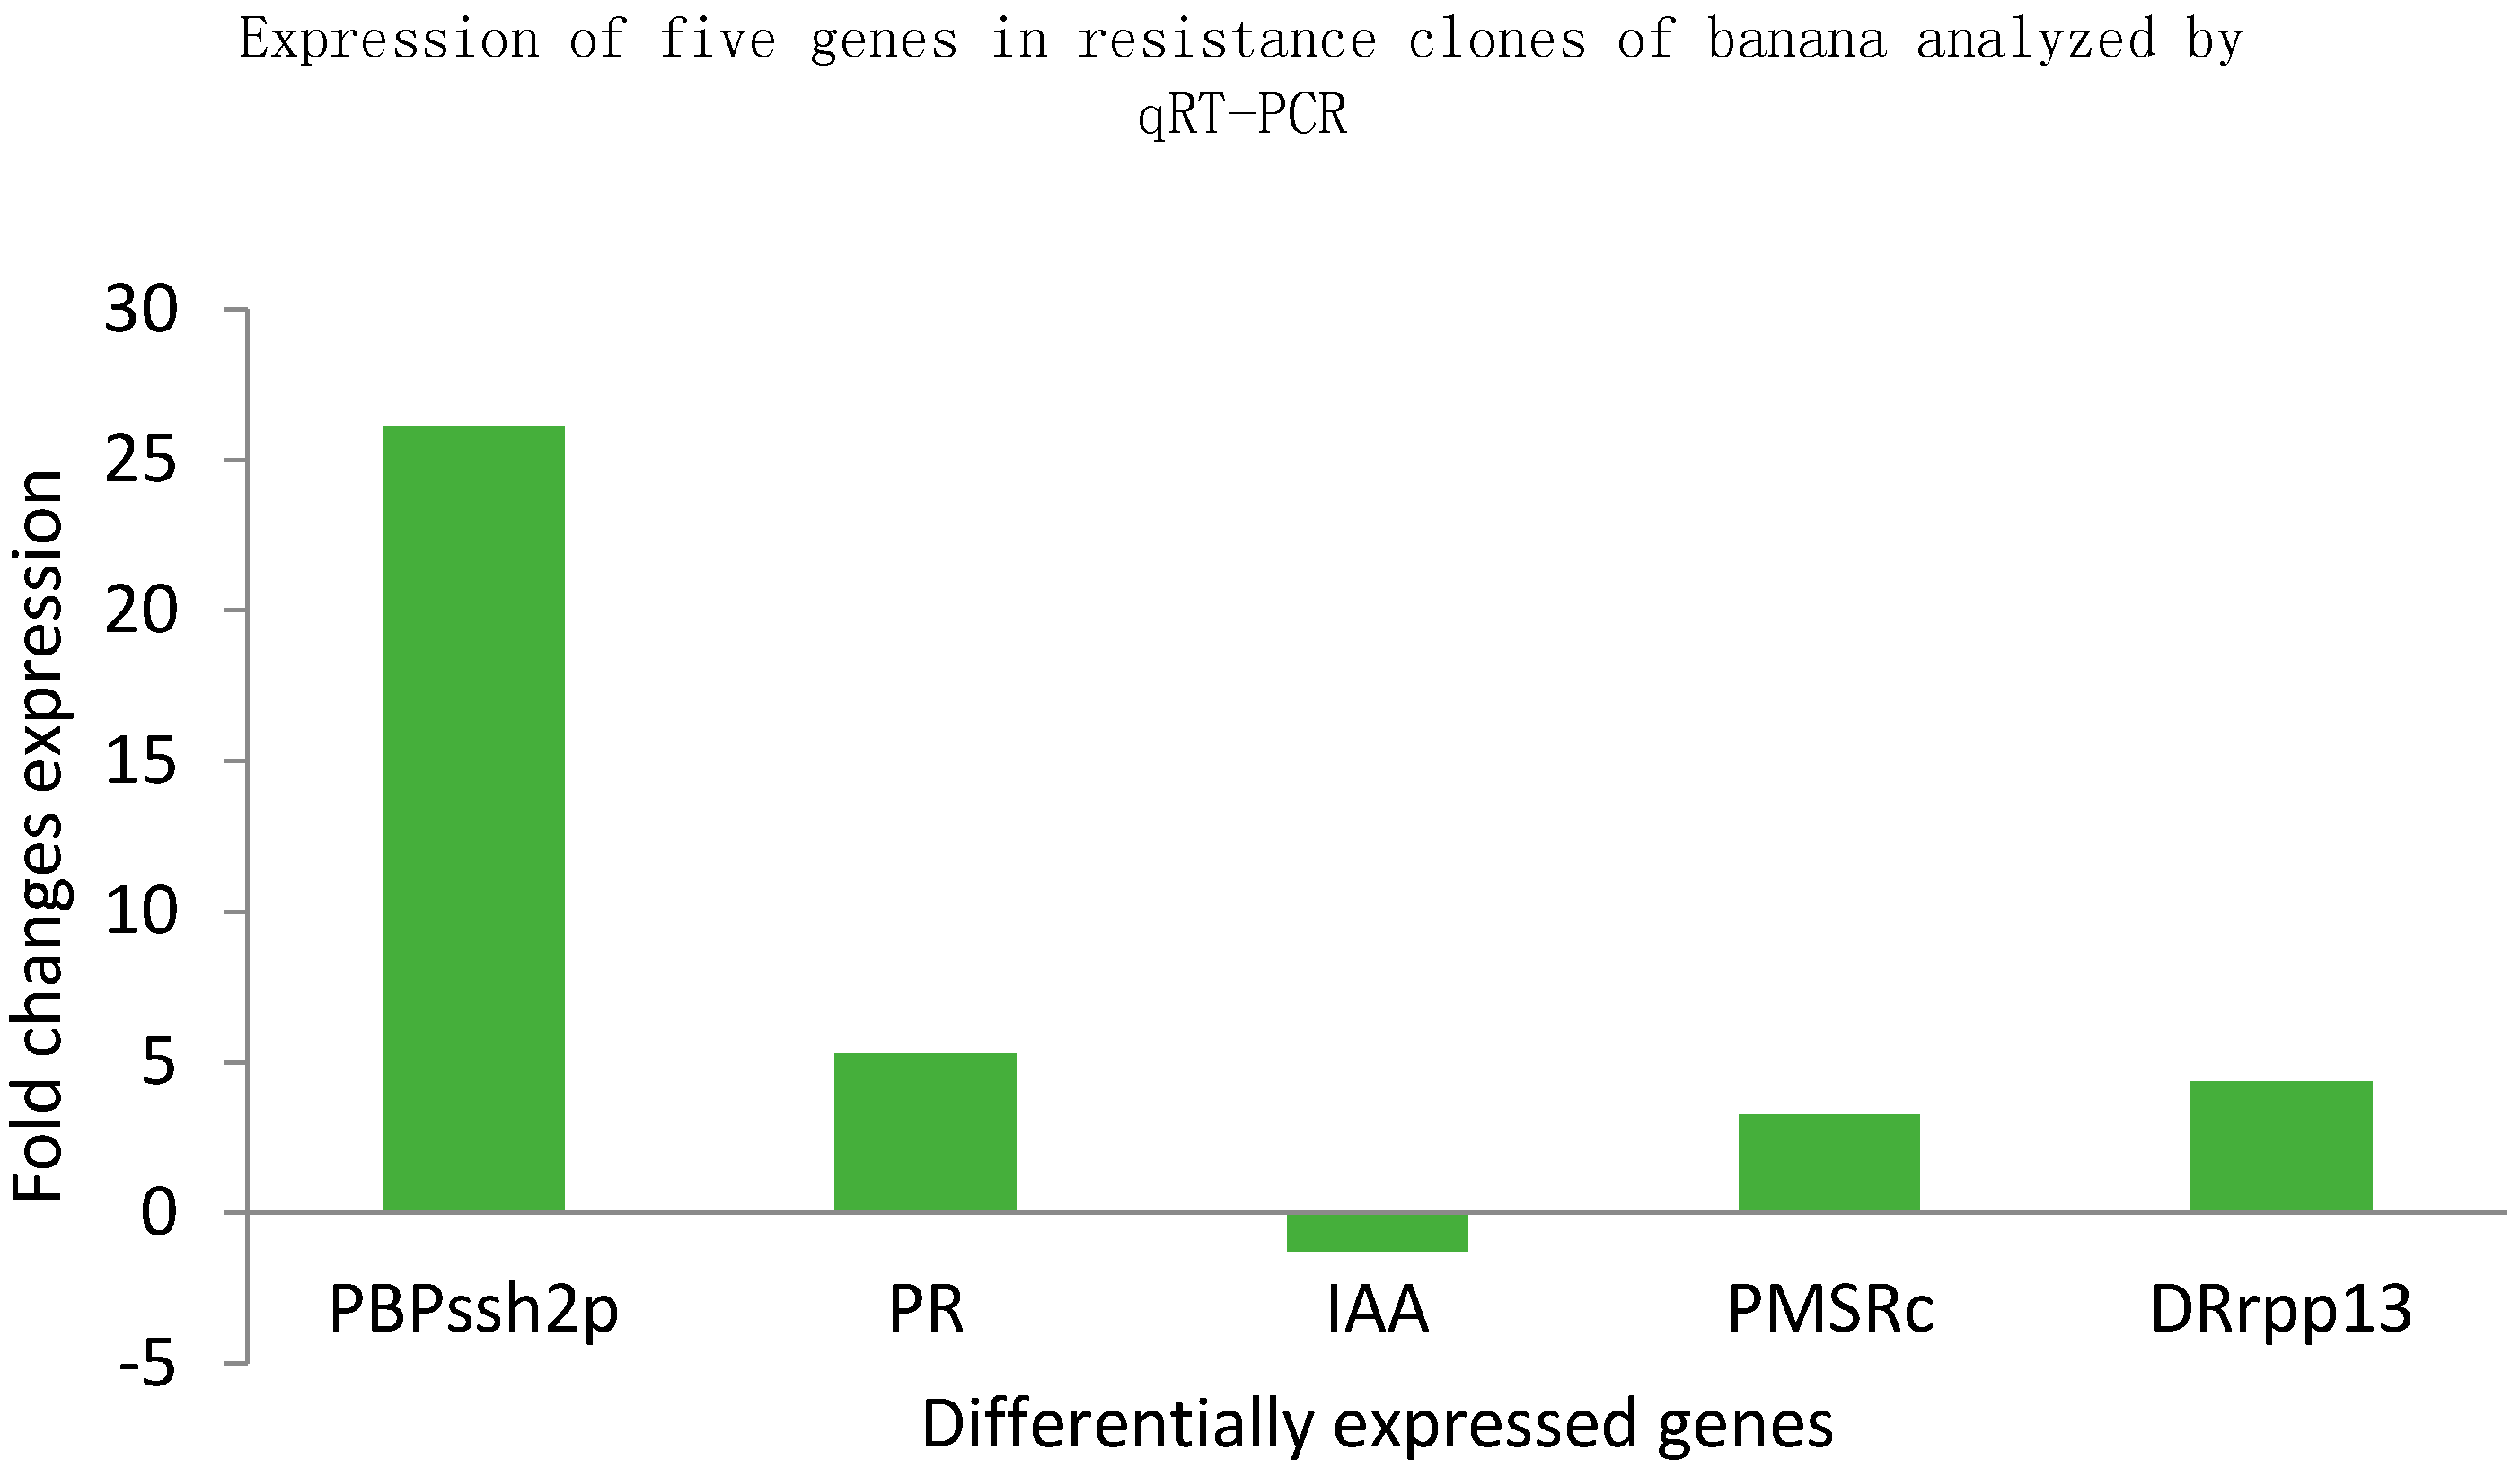
2.4. Quantitative Reverse Transcription PCR (qRT-PCR) Analysis
2.4.1. RNA Extraction and Quantification
2.4.2. Primer Design for qRT-PCR
2.4.3. Gene Expression
2.5. Protein Homology Modeling
2.6. Homology Modeling, Validation and Interaction Analysis
2.6.1. PR Protein
2.6.2. PMSRc Protein
2.6.3. PBPSSH2P Protein
2.6.4. IAA Protein
2.7. Active Pocket Prediction
2.8. Molecular Dynamic Simulation (MDS)
2.9. Docking Studies
2.9.1. Protein-Protein Docking
2.9.2. Protein-Ligand Docking
Docking of Modeled Protein with β 1, 3-Glucan
Docking of Modeled Proteins with the Fungal Chitin
3. Discussion
4. Materials and Methods
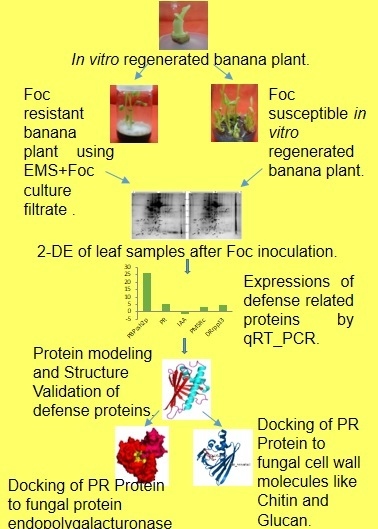
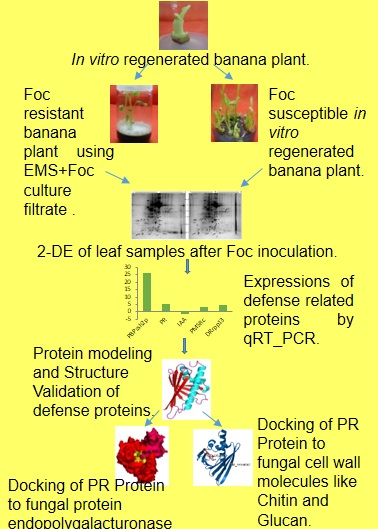
4.1. Inoculum Preparation and Sampling
4.2. Protein Extraction and 2-D Gel Electrophoresis
4.3. MALDI-TOF-MS Analysis
4.4. Gene Annotation
4.5. qRT-PCR Analysis
4.6. Sequence Alignment and Homology Modeling
4.7. Molecular Dynamic Simulation
4.8. Protein-Protein Docking
4.9. Determination of Protein-Protein Interactions
4.10. Protein-Ligand Docking
5. Conclusions
Supplementary Materials
Acknowledgments
Author Contributions
Conflicts of Interest
Abbreviations
| Foc | Fusarium oxysporum f. sp. Cubense |
| ITS | Internal transcribed spacer |
| PBPssh2p | Polyphosphoinositide binding protein ssh2p |
| IAA | Indoleacetic acid-induced-like |
| PR | Pathogenesis related protein |
| PG | Endopolygalacturonase |
| PMSRc | Peptide methionine sulfoxide reductase chloroplastic-like protein |
| 2-DE | Two-dimensional gel electrophoresis |
| FDR | False discovery rate |
| MALDI-TOF | Matrix-assisted laser desorption/ionization Time of Flight |
| Mw | Molecular weight |
| pI | Isoelectric point |
| qRT-PCR | Quantitative reverse transcription PCR |
| DRrpp13 | disease resistance rpp13-like protein 1-like |
| PDB | Protein Data Bank |
| GDT-TS | Global Distance Test Total Score |
| RMSD | Root Mean Square Deviation |
| CASTp | Computed Atlas of Surface Topography of proteins |
| Rg | radius of gyration |
| RMSF | root mean square deviation |
| GRAMM-X | lobal Range Molecular Matching |
References
- Prasad, K.V.S.R.G.; Bharathi, K.; Srinivasan, K.K. Evaluation of Musa (parasidica Linn Cultivar) “puttabale” stem juice for Antilithiatic activity in albino rats. Indian J. Physiol. Pharmacol. 1993, 37, 337–341. [Google Scholar] [PubMed]
- Venkatachalam, L. Molecular Characterization of Banana Var. Nanjanagudu Rasabale and Identification of Fruit Ripening Specific Products. Ph.D. Thesis, University of Mysore, Mysore, India, November 2008. [Google Scholar]
- Dita, M.A.; Waalwijk, C.; Buddenhagen, I.W.; Souza, M.T., Jr.; Kemab, G.H.J. A molecular diagnostic for tropical race 4 of the banana fusarium wilt pathogen. Plant Pathol. 2010, 59, 348–357. [Google Scholar] [CrossRef]
- Diener, A.C.; Ausubel, F.M. Resistance to Fusarium oxysporum 1, a dominant Arabidopsis disease-resistance gene, is not race specific. Genetics 2005, 171, 305–321. [Google Scholar] [CrossRef] [PubMed]
- Predieri, S. Mutation induction and tissue culture in improving fruits. Plant Cell Tiss Organ Cult. 2001, 64, 185–210. [Google Scholar] [CrossRef]
- Omar, M.S.; Novak, F.J.; Brunner, H. In vitro action of ethylmethanesulphonate on banana shoot tips. Sci. Hortic. 1989, 40, 283–295. [Google Scholar] [CrossRef]
- Bhagwat, B. Mutation breeding of banana cv. Highgate (Musa spp., AAA Group) for tolerance to Fusarium oxysporum f. sp. cubense using chemical mutagens. Sci. Hortic. 1998, 73, 11–22. [Google Scholar] [CrossRef]
- Matsumoto, K.; Barbosa, M.L.; Souza, L.A.C.; Teixeira, J.B. Race 1 Fusarium wilt tolerance on banana plants selected by fusaric acid. Euphytica 1995, 84, 67–71. [Google Scholar] [CrossRef]
- Svabova, L.; Lebeda, A. In vitro selection for improved plant resistance to toxin—Producing pathogens. J. Phytopathol. 2005, 153, 52–64. [Google Scholar] [CrossRef]
- De Ascensao, A.R.; Dubery, I.A. Panama Disease: Cell Wall Reinforcement in Banana Roots in Response to Elicitors from Fusarium oxysporum f. sp. cubense Race Four. J. Phytopathol. 2000, 90, 1173–1180. [Google Scholar]
- Ghag, S.B.; Shekhawat, U.K.S.; Ganapathi, T.R. Petunia floral defensins with unique prodomains as novel candidates for development of fusarium wilt resistance in transgenic banana plants. PLoS ONE 2012, 7, e39557. [Google Scholar] [CrossRef] [PubMed]
- Mahdavi, F.; Sariah, M.; Maziah, M. Expression of rice thaumatin-like protein gene in transgenic banana plants enhances resistance to Fusarium wilt. Appl. Biochem. Biotechnol. 2012, 166, 1008–1019. [Google Scholar] [CrossRef] [PubMed]
- Noelani, V.D.B.; Berger, D.K.; Hein, I.; Birch, P.R.; Wingfield, M.J.; Viljoen, A. Tolerance in banana to Fusarium wilt is associated with early up-regulation of cell wall-strengthening genes in the roots. Mol. Plant Pathol. 2007, 8, 333–341. [Google Scholar]
- Li, C.Y.; Deng, G.M.; Yang, J.; Viljoen, A.; Jin, Y.; Kuang, R.B. Transcriptome profiling of resistant and susceptible Cavendish banana roots following inoculation with Fusarium oxysporum f. sp. cubense tropical race 4. BMC Genom. 2012, 13, 374. [Google Scholar] [CrossRef] [PubMed]
- Carpentier, S.C.; Witters, E.; Laukens, K.; Onckelen, H.V.; Swennen, R.; Panis, B. Banana (Musa spp.) as a model to study the meristem proteome: Acclimation to osmotic stress. Proteomics 2007, 7, 92–105. [Google Scholar] [CrossRef] [PubMed]
- Yang, Q.S.; Wu, J.H.; Li, C.Y.; Wei, Y.R.; Sheng, O.; Hu, C.H. Quantitative proteomic analysis reveals that antioxidation mechanisms contribute to cold tolerance in plantain (Musa paradisiaca L.; ABB Group) seedlings. Mol. Cell. Proteom. 2012, 11, 1853–1869. [Google Scholar] [CrossRef] [PubMed]
- Esteve, C.; D’amato, A.; Marina, M.L.; Garcia, M.C.; Righetti, P.G. In-depth proteomic analysis of banana (Musa spp.) fruit with combinatorial peptide ligand libraries. Electrophoresis 2013, 34, 207–214. [Google Scholar] [CrossRef] [PubMed]
- Martin, G.; Baurens, F.C.; Cardi, C.; Aury, J.M.; D’hont, A. The complete chloroplast genome of banana (Musa acuminata, Zingiberales): Insight into plastid monocotyledon evolution. PLoS ONE 2013, 8, e67350. [Google Scholar] [CrossRef] [PubMed]
- D’Hont, A.; Denoeud, F.; Aury, J.M.; Baurens, F.C.; Carreel, F.; Garsmeur, O. The banana (Musa acuminata) genome and the evolution of monocotyledonous plants. Nature 2012, 488, 213–217. [Google Scholar] [CrossRef] [PubMed]
- Li, X.; Bai, T.; Li, Y.; Ruan, X.; Li, H. Proteomic analysis of Fusarium oxysporum f. sp. cubense tropical race 4-inoculated response to Fusarium wilts in the banana root cells. Proteome Sci. 2013, 11, 1–14. [Google Scholar]
- Lu, Y.; Liao, D.; Pu, J.; Qi, Y.; Xie, Y. Proteome analysis of resistant and susceptible Cavendish banana roots following inoculation with Fusarium oxysporum f. sp. cubense. Physiol. Mol. Plant Pathol. 2013, 84, 163–171. [Google Scholar] [CrossRef]
- Venkatesh; Krishna, V.; Kumar, K.G.; Pradeepa, K.; Santosh Kumar, S.R.; Kumar, R.S. Biochemical markers assisted screening of Fusarium wilt resistant Musa paradisiaca (L.) cv. puttabale micropropagated clones. Indian J. Exp. Biol. 2013, 51, 531–542. [Google Scholar] [PubMed]
- Venkatesh; Krishna, V.; Kumar, K.G.; Pradeepa, K.; Kumar, S.R.; Gnanesh, A.U. High frequency regeneration from the leaf callus of Musa paradisiaca cv.”puttabale” (AB genome) in Malnad region of the Western ghats. Int. J. Curr. Res. 2012, 4, 13–17. [Google Scholar]
- Girish Kumar, K.; Krishna, V.; Venkatesh; Pradeep, K. High frequency regeneration of plantlets from immature male floral explants of Musa paradisica cv. Puttabale—AB genome. Plant Tissue Cult. Biotechnol. 2011, 21, 199–205. [Google Scholar]
- Apel, K.; Hirt, H. Reactive oxygen species: Metabolism, oxidative stress, and signal transduction. Annu. Rev. Plant Biol. 2004, 55, 373–399. [Google Scholar] [CrossRef] [PubMed]
- Vieira Dos Santos, C.; Cuine, S.; Rouhier, N.; Rey, P. The Arabidopsis plastidic methionine sulfoxide reductase B proteins. Sequence and activity characteristics, comparison of the expression with plastidic methionine sulfoxide reductase A, and induction by photooxidative stress. Plant Physiol. 2005, 138, 909–922. [Google Scholar] [CrossRef] [PubMed]
- Ezraty, B.; Aussel, L.; Barras, F. Methionine sulfoxide reductases in prokaryotes. Biochim. Biophys. Acta 2005, 1703, 221–229. [Google Scholar] [CrossRef] [PubMed]
- Stadtman, E.R.; Van Remmen, H.; Richardson, A.; Wehr, N.B.; Levine, R.L. Methionine oxidation and aging. Biochim. Biophys. Acta 2005, 1703, 135–140. [Google Scholar] [CrossRef] [PubMed]
- Tarrago, L.; Laugier, E.; Rey, P. Protein-repairing methionine sulfoxide reductases in photosynthetic organisms: Gene organization, reduction mechanisms, and physiological roles. Mol. Plant 2009, 2, 202–217. [Google Scholar] [CrossRef] [PubMed]
- Chatelain, E.; Satour, P.; Laugier, E.; Vu, B.L.; Payet, N.; Rey, P.; Montrichard, F. Evidence for participation of the methionine sulfoxide reductase repair system in plant seed longevity. Proc. Natl. Acad. Sci. 2013, 110, 3633–3638. [Google Scholar] [CrossRef] [PubMed]
- Swarupa, V.; Ravishankar, K.V.; Rekha, A. Plant defense response against Fusarium oxysporum and strategies to develop tolerant genotypes in banana. Planta 2014, 239, 735–751. [Google Scholar] [CrossRef] [PubMed]
- Philips, S.E.; Vincent, P.; Rizzieri, K.E.; Schaaf, G.; Bankaitis, V.A.; Gaucher, E.A. The diverse biological functions of phosphatidylinositol transfer proteins in eukaryotes. Crit. Rev. Biochem. Mol. 2006, 4, 21–29. [Google Scholar] [CrossRef] [PubMed]
- Beckman, C.H. Phenolic-storing cells: Keys to programmed cell death and periderm formation in wilt disease resistance and in general defence responses in plants? Physiol. Mol. Plant Pathol. 2000, 57, 101–110. [Google Scholar] [CrossRef]
- Fernandez-Falcon, M.; Borges, A.A.; Borges-Perez, A. Induced resistance to Fusarium wilt of banana by exogenous applications of indoleacetic acid. Phytoprotect 2003, 84, 149–153. [Google Scholar] [CrossRef]
- Subarna, T.; Bothra, K.A.; Sur, S.; Sen, A. Modeling and molecular dynamics simulation of PR-1 protein from Solanum tuberosum, an integral part of plant defense. Int. J. Biol. Chem. Sci. 2010, 4, 1251–1261. [Google Scholar]
- Ferrari, S.; Savatin, D.V.; Sicilia, F.; Gramegna, G.; Cervone, F.; Lorenzo, G.D. Oligogalacturonides: Plant damage-associated molecular patterns and regulators of growth and development. Front. Plant Sci. 2013, 4, 49. [Google Scholar] [CrossRef] [PubMed]
- Ridley, B.L.; O’neill, M.A.; Mohnen, D. Pectins: Structure, biosynthesis, and oligogalacturonide-related signaling. Phytochemistry 2001, 57, 929–967. [Google Scholar] [CrossRef]
- Maulik, A.; Ghosh, H.; Basu, S. Comparative study of protein-protein interaction observed in PolyGalacturonase-Inhibiting Proteins from Phaseolus vulgaris and Glycine max and PolyGalacturonase from Fusarium moniliforme. BMC Genom. 2009, 10, S19. [Google Scholar] [CrossRef] [PubMed]
- Jorda, L.; Vera, P. Local and systemic induction of two defense-related subtilisin-like protease promoters in transgenic Arabidopsis plants. Luciferin induction of PR gene expression. Plant Physiol. 2000, 124, 1049–1058. [Google Scholar] [CrossRef] [PubMed]
- Kruger, J.; Thomas, C.M.; Golstein, C.; Dixon, M.S.; Smoker, M.; Tang, S. A tomato cysteine protease required for Cf-2-dependent disease resistance and suppression of autonecrosis. Science 2002, 296, 744–747. [Google Scholar] [CrossRef] [PubMed]
- Yadav, B.S.; Tripathi, V.; Kumar, A.; Khan, M.F.; Barate, A. Molecular modeling and docking characterization of Dectin-1 (PAMP) receptor of Bubalus bubalis. Exp. Mol. Pathol. 2012, 92, 7–12. [Google Scholar] [CrossRef]
- Zhu, T.; Song, F.; Zheng, Z. Molecular characterization of the rice pathogenesis- related protein, OsPR-4b, and its antifungal activity against Rhizoctonia solani. J. Phytopathol. 2006, 154, 378–384. [Google Scholar] [CrossRef]
- Ali, M.; Mehmood, M.A.; Hussain, K.; Sehar, U.; Khalid, R.R.; Iqbal, Z. Functional Annotation of the cda1 Gene from Bacillus thuringiensis through Homology Modeling and Molecular Docking. Pak. J. Life Soc. Sci. 2013, 11, 190–195. [Google Scholar]
- Venkatesh; Krishna, V.; Pradeepa, K.; Santosh Kumar, S.R.; Nagaraja, D.; Mohan Kumar, S.P.; Santhosh Kumar, J.U. Identification and characterization of panama wilt causing fungal isolates to Musa paradisiaca cv. puttabale. Int. J. Appl. Sci. Biotechnol. 2014, 2, 420–425. [Google Scholar] [CrossRef]
- Carpentier, S.C.; Witters, E.; Laukens, K.; Deckers, P.; Swennen, R.; Panis, B. Preparation of protein extracts from recalcitrant plant tissues: An evaluation of different methods for two-dimensional gel electrophoresis analysis. Proteomics 2005, 5, 2497–2507. [Google Scholar] [CrossRef] [PubMed]
- Benjamini, Y.; Hochberg, Y. Controlling the False Discovery Rate: A practical and powerful approach to multiple testing. J. R. Stat. Soc. B 1995, 57, 289–300. [Google Scholar]
- Jensen, O.N.; Wilm, M.; Shevchenko, A.; Mann, M. Sample preparation methods for mass spectrometric peptide mapping directly from 2-DE gels. Methods Mol. Biol. 1999, 112, 513–530. [Google Scholar] [PubMed]
- Droc, G.; Lariviere, D.; Guignon, V.; Yahiaoui, N.; This, D.; Garsmeur, O.; Dereeper, A.; Hamelin, C.; Argout, X.; Dufayard, J.F.; et al. The banana genome hub. Database 2013, Article ID bat035. [Google Scholar] [CrossRef]
- Helsens, K.; Martens, L.; Vandekerckhove, J.; Gevaert, K. MascotDatfile: An open-source library to fully parse and analyse MASCOT MS/MS search results. Proteomics 2007, 7, 364–366. [Google Scholar] [CrossRef] [PubMed]
- Bhatia, V.N.; Perlman, D.H.; Costello, C.E.; McComb, M.E. Software tool for researching annotations of proteins: Open-source protein annotation software with data visualization. Anal. Chem. 2009, 81, 9819–9823. [Google Scholar] [CrossRef] [PubMed]
- Untergasser, A.; Nijveen, H.; Rao, X.; Bisseling, T.; Geurts, R.; Leunissen, J.A. Primer3Plus, an enhanced web interface to Primer3. Nucleic Acids Res. 2007, 35, 71–74. [Google Scholar] [CrossRef] [PubMed]
- Schmittgen, T.D.; Livak, K.J. Analyzing real-time PCR data by the comparative CT method. Nat. Protoc. 2008, 3, 1101–1108. [Google Scholar] [CrossRef] [PubMed]
- Kim, D.E.; Chivian, D.; Baker, D. Protein structure prediction and analysis using the Robetta server. Nucleic Acids Res. 2004, 32, 526–531. [Google Scholar] [CrossRef] [PubMed]
- Wiederstein, M.; Sippl, M.J. ProSA-web: Interactive web service for the recognition of errors in three-dimensional structures of proteins. Nucleic Acids Res. 2007, 35, 407–410. [Google Scholar] [CrossRef] [PubMed]
- Pawlowski, M.; Gajda, M.J.; Matlak, R.; Bujnicki, J.M. MetaMQAP: A Meta-Server for the Quality Assessment of Protein Models. Bioinformatics 2008, 9, 1–20. [Google Scholar] [CrossRef] [PubMed]
- Zemla, A. LGA: A method for finding 3D similarities in protein structures. Nucleic Acids Res. 2003, 31, 3370–3374. [Google Scholar] [CrossRef] [PubMed]
- Frishman, D.; Argos, P. Knowledge-based protein secondary structure assignment. Proteins 1995, 23, 566–579. [Google Scholar] [CrossRef] [PubMed]
- Dundas, J.; Ouyang, Z.; Tseng, J.; Binkowski, A.; Turpaz, Y.; Liang, J. CASTp: Computed atlas of surface topography of proteins with structural and topographical mapping of functionally annotated residues. Nucleic Acids Res. 2006, 34, 116–118. [Google Scholar] [CrossRef] [PubMed]
- Lindahl, E.; Hess, B.; Spoel, D. GROMACS 3.0: A package for molecular simulation and trajectory analysis. J. Mol. Model. 2001, 7, 306–317. [Google Scholar]
- Berendsen, H.J.C.; Postma, J.P.M.; Van Gunsteren, W.F.; DiNola, A.; Haak, J.R. Molecular dynamics with coupling to an external bath. J. Chem. Phys. 1984, 81, 3684–3690. [Google Scholar] [CrossRef]
- Tovchigrechko, A.; Vakser, I.A. GRAMM-X public web server for protein-protein docking. Nucleic Acids Res. 2006, 34, 310–314. [Google Scholar] [CrossRef] [PubMed]
- Tina, K.G.; Bhadra, R.; Srinivasan, N. PIC: Protein Interactions Calculator. Nucleic Acids Res. 2007, 35, 473–476. [Google Scholar] [CrossRef] [PubMed]
- Sowdhamini, R.; Alva, V.; Syamala Devi, D.P. COILCHECK: An interactive server for the analysis of interface regions in coiled coils. Protein Peptide Lett. 2008, 15, 33–38. [Google Scholar] [CrossRef]
- Krissinel, E.; Henrick, K. Inference of macromolecular assemblies from crystalline–state. J. Mol. Bio. 2007, 372, 774–797. [Google Scholar] [CrossRef] [PubMed]
- Morris, G.M.; Huey, R.; Lindstrom, W.; Sanner, M.F.; Belew, R.K.; Goodsell, D.S. AutoDock4 and AutoDockTools4: Automated docking with selective receptor flexibility. J. Comput. Chem. 2009, 30, 2785–2791. [Google Scholar] [CrossRef] [PubMed]
- Receveur-Bréchot, V.; Czjzek, M.; Barre, A.; Roussel, A.; Peumans, W.J.; Van Damme, E.J.; Rouge, P. Crystal structure at 1.45-A resolution of the major allergen endo-β-1,3-glucanase of banana as a molecular basis for the latex-fruit syndrome. Proteins 2006, 63, 235–242. [Google Scholar] [CrossRef] [PubMed]


| Sl. No. | Protein Spot Number | Experimental Mw/pI | Theoretical Mw/pI | Protein Name by Mascot Search | Accession No. | Matched Peptide | Sequence Coverage % | Banana Genome Hub Hit Accession No./Name/Score/E-Value |
|---|---|---|---|---|---|---|---|---|
| 1 | 1104 | 16,634/4.59 | 16,866.31/5.19 | Class 10 pathogenesis-related protein 1 | Q43560 | 6 | 44 | ITC1587_Bchr3_P05906/pathogenesis-related protein/70/8 × 10−13 |
| 2 | 1401 | 25,720/4.81 | 126,342.70/8.05 | Contains similarity to PHD-fingers domain proteins (Arabidopsis thaliana) | AAD03428 | 6 | 33 | ITC1587_Bchr5_P13750/ring fyve phd zinc finger protein/137/4 × 10−33 |
| 3 | 2401 | 24,525/4.93 | 28,994.06/5.43 | DHAR class glutathione transferase DHAR1 (Populus trichocarpa) | ADB11343 | 7 | 51 | ITC1587_Bchr7_P20675/dehydroascorbate reductase/300/7 × 10−82 |
| 4 | 2403 | 25,368/5.27 | 42,346.20/5.52 | Caffeine synthase 1 (Triticum urartu) | EMS67385 | 6 | 32 | ITC1587_Bchr1_P01127/salicylate o-methyltransferase-like/102/2 × 10−22 |
| 5 | 3004 | 12,818/5.96 | 93,030.16/5.90 | Sucrose synthase-like protein, partial (Picea sitchensis) | ADM74135 | 5 | 76 | ITC1587_Bchr10_P30544/sucrose synthase/159/5 × 10−40 |
| 6 | 3103 | 16,247/5.77 | 16,029.46/5.78 | Dynein heavy chain 3, partial (Chlamydomonas reinhardtii) | AAC49516 | 11 | 80 | --- |
| 7 | 3205 | 17,303/5.73 | 17,034.50/5.19 | Pathogenesis-related protein STH-21 (Solanum tuberosum) | P17641 | 6 | 69 | ITC1587_Bchr3_P05907/pathogenesis-related protein/96/1 × 10−20 |
| 8 | 4205 | 16,972/6.91 | 16,298.12/6.91 | Cadmium/zinc-transporting ATPase (Theobroma cacao) | EOY20393 | 3 | 43 | --- |
| 9 | 4402 | 25,304/6.40 | 26,983.57/5.21 | Putative ankyrin (ISS) (Ostreococcus tauri) | XP_003082621 | 5 | 37 | ITC1587_Bchr9_P25841/26s proteasome non-atpase regulatory subunit/100/8 × 10−22 |
| 10 | 4403 | 23,397/6.90 | 48,277.56/8.62 | Predicted ras-related protein RABB1c-like (Solanum lycopersicum) | XP_004243219 | 11 | 55 | ITC1587_Bchr9_P28079/ras-related protein rabb1c-like/411/1 × 10−115 |
| 11 | 4503 | 33,478/6.55 | 40,800.83/6.42 | Alcohol dehydrogenase (Miscanthus sinensis var. formosanus) | CAD56710 | 7 | 31 | ITC1587_Bchr8_P24615/alcohol dehydrogenase 1/545/1 × 10−155 |
| 12 | 4505 | 29,333/6.16 | 58,925.24/7.15 | Sec14p-like phosphatidylinositol transfer family protein isoform 1 (Theobroma cacao) | EOY22665 | 6 | 36 | ITC1587_Bchr8_P21515/polyphosphoinositide binding protein ssh2p/308/3 × 10-84 |
| 13 | 5007 | 14,477/6.69 | 13,916.02/6.68 | Albumin-1 D (Pisum sativum) | P62929 | 5 | 56 | ---- |
| 14 | 5302 | 18,806/6.82 | 27,368.97/8.73 | Peptide methionine sulfoxide reductase B5-like (Vitis vinifera) | XP_002278920 | 5 | 29 | ITC1587_Bchr6_P15995 peptide methionine sulfoxide reductase chlo/110/6 × 10−25 |
| 15 | 6001 | 13,806/7.14 | 142,006.47/5.50 | Disease resistance protein I-2 (Solanum lycopersicum) | ACO52382 | 6 | 48 | ITC1587_Bchr6_P18091 disease resistance rpp13-like protein 1-like/132/7 × 10−32 |
| 16 | 5303 | 23,215/6.96 | 105,978.42/8.56 | Ras related protein Rab-2-A (Zea mays) | P49103 | 6 | 39 | ITC1587_Bchr4_P08535/subtilisin-like protease/376/1× 10−105 |
| 17 | 4601 | 46,574/6.18 | 69,200.95/6.17 | Unnamed protein product (Arabidopsis thaliana) | BAB02183 | 7 | 28 | ITC1587_Bchr3_P05170 protein odr-4 homolog/140/2 × 10−33 |
| 18 | 7704 | 46,093/8.79 | 41,519.59/7.62 | Predicted protein (Bathycoccus prasinos) | CCO18444 | 14 | 52 | ITC1587_Bchr5_P12322 lrr repeats and ubiquitin-like domain-containing protein/110/1 × 10−24 |
| 19 | 4404 | 25,556/6.74 | 34,849.29/8.32 | Auxin-responsive protein IAA17 (Arabidopsis thaliana) | NP_171921 | 15 | 69 | ITC1587_Bchr2_P04450/auxin-responsive protein/203/1 × 10−52 |
| 20 | 1002 | 11,693/4.22 | 30,370.08/5.10 | 60S acidic ribosomal protein P2B (Zea mays) | NP_001105390 | 4 | 52 | ITC1587_Bchr10_P29925 60s acidic ribosomal protein p2a/107/1 × 10−24 |
| 21 | 4101 | 15,239/5.76 | 52,570.94/7.71 | LEAFY 1, partial (Malus sieboldii) | ADG85488 | 6 | 73 | ITC1587_Bchr6_P16241 leafy-like protein/100/3 × 10−22 |
© 2016 by the authors; licensee MDPI, Basel, Switzerland. This article is an open access article distributed under the terms and conditions of the Creative Commons by Attribution (CC-BY) license (http://creativecommons.org/licenses/by/4.0/).
Share and Cite
Ramu, V.; Venkatarangaiah, K.; Krishnappa, P.; Shimoga Rajanna, S.K.; Deeplanaik, N.; Chandra Pal, A.; Kini, K.R. Identification of Biomarkers for Resistance to Fusarium oxysporum f. sp. cubense Infection and in Silico Studies in Musa paradisiaca Cultivar Puttabale through Proteomic Approach. Proteomes 2016, 4, 9. https://doi.org/10.3390/proteomes4010009
Ramu V, Venkatarangaiah K, Krishnappa P, Shimoga Rajanna SK, Deeplanaik N, Chandra Pal A, Kini KR. Identification of Biomarkers for Resistance to Fusarium oxysporum f. sp. cubense Infection and in Silico Studies in Musa paradisiaca Cultivar Puttabale through Proteomic Approach. Proteomes. 2016; 4(1):9. https://doi.org/10.3390/proteomes4010009
Chicago/Turabian StyleRamu, Venkatesh, Krishna Venkatarangaiah, Pradeepa Krishnappa, Santosh Kumar Shimoga Rajanna, Nagaraja Deeplanaik, Anup Chandra Pal, and Kukkundoor Ramachandra Kini. 2016. "Identification of Biomarkers for Resistance to Fusarium oxysporum f. sp. cubense Infection and in Silico Studies in Musa paradisiaca Cultivar Puttabale through Proteomic Approach" Proteomes 4, no. 1: 9. https://doi.org/10.3390/proteomes4010009
APA StyleRamu, V., Venkatarangaiah, K., Krishnappa, P., Shimoga Rajanna, S. K., Deeplanaik, N., Chandra Pal, A., & Kini, K. R. (2016). Identification of Biomarkers for Resistance to Fusarium oxysporum f. sp. cubense Infection and in Silico Studies in Musa paradisiaca Cultivar Puttabale through Proteomic Approach. Proteomes, 4(1), 9. https://doi.org/10.3390/proteomes4010009