Article

Learning Dispositif and Emotional Attachment: A Preliminary International Analysis

1
School of Economics, Finance & Accounting, Coventry University, William Morris Building, Gosford Street, Coventry CV1 5DL, UK
2
School of Education, Faculty of Business, Education, Law, and Arts, University of Southern Queensland, Toowoomba, QLD 4350, Australia
3
Department of Architecture, Faculty of Architecture and Design, Universiti Putra Malaysiam, UPM Serdang, Selangor Darul Ehsan 43400, Malaysia
*
Author to whom correspondence should be addressed.
Educ. Sci. 2019, 9(4), 279; https://doi.org/10.3390/educsci9040279
Submission received: 6 September 2019 / Revised: 14 November 2019 / Accepted: 20 November 2019 / Published: 23 November 2019

Abstract

:
This research investigated the significance of learning dispositif (LD) and emotional attachment (EA) on perceived learning success (LS) across a diaspora of Western, Russian, Asian, Middle Eastern and Chinese student cohorts. Foucault’s LD captures the disparate socio-cultural contexts, institutional milieus and more or less didactic teaching styles that moderate learning. EA is a multi-dimensional notion involving affective bonds that emerged in child psychology and spread to marketing and other fields. The sequential explanatory research reviewed the learning and EA literatures and generated an LD–EA framework to structure the quantitative phase of its mixed investigations. In 2017 and 2018, the research collected 150 responses and used a range of statistical techniques for quantitative analysis. It found that LS varied significantly across cohorts, intimating that dispositifs influence learning. Nonparametric analysis suggested that EA also influenced learning, but regressions were inconclusive. Exploratory techniques hint at a dynamic mix of emotional or cognitive motivations during the student learning journey, involving structural breaks in student/instructor relationships. Cluster analysis identified distinct student groupings, linked to years of learning. Separately, qualitative analysis of open-ended survey questions and expert interviews intimates that frequent teacher interactions can increase EA. The synthesis of quantitative with qualitative results and pedagogical reflection suggests that LD and EA both influence learning in a complex, dynamic system. The key constituents for EA are Affection, Connection, Social Presence (SP), Teaching Presence (TP) and Flow but student emotional engagement is conditioned by the socio-cultural milieu (LD) and associated factors like relationships and trust. Unlike in the Community of Learning framework, in the EA framework Cognitive Presence (CP) is an outcome of the interaction between these EA constituents, associated factors and the socio-cultural milieu. Finally, whilst awareness of culture and emotions is a useful pedagogical consideration, learning mainstays remain inclusive educational systems that identify student needs and support well-designed programmes. Within these, scaffolded modules should include a variety of engaging learning activities with non-threatening formative and trustworthy summative feedback. We acknowledge some statistical study limitations, but its tentative findings make a useful preliminary contribution.

Graphical Abstract

1. Introduction

In many countries, including the UK, conventional university education is under political, financial and technology pressures. Contested political backdrops, policy flux, troubling inequality and ballooning student debt unsettle social mobility presumptions [1,2,3,4]. One possible solution is more online or blended delivery. Another is sharper business practices or learning commodification [5]. Notwithstanding competitive pressures or technology, educational decisions should consider psychology, social structure, culture, built and institutional environments [6,7,8,9]. To study these factors would improve learning outcomes, optimize the distribution of educational resources, and facilitate communication between different cultures. This study illuminated the broad education backdrop, the meaning of learning dispositif (LD) and the notion of emotional attachment (EA). The study then investigated the extent to which LD or EA influence perceived learning success (LS). The expectation was that both LD and EA would influence learning. Finally, it investigated the multi-faceted constituents of EA itself. Formally:
  • RQ1: Does LD influence LS? LD is insignificant (H-LD0) for LS vs. the alternative hypothesis that cohort LS varies (H-LD1).
  • RQ2: Do EAs significantly influence learning success? EA is insignificant for learning success (H-EA0) vs. the alternative that EA is significant (H-EA1).
  • RQ3: What are EA’s main constituents?
However, to set the scene before investigating these questions and hypotheses, the study reflects on the historical and theoretical education and learning backdrop.

2. Education History, Theories and Learning Dispositif

Learning and education is certainly a complex and contested field. In the Heracletian, Socratic maieutic traditions, learning is a process of cognitive and sociocultural maturation [10,11]. Instead of providing students with a solution or finished ‘product’ or superficial scattering of platitudes in a prescribed ‘mall for the intellectually lame’ [12] (p. 186), the Ionian tradition posed a contention (ᾰ̓πορῐᾱ) to spark fruitful community reflection, a theme reflected in Freire’s later pedagogical injunctions [13]. Cole’s [14] take on learning echoes the approach of Pliny or Vittorino da Feltre who prescribed multum, non multa or deep reflection rather than superficial spread. Concerns about intellectual curiosity and depth aside, an online learning focus can neglect social and pragmatic skills. Hence, Grundy’s [15] dual theoretical–pragmatic (praxis) program design blends procedural with teleological learning outcomes.
Given philosophical contention around learning [16], notwithstanding strong economic incentives, it is hardly surprising that modernizing education systems proves challenging. The contested literature on teaching and learning is substantive and spans many decades if not centuries [17,18,19,20,21,22,23]. For Vygotsky [20,24], echoing Wundt’s [25] earlier Völkerpsychologie, learning is a socially conditioned and evolutionary process, involving micro-genesis and iterative community collaboration to activate and enrich internal biological endowments. A complex interplay of internal and external factors such as student capabilities and motivation, socioeconomic status, community and institutional settings and teacher competence all influence student maturation. Inter alia, considerations of Special Education and Disability Needs (SEND) should be embedded in all teacher training and beyond in continuous dialogue and reflective practice [26].
Given sociocultural conditioning and complex dynamics, a distributed systems framework helps conceptualise learning’s constituent objects, events and multiple interactions. The learning dispositif (LD) encapsulates a learning systems perspective. A LD reflects a specific sociocultural institutional and architectural milieu where learners, teachers and administrators interact, buffeted by technological, political and economic forces. However, for Raffnsøe [27] (p. 62) LD, n’est pas localisée puisqu’elle existe disséminée dans le domaine and therefore to isolate its constituents is misguided. Borrowing from Cole and Engeström [28] (p. 8), dispositif provides a scaffold for power plays in a distributed learning system. As in any system, sub-optimal outcomes can emerge from these interactions and the dispositif can become a sort of Panopticon where dank gloom festers [29]. For Bottery [30] in dystopian university LDs, unhealthy practices include excessive VC salaries, unnecessary re-structuring, curricula shuffling, Kafkaesque bureaucracy or malicious investigations that mask malign impulses to power. In a similar but urban vein, Foucault [31] speculated that, in pathogenic as opposed to sustainable cities [32], intellectual ‘medicalization’ controls citizens [31] (p. 175). Notwithstanding dismissal of Foucault and other French intellectuals by Dawkins [33], his dispositif illuminates institutionalised suffering, psychological distress and social degradation endured by the learning underclass. Raffnsøe [27] (p. 47] considers it, un appareil formé d’une série de parties agencées entre elles de telle manière qu’elles influent sur le champ d’action, [instilling] de la discipline dans ces relations qui changent dorénavant de caractère [27] (p. 50). For Agamben [34] (p. 31), modern dispositifs embroil the Internet and electronic devices, including mobile phones, which influence les gestes, les conduites, les opinions et les discours des êtres vivants. However, for Agamben, the real danger is the plethora of gadgets spewing vacuous subjectivities, ce qui mène à la disparition de la politique. Apart from digital surveillance and Pavlovian social conditioning, other malevolent infestations of a LD could include neo-Stalinist architecture, commodification, budget cuts or managerialism [35]. Whatever its form, the literature suggests that a LD is the learning system within its wider nuanced cultural and political context.
In terms of context, the classical literature provides some useful educational insights. Aristotle (384–322 BC) in his Nicomachean Ethics VI.5 suggested that true and reasoned action for human flourishing or practical wisdom (phronesis) involves sound deliberation and ethical considerations [36]. Modern education curricula tend to focus on theoretical or practical considerations although Social Learning Theory (SLT) notes the importance of group interactions for epistemology. SLT overcomes behaviourism’s limited external focus and incorporates advances in cognitive science that demonstrate the brain’s right amygdala as the physical locus of emotionally conditioned learning. In SLT, meaning is constructed by iterative dialogues in unique cultural and historical settings. In other words, learning is a social act, embedded in a specific cultural context [20,24,37]. Whilst Chomsky [1] considers educational socialisation a malign social control artifice that serves dominant interests, pragmatists meld behaviourist with cognitive and social constructivist learning theories [19] to attenuate environmental deprivation [38]. Within SLT, Social Presence (SP) and Teaching Presence (TP) foster Cognitive Presence (CP) or critical, practical inquiry. SP is a salient ‘presence’ that facilitates group cohesion and communication. It nurtures professional personal relationships to improve purposeful communication with ‘real’ people [39]. To support for critical thinking, Garrison et al. [40] found that, even in asynchronous computerized settings, instructors can use SP to foster CP. Pragmatically, relative to written or audio, video communication can enhance instructor SP. Precursors for open communication are mutual acquaintance and understanding of student cultural milieu and social interactions, semiotics (symbolic representations) and power relations [39]. Whilst SP is perhaps necessary, it is not enough for the emergence of critical online discourse [41].
In Dewey’s [42] four-phase Practical Inquiry Model (PIM), a triggering event flags issues for further inquiry. To construct meaning, students reflect critically, explore issues and integrate them into previous knowledge. The integration phase typically requires enhanced teaching presence (TP) to shepherd learners towards resolution. Kolb’s [21] Experiential Learning Theory (ELT) also begins his sequence of learning stages with concrete experience. Subsequent ELT phases include reflective observation, abstract conceptualisation and active experimentation. For Kolb, the key to learning is active involvement of students, catalysed by a concrete experience or task (icebreakers, team games, problems, discussion or practical exercises). Students then reflect on these activities or take time-out from ‘doing’ and step back to question or verbalize and discuss their experience. Activities to aid reflection include writing feedback reports for other students or completing a learning log or diary. Subsequently, during the conceptualisation stage, students draw on theory to interpret events, review textbooks or ideas. Finally, students apply their new understanding to predict or forecast. A convivial atmosphere, rather than one focused on detecting ‘mistakes’, fosters collaboration, experimentation and critical reflection. As well as in situ synchronous monitoring, at the conclusion of activities, instructors should reflect honestly on teaching practices and educational values [43].
In the Community of Inquiry (CoI) learning framework culture, emotions, institutions and learning are inextricably linked [44,45]. Within CoI’s, the psychological and emotional climate is shaped by culturally conditioned practices, emotions, social interactions, interpersonal relationships and teacher-student dialogues, including online ones [17,20,39,46].
Flexible delivery by taking-up, seemingly irrelevant, conversation threads can improve student engagement. Following Felder [47] (p. 678), ‘global learners should be given the freedom to devise their own methods of solving problems’. So, rather than prescriptive, feedback should acknowledge different learning styles and diverse cultures [48]. CoI seems to rebut an overly-prescriptively or teaching approach, mechanically constrained by learning outcomes [7,49]. For Garrison, learning involves both private deliberation and shared practice with a common intellectual focus moderated by the interaction of SP, CP, and TP [50,51]. CoI takes a constructivist perspective on knowledge mediated in dialogue between instructors and learners. Garrison and Cleveland-Innes [41] argue that the inter-relationship of social, cognitive, and teaching presence is required for quality interaction, promoting discourse for deep and meaningful learning. In his later work, Garrison’s [44] blends emotions into his learning mix. Rienties and Rivers [45] think emotions interact with SP to foster a learning climate whilst TP enhances learning feedback.
For online learning, although computers are integral, they work best in conjunction with competent instructors and a properly configured educational milieu. In this regard, King’s [52] shift from ‘sage on the stage’ to ‘guide on the side’ is useful. Rather than didactically transmitting content, class or online synchronous time should be spent on constructing meaning, exploring contention or fostering metacognition. In King’s [52] or Mazur’s [53] flipped classrooms, interactive sessions concentrate on information assimilation rather than transfer. For blended learning success (LS), Cleveland-Innes and Wilton [54] also harness insights from the Community of Inquiry (CoI) to develop their Complex Adaptive Blended Learning System (CABLS) with six interacting elements (learner, teacher, technology, content, learner and institution support).
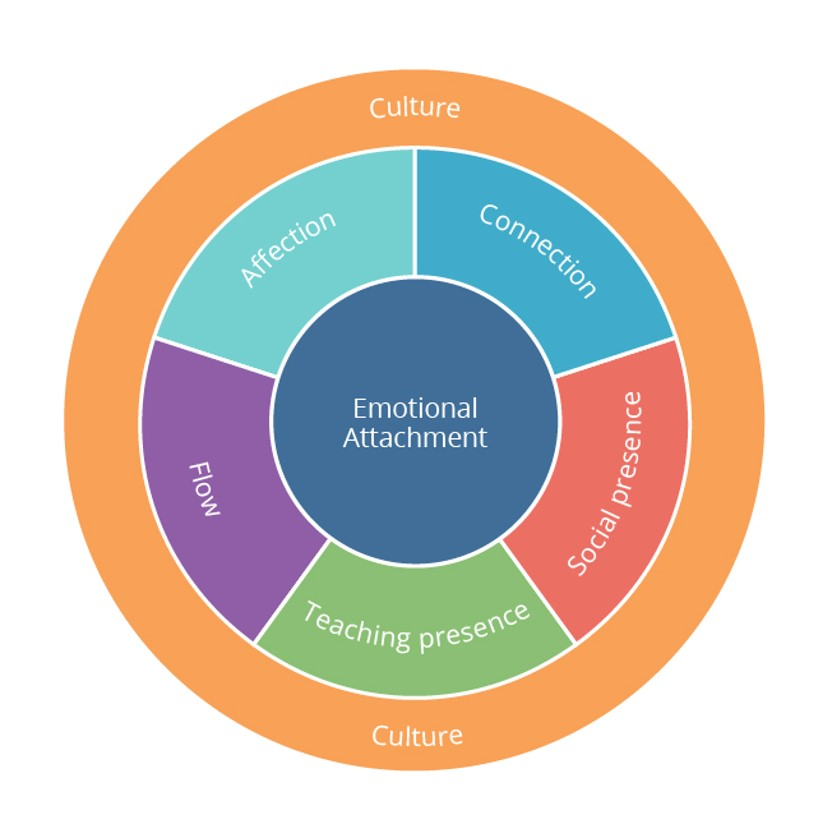
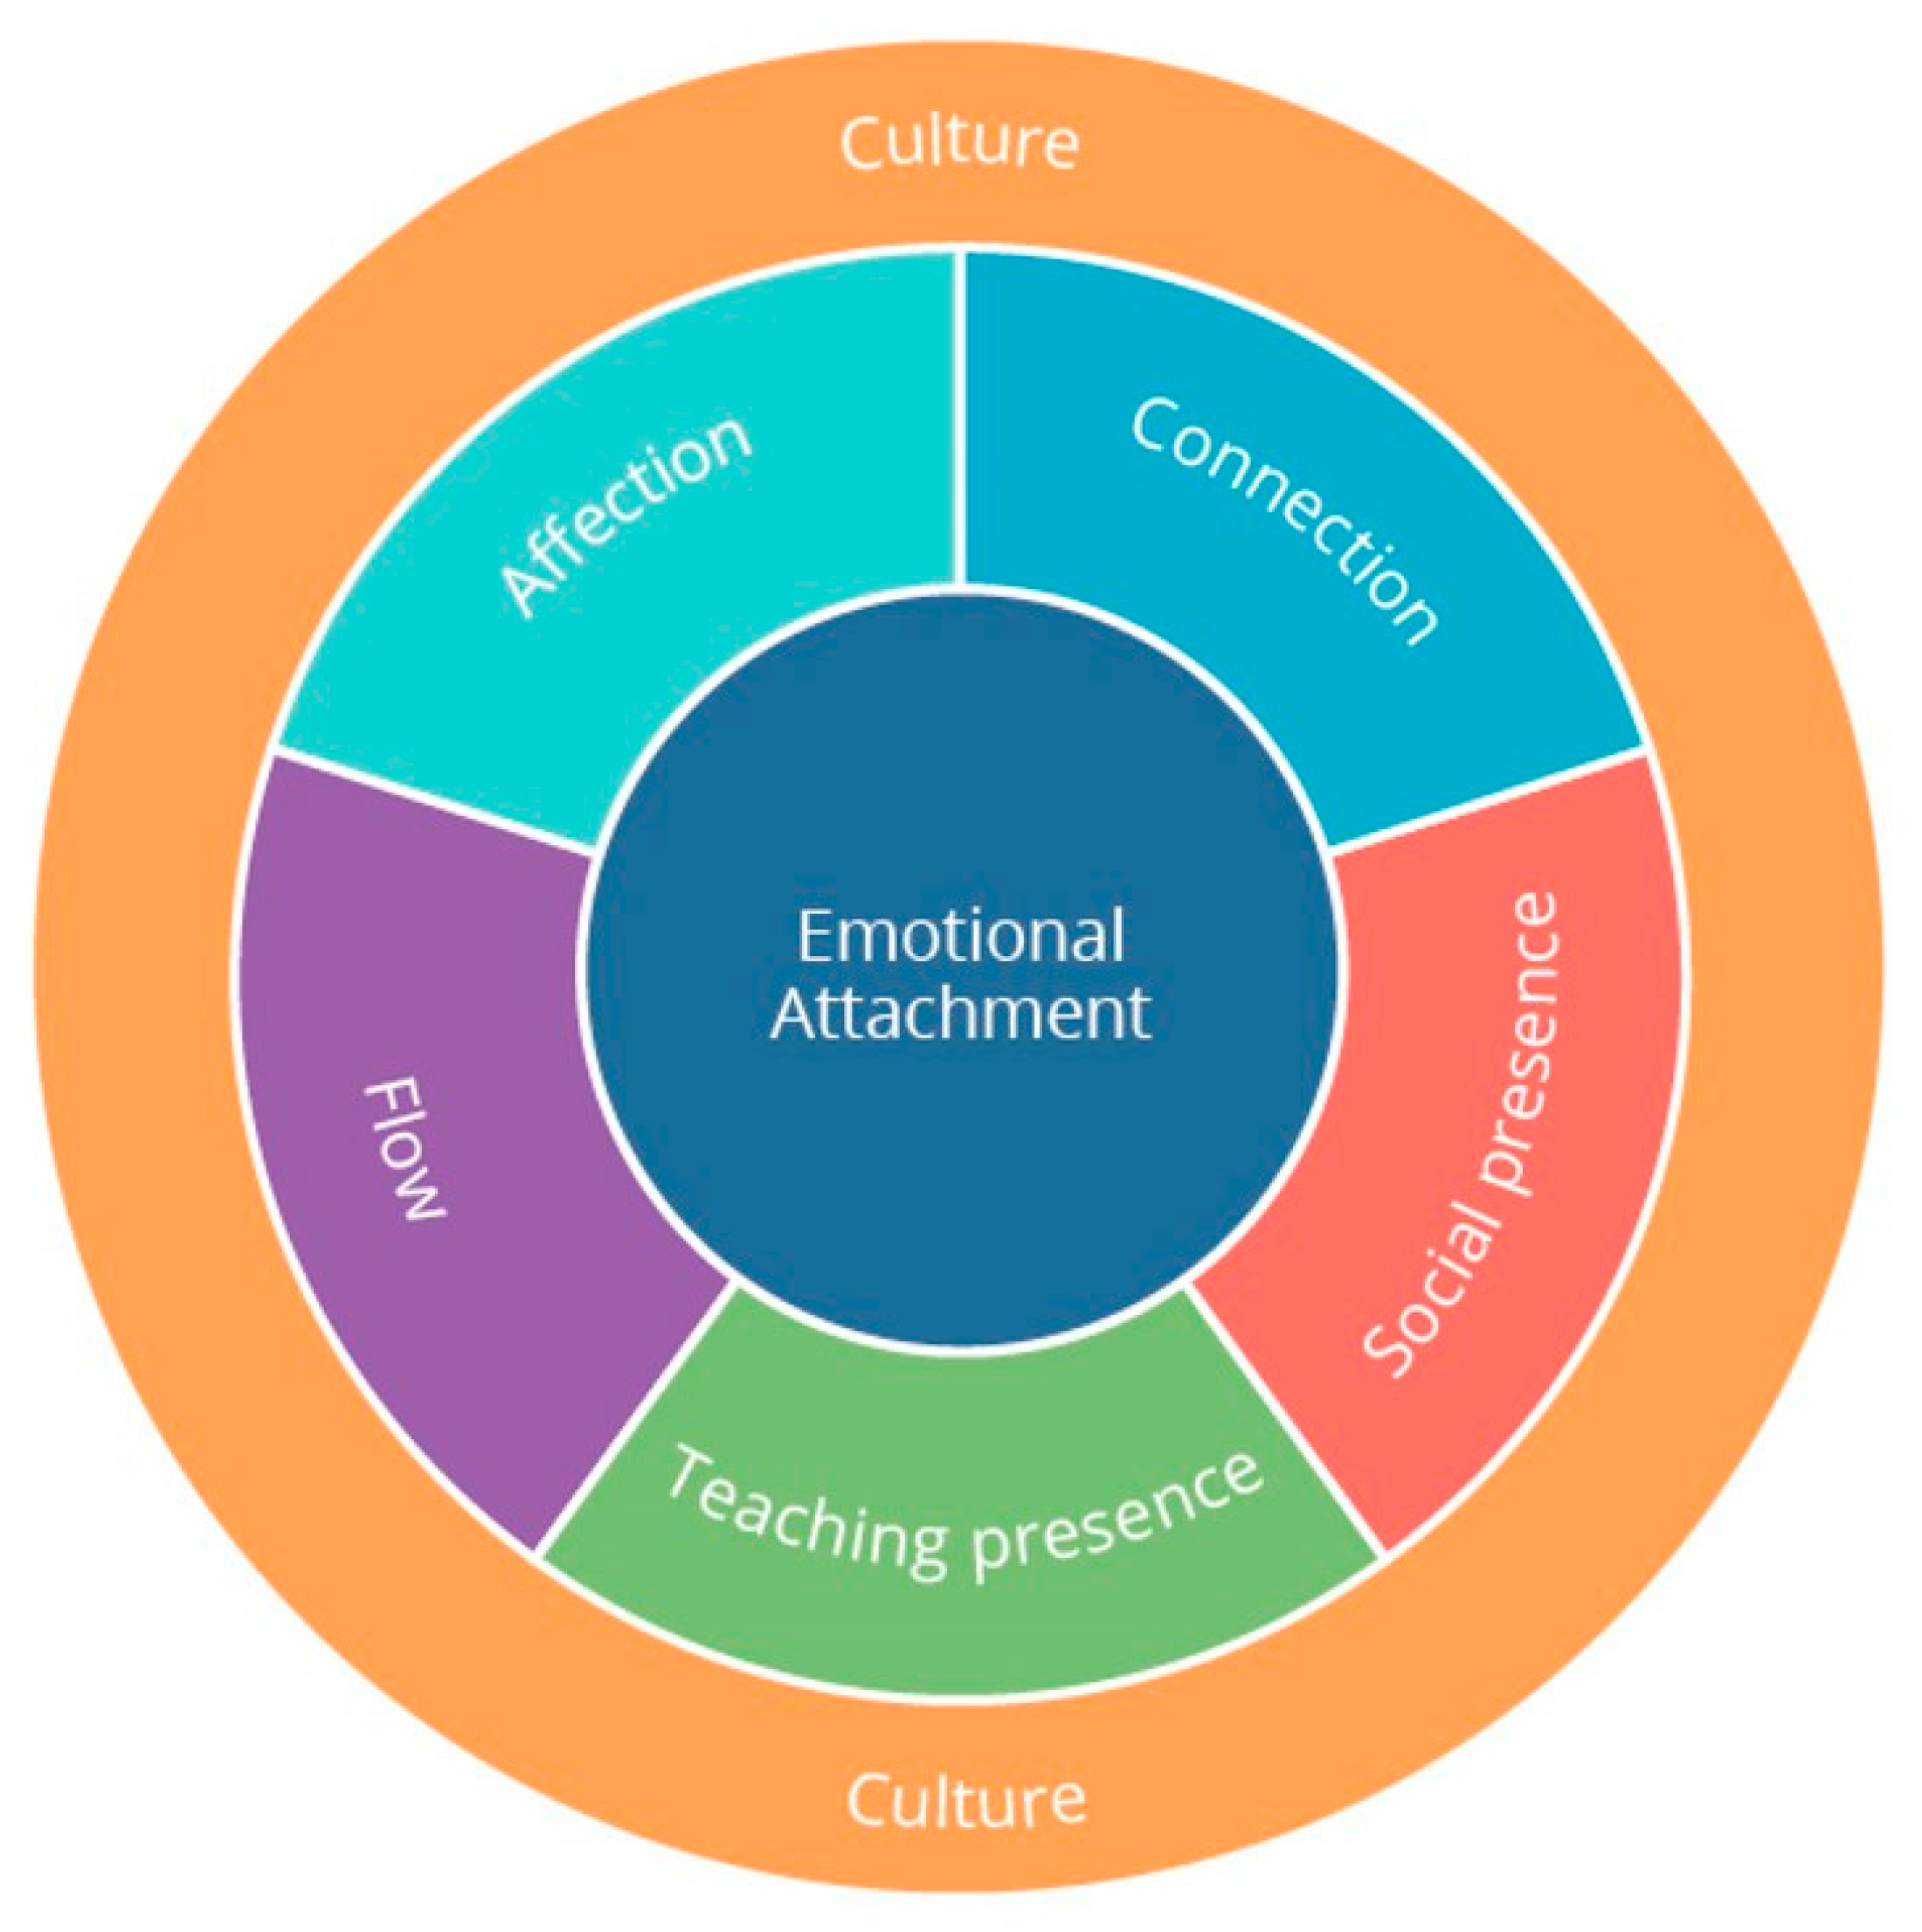
The learning literature review touched on a complex and contested field and guided the genesis of a draft EA explanatory framework. It identified the role of culture, institutions and distributed interactions in a learning dispositif. The CoI and blended learning literatures suggest that EA is just one of many influences on learning and likely moderated by SP & TP.

3. Emotional Attachment and Its Constituents

For Oxford [55], emotions amplify other learning motives. Emotions feature prominently in child development psychology [38,56], marketing [57] and organisational literatures [58,59]. For Oatley and Jenkins [60], emotions condition goals and moderate communications. Some distinguish fleeting, intensive and episodic emotions from more enduring but low-intensity moods [61]. Bechara and the Damasio [62] showed that emotions alter brain physiology and high-level cognitive functions (reasoning, decision-making, language, reading, and mathematics). Emotional considerations thus are primordial. As opposed to emotions, emotional attachment (EA) involves an intense bond of affection with evolutionary advantages, undermined by separation. Without parental attachment, children experience anxiety, insecurity, despair and depression [56]. Aside from parents, people attach themselves emotionally to sexual partners, places, brands, dogs, institutions, courses or teachers [57,63,64,65].
The association of attachment and emotions goes back to antiquity. At Caesar’s funeral oration in 44BC, Mark Antony famously invoked ‘attachment’ as a rhetorical device [66]. In the organization field, Etzioni [58] linked ‘alienative’; ‘calculative’; or, ‘moral’ emotional involvement to coercive, utilitarian or symbolic power modes. For Etzioni, relationships thrive when power mode and emotional status align. Ashforth and Humphrey [67] call for organizations to harness emotions to improve leadership, motivation and group dynamics. In marketing, commitment and trust mediate emotional relationships of consumers to brands [68,69]. In 2007, Immordino-Yang and Damasio [70] highlighted the relevance of affective and social neuroscience to education. Their findings indicate that when emotional, social, and moral feedback (culture) is stripped from interactions, attention, memory, decision making, motivation, social functioning and learning are all diminished.
In educational settings, connectedness means students feel they belong to a purposeful group where adults care about them and their learning. Baumeister and Leary [71] found that the need to belong or attachment is a powerful and pervasive motivator to focus student cognitive energies on learning tasks. A sense of community and empathic concern improves effective collaboration. So rather than haranguing students, it seems more fruitful for instructors to adapt course content to fit student needs and cultural context, although flexibility has its limitations for competence.
Another EA stimulant is instructor passion and self-disclosure. Self-disclosure involves use of student names, sharing jokes or emotions and revealing personal information or facets of their life to build cohesive personal relationships with intellectual focus. More than in face-to-face classroom milieus, in cyberspace social interactions enrich learning. For online learning, early emails or upfront posts to learning platforms or passionate synchronous telephony or conference presence likely build student emotional engagement.
Aside from attachment, connection and passion, teaching presence (TP) strengthens EA. TP involves design, direction and facilitation of cognitive and social processes for educationally worthwhile discourse and meaningful learning [72]. Instructors can enhance TP by diligent and conscientious preparation, but it also helps if they are charismatic, honest, patient and non-judgmental. EA flourishes when programs or modules are well-calibrated, scaffolded, with a variety of interesting learning activities and regular feedback [73,74,75,76]. By sustained guidance, TP helps students construct or confirm meanings and reflect for eventual metacognition.
Whether geographical, social or cultural, Moore [77] considers ‘transactional distance’ between student and instructor an insidious pedagogical hindrance. Instructors can bridge it by programme/module structure and culturally appropriate interactions [78]. Moore [79] (p. 1993) and Hillman identified key ones.
  • Learner–learner communication
  • Learner–instructor communication
  • Learner–content engagement
  • Learner–computer interface interaction
Whether synchronous or asynchronous, sensitive interactions should stimulate emotions and close transactional distance.
Aside from attachment, connection, passion and TP, the literature review suggests that states of learning ‘flow’ can augment EA. For Csikszentmihalyi [80] (p. 3), flow is, ‘when a person’s body and mind is stretched to its limits in a voluntary effort to accomplish something difficult and worthwhile’. Flow heightens concentration so students become completely absorbed in tasks. In flow, students are engaged behaviorally, cognitively and emotionally and, therefore, intrinsically motivated. Triggers for flow are well designed activities that stretch but do not frustrate students. Primers include frequent engagement, detailed ex-ante instructions and continued conversation threads rather than ad hoc interventions or didactic diatribes [49]. Considerate, continuous and interactive feedback can help engender self-sustaining flow for critical learning and curiosity.
Culture and specifically language-culture is another possible emotional modifier. For Ishihara and Cohen [81] (p. 13), culture is ‘a fuzzy set of attitudes, beliefs, behavioural conventions, and basic assumptions and values that are shared by a group of people’. Interaction routines influence interpretation of meaning [82]. However, objective culture and subjective culture need to be distinguished. Objective language culture involves institutional aspects, such as political and economic systems, art, or music and cuisine. Subjective culture involves the learned philosophical, psychological and moral beliefs, values and behaviours shared by a language community. When lexical, grammatical, semantic and these ethnographic and cultural conditioners are ignored, learning is likely depleted.
To conclude, emotions influence reasoning, decision-making, language, reading, mathematics and learning. The literature suggests that EA is a multidimensional psychological state, fostered by sustained but meaningful interactions. Passionate teachers with presence connect with students by designing relevant and delivering or absorbing lessons.

4. Genesis of Draft Learning Dispositif–Emotional Attachment Framework

After reviewing literature on learning theory, dispositif and emotional attachment, the research generated a draft learning-emotional attachment framework (see Figure 1 below). The draft framework has five putative constituents: Affection, Connection, Passion, Teaching Presence, and Flow with ancillary supporting factors as illustrated. To generate instrument questions, the investigation used 26 indicators geared on these putative EA-learning constituents.

5. Methodology and Data

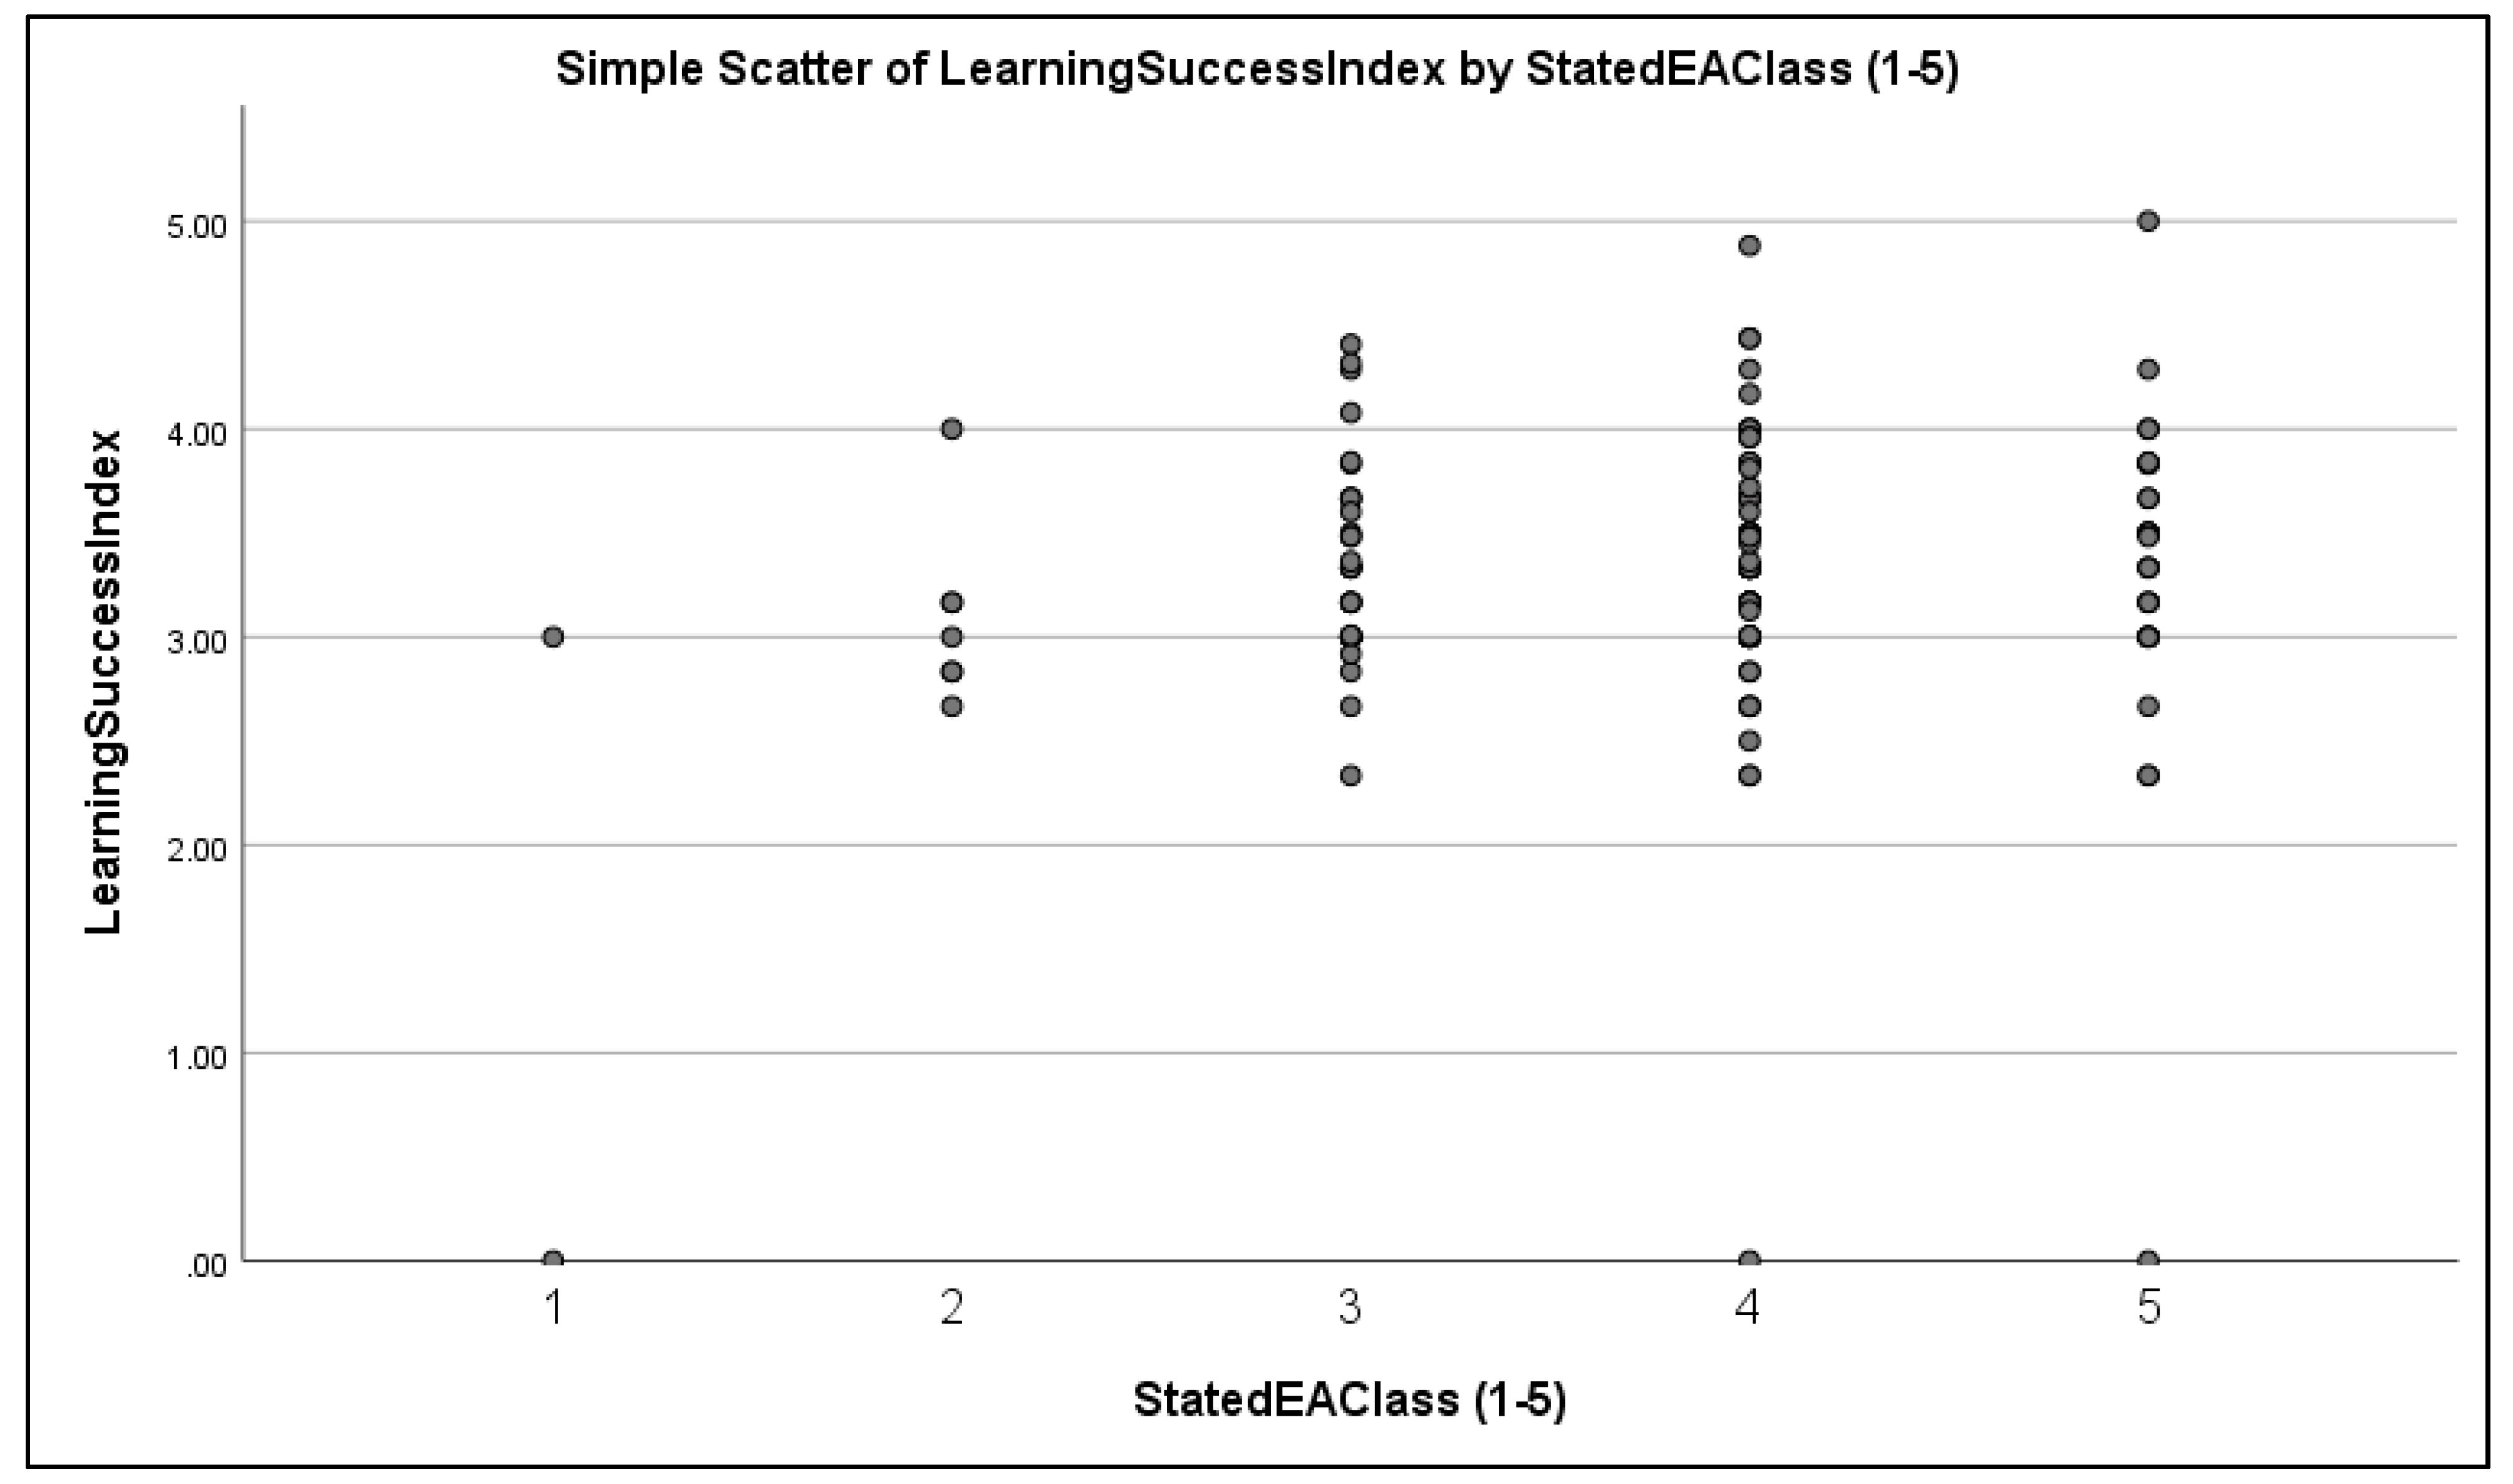
The research used mixed methods and a sequential explanatory approach to investigate the relative influence of LD and EA on perceived learning as well as to explore the constituents of EA itself. The research generated three questions and associated hypotheses. The first question concerned the role of LD. The second involved the influence of EA on LS. The third queried the multi-faceted constituents of EA itself (see Introduction section).
The research reviewed the main strands of EA literature in child development psychology, marketing and learning to generate a draft explanatory framework that underpinned survey questions. Although the review was not formally comprehensive, it was structured. 
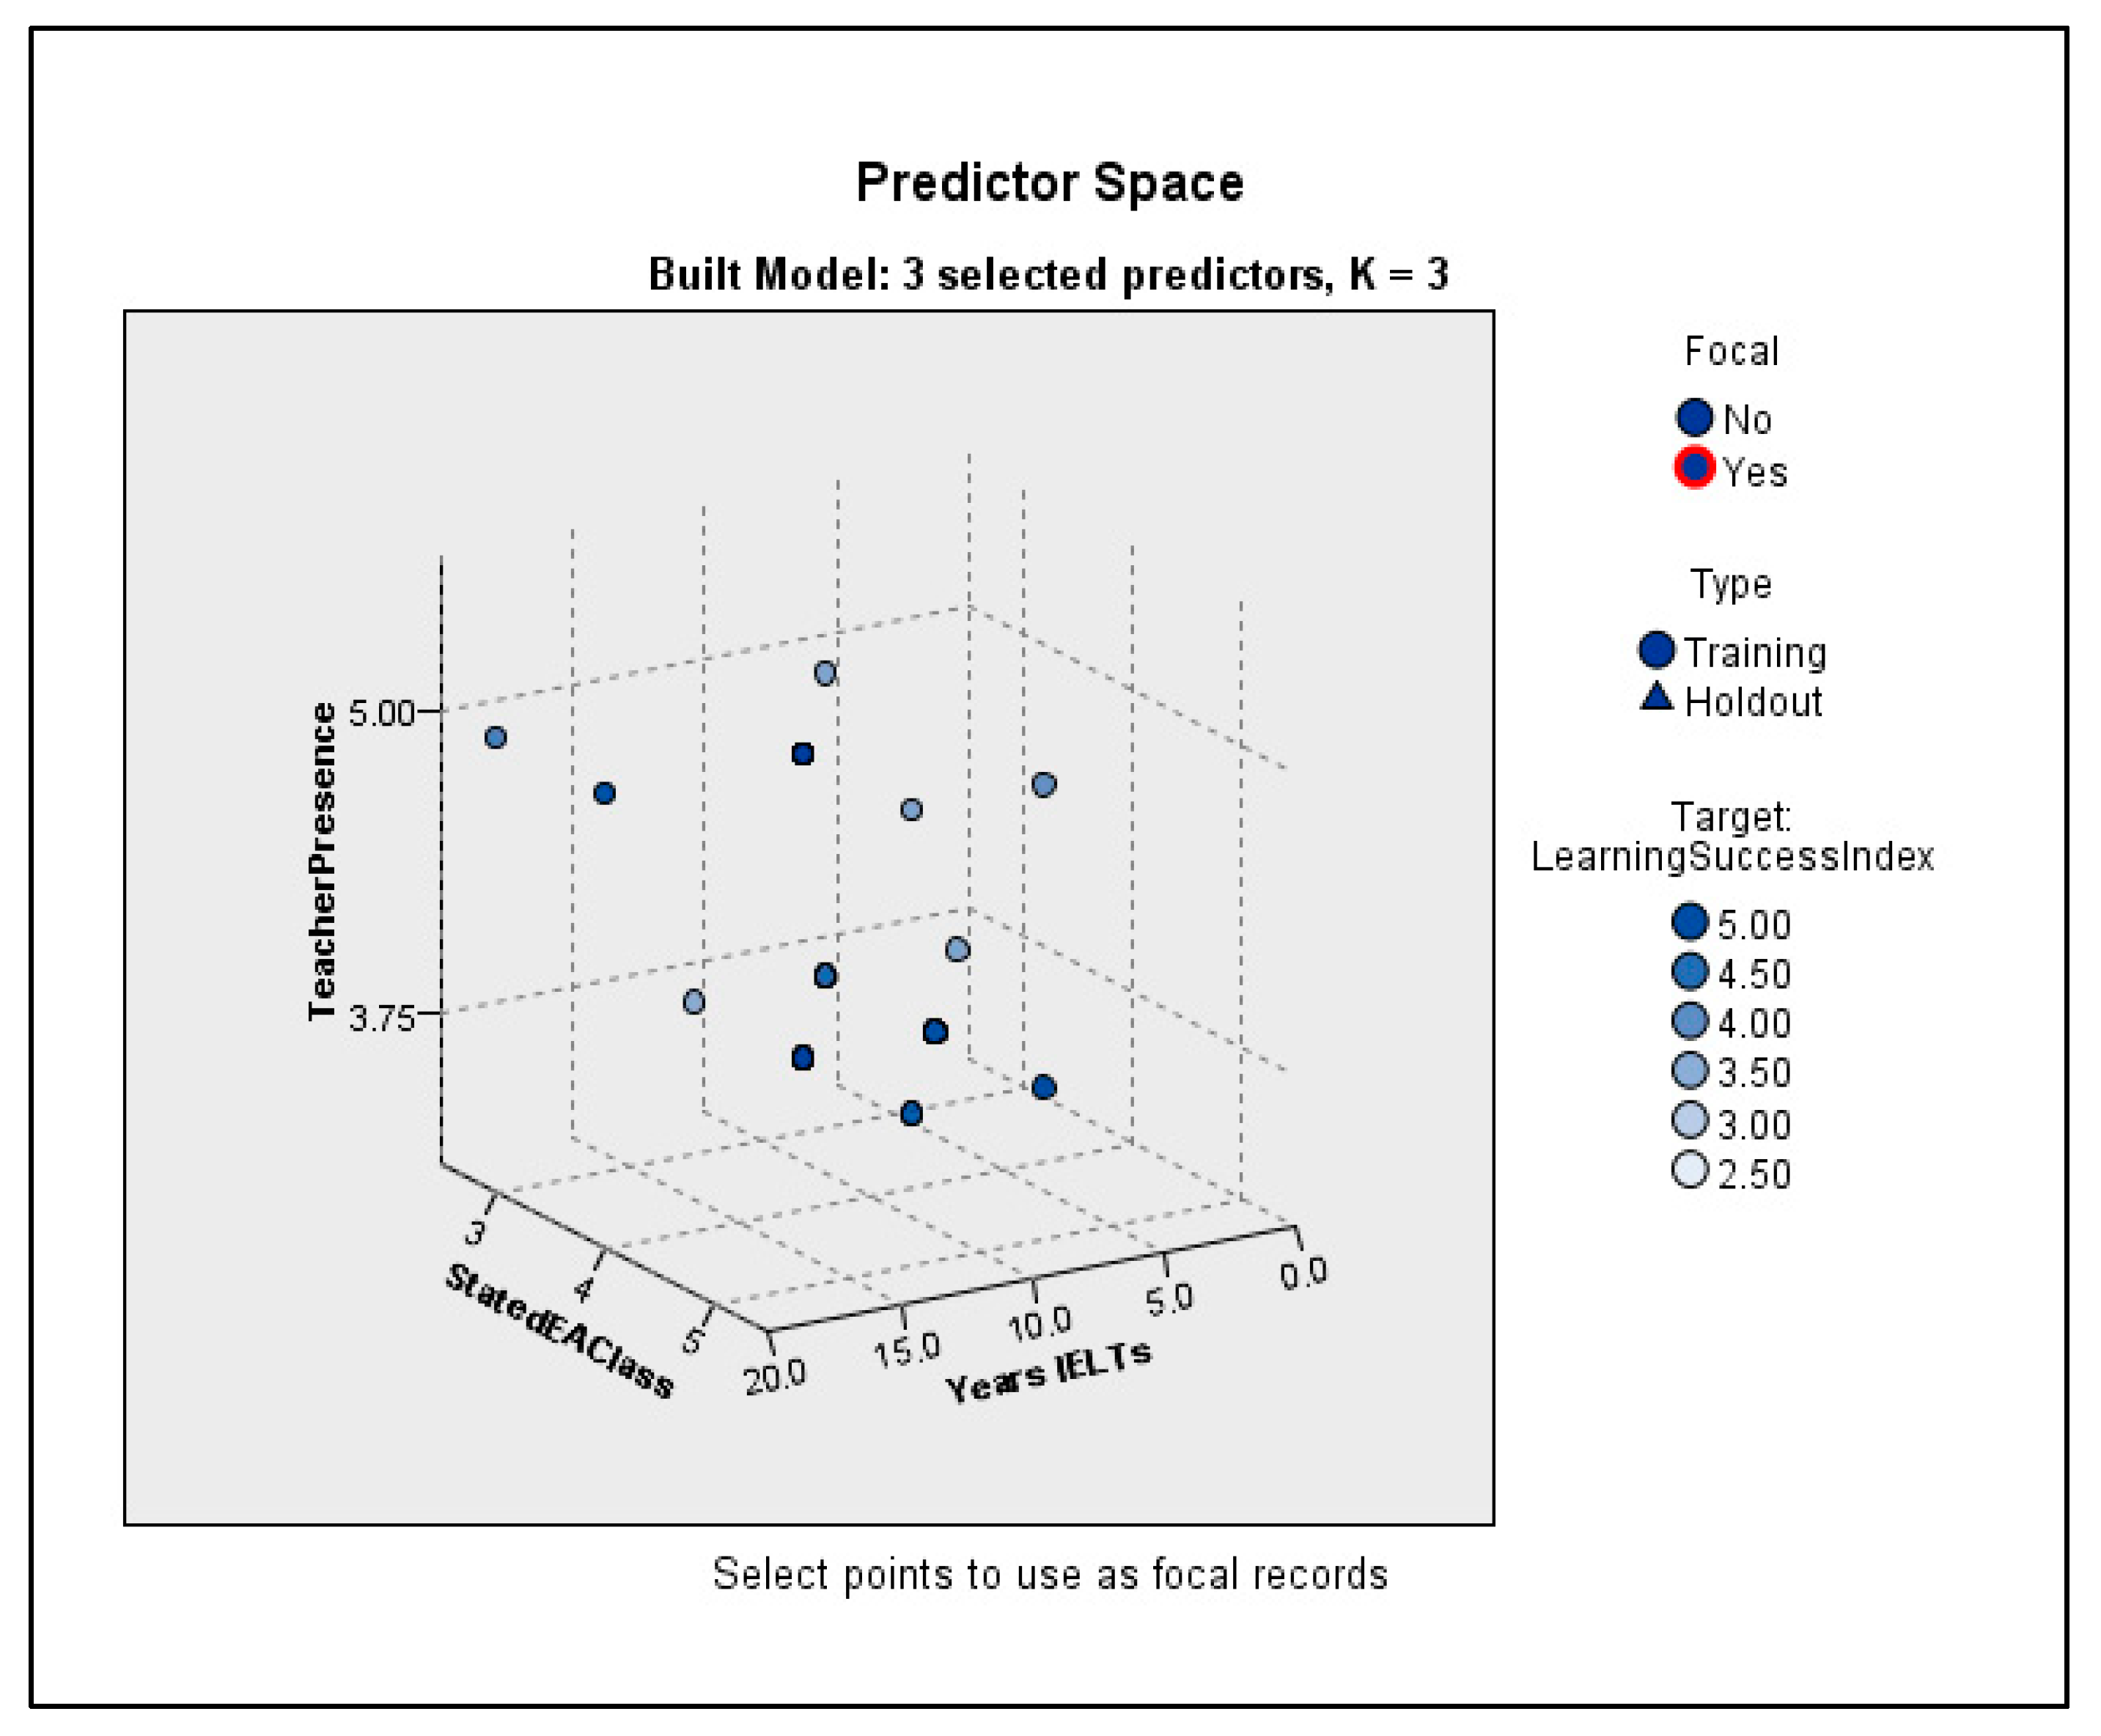
Figure 1 illustrates the framework constituents and factors included in the survey instrument. Likert scale questions probed student and instructor perceptions or attitudes to these aspects of EA and learning. The survey included closed-ended Likert scale questions like, ‘How would you rate the importance of the following teaching factors for emotional attachment?’ (Q8) or ‘Describe to which extent you feel emotionally attached to your class? (Q11). Students self-appraised their own learning success with 6 indicators such as, ‘On a scale of 1 (unimportant) to 7 (vital), how would you rate your classroom learning?’ (Q14) or ‘How would you rank your success in this learning? (1 = failure, 7 = outstanding) (Q17).
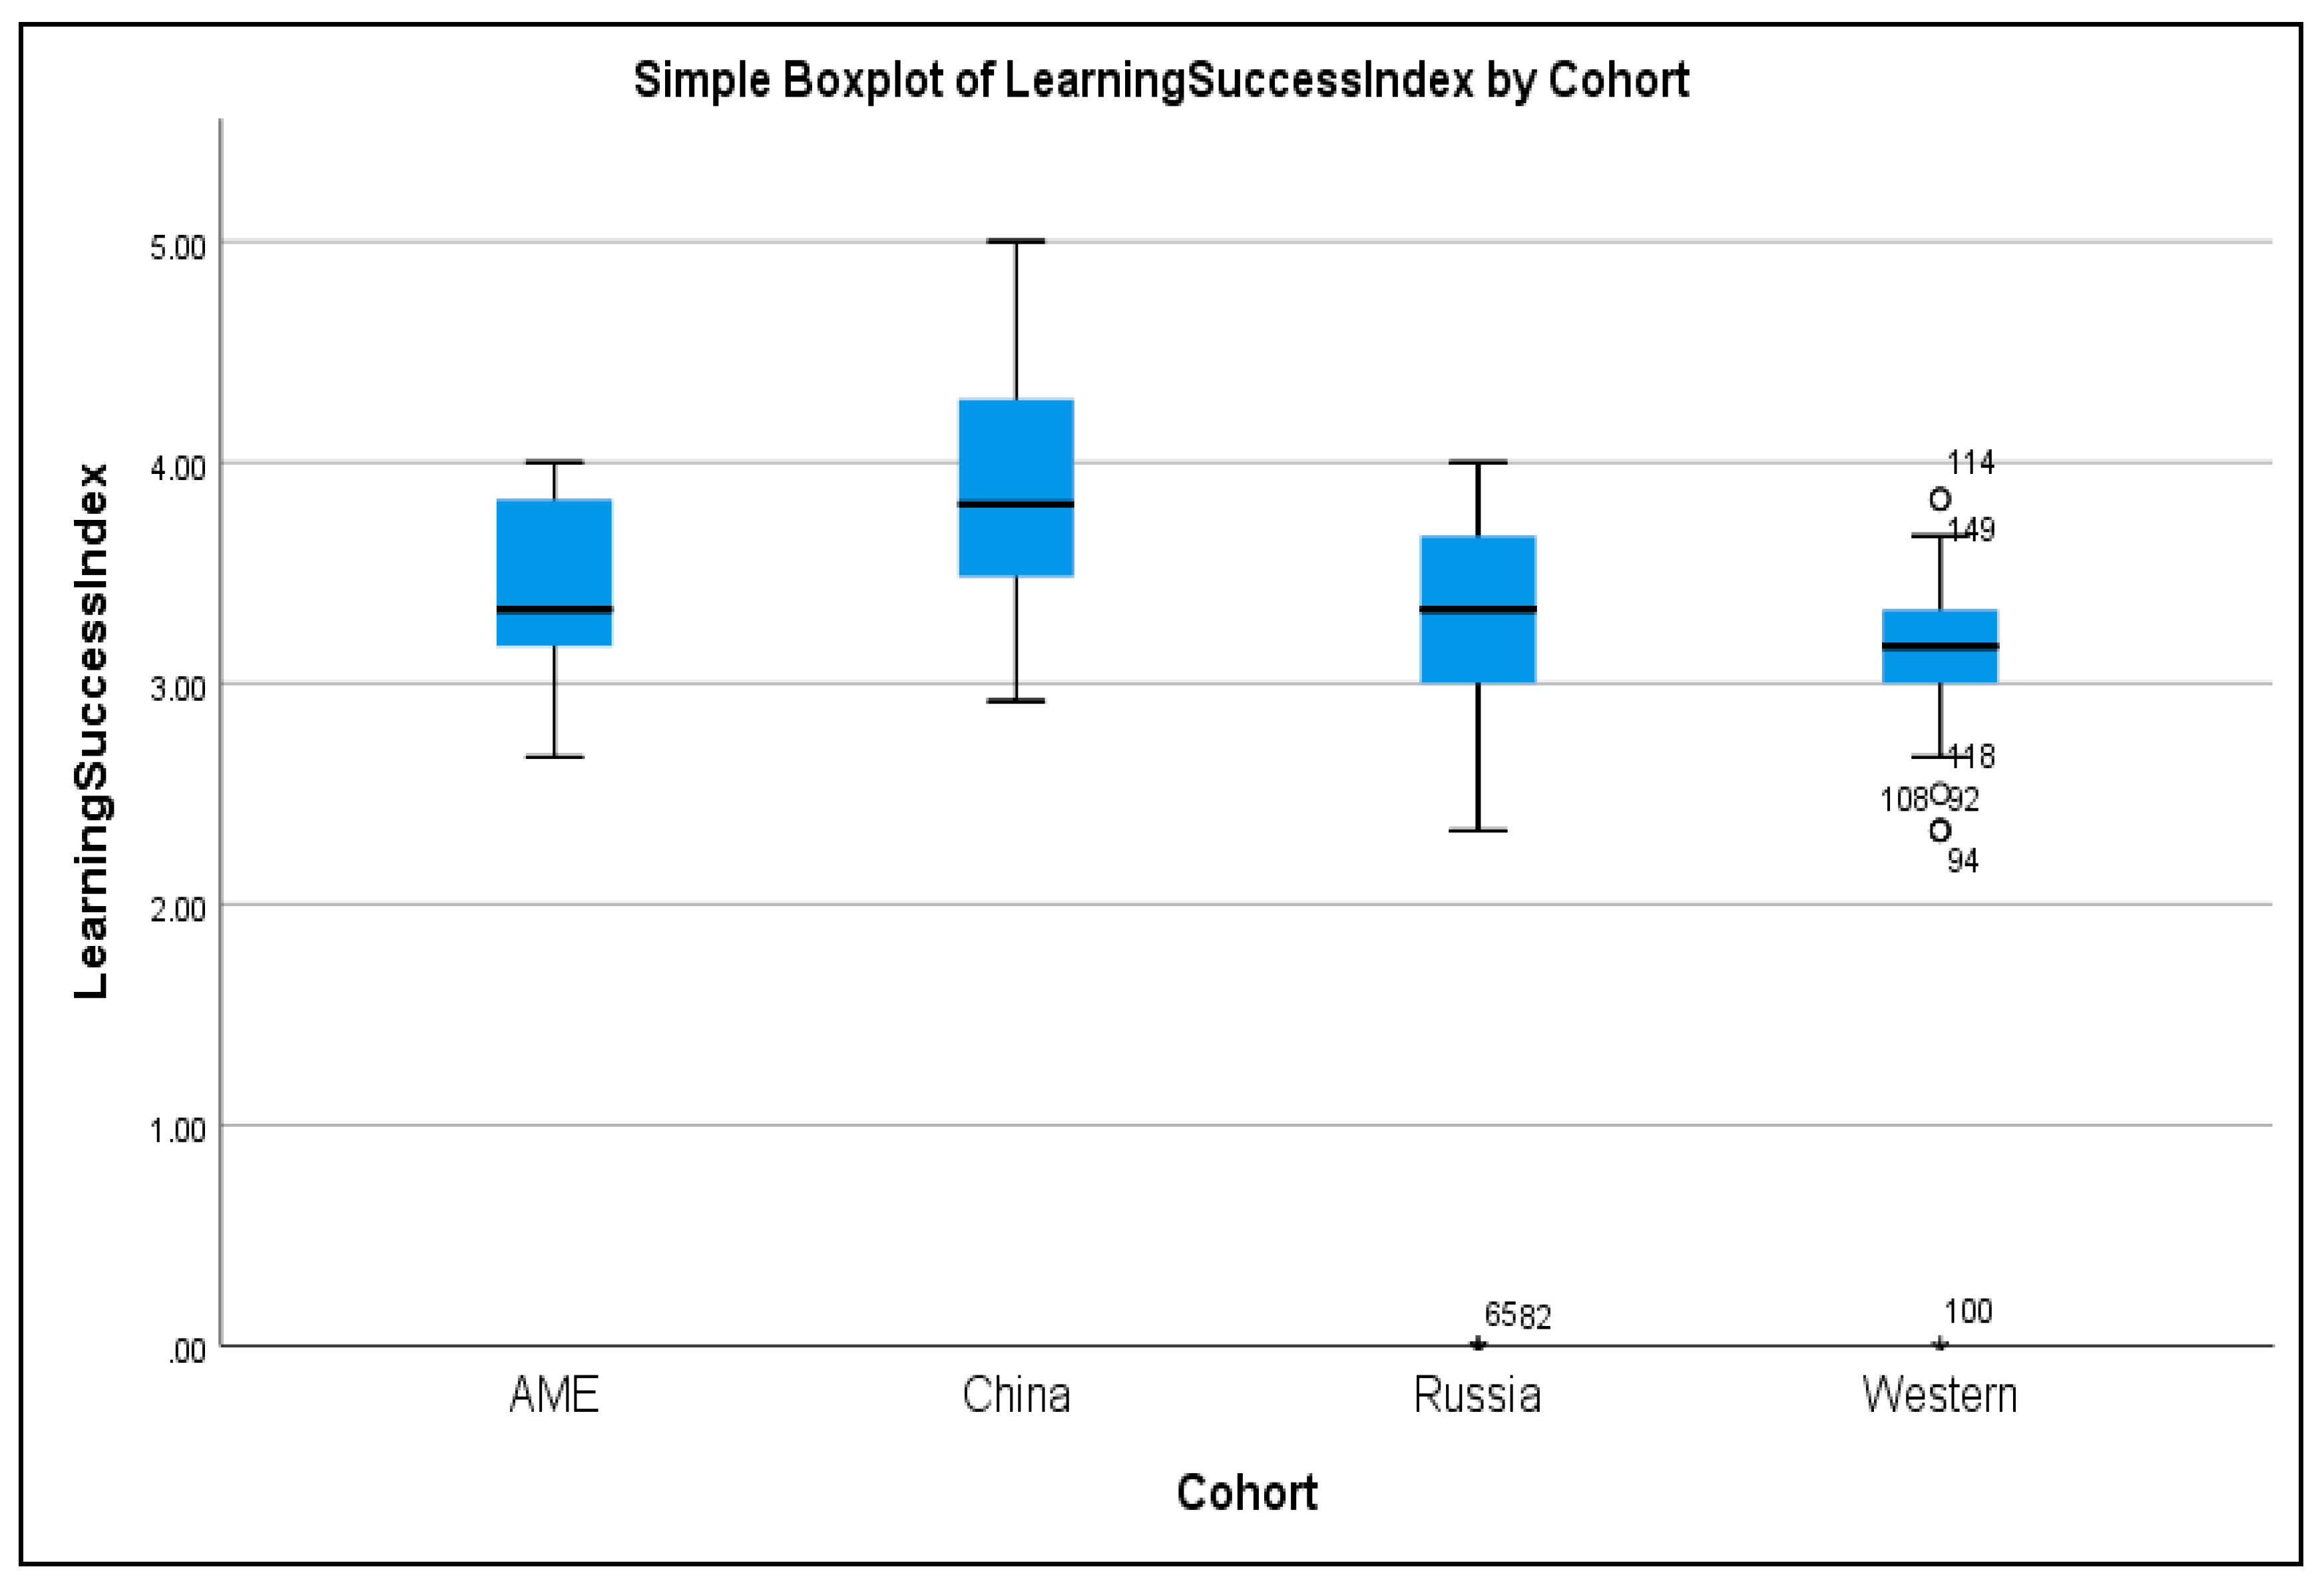
After ethical review, the research piloted the instrument on three UK academics. To identify survey respondents, the research used pragmatic, convenience sampling, distributing the instrument internationally either online (via an email link) to accessible English language and other learners or instructors. A hard copy version of the instrument was also distributed to undergraduate university students in England and China. The pragmatic convenience approach eventually generated a sample of 150 diverse learning stakeholders in Europe, Russia, Asia, the Middle East and China.
As far as we are aware, there exists no other quantitative studies on EA and learning, so it was not possible to conduct a meta-analysis to investigate effects size [83]. Although much of the questionnaire/survey data were ordinal, they were analyzed using parametric and nonparametric statistics. With adequate and reasonably normal distributions, Likert scale ordinal data can be tested parametrically [84]. Norman [85] suggests that parametric tests give reasonably accurate and unbiased analysis, even with skewed, autocorrelated or heteroskedastic data. The research classified 150 respondents into four cohorts on pragmatic basis, recognizing that the split was somewhat arbitrary as the groups span a wide spectrum of divergent countries and educational systems. For example, the Asia Middle East cohort amalgamated Indian and Asian students. One limitation of the study was that covariate data on average income or education levels were not included.
Subsequently, in its idiosyncratic (qualitative) phase, the study identified a convenience sample of seven academic learning experts who were interviewed face to face or online, via Skype. Interviews were conducted during the period May 2016–June 2016. Interviewees discussed their views on emotions and student learning. The interviews were recorded, transcribed and analysed using word clouds and an adapted Framework Method [86]. The transcriptions generated a rich diversity of individual experiences in diverse dispositifs and with different student cohorts (see Table 1). A range of views about EA and strategies for learning engagement and success emerged that were compared to earlier results and synthesised where possible to refine the draft EA-learning framework.
One practical challenge was that Likert scales diverged on the European and Chinese survey instruments. The research adopted proportional transformation to harmonise scales. So, for example, Chinese 7-point scores were multiplied by 5/7 to scale it down to the equivalent European instrument 5-point score. Similarly, we inflated Chinese instrument 3-point scores by 5/3. Theoretically, standardising Likert to (Z) scores assumes psychological equivalences across ordinal scales. Alternative transformations by, for example, using empirical regression coefficients assume relationships are generalizable and persist. Empirically, Colman et al. [87] did not find dramatic improvements when adopting more complex transformation techniques.
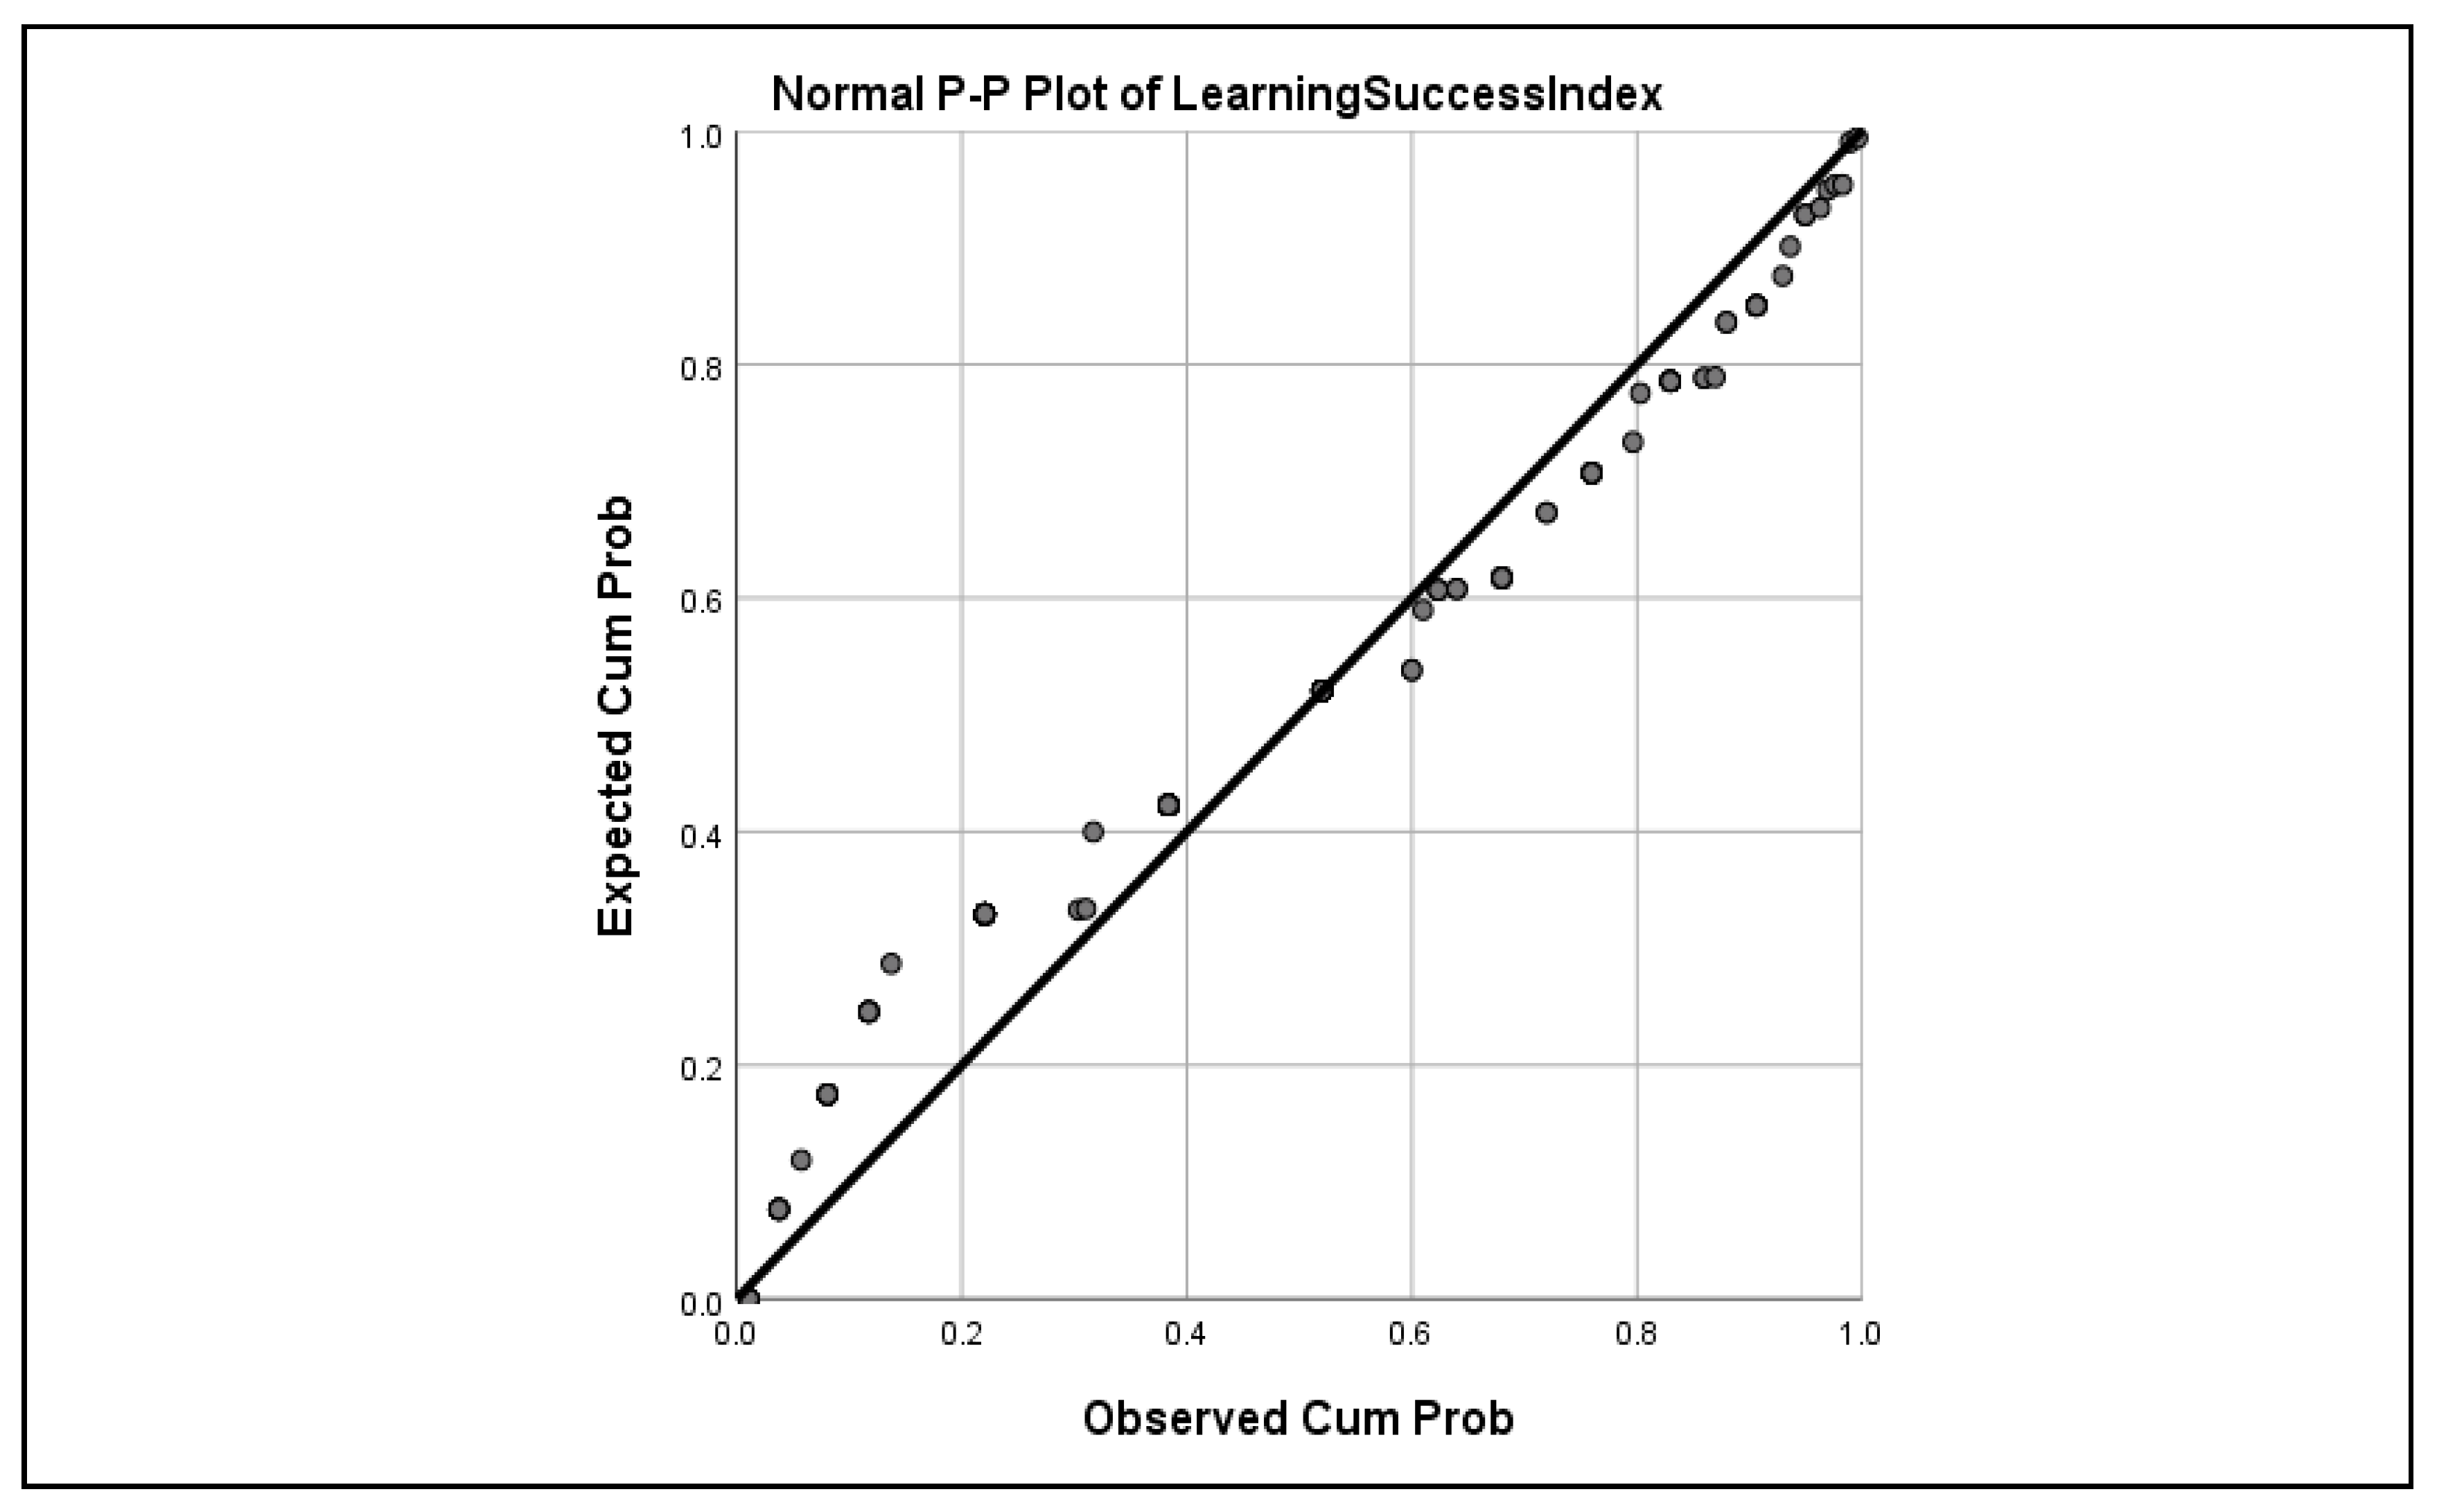
Key variables were stated or perceived EA (IV) and LS for Learning Success dependent variable (DV). LS is a composite index, computed from six unweighted indicators (Meets Needs, Learning, Loyalty, Ideal, Success in Learning and Easy Follow). A Cronbach Alpha of 0.834 confirmed its internal reliability.

6. Analysis and Results

6.1. Descriptive Data and Characteristics

To investigate the influence of LD on Learning Success (LS) (RQ1), EA’s influence on LS (RQ2) and the constituents of EA (RQ3), the research analysed 150 cases. The research examined the data for outliers but did not remove the three cases where LS = 5 (Excellent). It seems reasonably plausible that a handful of students were genuinely delighted and felt they had made real learning progress. Therefore, the research bore a negligible risk of misleading outlier influence. Table 2 below provides further LS details. The LS mean score was 3.298 with a standard deviation of 0.676. Given the low standard error (SE) of 0.0552, the mean LS score likely reflects the population, although student perceptions fluctuate by 0.676 either side of this (1 SD). Generally, Chinese students enthused about their own learning success. The Russian cohort varied, perhaps reflecting the artificial lumping of diverse republics in their single category.
To analyse the data, the research used both nonparametric as well as parametric statistical techniques like Ordinary Least Squares (OLS) regression analysis. In general, nonparametric tests stipulate fewer assumptions but are less powerful (although more reliable if parametric assumptions are violated). In any event, prior to inferential analysis, graphical and diagnostic tests evaluated linearity and conformity to parametric data assumptions, including a reasonably normal distribution. When assumptions are violated, OLS regression coefficients, can become inefficient and possibly unreliable. Standard error estimates are wrong so that the true variability of the data is understated which inflates model fit (R2) and increases the chance of Type 1 error (incorrect rejection of the null hypothesis or false positives). The research assumed LS was interval and that the residuals or differences between actual observations and fitted ones have or are:
  • Mean of zero, E(ut) = 0 with a constant variance, Var (ut) = σ2 < ∞
  • Independent or uncorrelated with predictors, Cov (ut, xt) = 0
  • Uncorrelated with each other, Cov (ut, uj) = 0
  • Normally distributed. Ut ~ N (0, σ2).
Heteroscedasticity involves variability of residual variance so beyond the IV drivers, ‘noise’ buffets the DV, scattering residuals. OLS regression gives equal weight to all observations, but, with heteroscedasticity, some observations are disturbed by significant, but unknown, influences. Rather than diagnostic tests (e.g., White test), the research used a graphical approach to investigate the data behaviour, e.g., of LS regression residuals against the normal distribution (PP plots in Figure 2), against the DV itself or against the EA IV (Figure 4). It found that LS residuals were somewhat skewed, not completely independent and LS fitted dispersion fluctuated systematically, illustrating some but not overwhelming heteroscedasticity. Regression regressions statistics, although unbiased, are likely unreliable.
Although the regressions were sensitive to specification changes, indicating some multicollinearity between independent variables (IV), Variance Inflation Factor (VIF) were below the 2.5 acceptable multicollinearity threshold. To assess autocorrelation between current ut and previous (lagged) value ut−1, the research did not plot ut against ut−1 or ut against time but computed the Durbin–Watson test (1951). For the four regressions, the DW statistic was around 2, suggesting no autocorrelation.
OLS regressions assumes residuals are normally distributed or Ut ~ N (0, σ2). To detect outliers, investigate linearity and variance equality, the research plotted dependent variable (LS) against the independent one (EA). To check deviations from normality (skewness), we also plotted actual against expected cumulative regression residuals (P–P plot). As extreme outliers can pull regression model towards themselves, we used studentized rather than standardized residuals. According to Brooks and Tsolacros [88] (p. 168), for sufficiently large sample sizes, ‘violation of normality assumption is virtually inconsequential’ though it is good practice to eliminate outliers unless this fudges results (useful information eliminated). Figure 2 illustrates the P-P plot of the DV (LS) that suggests that there were fewer low LS scores than for a normal distribution.
The P-P plot suggests obvious departures from normal distribution, confirmed by skewness statistics. Negative skew indicates that the tail on the left side of the LearningSuccess (LS) distribution is longer than the right side-bulk of the values lie to the right of the mean. The −2.1 result suggests departure from normality is just on the acceptable threshold. The computed z-score for skewness is (−2.027/0.198) = 10.24 which exceeds the critical recommedned level of 3.29 for medium-sized samples (50 < n < 300). We therefore reject the null hypothesis that the distribution is normal. The absolute kurtosis exceeeds the 7.1 threshold, suggesting a leptokurtic or peaked distribution. Testing the excess kurtosis (9.938-3/0.394) only confirms the absolute assessment. Overall, the evidence suggests that parametric techniques could be compromised because the distribution of the dependent variable under investigation deviates from normality and could be distorted by outliers. Even though less efficient, prudence dictates we run some nonparametric tests.

6.1.1. RQ1: Impact of Learning Dispositif—Independent samples

If dispositifs influence learning (RQ1/H-LD1), LS means should vary significantly between student cohorts.
The box plot in Figure 3 above illustrates cohort differences and indicates some outliers in the Western cohort that could distort statistics. To compare Learning Success (LS) means between the cohorts, the research also ran some diagnostic tests. ANOVA is a parametric test for significant differences in group means. The ANOVA result (see Table 3 below) indicates significant differences in means of cohort LS as the F-statistic is extremely sensitive to non-normality but the low power Levene’s test can inadvertently fail to reject the null-hypothesis. To confirm the result, we ran the Welch test (at the bottom of Table 3). Although the Levene’s result points cohort variances are insufficient to undermine the Student t-test (ANOVA), according to Delacre et al., [89], the low power of the Levene’s test means it only picks up any real difference 63% of the time. The more robust Welch test (Table 3 bottom) increased confidence in the robustness of the results. Further post-hoc pairwise tests could have teased out more information about group differences, but such additional testing would be ‘nice to know’ rather than necessary for the RQ.
For RQ1, to investigate whether the Learning Success dependent variable mean varied significantly across cohorts, we also ran other nonparametric tests. The Kruskall Wallis test was highly significant (p = 0.00) and again rules out the null hypothesis of independent cohorts at the 5% level. The KR test is robust for ordinal data (where spacing between adjacent values is not necessarily constant). Like the Mann–Whitney U test (for 2 groups), the KW compares the sums of ranks. A test Chi-squared, {χ2} was significant (p = 0.000) and confirmed divergence of LS between cohorts.
However, the ANOVA, Welch, KR and χ2 tests on RQ1 yielded no information about the strength of the relationship between learning dispositif and learning success. Pearson correlation coefficient (r) showed relationship strength but it assumed normal interval data, so we used the SPSS <means> procedure. We first tabulated the four cohorts and tested Eta {ϵ} which like r, varies between −1 and +1. The procedure generated ϵ = 0.422 (not tabulated) which suggests that cohort (also known as LD) moderately influenced LS. The 0.178 ϵ2, rather like R2 in regression, suggests that almost 18% of LS fluctuation can be explained by variation in LD.
For RQ1: LD moderation of LS, the box plot and the battery of parametric and nonparametric diagnostic tests confirms not only that LS differs significantly between student cohorts but also its impact is quite strong. To conclude for RQ1, we can say that learning dispositif significantly influences stated learning success. Further post hoc tests could help probe group differences.

6.1.2. RQ2: Impact of EA on Learning Success (LS)

To investigate the second RQ about the impact of emotional attachment (EA) on learning, we evaluated the two alternate hypotheses: either EA is insignificant for learning success (H-EA0) or, the opposite, that it drives learning success (H-EA1). We first inspected scatter-graphs and then used a combination of nonparametric tests and regressions to investigate the association between EA and LS.
Figure 4 suggests at best a weak linear positive relationship between EA and LS but the DV dispersion indicates other factors at play and suggests heteroscedasticity. Hence, we used nonparametric tests (freed from normality assumptions) to investigate the impact of EA on LS. Table 4 illustrates the results of the SPSS <means> procedure. Like r and Eta (ϵ) Cramer’s V and Phi, vary between −1 and +1. Cramer’s V (CV) was below the 5% significance threshold and indicates a strong relationship. The CV of 0.218 implies around 20% of fluctuations align. As Phi (Φ) only works for dichotomous variables, we ignored it.
Eta (ϵ) also indicates the IV (EA) affects the DV (LS). Eta (ϵ) of 32 suggests a moderate positive association. Eta squared (ϵ2) has same interpretation as R2 and indicates that EA accounts for around 10% of learning success. The positive CV and ϵ support the rejection of the null hypothesis (H-EA0) and support its alternative that EA significantly influences LS. However, to confirm the impact of EA on LS, we also computed the Spearman’s rho (p). The statistic is a nonparametric alternative to the Pearson correlation coefficient but was insignificant (p of 0.114) with p = 0.131 and somewhat undermined confidence in the strength of association between Learning Success and Stated EA Class.
Given these mixed nonparametric results and notwithstanding some concerns about OLS assumptions, the research used multiple regression to investigate the impact on LS of various learning and emotional IVs. Underlying educational theory (distilled in the draft explanatory framework Figure 1) and stepwise regressions (via SPSS <Automated Linear Modelling> procedure) helped identify potentially useful initial regression variables. Stepwise regression uses statistics to identify predictors whist the alternative hierarchical regression approach uses theory to determine predictors [90,91]. Given that the extensive body of learning knowledge [92] implicating most regressors, an initial stepwise approach made sense, although LD diversity pointed to the potential for hierarchical refinement. The research then ran four OLS regressions using some of these variables (including EA). Only the last two regressions were significant at the 5% level (p value of the F statistic < 0.05). Given the somewhat compromised distribution of the IV (LS), discussed earlier, we used graphical techniques to check normality (P-P plots) and variance of residuals. The P-P plots suggested regression residuals were reasonably normal, but the residual plots illustrated a systematic upwards drift with DV. The implied heteroscedasticity undermines the reliability of the regression coefficients. Ideally, error should be randomly dispersed as IV increases (stochastic residuals). As discussed earlier, we computed Durbin–Watson statistics and VIFs to check that, respectively, DV was decoupled with its previous values (autocorrelation) and model drivers were independent (multicollinearity).
Regression 1 forcing variables (IV) were Attached, Teacher Presence, EA, Passion, Relationship, Years IELTs, Connection, Affection, and Initial Competence. The p value for the F statistic (see Table 5) was 0.219 so the model was not statistically significant and can be ignored.
For Regression 2, three obvious outlier cases were removed, using pairwise option, because the attribution of LS = 0, was presumably due to missing inputs. Previously insignificant EA and Competence were eliminated to assess the impact of EA constituents like Passion, Connection, Relationship, Attached and Affection could explain fluctuation in learning. However, as illustrated in Table 6, overall the model proved only significant at the 10% level (p value of the F statistic = 0.099). The overall explanatory power improved marginally to just over 18% (Adjusted R2). Years IELTs was the only significant variable but, given the F statistics and linearity and heteroscedastic issue (not illustrated), little reliance can be placed on this variable’s 0. 012 p-value.
Dropping the number of regressors from seven to five in Regression 3 achieved significance (see Table 7) for the overall model but reduced its explanatory power to around 14%. At 5% level, Affection was the only significant IV but Relationship passed 10% significance threshold. However, a residual plot for Regression 3 (not shown) illustrated an upward drift (non-stationary or autocorrelated errors) and some heteroscedasticity, making regression statistics unreliable.
Regression 4 investigated the impact of Passion, Years IELTs, EA, Affection, Relationship and Attached on learning but also introduced Cohort Dummy for full-time university students. In hindsight (see study limitations), four dummies may have improved model fit, although reducing parsimony [88]. Table 8 indicates that Regression 4 was significant overall with an increase in explanatory power to around 23%. However, individually all variables were insignificant aside from the new cohort one. Passion variable yielded an unexpected negative sign but, as the coefficient is very small, this negative is probably not real, and a stepwise procedure might remove it. Whilst a PP plot (not illustrated) suggested a reasonably normal distribution of residuals, a plot of Regression 4 residuals illustrated a clear split in the DV pattern, presumably due to cohort distortion or the hierarchical impact of institutional and social context, captured in LD.
To conclude the regression analysis, the research ran four regressions on LS. Only R3 and R4 were significant, as indicated by significant F tests at the 5% level. All models had disappointing explanatory power with their variables only accounting for under a quarter of learning success. In R3, apart from the constant, only Relationship and Affection were significant. R4 had the highest explanatory power of 23% but none of its IVs were significant except for the Cohort dummy which separated Chinese classroom learners from global online ones. There are two possibilities. The first is that Chinese cultural and other LD factors swamp the impact of EA or other learning drivers [93]. Alternatively, discrepancies between the online and classroom survey instruments explains Cohort’s salience.

6.1.3. RQ3: Constituents of EA

The third research question involved exploring the constituents of EA. The average student rated their EA to either class or course at 3.84 out of 5, although opinions varied widely (σ = 0.844). We used three data exploratory techniques to untangle the constituents (factors) of EA and validate the literature-derived draft explanatory framework (see Figure 1) with its five postulated EA constituents (Affection, Connection, Passion, Teaching Presence and Flow). The exploratory data reduction techniques employed were Principal Component Analysis, Nearest Neighbour Analysis and classification trees (CHAID). Unlike Thomson, MacInnis and Park [57], the research did not use Factor Analysis or Cronbach’s Alpha or to check internal consistency of EA draft constituent indicators. Exploratory Factor Analysis (EFA) is a data reduction technique that groups together variables with similar behaviour to identify constructs underlying the observed pattern of variable variances and covariances. Unlike in a typical, EFA approach we had an a priori theory about the variables influencing learning. The pattern of actual observed component loadings in Table 9 indicates that the literature-derived draft framework in Figure 1 is somewhat simplistic. The variables investigated were Affection, Connection, Attached, Passion, Teacher Presence, Relationship, Friendliness, Delighted, Trust, Love, Fear, Hope, Affective Expression Humour, Self-Disclosure, Communication, Acknowledgement, Appreciation and Salutations. Iterations were run by Varimax rotation on high EA scores using Principal Components extraction and correlation. Factors were extracted if Eigenvalue >1 but parallel analysis would likely improve results. Table 9 illustrates the first four components.
The first component loaded well on Passion and Delighted whilst for the second Affective Expression, Humour and Relationship emerged as key aspects, considered to reflect presence. In contrast, the third component loaded negatively on Relationship and Love but strongly on Connection The fourth component coalesced variables of Affection, Trust and Communication but is simply labelled as Flow. The diversity of components perhaps mirrors that of students so that some might be more cognitively and instrumentally orientated, rather than emotionally driven. Methodologically, we acknowledge that a confirmatory factor analysis (CFA) to validate these choices would have strengthened our analysis.
Further explorations of EA and LS involved a Nearest Neighbour Analysis (k-NN). The data investigation technique is a nonparametric classification method that weights and assigns observations based on neighbour distance. The k-nearest neighbour (NN) algorithm is a non-parametric classification method that uses neighbour distance to weight and assign observations. We applied NN to resilient regressions variables Teaching Presence, Years and EA. NN iteratively ‘trained’ itself on part of the data (training variables) and then tested its Learning Success predictions to find natural data groupings (see Figure 5 below).
The NNA in Figure 5 suggests that EA varies years of learning but with unexperienced and highly experienced groups susceptible to emotions. Presumably, inexperienced students depend on instructors whilst, perhaps, veterans have become jaded by cognitive learning and seek distraction. Overall, the influence of teaching presence seems variable and independent of learning period. Clearly, for EA no one size fits all.
The research also generated a classification tree (not illustrated) to explore the LD–EA data (see Supplementary Materials). Chi-square Automatic Interaction Detector (CHAID) is a non-parametric diagnostic tool to help untangle variable relationships [93]. The CHAID predictive model, or tree, suggests learning (LS) hinges on Relationship, with a clear split in the behavior of the DV above or below Relationship = 3 (Good). Above the Likert median, the data split into two groups—students with relatively distant relationships (3.18) and feeling closer to their L2 instructor bonds (3.5).

7. Summary of Statistical Results

The research interviewed a diverse pragmatic convenience sample of 150 online learners or higher education students. The sample was international but the main student cohorts were from the UK and China. Statistical analysis of responses found stated learning and emotional engagement differed significantly across cohorts. Nonparametric techniques indicated that EA impacts on learning, but regressions were inconclusive. However, LD significantly influences perceived learning success. Hierarchical stepwise analysis could possibly have improved regression fits, given cohort diversity and complexity of factors interactions [91]. However, exploratory techniques like factor analysis hints at a dynamic mix of emotional or cognitive motivations during the student learning journey, involving structural breaks in student–instructor relationships. Whilst regression analysis eliminates Passion from the EA system, Classification Tree analysis confirms the intuitive understanding that relationships are important emotional conditioners. A Nearest Neighbour Analysis reinforces the view of student cohort diversity with respect to their emotional engagement in learning. Overall, the statistical analysis leaves a mixed picture and suggests that covariates act in a complex fashion to mask the subtleties of EA and learning. These somewhat inconclusive quantitative findings echo wider methodological debate between nomothetic and idiosyncratic research approaches. To resolve this nomothetic/idiosyncratic conundrum and investigate the nuanced interplay of context, culture and covariate factors influencing learning, the research conducted some qualitative expert interviews.

8. Qualitative Research

In 2017, the research interviewed seven academic experts, each with over a decade of university teaching experience. To mitigate information asymmetry and cultural misinterpretation [94,95] and obtain authentic and unbiased responses, the research handled the interviews sensitively. The interviews and embedded reflection suggested that EA is generated by sensitive handling of socio-cultural and learning (SEND) needs to generate programme-relevant, scaffolded modules that include problem-based and socio-culturally appropriate learning activities and assessments. Pragmatic cases, discussion and regular feedback nurture reflection and applied critical analysis or CP. In short, EA does not operate in isolation but interacts with the learning dispositif to facilitate learning, but its relevance varies with student’s learning journey. The experts linked learning engagement with sensitivity to student needs, well-designed programmes, structured modules and culturally-embedded lessons. Instructors need to be flexible and adapt to events or revelations of student interests or phenomenological experiences. For sustained and compelling, interactive sessions, Passion needs harnessed to learner needs and pedagogic professionalism. Teaching is a reflective craft that blends complicated practice and specialized knowledge in a dynamic context. It obvious that perceived learning success (LD) is a questionable metric of learning merit, particularly if students are not adequately challenged or content is dumbed down and contentious dialectic suppressed. Other pragmatic interview normative suggestions for learning enhancement included:
  • Robust back-office systems, curriculum and module design
  • Sessions to understand student socio-cultural, SEND or learning needs
  • Culturally embedded, scaffolded and pragmatic learning activities, linked to salient issues or student problems (triggers)
  • Build trust through sustained, but low-stress feedback
  • Sensitive handling of student-teacher relationships in blended and flipped learning environments
  • Appropriate use of technology to support learning and build flow
  • Continuous critical reflection on teaching.

9. Synthesis

The synthesis of quantitative with qualitative results suggests that LD and EA influence learning but in a complex and dynamic learning system. Divergence in student cohort educational systems (LD), complex interactions with associated factors and student learning stage muddy the statistical waters. While data are clearly grouped by LD and so lend themselves to hierarchical analysis, the nonparametric and parametric tests provided inconclusive EA and learning evidence. Nonparametrically, the Eta of 0.32 suggested a moderate positive association but Spearman’s rho found no significant correlation between EA and learning. Notwithstanding the inconclusive statistical results, the literature and qualitative research suggests that EA is a multidimensional latent variable. Indicatively, its main constituents are Affection, Connection, Social Presence, Teaching Presence and Flow but these are conditioned by the socio-cultural milieu (LD) and interactions with fluctuating factors like trust and relationships. Recognizing the need for further investigations, Figure 6 below illustrates how the cultural and institutional milieu of the learning dispositif could condition EA.

10. Conclusions

The research used an explanatory sequential mixed method (quantitative and qualitative) approach to investigate the role of emotional attachment (EA) in learning in distinct cultural and institutional milieus or learning dispositifs (LD). The research involved a structured literature review to develop a framework, a survey, some expert interviews and embedded reflections on teaching practice. The research harnessed the child development, health, marketing, place making and learning literatures to generate an LD–EA framework which structured its survey questions. In 2017 and 2018, researchers distributed the instrument, in online or hardcopy modes, to diverse global student cohorts and collected 150 responses. Statistical analysis supported the intuitive assumption that learning differs significantly across cohorts. Nonparametric tests suggest that EA influences learning significantly but regressions could not definitively isolate it from other learning drivers. Possibly, hierarchical analysis on diverse cohorts could have improved regression results. Data reduction generated four components that emphasised different draft framework constituents and suggest a spectrum of cognitively, instrumentally or emotionally orientated students. However, no CFA was carried to strengthen assurance in results. Cluster analysis confirmed distinct student groupings, linked to years of learning where student relationships with instructors diverged. Notwithstanding some indeterminate nomothetic results, it is important to stress that this research used mixed methods so that the statistical analysis was only one aspect of our LD–EA investigation. The study’s qualitative findings emerged from Framework Analysis of the open-ended survey questions, expert interviews and embedded teaching reflection. The quantitative and qualitative synthesis is that EA’s influence is conditioned by the learning dispositif (including sociocultural milieu) but fluctuates during the student learning journey. Figure 6 illustrates that emotional attachment constituents for learning include Affection, Connection, Social Presence, Teaching Presence and Flow. EA supports learning in conjunction with other aspects of a calibrated learning system, tailored to students’ diverse learning and sociocultural needs. Learning engagement is underpinned by socioculturally relevant, scaffolded learning activities. Sequenced, formative and summative feedback is critical but should be preceded by setting the right learning climate that respect student’s sociocultural or SEND situation and welcomes errors as learning levers. In our conceptualization of EA, reflective and critical learning or Cognitive Presence (CP) is an outcome from the interaction of Affection, Connection, Flow, TP and SP when these system constituents are sustained by needs-focused and scaffolded content, activities and feedback that fosters meaningful discourse. Pragmatically for instructors, awareness of cultural backdrop and emotions is a useful pedagogical consideration within an inclusive, benevolent and trustworthy educational system. We acknowledge some statistical study limitations, but its tentative findings make a useful preliminary contribution.

Supplementary Materials

The following are available online at https://www.mdpi.com/2227-7102/9/4/279/s1, Learning Dispositif and Emotional Attachment (LD-EA) survey data.

Author Contributions

Conceptualization, S.H. and E.H.; methodology, S.H. and E.H.; software, S.H. and E.H.; validation, S.H., E.H. and M.K.; formal analysis, S.H. and E.H.; investigation, S.H., E.H. and M.K.; resources, M.K.; data curation, S.H., E.H. and M.K.; writing—original draft preparation, S.H. and E.H.; writing—review and editing, S.H., E.H. and M.K.; visualization, M.K.; supervision, S.H.; project administration, S.H.

Funding

This research received no external funding.

Conflicts of Interest

The authors declare no conflicts of interest.

References

  1. Chomsky, N. Chomsky on Miseducation; Rowman and Littlefield: Oxford, UK, 2000. [Google Scholar]
  2. Piketty, T. Le Capital au XXIe Siècle; Éditions du Seuil: Paris, France, 2013. [Google Scholar]
  3. Ryan, F. Education “Choice’ Is Code for Inequality-and It Has Polluted Our Education System” The Guardian, UK online edition 03 May 2018. Available online: https://www.theguardian.com/commentisfree/2018/may/03/choice-inequality-education-system-social-segregation (accessed on 19 October 2018).
  4. Wilkinson, R.; Kate, P. The Spirit Level-Why Equality is Better for Everyone; Penguin: London, UK, 2010. [Google Scholar]
  5. Saunders, D.B.; Blanco, R.G. Against ‘teaching excellence’: Ideology, commodification, and enabling the neoliberalization of postsecondary education. Teach. High. Educ. 2017, 22, 396–407. [Google Scholar] [CrossRef]
  6. Simon, H. Making management decisions: The role of intuition and emotion. Acad. Manag. Perspect. 1987, 1, 57–64. [Google Scholar] [CrossRef]
  7. Kelly, A. The Curriculum: Theory and Practice; Sage: Los Angeles, CA, USA, 2009. [Google Scholar]
  8. Hussey, T.; Smith, P. The Trouble with Higher Education: A Critical Examination of Our Universities; Routledge: Abingdon, UK, 2012. [Google Scholar]
  9. Kahneman, D.; Tversky, A. Prospect theory: An analysis of decision under risk. In Handbook of the Fundamentals of Financial Decision Making; MacLean, L., Ziemba, W., Eds.; World Scientific: Singapore, 2013. [Google Scholar]
  10. Plutarch. Moralia or De auditione Philosophorum. Loeb Classical Library online edition. Translated by F. Babbitt. 1927, Volume I, pp. 3–69, [48AD]. Available online: https://www.loebclassics.com/view/plutarch-moralia_can_virtue_be_taught/1939/pb_LCL337.7.xml?result=73&rskey=VaTddQ (accessed on 22 November 2019).
  11. Graham, D. Heraclitus: Flux, Order, and Knowledge. In The Oxford Handbook of Pre-Socratic Philosophy; Curd, P., Graham, D., Eds.; Oxford University Press: Oxford, UK, 2011. [Google Scholar]
  12. Simmons, T. Climbing Parnassus: A New Apologia for Greek and Latin; ISI Books: Wilmington, DC, USA, 2002. [Google Scholar]
  13. Freire, P. Pedagogy of the Oppressed; Penguin: Harmondsworth, UK, 1972. [Google Scholar]
  14. Cole, L. A History of Education: Socrates to Montessori; Holt, Rinehart and Winston: New York, NY, USA, 1962. [Google Scholar]
  15. Grundy, S. Curriculum: Product or praxis; The Falmer Press: New York, NY, USA, 1987. [Google Scholar]
  16. Curren, R. Philosophy of education. In The Routledge Encyclopedia of Philosophy; Taylor and Francis: Abingdon, UK, 1998. [Google Scholar] [CrossRef]
  17. Dewey, J. Experience and Education; Collier-MacMillan: Toronto, ON, Canada, 1938. [Google Scholar]
  18. Bloom, B. Taxonomy of Educational Objectives: Cognitive and Affective Domains; David McKay Company Inc.: New York, NY, USA, 1956. [Google Scholar]
  19. Bandura, A. Social Learning Theory; General Learning Press: New York, NY, USA, 1977. [Google Scholar]
  20. Vygotsky, L. Mind in society: The Development of Higher Psychological Processes; Harvard University Press: Cambridge, MA, USA, 1978. [Google Scholar]
  21. Kolb, D. Experiential learning: Experience as the Source of Learning and Development; Prentice-Hall Inc.: Upper Saddle River, NJ, USA, 1984. [Google Scholar]
  22. Felder, R. Author’s preface to learning and teaching styles. Eng. Educ. 2002, 78, 674–681. [Google Scholar]
  23. Krathwohl, D. A revision of Bloom’s taxonomy: An overview. Theory Pract. 2002, 41, 212–218. [Google Scholar] [CrossRef]
  24. Vygotsky, L. Thought and Language; MIT Press: Cambridge, MA, USA, 1962. [Google Scholar]
  25. Wundt, W. Kultur und Geschichte. In Völkerpsychologie Eine Untersuchung der Entwicklungsgesetze von Sprache, Mythos und Sitte (Vol 10); Engelmann: Leipzig, Germany, 1920. [Google Scholar]
  26. Warnock, M. The Warnock Report: Report of the Committee of Enquiry into the Education of Handicapped Children and Young People; Education England. Her Majesty’s Stationery Office: London, UK, 1978. Available online: www.educationengland.org.uk/documents/warnock/warnock1978.html (accessed on 30 September 2019).
  27. Raffnsøe, S. Qu’est-Ce Qu’un Dispositif? L’analytique Sociale de Michel Foucault. Symposium: Revue Canadienne de Philosophie Continentale 2007. Available online: http://www.artsrn.ualberta.ca/symposium/files/original/3c4b537da0ef788b0817598f4a4a46cb.pdf (accessed on 8 September 2019).
  28. Cole, M.; Engeström, Y. A cultural-historical approach to distributed cognition. In Distributed Cognitions: Psychological and Educational Considerations; Salomon, G., Ed.; Cambridge University Press: New York, NY, USA, 1993. [Google Scholar]
  29. Bentham, J. Proposal for a New and Less Expensive Mode of Employing and Reforming Convicts. In The Works of Jeremy Bentham; Bowring, Ed.; Russell and Russell Inc.: New York, NY, USA, 1962 [1778]. [Google Scholar]
  30. Bottery, M. The Ethics of Educational Management; Cassel: London, UK, 1993. [Google Scholar]
  31. Foucault, M. Power/Knowledge: Selected Interviews and Other Writings 1972–1977; Gordon, C., Ed.; Pantheon: New York, NY, USA, 1980. [Google Scholar]
  32. Shmelev, S.; Shmeleva, I. Global urban sustainability assessment: A multidimensional approach. Sustain. Dev. 2018, 4, 1–17. [Google Scholar] [CrossRef]
  33. Dawkins, R. Postmodernism disrobed. Nature 1998, 394, 141–143. [Google Scholar] [CrossRef]
  34. Agamben, G. Qu’est-ce Qu’un Dispositif; Payot and Rivages: Paris, France, 2006. [Google Scholar]
  35. Klikauer, T. What is managerialism? Crit. Sociol. 2015, 1, 1103–1119. [Google Scholar] [CrossRef]
  36. Barnes, J. Aristotle; Oxford University Press: Oxford, UK, 1982. [Google Scholar]
  37. Tweed, R.G.; Lehman, D. Learning considered within a cultural context: Confucian and Socratic approaches. Am. Psychol. 2002, 57, 89–99. [Google Scholar] [CrossRef]
  38. Jack, G. Ecological influences on parenting and child development. Br. J. Soc. Work 2000, 30, 703–720. [Google Scholar] [CrossRef]
  39. Garrison, D.; Arbaugh, J. Researching the Community of Inquiry framework: Review, issues, and future directions. Internet High. Educ. 2007, 10, 157–172. [Google Scholar] [CrossRef]
  40. Garrison, D.; Anderson, T.; Archer, W. Critical thinking, cognitive presence, and computer conferencing in distance education. Am. J. Distance Educ. 2001, 15, 7–23. [Google Scholar] [CrossRef]
  41. Garrison, D.; Cleveland-Innes, M. Facilitating Cognitive Presence in online learning: Interaction is not enough. Am. J. Distance Educ. 2005, 19, 133–148. [Google Scholar] [CrossRef]
  42. Dewey, J. How We Think; D.C. Heath: Boston, MA, USA, 1933. [Google Scholar]
  43. Cartwright, L.; McGregor, D. Developing Reflective Practice: A Guide for Beginning Teachers; McGraw Hill Education: New York, NY, USA, 2013. [Google Scholar]
  44. Garrison, D. Article review-social presence within the community of inquiry framework. Int. Rev. Res. Open Distrib. Learn. 2012, 13, 250–253. [Google Scholar] [CrossRef]
  45. Rienties, B.; Rivers, B.A. Measuring and understanding learner emotions: Evidence and prospects. Learn. Anal. Rev. 2014, 1, 1–28. [Google Scholar]
  46. Cleveland-Innes, M.; Prisca, C. Emotional presence, learning, and the online learning environment. Int. Rev. Res. Open Distrib. Learn. 2012, 13, 269–292. [Google Scholar] [CrossRef]
  47. Felder, R. Learning and teaching styles. Eng. Educ. 1988, 78, 674–681. [Google Scholar]
  48. Schieffelin, B.; Ochs, E. Language Socialization across Cultures (No.3); Cambridge University Press: Cambridge, UK, 1986. [Google Scholar]
  49. Sandholtz, J. Teaching with Technology: Creating Student-Cantered Classrooms; Teachers College Press: New York, NY, USA, 1997. [Google Scholar]
  50. Garrison, D. Online Community of Inquiry Review: Social, Cognitive, and Teaching Presence Issues. J. Asynchronous Learn. Netw. 2007, 11, 61–72. [Google Scholar] [CrossRef]
  51. Garrison, D.; Archer, W. A transactional perspective on teaching and learning: A framework for adult and higher education. In Advances in Learning and Instruction Series; Elsevier Science: New York, NY, USA, 2000. [Google Scholar]
  52. King, A. From sage on the stage to guide on the side. Coll. Teach. 2010, 41, 30–35. [Google Scholar] [CrossRef]
  53. Mazur, E. Peer Instruction: A User’s Manual Series in Educational Innovation; Prentice Hall: Upper Saddle River, NJ, USA, 1997. [Google Scholar]
  54. Cleveland-Innes, M.; Wilton, D. Guide to Blended Learning; Athabasca University Commonwealth of Learning: Burnaby, BC, Canada, 2018. [Google Scholar]
  55. Oxford, R.L. Emotion as the amplifier and the primary motive: Some theories of emotion with relevance to language learning. In Challenges of Second and Foreign Language Education in A Globalized World; Mirosław, P., Mystkowska-Wiertelak, A., Eds.; Springer: Berlin/Heidelberg, Germany, 2018; pp. 53–72. [Google Scholar]
  56. Bowlby, E. Attachment. In Attachment and Loss Trilogy; Random House: New York, NY, USA, 2008 [1969]; Volume 1. [Google Scholar]
  57. Thomson, M.; MacInnis, D.J.; Whan Park, C. The ties that bind: Measuring the strength of consumers’ emotional attachments to brands. J. Consum. Psychol. 2005, 15, 77–91. [Google Scholar] [CrossRef]
  58. Etzioni, A. A Comparative Analysis of Complex Organizations on Power, Involvement, and Their Correlates; Free Press: New York, NY, USA, 1964. [Google Scholar]
  59. George, J. Emotions and leadership: The role of emotional intelligence. Hum. Relat. 2000, 53, 1027–1055. [Google Scholar] [CrossRef]
  60. Oatley, K.; Jenkins, J. Human emotions: Function and dysfunction. Annu. Rev. Psychol. 1992, 43, 55–85. [Google Scholar] [CrossRef] [PubMed]
  61. Linnenbrink, E. Emotion research in education: Theoretical and methodological perspectives on the integration of affect, motivation, and cognition. Educ. Psychol. Rev. 2006, 18, 307–314. [Google Scholar] [CrossRef]
  62. Bechara, A.; Damasio, H.; Damasio, A. Emotion, decision making and the orbitofrontal cortex. Cereb. Cortex 2000, 10, 295–307. [Google Scholar] [CrossRef] [PubMed]
  63. Blazina, C.; Kogan, L. Do men under-report and mask their emotional attachment to animal companions? The influence of precarious masculinity on men’s bonds with their dogs. Anthrozoös 2019, 32, 51–64. [Google Scholar] [CrossRef]
  64. Vincent, J. Emotional attachment and mobile phones. Knowl. Technol. Policy 2006, 19, 39–44. [Google Scholar] [CrossRef]
  65. Birnbaum, G.E.; Reis, H.T. Evolved to be connected: The dynamics of attachment and sex over the course of romantic relationships. Curr. Opin. Psychol. 2019, 25, 11–15. [Google Scholar] [CrossRef] [PubMed]
  66. Appian of Alexandria. 165. Roman History. Available online: http://www.livius.org/sources/content/appian/appian-caesars-funeral/ (accessed on 18 October 2019).
  67. Ashforth, B.; Humphrey, R. Emotion in the workplace: A reappraisal. Hum. Relat. 1995, 48, 97–125. [Google Scholar] [CrossRef]
  68. Morgan, R.; Hunt, S. The commitment-trust theory of relationship marketing. J. Mark. 1994, 58, 20–38. [Google Scholar] [CrossRef]
  69. Garbarino, E.; Johnson, M. The different roles of satisfaction, trust, and commitment in customer relationships. J. Mark. 1999, 63, 70–87. [Google Scholar] [CrossRef]
  70. Immordino-Yang, M.; Damasio, A. We feel, therefore we learn: The relevance of affective and social neuroscience to education. Mind Brain Educ. 2007, 1, 3–10. Available online: https://onlinelibrary.wiley.com/doi/pdf/10.1111/j.1751-228X.2007.00004.x (accessed on 22 November 2019). [CrossRef]
  71. Baumeister, R.; Leary, M. The need to belong: Desire for interpersonal attachments as a fundamental human motivation. Psychol. Bull. 1995, 117, 497–529. [Google Scholar] [CrossRef] [PubMed]
  72. Anderson, T.; Liam, R.; Garrison, D.; Archer, W. Assessing teacher presence in a computer conferencing context. J. Asynchronous Learn. Netw. 2001, 5, 7–23. [Google Scholar]
  73. Hammond, J.; Gibbons, P. What is scaffolding. In Teachers’ Voices 8: Explicitly Supporting Reading and Writing in the Classroom; Burns, A., Joyce, H., Eds.; National Centre for English Language Teaching and Research. Oxford University Press: Oxford, UK, 2005; pp. 8–16. [Google Scholar]
  74. Such, B. Scaffolding English language learners for online collaborative writing activities. Interact. Learn. Environ. 2019, 11, 1–9. [Google Scholar] [CrossRef]
  75. Bardack, S.; Obradović, J. Observing teachers’ displays and scaffolding of executive functioning in the classroom context. J. Appl. Dev. Psychol. 2019, 62, 205–219. [Google Scholar] [CrossRef]
  76. Van Velzen, C.; Volman, M.; Brekelmans, M. There is no need to sit on my hands anymore! Modelling and scaffolding as mentoring tools during co-teaching. In International Research, Policy and Practice in Teacher Education; Murray, J., Swennen, A., Kosnik, C., Eds.; Springer: Berlin/Heidelberg, Germany, 2018; pp. 155–170. [Google Scholar] [CrossRef]
  77. Moore, M. Theory of transactional distance. In Theoretical Principles of Distance Education; Keegan, D., Ed.; Routledge: New York, NY, USA, 1993. [Google Scholar]
  78. Garrett, P.; Baquedano-López, P. Language socialization: Reproduction and continuity, transformation and change. Annu. Rev. Anthropol. 2002, 31, 339–361. [Google Scholar] [CrossRef]
  79. Moore, M. Three types of interaction. Am. J. Distance Educ. 1989, 3, 1–7. [Google Scholar]
  80. Csikszentmihalyi, M. Flow: The Psychology of Optimal Experience; Harper Collins: New York, NY, USA, 1991. [Google Scholar]
  81. Ishihara, N.; Cohen, A. Teaching and Learning Pragmatics: Where Language and Culture Meet; Routledge: Abingdon, UK, 2014. [Google Scholar]
  82. Peters, A.; Boggs, S. Interactional routines as cultural influences upon language acquisition. In Language Socialization across Cultures; Schlieffelin, B., Ochs, E., Eds.; Cambridge University Press: Cambridge, UK, 1986. [Google Scholar]
  83. Coe, R. It’s the Effect Size, Stupid What Effect Size is and Why it is Important; Annual Conference of the British Educational Research Association, Ed.; University of Exeter: Exeter, UK, 2002. [Google Scholar]
  84. Jamieson, S. Likert scales: How to abuse them. Med Educ. 2004, 38, 1217–1218. [Google Scholar] [CrossRef]
  85. Norman, G. Likert scales, levels of measurement and the “laws” of statistics. Adv. Health Sci. Educ. Theory Pract. 2010, 15, 625–632. [Google Scholar] [CrossRef]
  86. Ritchie, J.; Lewis, J. Qualitative Research Practice: A Guide for Social Science Students and Researchers; Sage: London, UK, 2003. [Google Scholar]
  87. Colman, A.; Norris, C.; Preston, C. Comparing rating scales of different lengths: Equivalence of scores from 5-point and 7-point scales. Psychol. Rep. 1997, 80, 355–362. [Google Scholar] [CrossRef] [Green Version]
  88. Brooks, C.; Tsolacos, S. Real Estate Modelling and Forecasting; Cambridge University Press: Cambridge, UK, 2010. [Google Scholar]
  89. Delacre, M.; Lakens, D.; Leys, C. Why Psychologists Should by Default Use Welch’s t-test Instead of Student’s t-test. Int. Rev. Soc. Psychol. 2017, 30, 92–101. [Google Scholar] [CrossRef] [Green Version]
  90. Petrocelli, J. Hierarchical multiple regression in counselling research: Common problems and possible remedies. Meas. Eval. Couns. Dev. 2003, 36, 9–22. [Google Scholar] [CrossRef]
  91. Cressie, N.; Calder, C.; Clark, J.; Hoef, J.; Wikle, C. Accounting for uncertainty in ecological analysis: The strengths and limitations of hierarchical statistical modelling. Ecol. Appl. 2009, 19, 553–570. [Google Scholar] [CrossRef] [PubMed]
  92. Hattie, J. Visible Learning: A Synthesis of Over 800 Meta-Analyses Relating to Achievement; Routledge: Abingdon, UK, 2008. [Google Scholar]
  93. Kass, G. An exploratory technique for investigating large quantities of categorical data. Appl. Stat. 1980, 29, 119–127. [Google Scholar] [CrossRef]
  94. Creswell, J. Qualitative Inquiry and Research Design: Choosing among the Five Methods; Sage: Los Angeles, CA, USA, 2013. [Google Scholar]
  95. Kvale, S.; Brinkmann, S. Interviews: Learning the Craft of Qualitative Research Interviewing, 2nd ed.; Sage: Thousand Oaks, CA, USA, 2009. [Google Scholar]
Figure 1. Literature-derived draft Emotional Attachment (EA) explanatory framework. EA is multi-dimensional construct with five constituents and various factors (source: Authors 2015–2018).
Education 09 00279 g001
Figure 2. P-P plot of Learning Success with accompanying statistics to illustrate moderate divergence from normal distribution. LS statistics to 2dp: 150 observations, skewness −2.03 (SE 0.20), kurtosis 9.94 (SE 0.39).
Education 09 00279 g002
Figure 3. Box plot of LS score for the four Learning Contexts (LCs), illustrating high perception of LS in China and spread of LS results for the Western student cohorts.
Education 09 00279 g003
Figure 4. Scatter graph of Learning Success (LS) dependent variable (DV) against EA independent variable (IV).
Education 09 00279 g004
Figure 5. K-means NN analysis suggests that EA varies by Teaching Presence and Years of IELTs (International English Language Testing System) with both inexperienced and highly experienced groups influenced by emotions.
Education 09 00279 g005
Figure 6. Illustration of the EA-learning system, conditioned by its cultural milieu and constituents, themselves influenced by factors like relationships and trust. Note that unlike in the CoI, for EA reflective learning and critical analysis (Cognitive Presence) is not a system constituent but, rather, a system outcome.
Education 09 00279 g006
Table 1. Survey: student cohort country and regional groupings with comments.
CountryMembersComments
WesternEU, USAGreece and Germany diverge significantly. Latvia is included.
RussiaRF, UkrainePolitically separate and at war.
Asia Middle EastKSA, Oman, UAE, Israel, Iran HK, India, Pakistan Malaysia, IndonesiaIsrael, UAE, HK have quasi Western education systems, but Indonesia is very different.
ChinaPRCOnly one provincial university sampled in a vast and diverse country.
Table 2. Descriptive statistics, including student cohort numbers (N) and representative statistics for learning success (LS) and emotional attachment (EA).
NMin.Max.MeanSESD
LS 1500.005.03.30.06 0.68
EA 150153.8 0.84
Learning ContextLS MeanNSDSE
AME3.41130.440.12
China3.81330.530.09
Russia3.15420.820.13
Western3.10620.530.07
Total3.301500.680.06
Table 3. ANOVA of Learning Success means across cohorts supported by insignificant Levene’s test (showing acceptable variances). Welch’s t-test confirms differences in cohort means.
ANOVA (Student t-Test)Sum of SquaresdfMean SquareFSig.
Between Groups12.1034.0310.520.00
Within Groups56.001460.38
Total69.00149
Welch t-statistic13.40 0.00
Table 4. Non-parametric measures of association between EA and LS (RQ2), illustrating mixed results.
StatisticValueSignificance
Phi0.380.046
Cramer’s V0.220.046
Eta0.32NA
Eta squared0.10NA
Spearman’s rho0.130.11
Table 5. Regression 1 ANOVA with insignificant F test result at 5% level.
ANOVA
ModelSum of SquaresdfMean SquareFSig.
Regression3.3190.371.490.22
Residual4.95200.25
Total8.2629
Dependent Variable: Learning Success Index
Predictors (IV): (Constant), Attached, Teacher Presence, Stated EA Class, Passion, Relationship, Years ISOLL, Connection, Affection, Initial Competence.
Table 6. Regression 2 insignificant F test result at 5% level.
ANOVA
R2Sum of SquaresdfMean SquareFSig.
Regression3.1470.452.000.10
Residual5.42240.23
Total8.5631
Dependent Variable: Learning Success Index
Predictors (IV): (Constant), Attached, Teacher Presence, Passion, Relationship, Years ISOLL, Connection, Affection.
Table 7. Regression 3—significant overall but with low explanatory power of 14.3%.
ANOVA
ModelSum of SquaresdfMean SquareFSig.
Regression5.8651.175.860.00
Residual28.021400.20
Total33.88145
Model Summary
ModelRR2Adjusted R2Std. ErrorDurbin–Watson
R 30.416 a0.1730.1430.447391.85
Coefficients
BStd. ErrorBetatSig.
(Constant)2.290.22 10.270.00
Attached0.040.050.080.800.42
Passion0.030.040.060.620.54
Years ISOLL0.010.010.131.570.12
Relationship0.080.040.171.940.06
Affection0.120.050.192.2270.028
Dependent Variable (DV): Learning Success
Predictors (IV): (Constant), Affection, Relationship, Years ISOLL, Attached, Passion.
Table 8. Regression 4 results, illustrating overall model’s significance and increased (23%) explanatory power. However, aside from Learning Context (LC), other independent variables are insignificant. Passion IV also has an unexpected negative sign.
ANOVA
ModelSum of SquaresdfMean SquareFSig.
Regression9.1071.307.240.00
Residual24.781380.18
Total33.88145
Model Summary
ModelRR2Adjusted R2Std. ErrorDurbin–Watson
R 45.180.270.230.421.9
Coefficients
BStd. ErrorBetatSig.
(Constant)2.650.26 10.010.00
Attached0.070.050.121.350.18
Passion−0.180.04−0.04−0.410.68
Years ISOLL0.000.010.040.480.63
Relationship0.020.040.050.560.58
Affection0.120.050.030.360.72
LC0.480.120.424.120.00
Stated EA0.060.050.101.320.19
Dependent Variable (DV): Learning Success
Predictors (IV): (Constant), Attached, Passion, Years ISOLL, Relationship, Affection, Learning Context (LC) and Stated EA.
Table 9. EDA Principal Components analysis of EA, using Varimax with Kaiser Normalization to identify EA components (constituents).
Indicator (Variables)1234
Affection−0.345−0.1640.4450.685
Connection0.267−0.1240.9220.003
Attached0.572−0.1110.5570.444
Passion0.8310.353−0.1630.125
Teacher Presence−0.2190.020−0.1170.206
Relationship0.4220.583−0.570−0.137
Friendliness−0.0700.1940.065−0.018
Delighted0.8910.1610.0690.021
Trust−0.143−0.368−0.3470.678
Love0.403−0.060−0.7650.049
Fear−0.079−0.3720.302−0.332
Hope0.478−0.165−0.125−0.015
Affective Expression (uses emotion)0.0910.9250.0540.154
Humor0.1960.841−0.154−0.064
Self-disclosure0.6050.0450.0230.073
Communication (continues thread)0.2770.0830.1220.828
Acknowledgement0.029−0.3690.0580.064
Appreciation−0.4100.452−0.069−0.103
Salutations−0.123−0.1960.092−0.679
Inferred componentsPassionPresenceConnectionFlow

