1. Introduction
The education process at the Faculty of Mathematics and Informatics (FMI) at the University of Plovdiv is divided into three trimesters of 10 weeks each per academic year. The students from most majors study English only for two trimesters during their first year at university with a total of 100 seminars. In the course of the English language education students at FMI undergo a number of written examinations. First of all, they sit for a placement test, which determines the language level of each individual learner and, based on their results, students are redistributed from academic groups into language ones. The placement test scores are essential because they ensure the homogeneity of the language groups of learners with similar abilities. Then, students at FMI have classes once a week during which they use web-based materials and work on various projects. For homework, they do online tests in accordance with the exact teaching material covered during the seminars. These are self-study tests, created by the teacher, which are founded on criteria ranging from a lower to a higher level of difficulty [
1]. Students take the self-study tests in their own place and time within the week before their next seminars in English at FMI. The grading of each test contributes towards the final grade that students are assigned at the end of the English course; for this reason, it is crucial that the students’ tests are evaluated fairly and impartially. Besides the placement test and the self-study tests, students also sit for Midterm and Final exams during their course in English.
Fair and impartial assessment of the students’ knowledge and skills is essential not only when high-stakes evaluations are concerned, for instance tests that determine whether a learner is eligible to enroll in or graduate from a school, but also for low-stakes ones. Assessments can help students to gain insight into their own achievements as well as to build confidence in their ability to learn and remain positive and motivated to continue studying. Since the global work culture is changing, students will have to become life-long learners to remain competitive on the job market. Assessment plays a key role in developing the learners’ confidence in their ability to learn and skills to do it throughout their lives.
The main reason to create and administer test examinations to students is to measure their understanding of specific content or the effective application of critical thinking skills. As a consequence, tests evaluate student learning and the level of their academic achievements at a specific stage of the course of studies. Online tests provide a number of benefits; select–response tests such as multiple-choice or true/false ones immediately provide students with their final scores, while open questions allow students to improve their writing by drafting, editing, and rewriting their texts, if necessary. Moreover, the data that tests provide, gathered over time, can help instructors to identify trends and improve their own teaching. In conclusion, assessment allows teachers to collect, record, score, and interpret information about learning.
Some of the advantages of self-study tests are that they support learners of different ages and different abilities; they help them to memorize the content for a longer time and increase student achievement [
2,
3]. Testing not only registers the student’s level of knowledge but also changes it, thus improving the long-term retention of information, which is known as the testing effect [
4]. Self-study tests provide feedback to both the student and the teacher and in this way, they allow for adjustments to the teaching process in order to achieve better final results.
One of the most important indicators of the quality of education is the result from it presented as a grade based on some assessment of a learner’s knowledge and skills. In addition to fulfilling a specific function, the assessment grades must be objective and unbiased; they should indicate the achievement of certain significant results and be understandable for the learners, who have to be informed in advance about the evaluation method and its criteria. Moreover, the grades themselves must not be turned into a goal; they must inform about the student’s progress, and the methods for calculating the grade have to be objective and statistically valid.
Nevertheless, students with similar abilities may be assigned different grades if their achievements are borderline cases, for example, a student who has scored 29 points out of 60 will probably fail, while another one with 30 or 31 points will pass the test, which can be viewed as unfair. In an attempt to find a reasonable and impartial solution to this problem, we have used fuzzy logic to review the results of a specific test taken by 78 first-year students of Informatics at FMI. The test assessed the students’ reading and writing skills in English based on the learning materials and it comprised 61 items, 60 of which were closed-ended questions and one open-ended. The closed-ended items were multiple choice questions with four response options, each one awarding one point for a correct answer, while the open question required students to write a long-text answer to a question and it granted a maximum of 20 points. All the open-ended questions were evaluated by the same teacher following explicit predetermined criteria.
Fuzzy logic has a number of applications in analyzing studies from various areas of education as can be seen from Reference [
5]. Research has been made previously endeavoring to incorporate fuzzy logic and education [
6] or to use fuzzy logic as a tool for assessing students’ knowledge and skills collectively [
7]. However, instead of assessing student groups’ knowledge and skills by means of fuzzy logic, we have used fuzzy functions to reconsider students’ individual assessments in cases where there may be doubts of unfair grading.
3. Fuzzification of Score Metrics
As previously stated, the score metric represented the number of correct answers to 60 questions with a closed answer, each one awarding one point for a correct answer and zero points for an incorrect one, and one question with an open answer, which was graded by the teacher on a scale from zero to 20.
The criteria for constructing the e-tests that we used are based on Bloom’s taxonomy. The closed-ended questions were of similar difficulty and length, they were scored automatically and aim at the lower levels of cognitive thinking by testing the students’ knowledge and comprehension of the learning material. For this reason, the same weight of one point for a correct answer was assigned to each of them. The open question targeted the higher levels of cognitive thinking; it required students to compose a text, in which they provided an opinion and justified it, and this question was evaluated manually by the teacher.
Besides the difference in the level of difficulty in the two types of questions, there was a chance that closed-ended ones may not reflect a student’s knowledge and skills objectively for a variety of reasons, for example guessing, technical errors (automatic change of the selection of an answer while scrolling up or down the webpage), etc. On that account we assumed that the test score metrics relative to the open question were the critical ones, wherefore that item was assigned a higher weight.
The criteria for determining the weight of the open question were based on a scoring guide that we developed, which outlined what information was important in each response and how much credit was given for each part of it. These criteria reviewed the content of the responses—compliance with the topic and logical sequence of the text, adherence to the set format of the text (for example, an opinion essay, letter, etc.) and number of words, adherence to the grammatical norms and rules, correct and accurate use of the vocabulary, wealth of means of expression, and correct spelling.
When items of a test measured the same kind of ability or knowledge, they yielded a high internal consistent reliability. If a test was made up of different kinds of items assessing different types of abilities and knowledge, Cronbach’s alpha coefficient tended to be low as a result of the heterogeneity of the items in terms of format and content. That was why first we decided what weight to place on the open question to ensure that the test was reliable. A wrong decision can sometimes be unfair. Cronbach’s alpha coefficient can easily be calculated by the formula:
The number of questions was , the sum of the variances was , and the test variance was . Applying these numbers in the formula for Cronbach’s alpha coefficient, we got , which could be interpreted that the reliability was just acceptable. The greatest variance appeared in the open question, therefore we searched for a coefficient to multiply the results of the open question, so that became bigger. We chose , then we got: the number of questions was , the sum of the variances was , and the test variance was . Applying these numbers in the formula for Cronbach’s alpha coefficient, we obtained , which could be interpreted that the reliability was excellent.
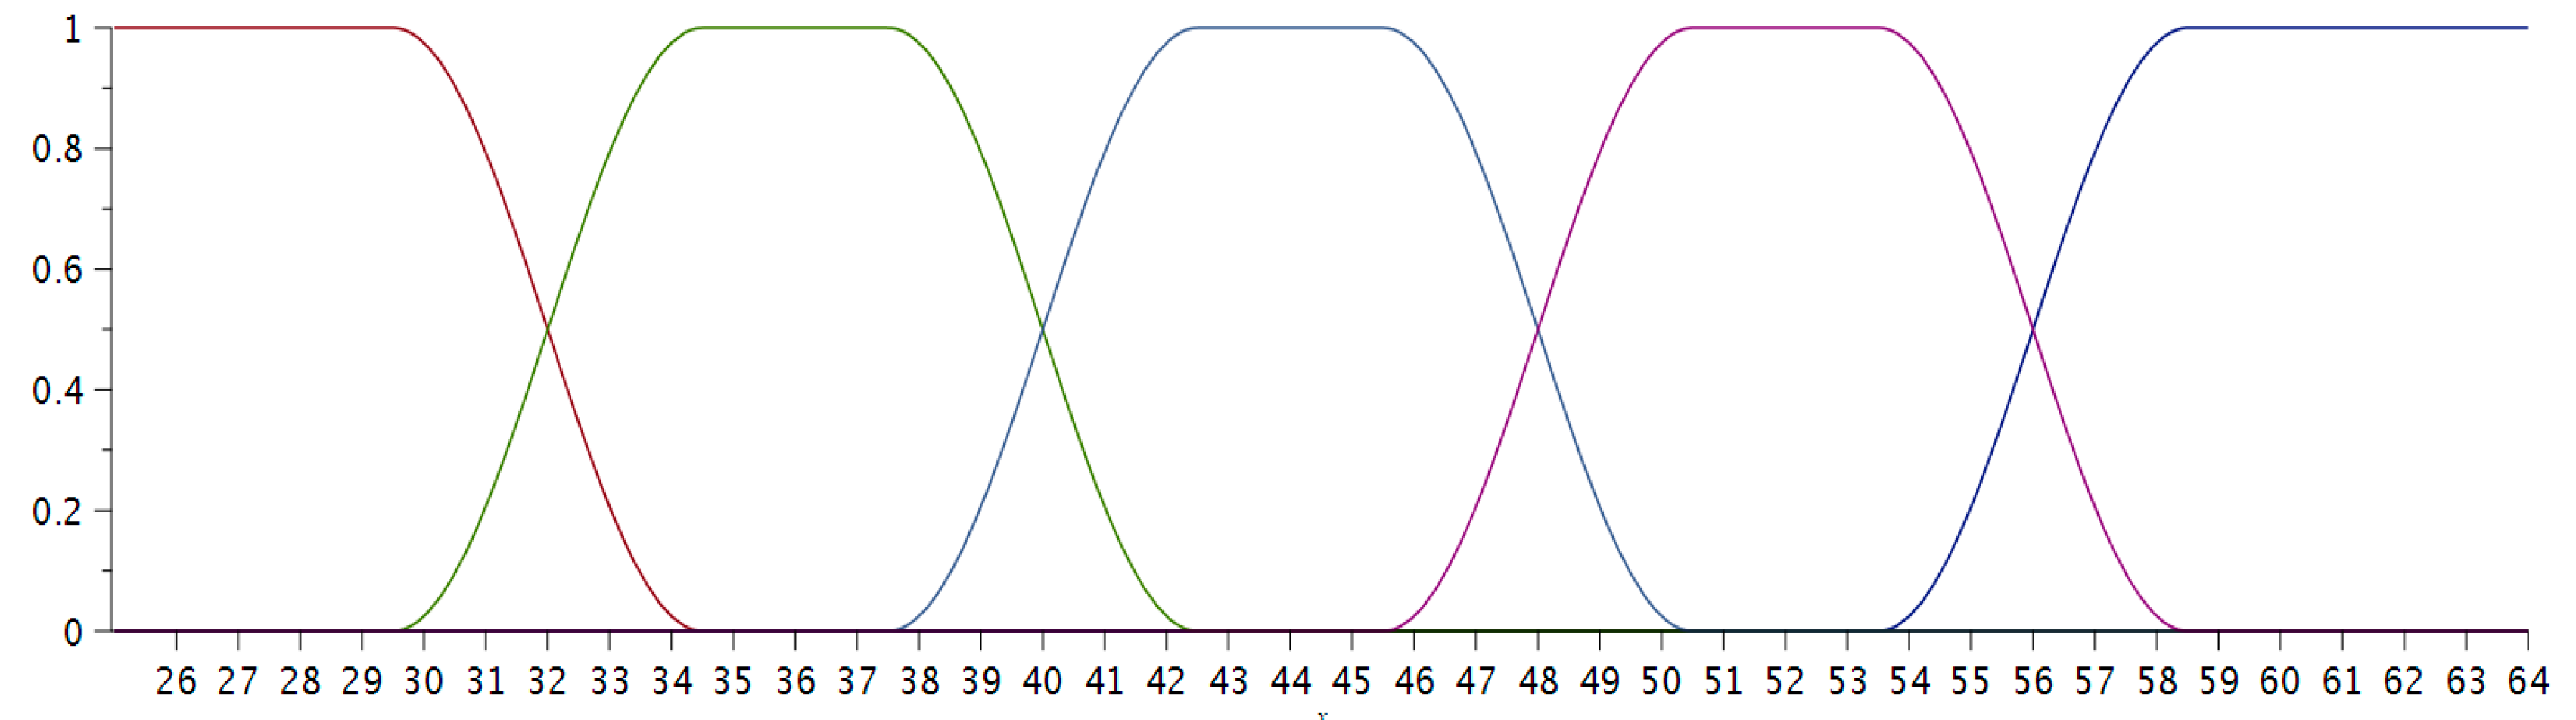
Now the maximum number of points that a student could get was 64 (60 + 20 × 0.2). We defined five categories of grades depending on the number of correct answers obtained by each student: Fail (from zero to 31 points), Satisfactory (from 32 to 39), Good (from 40 to 47), Very good (from 48 to 55), and Excellent (from 56 to 64).
As pointed out by the authors of References [
6,
9,
10,
11], it is difficult and unfair to assign a Good grade to a student with 47 points and to give a Very Good grade to another one with 48 points. Therefore, the use of fuzzy sets is justified. We will need to assume that someone whose test score belongs to the set (37–43) can be assigned either a grade Satisfactory or a grade Good. Thus comes the necessity to use fuzzy sets. Our goal was to apply fuzzy sets and fuzzy logic in the estimation of students’ tests in order to assign them a fairer mark.
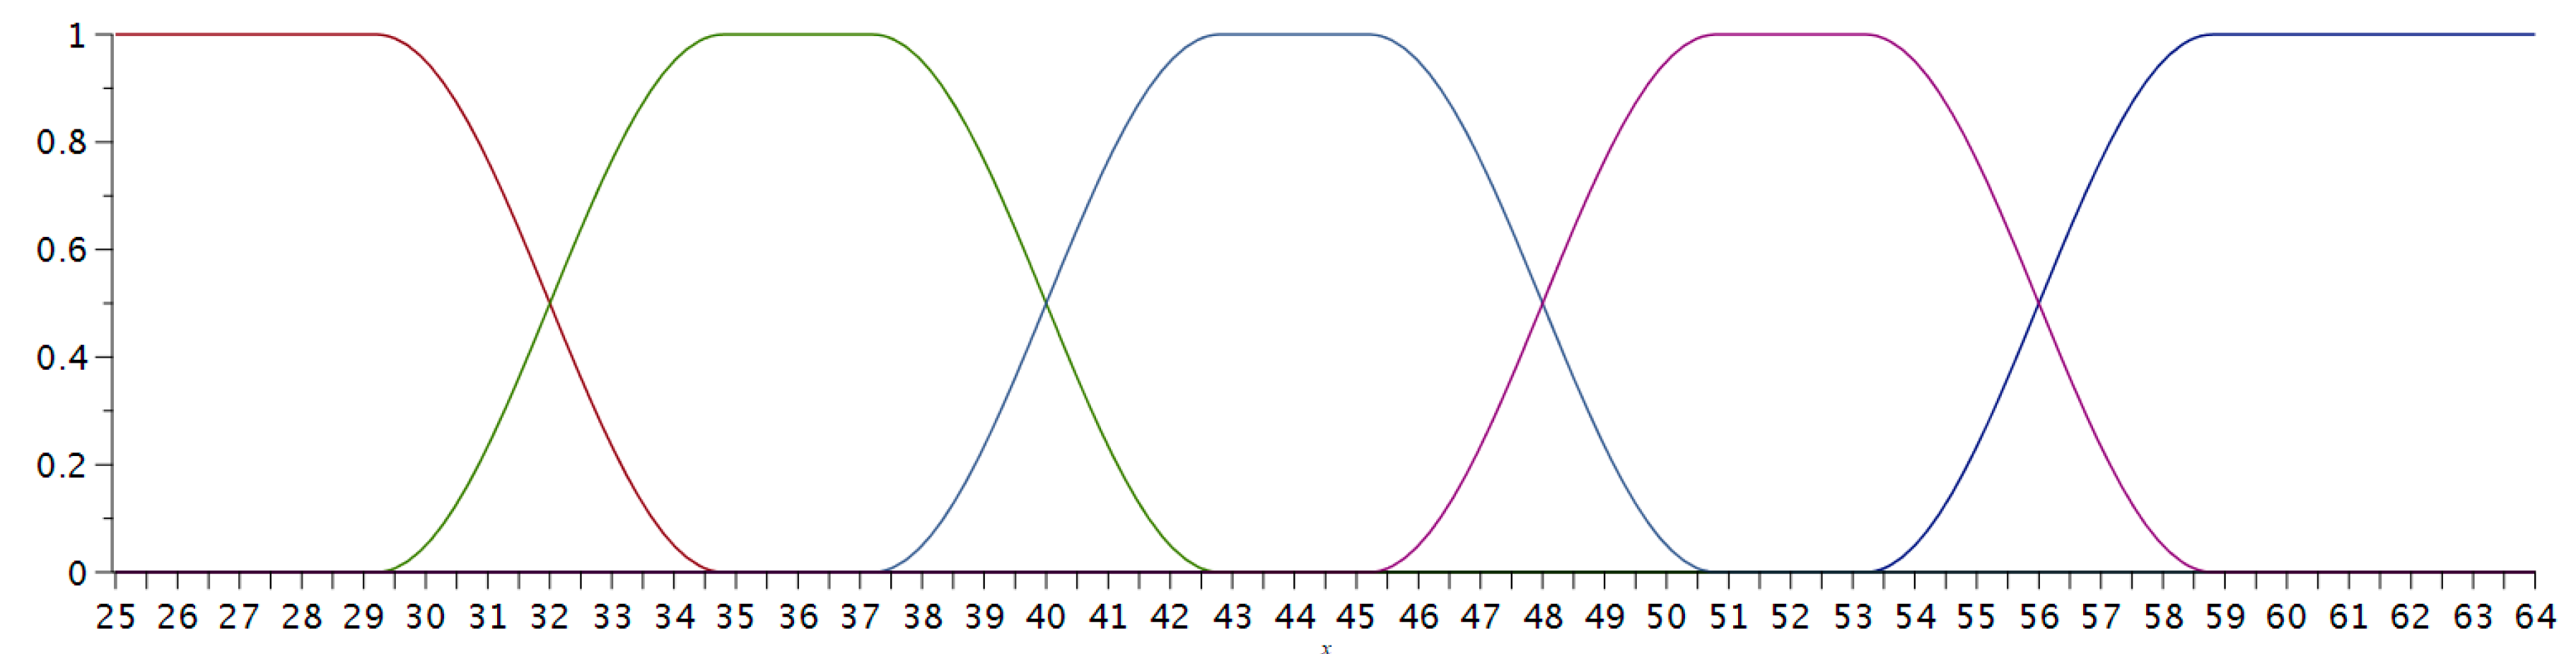
We defined five functions that represent the fuzzy membership trapezium functions to the sets of grades; their plots are given in
Figure 3.
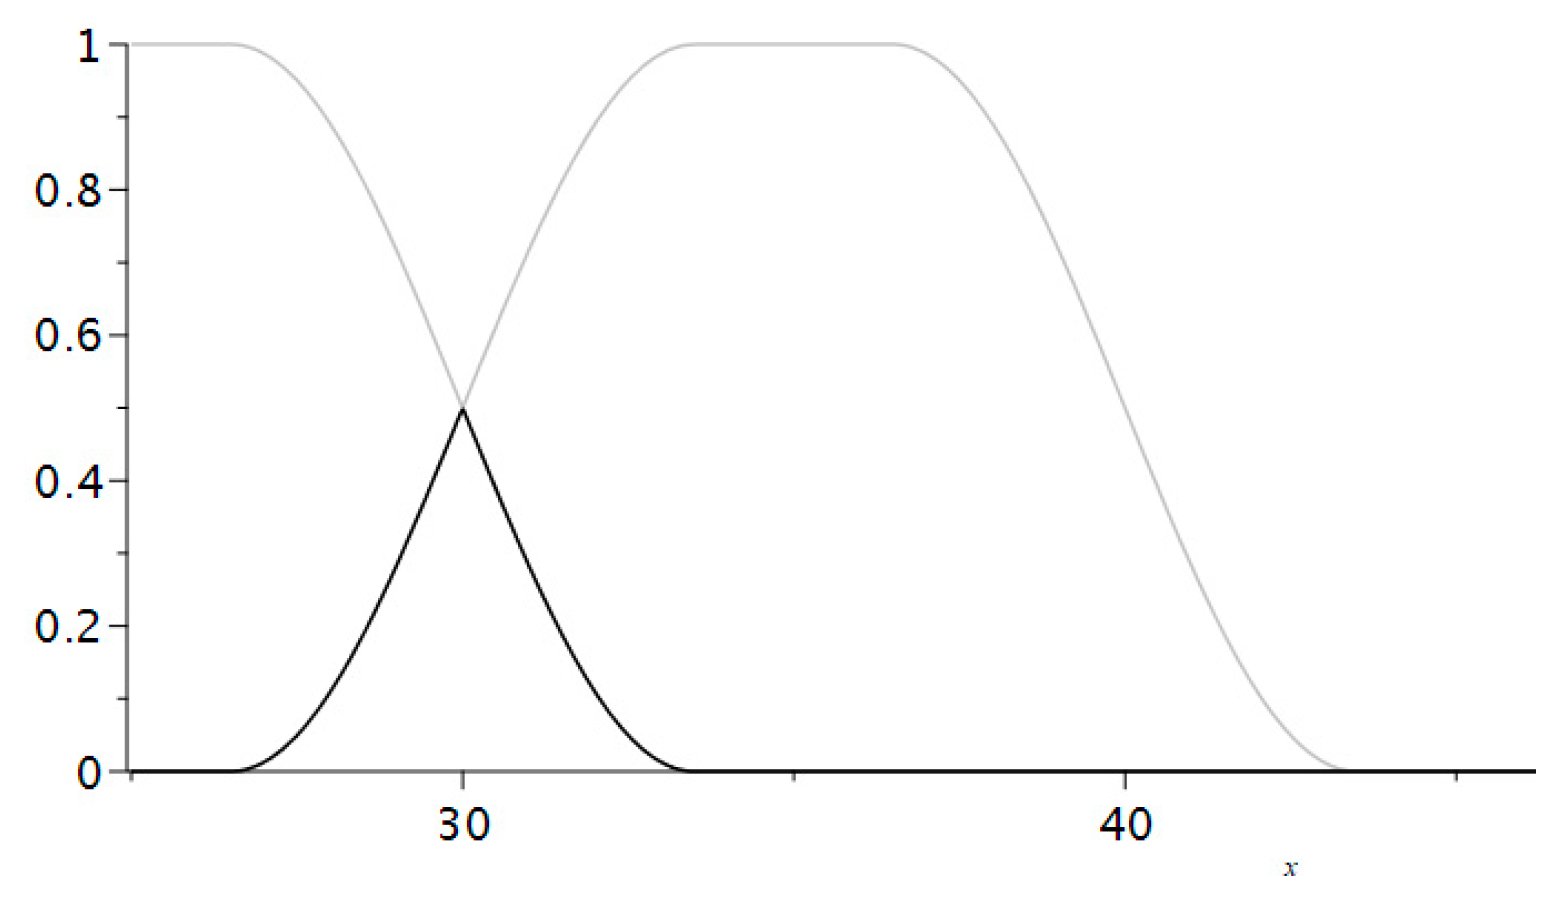
In the case when the points that a student had obtained in a test did not belong definitely to a given set, we needed to select another criterion, dependent on the student’s score, in order to take a decision what grade to assign him/her. Consequently, following the ideas from Reference [
1], the second assessment that was applied to estimate a student’s knowledge was their result of the open question. Furthermore, we divided the students’ grades into five groups again: Fail (from zero to eight points), Satisfactory (from nine to 11), Good (from 12 to 14), Very good (from 15 to 17), and Excellent (from 17 to 20), and we also defined their membership functions (
Figure 4):
The fuzzy associative matrix (
Table 1) provided a convenient way to directly combine the input relations in order to obtain the fuzzified output results [
9]. The input values for the results of the open question are across the top of the matrix and the input values for the total score of the test are down left in the matrix. We used the conventional Bulgarian grading scale.
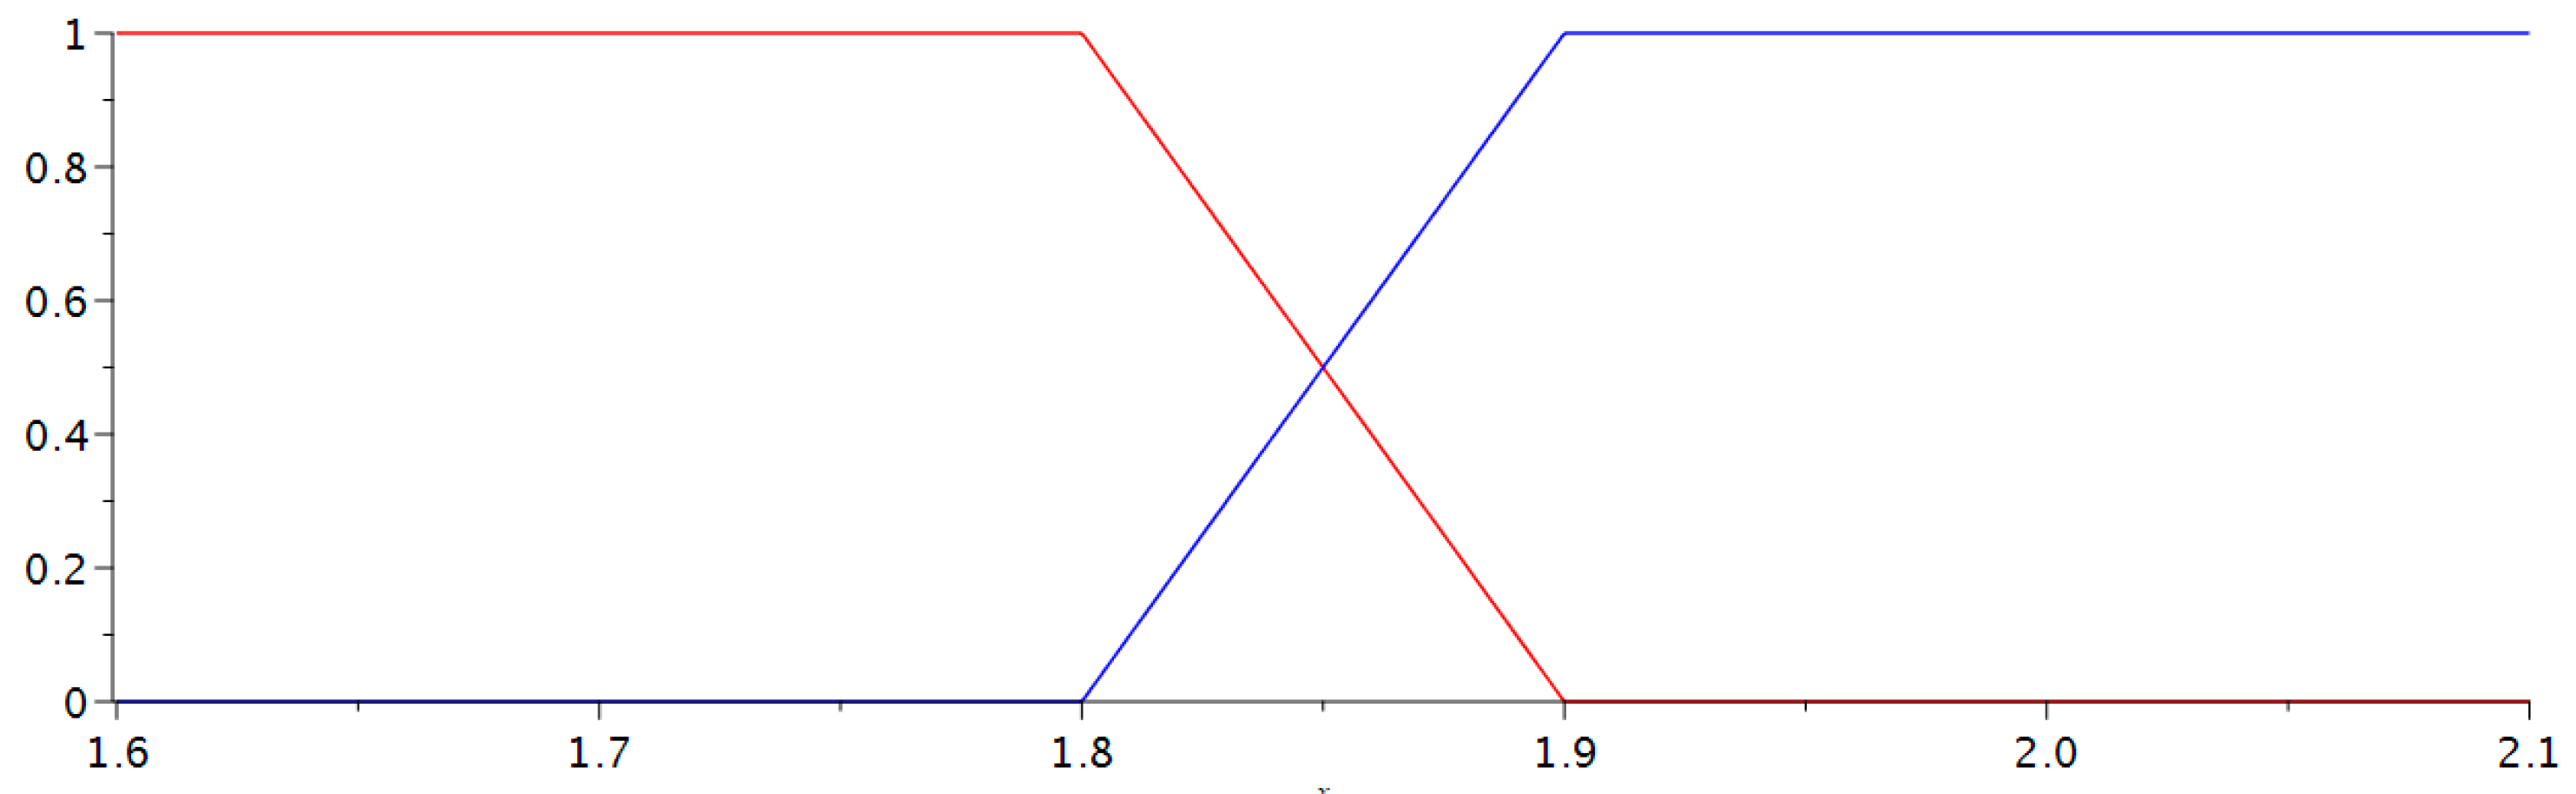
The rules for performing set operations of union (AND), intersection (OR), and complement (NOT), which were of most interest to us, are stated below [
9].
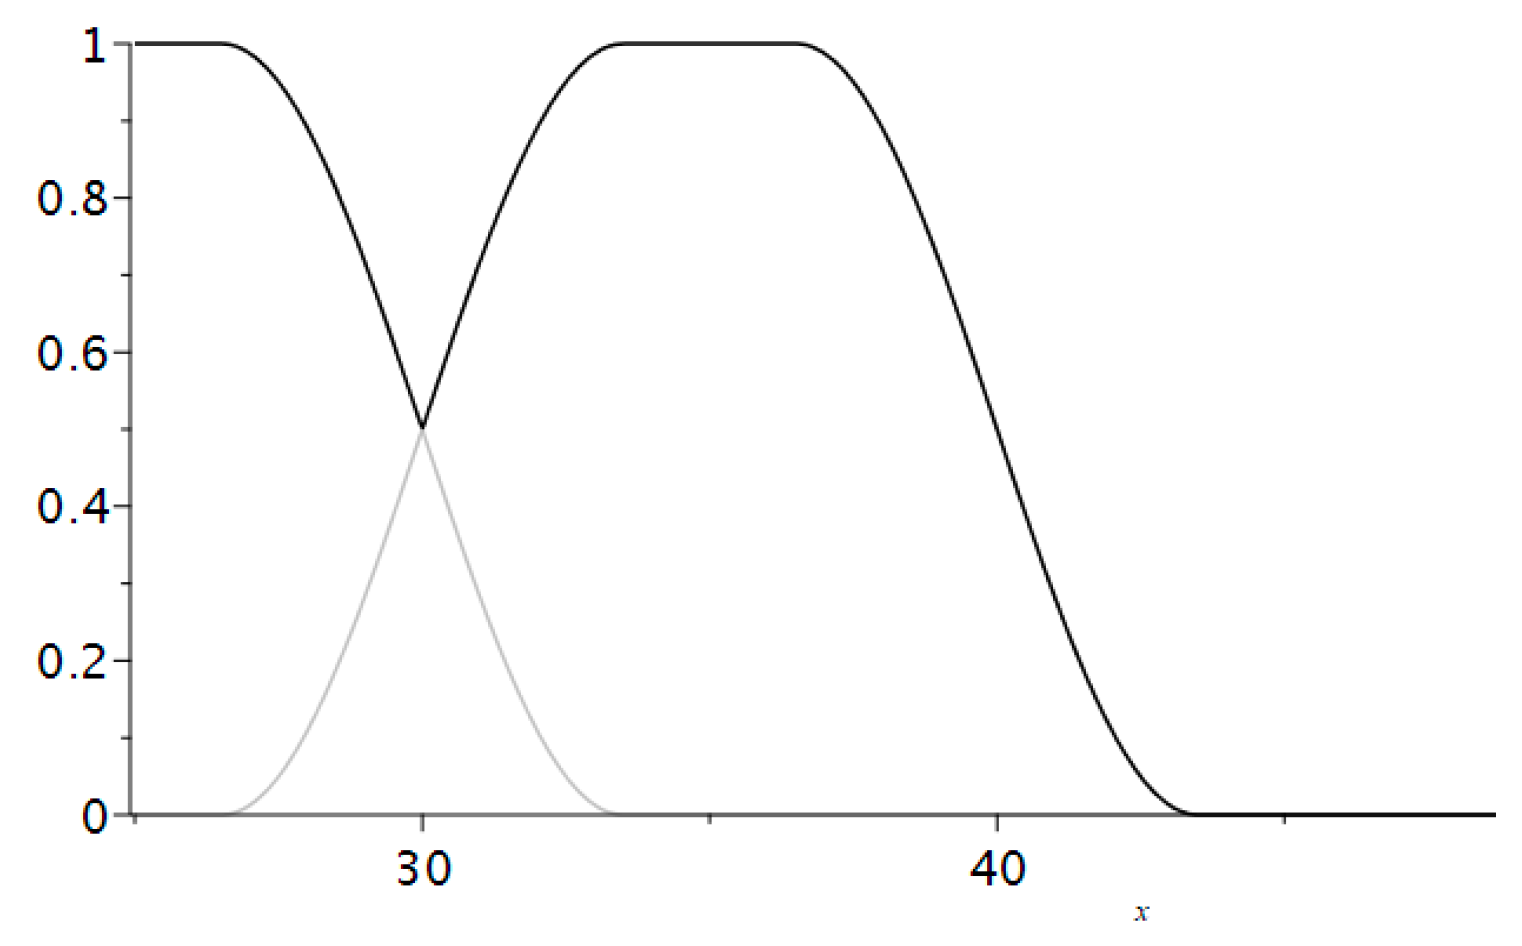
For union, we looked at the degree of membership for each set and picked the lower one of the two, that is:
(
Figure 5).
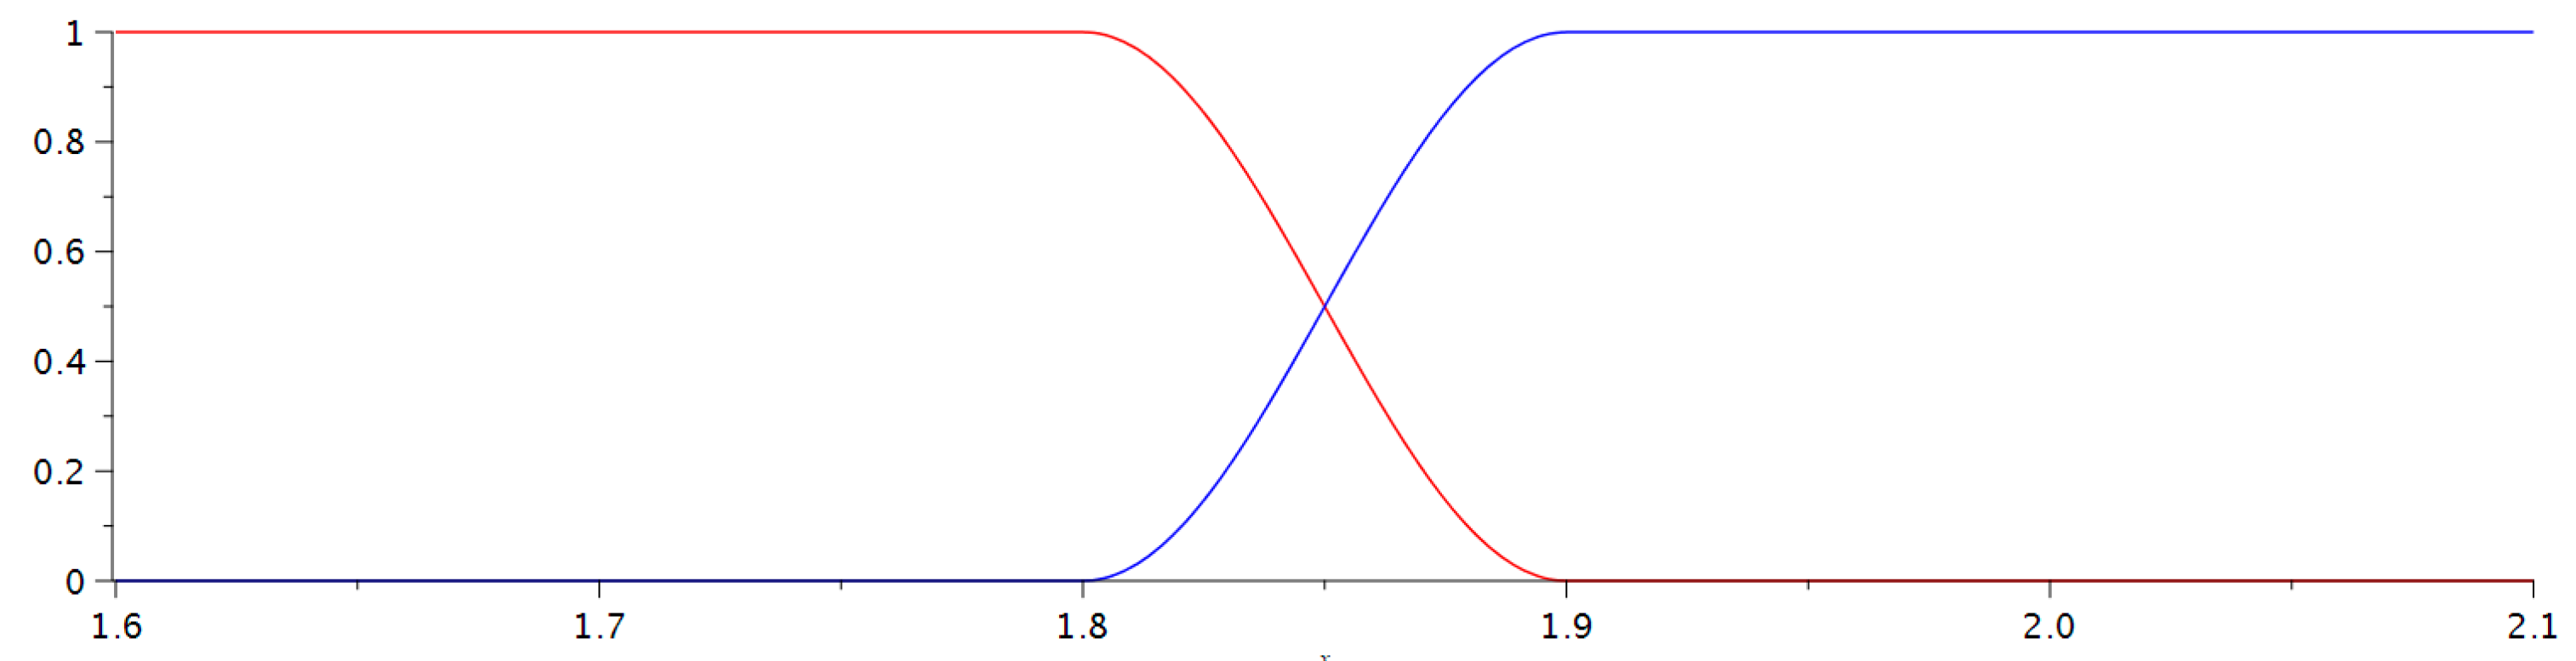
For intersection, we looked at the degree of membership for each set and picked the higher one of the two, that is
(
Figure 6).
For complement, we subtracted the degree of membership from 1, that is .
Let us consider a student with an overall score of 49 points and a score of the open question of 19 points. He/she belonged to the set of Very Good grades with a degree and to the set of Good grades with a degree . Normally, he/she would get a grade Very good (5). However, the intersection of the two grades—the overall points and the points of the open question, states: He/she belongs to the set with a degree 0.79; to the set with a degree 0.21; to the set with a degree 0, and to the set with a degree 0 of the associative matrix. Therefore, we could assign him/her a grade Excellent (6).
In accordance with Reference [
9], we needed to calculate the grade for each student, whose test score did not belong definitely to a given set. To do so, we referred to the
Table 2 where the function F registered the minimums of
and
, i.e.,
. The maximum membership grade, which was acquired from the table, represented the corrected grade from the associative matrix.
Let us now take an example with a student whose overall score of the test is 57 points and his/her score of the open question is 18 points (
and
). As illustrated in
Table 3, the student’s grade after the process of fuzzification was Excellent 6, which coincided with the classical grading (56–64 points correspond to an Excellent grade).
If we review another student who obtained 42 points overall (which corresponds to Good 4 using the conventional grading system) and 17 points of the open question, it is evident from
Table 4 that after the fuzzification that student should have been assigned a higher grade—Very Good 5.
To reevaluate the test scores that did not belong definitely to a given set, we only needed to input the test results: first as the overall number of points obtained, and then as the number of points of the open question for all the 78 students that have taken the test. Next, the software (MapleSoft 2016.0) automatically selected the ones that needed to be fuzzified and calculated the fuzzified grades.
Following the calculation, we perceived that there were 42 students out of the 78 test takers, whose overall grade did not belong with a degree 1 to any of the sets: Fail, Satisfactory, Good, Very good, or Excellent. Thus, for any student’s score , we obtained the set of grades:
Y = [6, 6, 4, 3, 5, 2, 5, 4, 4, 5, 4, 2, 4, 2, 2, 5, 5, 5, 3, 4, 5, 3, 4, 5, 4, 4, 3, 4, 6, 6, 6, 4, 2, 4, 3, 4, 5, 5, 5, 4, 4, 2].
By using fuzzy logic and the associative matrix, we transformed the set of grades into a new set of grades:
X = [6, 5, 5, 2, 5, 4, 4, 4, 4, 4, 3, 4, 4, 4, 4, 4, 5, 3, 2, 3, 4, 5, 3, 4, 3, 4, 2, 3, 5, 5, 6, 3, 5, 4, 3, 5, 4, 4, 6, 4, 5, 4].
We checked if the new set of grades X were statistically different from Y. Let us denote by X = (X1, X2,...,X42) the random variable, which describes a student’s grade after the fuzzification, and by Y = (Y1, Y2,...,Y42) the random variable, which reports the grade of the student before the fuzzification, both in numbers. We used the built-in functions for hypothesis testing in MapleSoft 2016.0.
With the help of the F-test we checked whether the standard deviation after using the fuzzy technique and the standard deviation before using it were equal. We got the following result:
Two sample F-test (X, Y, 1, confidence = 0.95, equal variances = true); F-ratio test on two samples.
Null Hypothesis: A sample drawn from populations with a ratio of variances is equal to 1.
Alt. Hypothesis: A sample drawn from a population with a ratio of variances is not equal to 1.
Result: [Accepted].
This statistical test did not provide enough evidence to conclude that the null hypothesis was false. Consequently, we could accept that the standard deviations were equal.
We also checked the distributions of the grades before and after using the fuzzy technique for equal mean values.
Two sample t-test (X, Y, 0, confidence = 0.95); standard t-test on two samples (unequal variances).
Null Hypothesis: A sample drawn from populations with a difference of means is equal to 0.
Alt. Hypothesis: A sample drawn from a population with a difference of means is not equal to 0.
Result: [Accepted].
This statistical test did not provide enough evidence to conclude that the null hypothesis was false. Consequently, we could accept that the mean values were equal.
With the help of the paired t-test we checked if the distributions of the changed grades by means of the fuzzy technique were one and the same distribution.
Two sample t-test (X, Y, 0, confidence = 0.95); standard t-test with paired samples.
Null Hypothesis: A sample drawn from populations with difference of means is equal to 0.
Alt. Hypothesis: A sample drawn from a population with difference of means is not equal to 0.
Result: [Accepted].
This statistical test did not provide enough evidence to conclude that the null hypothesis was false. Consequently, we could accept that the two distributions and were equal.
4. Summary
To summarize, we could say that the means of the grades of the group as a whole before and after the fuzzification did not change statistically: the mean of the grades before the process of fuzzification was , and after the fuzzification .
The number of the fuzzified grades from the test was out of 78. Nearly half of the grades were fuzzified—namely 53.84%, and the number of corrected grades was . The percentage of the corrected grades after the fuzzification from the overall grades was 39.74%, and the percentage of the corrected grades after the fuzzification from fuzzified grades was 73.81%, which indicated that the grading system needed some adjustments and that fuzzy logic was applicable to a large number of students in pursuit of more reasonable grading.
To implement the process of fuzzification, by virtue of the sequence of procedures that we wrote in MapleSoft 2016.0, we only needed to enter:
the overall points of each student,
the points of the open question of each student, and
the boundary values of the membership functions.
The software automatically calculated the fuzzified grades and checked the three hypotheses mentioned above. We could change the boundary values of the membership functions to ensure that the two distributions were equal. If we reduced the intervals, in which the grades were not fuzzified, and increased the intervals, in which we used fuzzification, we obtained results whose distribution was substantially different from that of the results before the process of fuzzification. That is why we would like to emphasize that the teacher’s experience in using fuzzification to correct the final grades is of great importance. We illustrate below that by changing the set of points which will be fuzzified. We defined five functions that represent the fuzzy membership bell-like functions to the sets of grades (
Figure 7).
We used the same membership functions , as in the first case.
We obtained that the set of scores Y that would be fuzzified consisted of 46 items. Performing the same procedure in MapleSoft 2016.0, we got:
Two sample F-test (X, Y, 1, confidence = 0.95, equal variances = true); F-ratio test on two samples.
Null Hypothesis: A sample drawn from populations with a ratio of variances is equal to 1.
Alt. Hypothesis: A sample drawn from a population with a ratio of variances is not equal to 1.
Result: [Accepted].
This statistical test did not provide enough evidence to conclude that the null hypothesis was false. Consequently, we accepted that the standard deviations were equal.
Two sample t-test (X, Y, 0, confidence = 0.95); standard t-test on two samples (unequal variances).
Null Hypothesis: A sample drawn from populations with a difference of means is equal to 0.
Alt. Hypothesis: A sample drawn from a population with a difference of means is not equal to 0.
Result: [Accepted].
Two sample t-test (X, Y, 0, confidence = 0.95); standard t-Test with paired samples.
Null Hypothesis: A sample drawn from populations with difference of means is equal to 0.
Alt. Hypothesis: A sample drawn from a population with difference of means is not equal to 0.
Result: [Rejected].
In short, the number of the fuzzified grades from the test was out of 78. Over half of the grades were fuzzified—namely 63.88%, and the number of corrected grades was . The percentage of the corrected grades after the fuzzification from the overall grades was 44.87%, and the percentage of the corrected grades after the fuzzification from fuzzified grades was 76.08%. The means and the standard deviation of the group before and after the fuzzification did not change statistically: the mean of the grades before the process of fuzzification was , and after the fuzzification . However, the paired test showed that there was a significant difference in the distributions of the fuzzified marks. Therefore, in this particular case, it cannot be interpreted as obtaining a fairer grading of students’ tests.


