Article

Assessing High School Student’s STEM Career Interests Using a Social Cognitive Framework

1
Counseling, Educational Leadership, Educational and School Psychology, Wichita State University, 1845 Fairmount St, Wichita, KS 67260, USA
2
Tunghai University, Taiwan Boulevard, Xitun District, Taichung 40704, Taiwan
*
Author to whom correspondence should be addressed.
Educ. Sci. 2019, 9(2), 151; https://doi.org/10.3390/educsci9020151
Submission received: 25 April 2019 / Revised: 30 May 2019 / Accepted: 12 June 2019 / Published: 19 June 2019

Abstract

:
This study investigated the psychometric properties of the Chinese version of the STEM Career Interest Survey (STEM-CCIS) with data from 590 high-school students in Taiwan. Measurement models based on Social-Cognitive Career Theory (SCCT) and STEM discipline-specific dimensions (Science, Technology, Engineering, Mathematics) were examined using confirmatory factor analyses. Findings from confirmatory factor analyses indicated that STEM-CCIS possesses adequate reliability and factorial validity, replicating the sound psychometric properties of the original English version of the STEM-CIS. Implications for the use of the STEM-CCIS are discussed.

1. Introduction

The rising emphasis on developing science, technology, engineering, and mathematics (STEM) expertise has been a global phenomenon [1]. The STEM workforce development has been considered to be imperative to economic growth in many developing countries. Yet, the lack of participation and persistence in the STEM workforce is universal and ongoing [2,3]. Leaders are concerned that the current STEM labor pool will not meet the increasing demands of the STEM job-growth and may limit the range of innovation and economic development. Consequently, there has been increasing national/international attention on the recruitment of the STEM workforce [4,5,6].
Understanding how and why students become interested in a STEM career is the first step in addressing the shortage in the STEM workforce. Therefore, many researchers have applied various theoretical frameworks to investigate the factors that shape the individuals’ STEM career interests. In much of the research on STEM careers, Social Cognitive Career Theory (SCCT) [7] has been the most widely used theoretical framework for empirical inquiry [8]. Empirical studies have shown that self-efficacy [9,10,11,12,13,14], interests [6,11,15,16,17], course selection [14,16], STEM-related activities, school engagement [16,18], academic proficiencies, and familial background [16] are predictive of STEM-related career paths. In a recent qualitative study, Li, Mau, Chen, Lin, & Lin [19] identified four domains, personal input, contextual variables, outcome expectations, and self-efficacy, that were involved in the STEM career development of high-school students, which parallel with the SCCT theoretical framework.
Although research concerning STEM career interests and decision-making processed has been well established, STEM-related assessment instruments are rarely available for counseling purposes [8]. Instruments that effectively measure STEM interests are therefore crucial for advancing our understanding of factors influencing STEM interests and aspirations of individuals [20,21]. Moreover, cultural relevance and validity of STEM career assessments are becoming an emerging concern. There is a need to adapt and validate instruments for the use with individuals of various cultures [22].

1.1. Theoretical Framework

In this study, we draw on the Social Cognitive Career Theory as a framework for our study. Originating from Bandura’s Social Cognitive Theory [23], SCCT’s interest and choice models comprise a variety of constructs such as vocational self-efficacy, outcome expectations, career interests, and goals, as well as contextual factors that influence an individual’s career choices. More specifically, SCCT proposes that individual and contextual factors influence that person’s self-efficacy belief and outcome expectations, which in turn influence his or her career interests, goals, and decision-making.
Efforts to test the hypotheses derived from social cognitive theory requires comprehensive measures of the theory’s constructs [22]. However, there are currently a limited number of STEM assessments designed specifically to measure SCCT constructs. These tend to focus either primarily or exclusively on one or two theoretical constructs such as self-efficacy, outcome expectation, or contextual backgrounds. As a result, most of these studies poorly account for the set of theoretical predictors in SCCT’s prediction models [24]. Moreover, most of the STEM studies have focused on one or two STEM disciplines such as math, science, or engineering (e.g., [25,26,27,28]). In a recent review of studies published from 1983 to 2016, Rottinghaus, Falk, and Park [8] identified 17 STEM studies that used measures that were developed based on SCCT. Of these 17 studies, five focused on engineering, one on computing, eight on mathematics and science, one on science and engineering, and one on overall STEM domain vocations. There was only one measure, namely the STEM Career Interest Survey (STEM-CIS), developed by Kier, Blanchard, Osborne, and Albert [29], which assessed all four discipline-specific STEM career interests, and which was derived specifically from the SCCT theoretical constructs.
Rottinghaus, Falk, and Park [8] also reported that the majority of the STEM assessments were developed based on STEM-specific university student populations. This can be problematic in capturing specific needs and concerns of different age groups. Middle schools and High schools present an opportunity for students to explore academic interests and plan for further education. The high school years are a time when students carefully examine their career choices [30], including careers in STEM [31]. Therefore, it is important to examine the career interests of students at this stage.

1.2. The Current Study

Thus, the focus of this study is to adapt and validate a STEM career interest assessment for Taiwanese high-school students that measures discipline-specific STEM interest and SCCT construct-specific STEM interests. Guided by SCCT, Kier et al. [29] developed a Career Interest Survey (STEM-CIS) that measures the six key constructs of the SCCT. The 44-item STEM-CIS has four discipline-specific subscales, each pertaining to one of the STEM subject areas with aspects derived from the SCCT. Although the authors have confirmed the four discipline-specific subscales, they did not specifically examine the theoretical construct of the scale. Additionally, STEM-CIS was originally created based on the SCCT model, and no study to date has examined the validity of the theoretically based SCCT scales with a high-school sample.
This study seeks to advance the current research by investigating the psychometric properties of the Chinese version of the STEM-CIS (STEM-CCIS) using a sample of Taiwanese high-school students. Nearly 1.2 billion people speak Chinese as their first language. Therefore, counselors worldwide are searching for instruments that are readily available for Chinese-speaking populations. Specifically, we examined the adapted Chinese version of the scale on discipline-specific dimensions (Science, Technology, Engineering, and Mathematics) as well as the SCCT theoretical dimensions (STEM Self-efficacy, STEM Outcome Expectation, STEM Interests, STEM Goals, Contextual Support and Barriers, and Person Inputs). Besides internal consistency, reliability of the four subscales was also investigated.

2. Methods

2.1. Participants and Procedures

Five-hundred and ninety high-school students participated in this study. Participants were recruited from two high schools, one private and one public high-school, located in the central part of Taiwan. Three-hundred and fifteen males, 275 females; 361 10th graders, 188 11th graders, and 41 12th graders were recruited. Mean age = 16.2; SD = 0.73. Of the 590 students invited to participate, three did not return a completed consent form, 12 did not complete the questionnaire, and 15 did not fill out the questionnaire correctly, as determined by validity checks. Validity checks are questions built in the questionnaire to check if students answered questions carefully by asking students to skip a question. There were no statistically significant differences between schools in terms of gender and age. After receiving institutional review board approval (IRB Number: 3509), the investigators administered the questionnaires through a Qualtrics online survey program created specifically for this study. Before administering the questionnaire, a brief description of the purpose of the study and an informed consent process were given to the participants. The questionnaire took about 30 minutes to complete.

2.2. Measures

The STEM-CIS developed by Kier et al. [29] was adapted for this study. The STEM-CIS is a 44-item instrument that measures student’s interests in STEM subjects and careers. The initial items developed were based on an extensive literature review guided by the SCCT theoretical framework, as well as other instruments measuring STEM courses and careers (e.g., [20,32]). Items were created to measure key constructs associated with the Social Cognitive Career Theory [7]. Each discipline-specific subscale contains 11 items that address six social cognitive career factors: self-efficacy (2 items), outcome expectations (2 items), goals (2 items), interests (2 items), contextual supports (2 items), and person inputs (1 item). The scoring was done with a five-point Likert scale, with response options ranging from “strongly disagree” (1) to “strongly agree” (5). Higher scores reflected the greater perceived value of the subject. Kier et al. [29] reported that the Cronbach’s alpha of the STEM-CIS ranged from 0.77 to 0.89 for the subscales.
To ensure the accuracy of the translation, a back-translation procedure was implemented [33]. First, the original version of the survey instrument was translated into Chinese by a doctoral level bilingual person who had knowledge of both the Chinese and English cultures. For back translation, a bilingual (English and Chinese) person who had a bachelor’s degree in English and a Master’s degree in translation, and had no background in counseling or psychology performed the back translations. In order to reach consensus on the match between the original version of the survey instrument and the back-translation version, the first author and second author, both who have a doctoral degree in counseling and a related educational field, inspected the original items with the back-translated items. Upon agreement, corrections were made to ensure that the Chinese version maintained the original meanings and concepts of the original English version.
In addition, to ensure the survey instruments could be read and understood, five high-school students were invited to fill out the questionnaire and provide feedback on the instructions, question format, and wording. Additional revisions were made based on their feedback before the survey instruments were finalized and administered to the participants.

2.3. Statistical Analysis

Prior to the analysis, we examined missing values and outliers. We handled missing values with single imputation with the AMOS data imputation (with regression). The cases with missing values were a small portion and were missing at random. Using a histogram and the spread of the scores, we observed no outliers. All observed variables had skewness and kurtosis indices that fell within ±1, suggesting an acceptable normal distribution of the data.
A series of confirmatory factor analyses (CFA) using AMOS (SPSS add-on module version 21) was conducted to assess the structural validity of the 44-item STEM-CIS Chinese version. We chose a maximum likelihood parameter estimation method because the data were normally distributed [34]. Although CFA is typically a confirmation process, testing the model fit by specifying the model restrictions is a common practice [35]. Fourteen measurement models were examined (see Table 2). Model 1 through Model 6 involved discipline-specific scales, whereas Model 7 through Model 13 involved the SCCT theoretical scales. Specifically, Model 1 represented the Math subscale, Model 2 represented the Science subscale, Model 3 represented the Engineering subscale, Model 4 represented the Technology subscale, Model 5 represented a one-factor solution (full scale), and Model 6 represented a four-factor solution (full scale). Model 7 through Model 12 was a single-factor model measuring each of the six latent variables SCCT: STEM self-efficacy, STEM goals, STEM outcome expectation, STEM Interests, contextual support, and person inputs. Model 13 was a first-order model of the six-factor SCCT scale.

3. Results

3.1. Descriptive Statistics and Reliability

Table 1 presents the means, standard deviations and internal reliability coefficients for the factors of the STEM-CCIS. The results show a very good internal reliability with an overall Cronbach’s alpha of 0.98. The SCCT subscale internal consistency reliability coefficients ranged from 086 to 0.94. Discipline-specific subscale internal consistency reliabilities ranged from 0.92 to 0.94.
A test-retest study with a three-month period was conducted based on a subgroup of 40 10th grade students. In this study, the SCCT subscale test–retest reliability coefficients ranged from 0.60 to 0.85. Discipline-specific subscale test-retest reliabilities ranged from 0.66 to 0.79. These results demonstrate the stability of the measures.

3.2. Confirmatory Factor Analyses

A series of confirmatory factor analyses was conducted to examine factor structure of the STEM-CIS. We used multiple fit indices to evaluate if the models adequately reflected the observed data [34,36]. The Chi-Square statistics is the first measure of how well the model fits the data. However, due to its extreme sensitivity to sample size, we used the Chi-Square to degree of freedom ratio (χ2/df) as one of the evaluation criteria. In addition, we used the Tucker–Lewis Index (TLI), the Comparative Fit Index (CFI), and the Root Mean Square Error of Approximation (RMSEA) to evaluate the model fit. Model fit is usually considered adequate when the following criteria are met: χ2/df < 3, TLI > 0.90, CFI > 0.95, and RMSEA < 0.08 [35,37,38,39].

3.2.1. Discipline-Specific Model

Four one-factor CFA models (Model 1–Model 4) were tested separately for each discipline-specific domain (Mathematics, Science, Engineering, and Technology) to check whether the domain could be treated as a latent factor and how well individual items related to this factor. The initial run on each discipline-specific subscale indicated a relatively poor fit of the data due to one item “I know someone in my family who uses ‘STEM’ in their career,” which appeared four times—once for each of the STEM disciplines. Items with a factor loading less than 0.50 were deleted from the subscale. To improve the fit, we removed this particular item from the subscales. Consequently, we confirmed four 10-item discipline-specific subscales.
As reported in Table 2, a very good fit of the CFA model was found for the Math subscale (Model 1) [χ2 (27) = 77.399, χ2/df = 2.86, TLI = 0.98, CFI = 0.99, RMSEA = 0.056]. All items loaded moderately to strongly on their corresponding facets ranging from 0.67 to 0.88. Similarly, the model fit of the Science subscale (Model 2) was strong [χ2 (21) = 56.50, χ2/df = 2.69, TLI = 0.99, CFI = 0.99, RMSEA = 0.054]; factor loadings of the Science subscale ranged from 0.71 to 0.90. The model fit of the Engineering subscale (Model 3) was strong [χ2 (17) = 35.43, χ2/df = 2.08, TLI = 0.99, CFI = 0.99, RMSEA = 0.043]; the factor loadings of the Engineering subscale ranged from 0.71 to 0.93. The model fit of the Technology subscale (Model 4) was good [χ2 (16) = 47.26, χ2/df = 2.95, TLI = 0.99, CFI = 0.99, RMSEA = 0.058]; The factor loadings of Technology subscale ranged from 0.71 to 0.89.
Because some students may be interested in more than one of these STEM disciplines, we also examined how these subscales worked together as a discipline-free measure. This was a reasonable approach as the analyses showed the four latent subscale scores to be strongly correlated. Correlations between the four latent factors ranged from r = 0.78 to 0.93. Thus, we estimated two other models: single factors with full scale (Model 5) and the four-factor model with full scale (Model 6). The one-factor model with full scale suggested a poor fit. [χ2 (902) = 14043.43, χ2/df = 15.569, CFI = 0.56, TLI = 0.46, RMSEA = 0.157]. The four-factor model with the full scale also suggested a poor fit [χ2 = 11824.77, CMIN = 13.197, CFI = 0.639, TLI = 0.601, RMSEA = 0.144]. To improve the fit, we removed four items (item 41–44) "I know someone in my family who uses ‘STEM’ in their career" which appeared four times, once for each of the STEM disciplines, from the Support subscale. We also allowed the error terms within each domain-specific subscale to correlate. As can be seen in Table 2, Model 5 showed a good fit of the single factor structure [χ2 (489) = 1456.79, χ2/df = 2.97, CFI = 0.97, TLI = 0.95, RMSEA = 0.053]. Consequently, a 40-item high-school STEM-CCIS scale was confirmed. Standardized factor loadings were generally strong, ranging from 0.60 to 0.84. Model 6 examined a four-factor structure of the STEM interest full scale. The results indicated a good fit of the model [χ2 (516) = 1532.23, χ2/df = 2.98, CFI = 0.97, TLI = 0.95, RMSEA = 0.058]. Figure 1 represents the four-factor full scale model of the STEM-CCIS.

3.2.2. SCCT Model

We reorganized the 44-item STEM-CCIS scale into six subscales to measure six latent variables of SCCT. Six one-factor CFA models (Model 7–Model 12) were tested separately for each SCCT domain (Self-Efficacy, Goal, Outcome Expectation, Interest, Support, and Person Inputs) to check whether or not the domain could be treated as a latent factor, and to check how well individual items related to these domains. As with the discipline-specific model, the initial run on each SCCT subscales indicated a relatively poor fit of data due to the same items (item 41–44) “I know someone in my family who uses ‘STEM’ in their career. These items each had a factor loading that was less than 0.50. To improve the fit, we removed these items from each subscale. Consequently, we confirmed six SCCT subscales.
Results of the CFA on the six SCCT subscales showed an adequate fit of Self-Efficacy domain [χ2 (10) = 21.84, χ2/df = 2.18, CFI = 0.99, TLI = 0.99, RMSEA = 0.037]; Goal domain [χ2 (6) = 14.78, χ2/df = 2.46, CFI = 0.99, TLI = 0.98, RMSEA = 0.050]; Outcome Expectation domain [χ2 (9) = 16.65, χ2/df = 1.85, CFI = 0.99, TLI = 0.99, RMSEA = 0.038]; Interest domain [χ2 (9) = 17.24, χ2/df = 1.91, CFI = 0.99, TLI = 0.99, RMSEA = 0.039]; Contextual Support domain [χ2 (1) = 2.03, χ2/df = 2.03, CFI = 0.99, TLI = 0.99, RMSEA = 0.032]; and Person Inputs domain [χ2 (1) = 1.29, χ2/df = 1.29, CFI = 0.99, TLI = 0.99, RMSEA = 0.022].
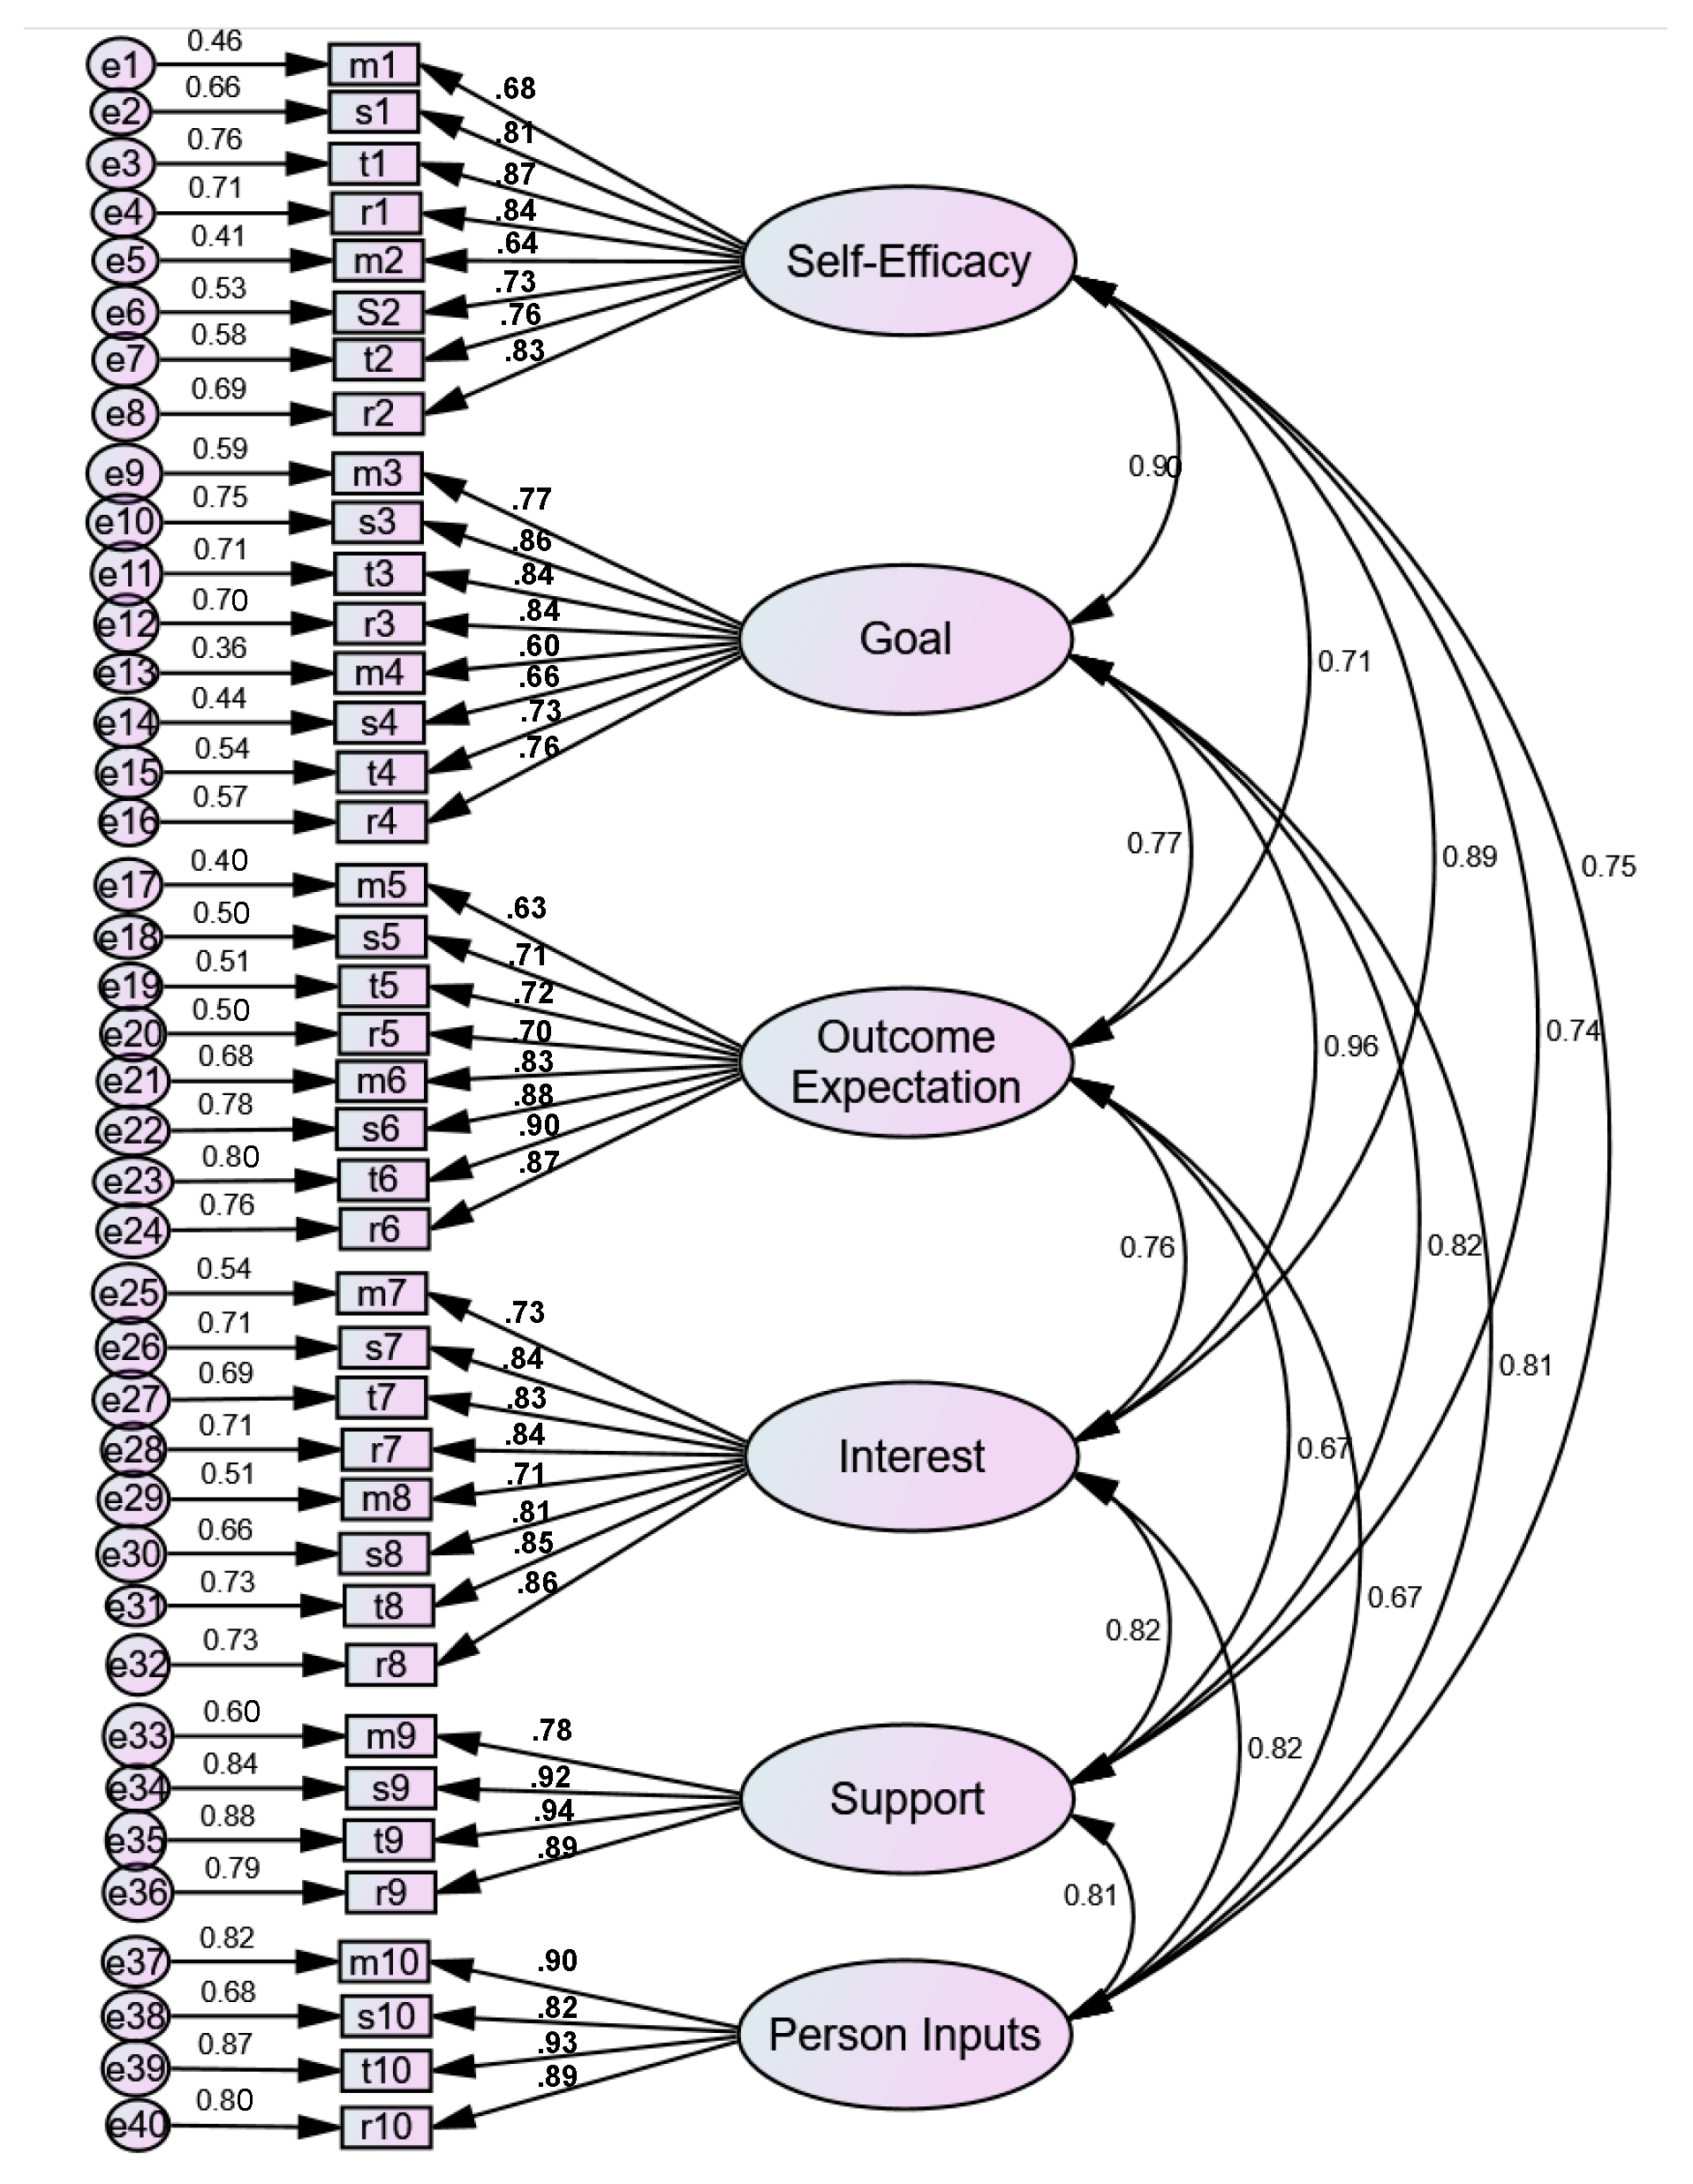
We also tested the six-factor SCCT model. Results of CFA on the six SCCT factor model with the full scale (44 items) suggests a poor fit [χ2 (902) = 9948.68, χ2/df = 18.72, CFI = 0.57, TLI = 0.55, RMSEA = 0.147]. To improve the fit, we removed four items (item 41–44) from the Support subscale due to factor loadings being less than 0.50. We also allowed the error terms within each SCCT subscale and within each domain-specific subscale to correlate. Consequently, a six-factor SCCT scale was confirmed. [χ2 (516) = 1532.23, χ2/df = 2.97, CFI = 0.95, TLI = 0.97, RMSEA = 0.058]. Again, the results suggested that this scale contains six distinct factors representing the six SCCT domains, self-efficacy, outcome expectation, interest, goal, contextual support, and person inputs. Correlations among these factors ranged from 0.67 to 0.96. Standardized factor loadings ranged from 0.51 to 0.95. These data also suggest that this subscale represents a single coherent factor. Figure 2 represents the six-factor SCCT model of STEM-CCIS.

4. Discussion

The primary purpose of this study was to adapt and validate a newly created Chinese version of the STEM Interest Survey (STEM-CCIS) for high-school students in Taiwan. We examined both the reliability and the factor structure of the discipline-specific scales and the six-factor SCCT scale.
Our results indicate that the structural model of the STEM-CCIS, as originally conceptualized by Kier et al. [29], is replicable in a Taiwanese sample. Similarly, with Kier et al.’s study, this study showed that the STEM-CCIS also involved four strong, discipline-specific subscales: Science, Technology, Engineering, and Mathematics. The final structural model-fit statistics were similar to the fit statistics of Kier et al.’s study based on an American middle-school sample. Furthermore, we also examined a full-scale single-factor model and a full-scale four-factor model. As shown in Table 2, results have a reasonable model fit with the full-scale data suggesting that the STEM-CCIS could be treated as a single measure. Thus, it is possible to use this scale in a variety of ways as supported by these analyses. It may be defensible to use any of the four subscales individually, and it may also be defensible to use the combined scale score to indicate an overall interest in STEM career without distinguishing specific fields.
Although the fit statistics indicate replication of the model with the Taiwanese sample, we removed one item (in the form of “I know someone in my family who uses ‘STEM’ in their career,”) from each of the discipline-specific scales due to low factor loadings (< 0.50). These items yielded relatively smaller mean scores and larger standard deviations than did other items of the scale. The reason for the poor fit of these items with the Taiwanese sample warrants further investigation. It may be that Taiwanese students are less likely to recognize the kind of knowledge/skills their family members use in their jobs compared to the North American students. Further studies are necessary to address this question.
As mentioned earlier, although STEM-CIS was originally created based on the SCCT model, no study to date has examined the validity of the theoretically based SCCT scales with high-school samples. Given the strong research interests and counseling applications of SCCT, the present study also examined how the data fit the SCCT. Our findings showed a good fit of the data for the theoretical model. As can be seen in Table 2, we have separately confirmed six SCCT domain specific scales (Model 7–Model 12) as well as the six-factor model (Model 13). Correlations between the six latent factors (self-efficacy, outcome expectations, goals, interests, contextual supports, and personal disposition) ranged from r = 0.67 to 0.96. These findings show strong support for using a combined scale score, as well as the individual subscales to assess career interests of high-school students.

4.1. Implications

There are several implications from the present study that may be considered in practice when working with high-school students. For program development and counseling intervention, counselors and educators may consider using the STEM-CCIS to screen students who may be interested in STEM careers. Different approaches can be used to assess STEM-CIS, including independent and combined scale approaches. The combined scale may be used to indicate an overall interest in STEM fields followed by examining discipline-specific scales to gain a further insight into the nature of the individual’s interests. Given the range of academic majors and occupations organized under the STEM umbrella, there is a need to go beyond STEM as a uniform domain to more specialized considerations [8]. Another approach is to use the combined scale for students who are in the beginning stage of exploring STEM interests and use a discipline-specific scale for students who have solidified their field of interest. Counselors and educators can also find STEM-CIS useful in developing career intervention programs for students who may be interested in STEM careers. Counselors and educators could incorporate career interventions that focus on different components of the SCCT, such as increasing self-efficacy to increase students’ STEM career interests.
The findings of this study also have implications for future research. More research is needed to validate this instrument with other populations of school-aged students in Taiwan, and to include Mandarin-speaking populations around the world. Future studies may investigate how high-school students’ interests in a STEM career are influenced by the key variables of the SCCT. Longitudinal and experimental research can also help identify which interventions are most successful for Mandarin-speaking populations.
Despite its theoretical contributions, this study is not without limitations. First, this study only recruited participants from a relatively homogeneous sample in the central part of Taiwan. Further studies are necessary to determine if the STEM Chinese CIS can be applied to other Chinese speaking populations such as students in Hong Kong and China. Second, potential biases exist due to the nature of the self-reported data collection method. Some high school students may not have crystalized their career interests at that stage of their lives. Their responses to the survey question may reflect their parental expectations rather than their own wishes. This may not be unusual in the cultural environment in Taiwan. This suggests parents could also be a target of future interventions. Given the limits of paper-and-pencil measures, it is suggested that researchers incorporate qualitative procedures to supplement the psychometric advancement in mixed methods studies.

4.2. Conclusions

In conclusion, our findings suggest that STEM-CCIS possesses adequate reliability and factorial validity, replicating the sound psychometric properties of the original English version of the STEM-CIS for use with high-school students. A variety of approaches can be used to measure STEM-CIS. Furthermore, the present study provides strong theoretical evidence underlining this measurement scale. Now that the measurement model of the scale is confirmed, future studies may use structural equation modeling to investigate how high-school students’ interests in a STEM career are influenced by the key variables of the SCCT. The characterization of these factors could allow counselors and policymakers to take a proactive approach towards tailoring developmentally appropriate and culturally sensitive career interventions for individuals who are considering a career in STEM.

Author Contributions

Conceptualization, W.-C.M.; methodology, W.-C.M.; software, C.-C.L.; validation, C.-C.L., S.-J.C. and W.-C.M.; formal analysis, W.-C.M.; investigation, W.-C.M.; resources, S.-J.C.; data curation, S.-J.C.; writing—original draft preparation, W.-C.M.; writing—review and editing, W.-C.M.; project administration, W.-C.M.; funding acquisition, W.-C.M.

Funding

This research received no external funding.

Acknowledgments

We would like to acknowledge U.S. Council for International Exchange of Scholars and the Foundation for Scholarly Exchange, Fulbright Taiwan for the Fulbright Scholarship award that supported this study.

Conflicts of Interest

The authors declare no conflict of interest. The funding agencies had no role in the design of the study; in the collection, analyses, or interpretation of data; in the writing of the manuscript, or in the decision to publish the results.

References

  1. National Science Board. Science and Engineering Indicators 2016; National Science Foundation (NSB-2016-1): Arlington, VA, USA, 2016.
  2. ACT. STEM Education in the U.S.: Where We Are and What We Can Do. 2018. Available online: http://www.act.org/content/act/en/research/stem-education-in-the-us-2017.html (accessed on 13 June 2019).
  3. United Nations Development Programme. Human Development Report 2015: Work for Human Development; United Nations Development Programme: New York, NY, USA, 2015. [Google Scholar]
  4. Anderson, E.; Kim, D. Increasing the Success of Minority Students in Science and Technology; American Council on Education: Washington, DC, USA, 2006. [Google Scholar]
  5. Dowd, A.C.; Malcom, L.E.; Bensimon, E.M. Benchmarking the Success of Latina and Latino Students in STEM to Achieve National Graduation Goals; University of Southern California: Los Angeles, CA, USA, 2009; Available online: https://cue.usc.edu/files/2016/01/Dec_2009_NSF_Report_FINAL.pdf (accessed on 13 June 2019).
  6. National Science Foundation. Women, Minorities, and Persons with Disabilities in Science and Engineering: 2015; Special Report NSF 15-311; National Science Foundation: Arlington, VA, USA, 2015.
  7. Lent, R.W.; Brown, S.D.; Hackett, G. Toward a unifying social cognitive theory of career and academic interest, choice, and performance. J. Vocat. Behav. 1994, 45, 79–122. [Google Scholar] [CrossRef]
  8. Rottinghaus, P.J.; Falk, N.A.; Park, C.J. Career Assessment and Counseling for STEM: A Critical Review. Career Dev. Q. 2018, 66, 2–34. [Google Scholar] [CrossRef]
  9. Lent, R.W.; Miller, M.J.; Smith, P.E.; Watford, B.A.; Lim, R.H.; Hui, K.; Morrison, M.A.; Wilkins, G.; Williams, K. Social cognitive predictors of adjustment to engineering majors across gender and race/ethnicity. J. Vocat. Behav. 2013, 83, 22–30. [Google Scholar] [CrossRef]
  10. Mau, W.C.; Li, J. Factors influencing STEM career aspirations of underrepresented high school students. Career Dev. Q. 2018, 66, 246–258. [Google Scholar] [CrossRef]
  11. Nauta, M.M.; Epperson, D.L. A longitudinal examination of the social-cognitive model applied to high school girls’ choices of nontraditional college majors and aspirations. J. Couns. Psychol. 2003, 50, 448–457. [Google Scholar] [CrossRef]
  12. Patrick, L.; Care, E.; Ainley, M. The relationship between vocational interests, self-efficacy and achievement in the prediction of educational pathways. J. Career Assess. 2011, 19, 61–74. [Google Scholar] [CrossRef]
  13. Sahin, A.; Ekmekci, A.; Waxman, H.C. The relationships among high school STEM learning experiences, expectations, and mathematics and science efficacy and the likelihood of majoring in STEM in college. Int. J. Sci. Educ. 2017, 39, 1549–1572. [Google Scholar] [CrossRef]
  14. Zarrett, N.R.; Malanchuk, O. Who’s computing? Gender and race differences in young adults’ decisions to pursue an information technology career. New Dir. Child Adolesc. Dev. 2005, 110, 65–84. [Google Scholar] [CrossRef]
  15. Byars-Winston, A.; Fouad, N.A. Math and science social cognitive variables in college students. Contributions of contextual factors in predicting goals. J. Career Assess. 2008, 16, 425–440. [Google Scholar] [CrossRef]
  16. NCES. Gender Differences in Science, Technology, Engineering, and Mathematics (STEM) Interest, Credits Earned, and NAEP Performance in the 12th Grade (NCES 2015-075); National Center for Education Statistics, Institute of Education Sciences, U.S. Department of Education: Washington, DC, USA, 2015.
  17. Toker, Y.; Ackerman, P.L. Utilizing occupational complexity levels in vocational interest assessments: Assessing interests for STEM areas. J. Vocat. Behav. 2012, 80, 524–544. [Google Scholar] [CrossRef]
  18. Miller, K.; Sonnert, G.; Sadler, P. The influence of students’ participation in STEM competitions on their interest in STEM careers. Int. J. Sci. Educ. Part B 2018, 8, 95–114. [Google Scholar] [CrossRef]
  19. Li, J.; Mau, W.C.; Chen, S.J.; Lin, T.C.; Lin, T.Y. A qualitative exploration of STEM career development of high school students in Taiwan. J. Career Dev. 2019. [Google Scholar] [CrossRef]
  20. Tyler-Wood, T.; Knezek, G.; Christensen, R. Instruments for assessing interest in STEM content and careers. J. Technol. Teach. Educ. 2010, 18, 341–363. [Google Scholar]
  21. Usher, E.L. Sources of middle school students’ self-efficacy in mathematics: A qualitative investigation. Am. Educ. Res. J. 2009, 46, 275–314. [Google Scholar] [CrossRef]
  22. Lent, R.W.; Brown, S.D. On Conceptualizing and assessing social cognitive constructs in career research: A measurement guide. J. Career Assess. 2017, 14, 12–35. [Google Scholar] [CrossRef]
  23. Bandura, A. Social Foundations of Thought and Action: A Social Cognitive Theory; Prentice-Hall: Englewood Cliffs, NJ, USA, 1986. [Google Scholar]
  24. Sheu, H.; Lent, R.W.; Brown, S.; Miller, M.; Hennessy, K.; Duffy, R.D. Testing the choice model of social cognitive career theory across Holland themes: A meta-analytic path analysis. J. Vocat. Behav. 2010, 76, 252–264. [Google Scholar] [CrossRef]
  25. Fouad, N.A.; Hackett, G.; Smith, P.L.; Kantamneni, N.; Fitzpatrick, M.; Haag, S.; Spencer, D. Barriers and supports for continuing in mathematics and science: Gender and educational level differences. J. Vocat. Behav. 2010, 77, 361–373. [Google Scholar] [CrossRef]
  26. Garriott, P.O.; Flores, L.Y.; Prabhakar, B.; Mazzotta, E.C.; Liskov, A.C.; Shapiro, J.E. Parental support and underrepresented students’ math/science interests: The mediating role of learning experiences. J. Career Assess. 2014, 22, 627–641. [Google Scholar] [CrossRef]
  27. Lent, R.W.; Brown, S.D.; Schmidt, J.; Brenner, B.; Lyons, H.; Treistman, D. Relation of contextual supports and barriers to choice behavior in engineering majors: Test of alternative social cognitive models. J. Couns. Psychol. 2003, 50, 458–465. [Google Scholar] [CrossRef]
  28. Lent, R.W.; Brown, S.D.; Sheu, H.B.; Schmidt, J.; Brenner, B.R.; Gloster, C.S.; Treistman, D. Social cognitive predictors of academic interests and goals in engineering: Utility for women and students at historically Black universities. J. Couns. Psychol. 2005, 52, 84–92. [Google Scholar] [CrossRef]
  29. Kier, M.W.; Blanchard, M.R.; Osborne, J.W.; Albert, J.L. The development of the STEM career interest survey (STEM-CIS). Res. Sci. Educ. 2014, 44, 461–481. [Google Scholar] [CrossRef]
  30. Ing, M. Can parents influence student mathematics achievement and persistence in STEM careers? J. Career Dev. 2014, 41, 87–103. [Google Scholar] [CrossRef]
  31. Sadler, P.M.; Sonnert, G.; Hazari, Z.; Tai, R.H. Stability and volatility of STEM career interest in high school: A gender study. Sci. Educ. 2012, 96, 411–427. [Google Scholar] [CrossRef]
  32. Fouad, N.A.; Smith, P.L.; Enoch, L. Reliability and validity evidence for the Middle School Self-Efficacy Scale. Meas. Eval. Couns. Dev. 1997, 30, 17–31. [Google Scholar]
  33. Beaton, D.E.; Bombardier, C.; Guillemin, F.; Ferraz, M.B. Guidelines for the Process of Cross-Cultural Adaption of Self-Report Measures. SPINE 2000, 25, 3186–3191. [Google Scholar] [CrossRef] [PubMed]
  34. Kline, R.B. Principles and Practice of Structural Equation Modeling, 3rd ed.; Guilford Press: New York, NY, USA, 2011. [Google Scholar]
  35. Byrne, B.M. Structural Equation Modeling with AMOS: Basic Concepts, Applications, and Programming; Routledge: New York, NY, USA, 2010. [Google Scholar]
  36. Weston, R.; Gore, P.A. A brief guide to structural equation modeling. Couns. Psychol. 2006, 34, 719–751. [Google Scholar] [CrossRef]
  37. Hu, L.-T.; Bentler, P.M. Cutoff criteria for t indexes in covariance structure analysis: Conventional criteria versus new alternatives. Struct. Equ. Model. 1999, 6, 1–55. [Google Scholar] [CrossRef]
  38. Marsh, H.W.; Hau, K.T.; Wen, Z. In search of golden rules: Comment on hypothesis-testing approaches to setting cutoff values for fit indexes and dangers in overgeneralizing Hu and Bentler’s (1999) findings. Struct. Equ. Model. 2004, 11, 320–341. [Google Scholar] [CrossRef]
  39. Schreiber, J.B.; Nora, A.; Stage, F.K.; Barlow, E.A.; King, J. Reporting structural equation modeling and confirmatory factor analysis results: A review. J. Educ. Res. 2006, 99, 323–338. [Google Scholar] [CrossRef]
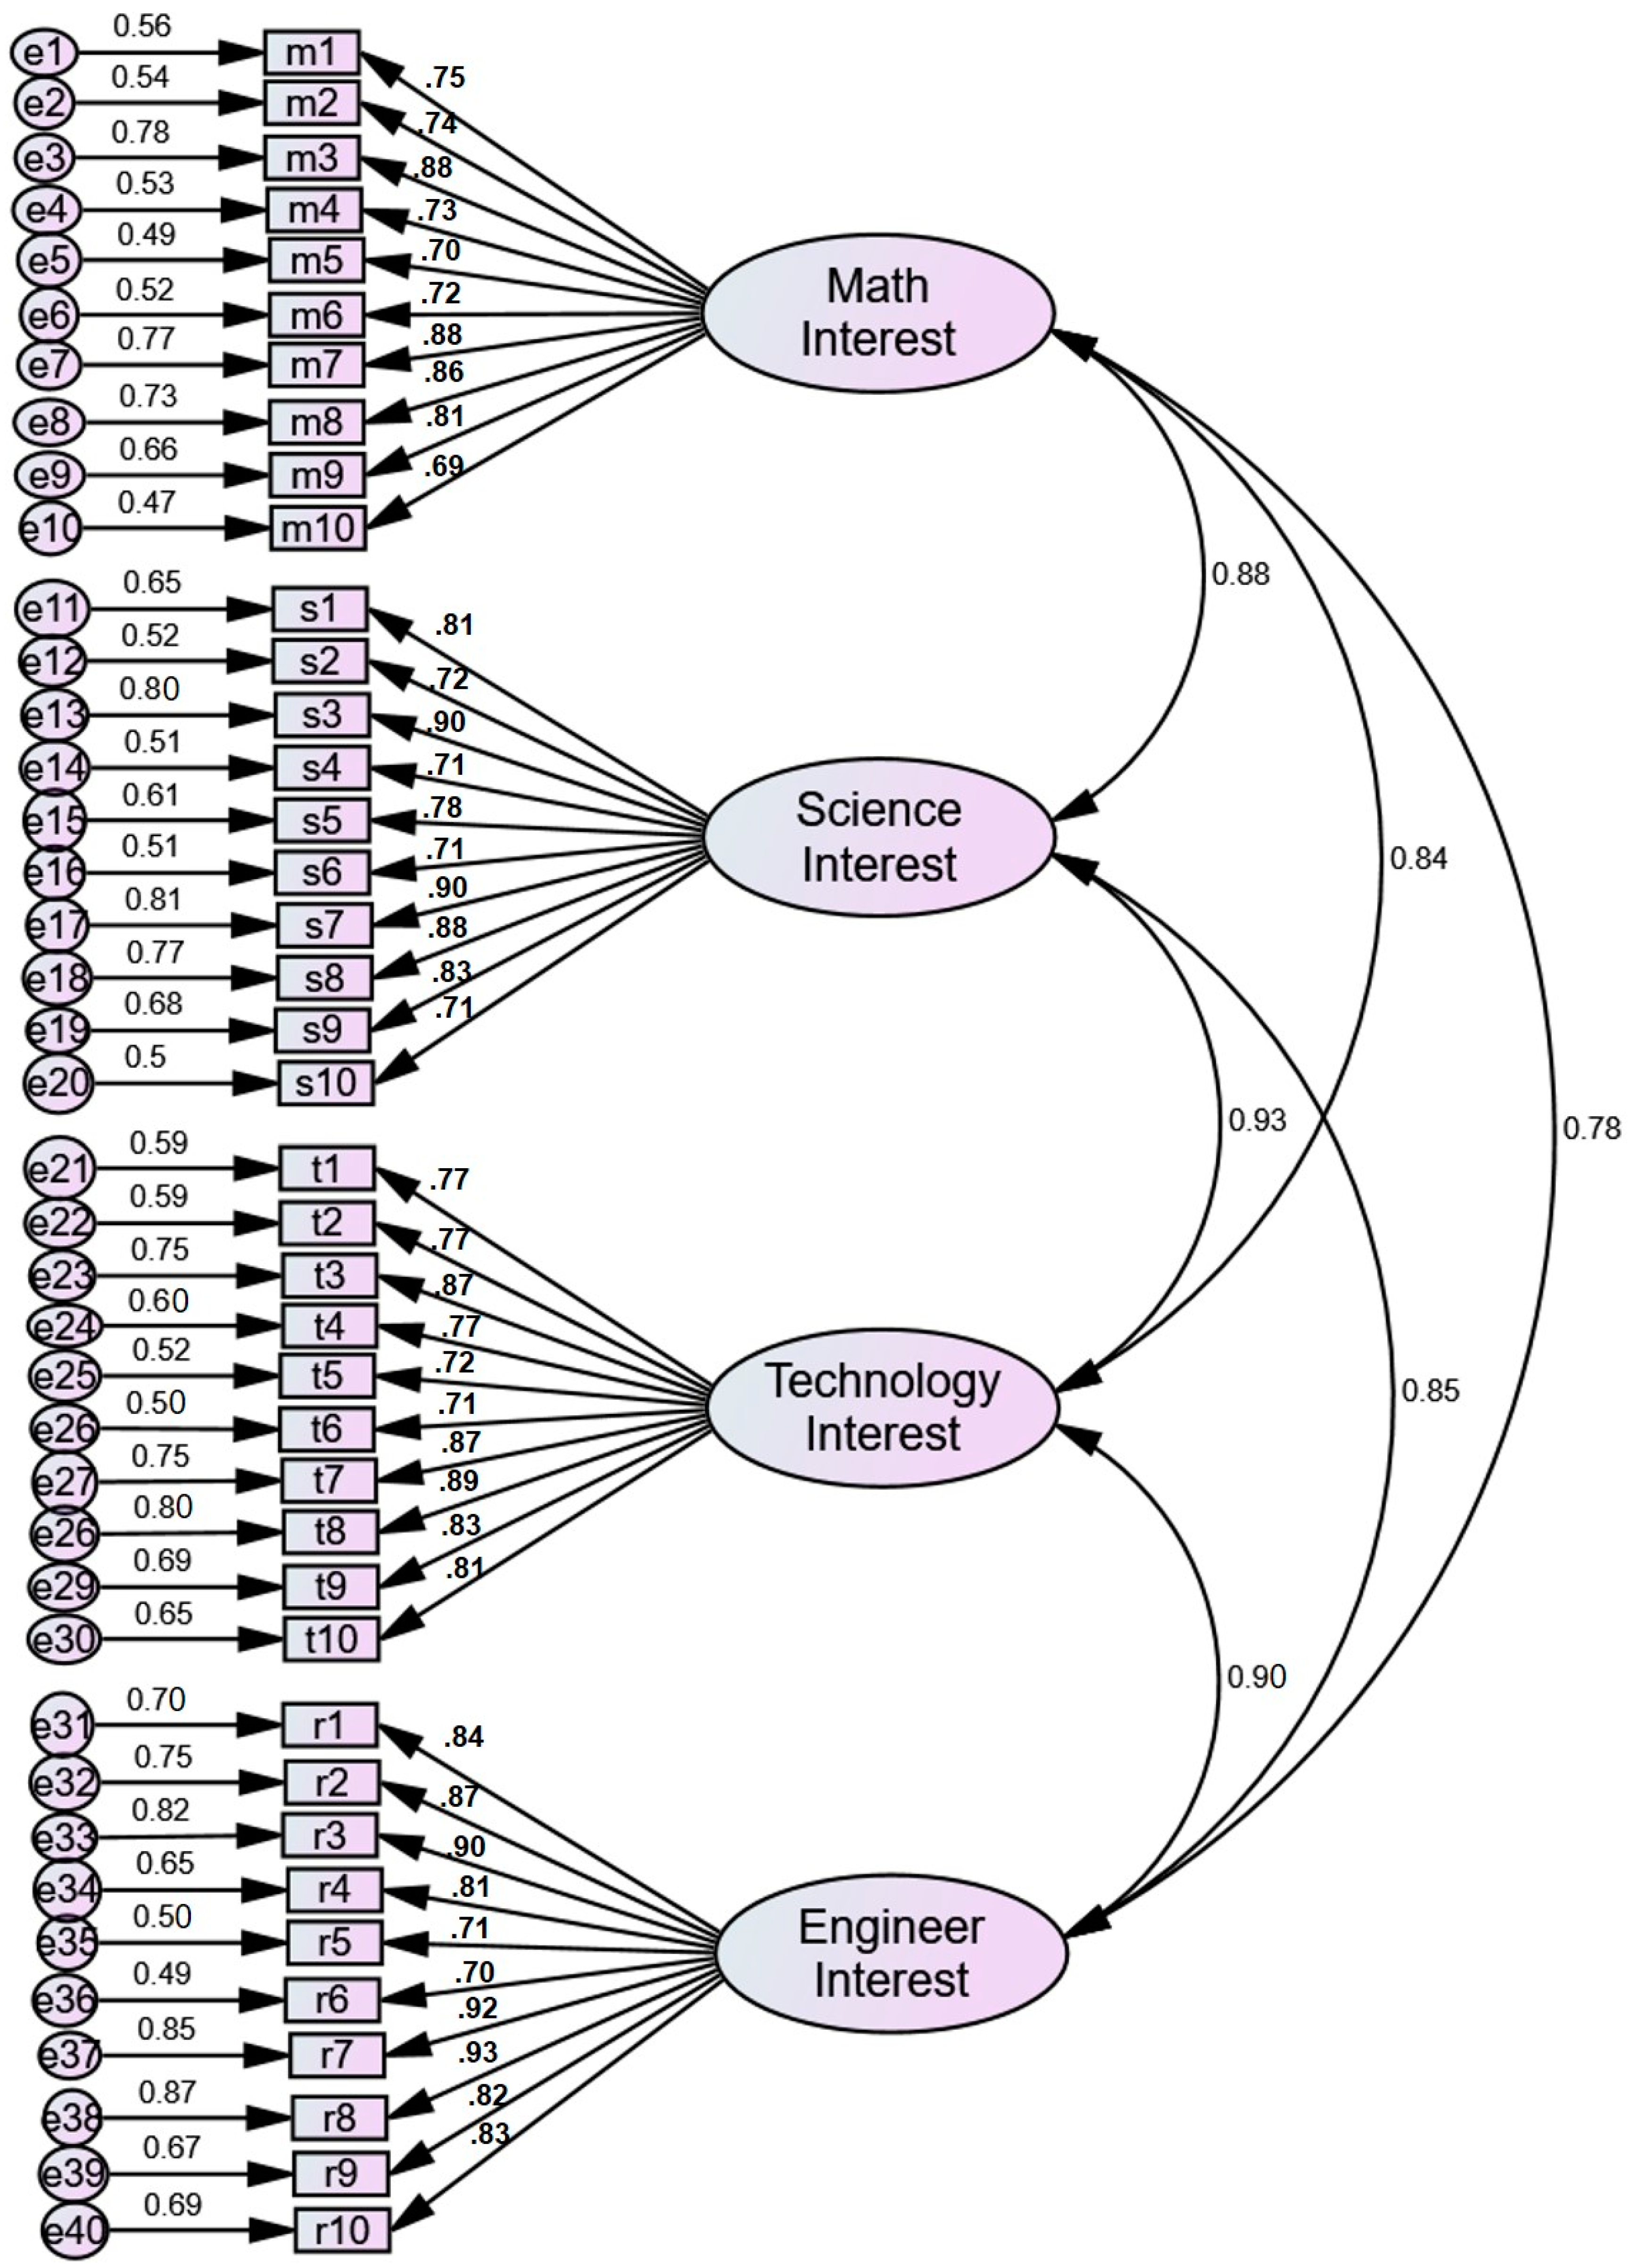
Figure 1. STEM-CCIS: Four-factor full scale model.
Education 09 00151 g001
Figure 2. STEM-CCIS: Six-factor SCCT model.
Education 09 00151 g002
Table 1. Descriptive Statistics of STEM-CCIS Subscales.
ScalesItemαMaSDTest-Retest
Discipline-Specific Subscales
Math110.9233.1210.400.66
Science110.9433.7210.550.75
Engineering110.9335.8610.170.75
Technology110.9433.3310.410.79
SCCT Subscales
Self-Efficacy1–80.9225.147.450.77
Goal9–160.9225.697.810.72
Outcome Expectation17–240.9328.427.720.60
Interest25–320.9423.328.410.85
Contextual Support33–360.8611.714.500.70
Inputs/Disposition37–400.9311.284.210.69
a Item choices were on a Likert-type scale, 1 as strongly disagree to 5 as strongly agree.
Table 2. Results of confirmatory factor analysis on the measurement models.
ModelsParameterdfχ2χ2/dfCFITLIRMSEA
Math382777.392.860.990.990.056
Science452152.732.510.990.990.054
Engineering601735.432.080.990.990.043
Technology611647.262.980.990.990.058
Single-Factor Full Scale3314891456.792.970.970.950.058
Four-Factor Full Scale3045161532.232.980.970.950.058
Self-efficacy261021.842.180.990.990.037
Goal30614.782.460.990.980.050
Outcome Expectation27916.651.850.990.990.038
Interest27917.241.910.990.990.039
Contextual Support912.032.030.990.980.032
Person Inputs911.291.290.990.990.022
Six-Factor SCCT Model3045161532.232.970.970.950.058
Note: TLI = Tucker–Lewis Index; CFI = Comparative Fit Index; RMSEA = Root Mean Square error of approximation.