1. Introduction
The rapid emergence of mobile technologies over the last decade has increased competition among developers to produce educational apps that incorporate new teaching methods, such as mobile learning, into their classrooms. Mobile learning, the “process of learning mediated by handheld devices” that link and access data from Wi-Fi or cellular networks [
1], has become prevalent in K-12 classrooms, particularly in data-heavy Science, Technology, Engineering, and Math (STEM) courses. For example, about 300 million educational apps were downloaded in 2011 [
2]. However, there are still concerns regarding the implementation of new technologies, such as cost and the ability of new technologies to be integrated across the curriculum [
3].
In recent years, various educational products have been offered to the public for free, although most are simplified versions with limited problem-solving capabilities. A Geographic Information System (GIS) includes a set of tools for collecting, storing, retrieving, transforming, and displaying spatial data [
4]. GIS has become the foundation of many mobile apps (e.g., Google Maps, MapQuest, and Pokémon Go), allowing for the streamlining of geospatial data in a user-friendly manner. Recently, ESRI (Environmental Systems Research Institute) released a free app called Collector for ArcGIS [
5] that provides a unique opportunity for science educators whose institutions have access to ArcGIS facilities and tools. Many universities have educational outreach programs that offer supplementary materials (e.g., online mapping activities, tutorials of mobile applications, and hands-on tangible GIS) to educators and schools in their communities. With this app, educators can customize an interactive data collection exercise that is related to their lesson plans. Such an exercise, supported by the combination of GIS and mobile technology, allows for collecting biotic and abiotic features of the environment to promote spatial thinking in science curricula that is related to geography, geology, water resources, and the environment [
6,
7,
8,
9,
10,
11].
A common struggle in STEM education is to keep students physically and mentally engaged with the materials presented in the classroom due to various demographic, educational, and social factors [
12,
13,
14]. The emphasis on student engagement in the educational process has increased over the past decades and become a key prerequisite for and an indicator of student success in the classroom [
15]. While many variations exist in the definition of engagement, the most suitable one for the scope of this research is defined by the Glossary of Education Reform where student engagement is referred to as “the degree of attention, curiosity, interest, optimism, and passion that students show when they are learning or being taught, which extends to the level of motivation they have to learn and progress in their education” [
16].
A significant positive correlation has been observed between the introduction of an alternative, technology-based learning method and overall student engagement [
7,
8,
9,
11,
17]. As new, innovative technologies have been developed, their inclusion in K-12 education has gained popularity. To convince educators that the use of these technologies is beneficial for both students and instructors, it is better to have evidence of such claims in terms of student productivity and engagement versus traditional teaching methods [
6,
18]. Previous studies have examined the impact of new technology on student productivity and engagement based on one single application at a time or the comparison of multiple teaching approaches and demonstrated that collaborative learning supported by computer technology benefits both instructors and students [
11,
19].
This study aims to investigate the potential educational benefits that a customized data collection app for stream health assessment (the authors developed using Collector for ArcGIS) can offer to students and instructors in environmental education. In particular, we focused on assessment of the impacts of using the customized data collection app on student engagement in a stream heath assessment activity. This work provided useful insight into how students perceive technology in their course work and how the inclusion of geospatial technology affects student engagement in an environmental science-related curriculum.
2. Materials and Methods
This study was conducted at a public middle school in Knoxville, Tennessee, through an outreach partnership between the school and the University of Tennessee’s Department of Geography. Per research regulations of Knox County Schools, the school identity is anonymous. An IRB (Institutional Review Board) proposal was approved, and both students and their guardians completed the necessary consent/assent forms to participate in the study.
The participants were 25 students (16 female and nine male) in an 8th grade Environmental Science class who responded to our surveys. With the support of the class’ instructor, we first distributed a multiple-choice questionnaire to ask the students their backgrounds in the use of technology in their course work and daily lives (see
Figure A1 in the
Appendix A). This background information helped customize the suitable technical terms and interface used in the data collection app and provided a baseline for the comparison with other similar studies in the future.
Based on the technical background of the students, we customized a data collection app using Collector for ArcGIS to allow for accessing, adding, and modifying the stream health assessment data online using Wi-Fi or cellular networks. Then, the students conducted a stream health assessment activity using this customized data collection app to collect water quality data within the watershed where their school is located. Students were asked to complete pre- and post-surveys before and after the stream health assessment activity. Finally, qualitative/contextual and quantitative analyses of survey results were conducted to assess the impact on student engagement.
2.1. GIS Data Collection App and Stream Health Assessment
The GIS data collection app was customized with the parameters associated with the course curriculum on stream health assessment using ESRI’s Collector for ArcGIS framework. Specifically, the app was designed to collect a set of visual and chemical characteristics of a stream that the students would examine, including bank stability, presence of algae, and stream or soil odor. Supported by various technologies of the Android or Apple Operating System, including display, Wi-Fi and cellular data access, camera, and GPS, this data collection app allowed students to record and upload their observations to an online, open-access geodatabase.
We first created a geodatabase with ArcCatalog to store varying GIS data in one collective database. This geodatabase was populated with multiple layers of streams, roads, aerial photos, and satellite images of the area associated with the stream health assessment. These layers provide a regional basemap for the assessed area (as a cached layer in ArcGIS online). Students used this basemap as a regional reference to guide data collection and help conduct spatial queries as well as ask relational questions of the geodatabase.
In addition to the above basemap layers, we also created a new point feature class to save the collected data for stream health assessment. This feature class includes various attributes, including temperature, water odor, water color, algae presence, current weather conditions, past 24-h weather conditions, and bank stability. Both base layers and the newly-created point feature class were packed and published in ArcGIS Online.
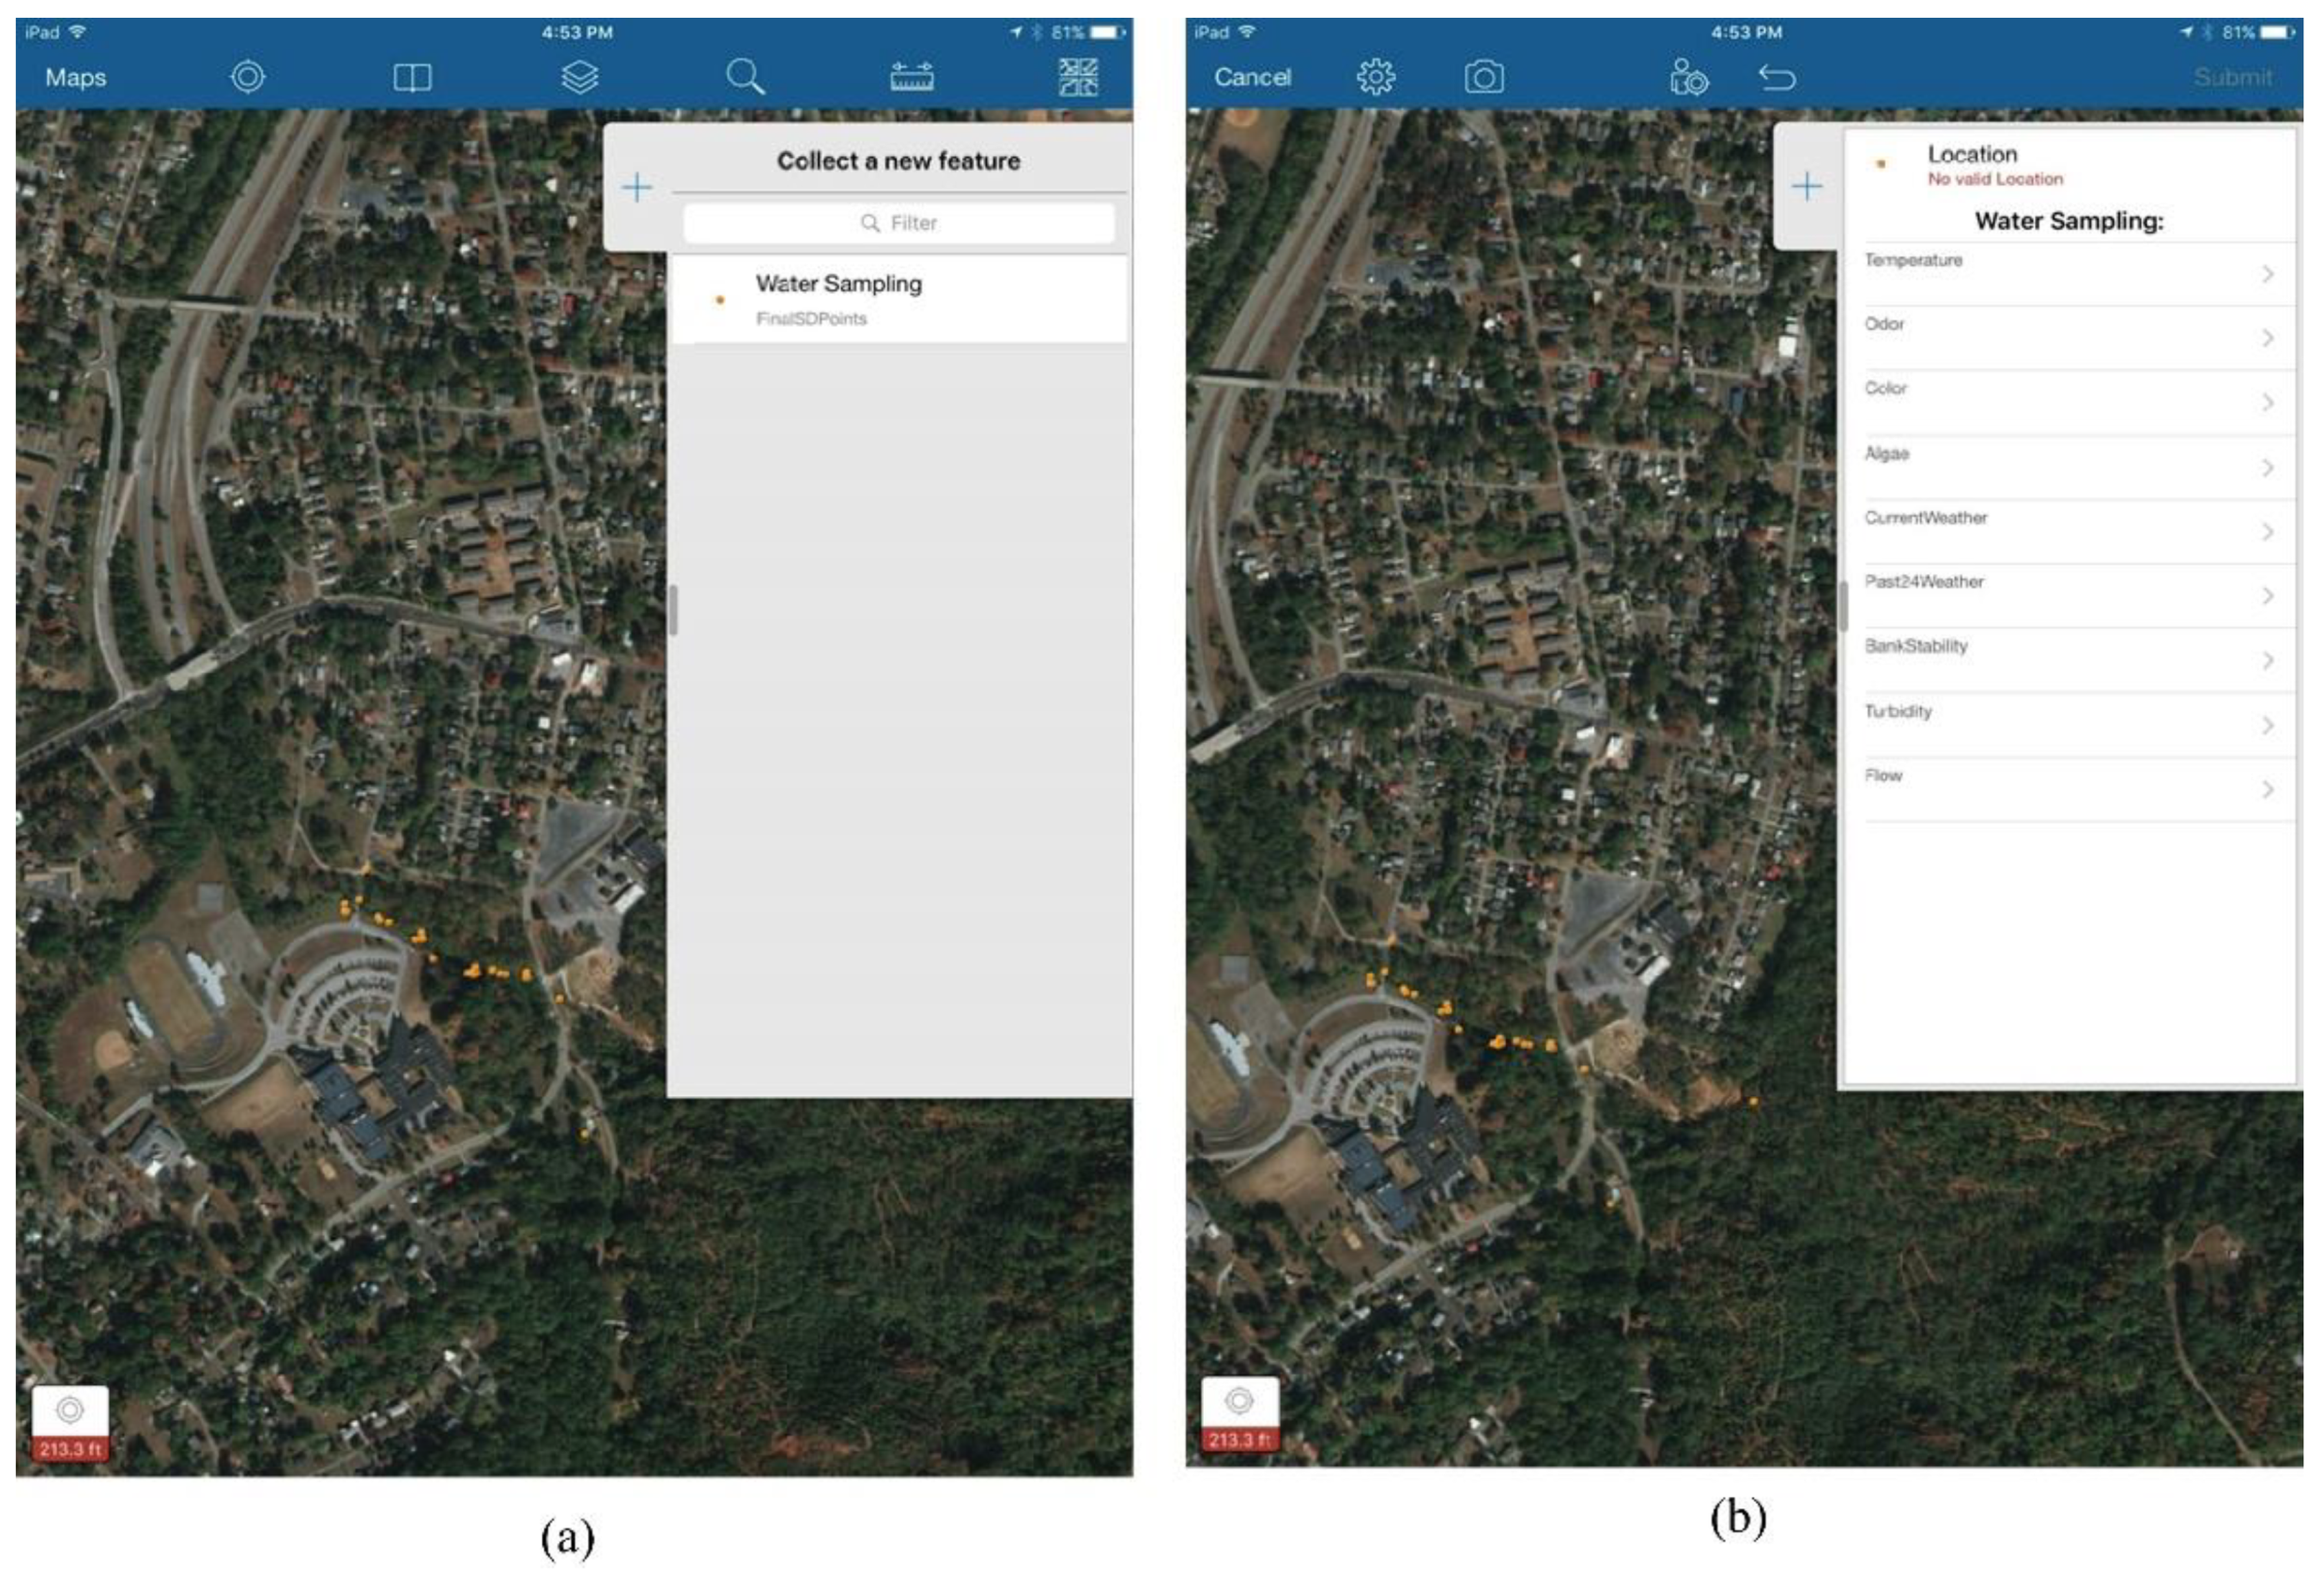
We then customized the interface of the Collector for ArcGIS app based on the attributes in this new feature class to allow student access to add, edit, and remove the collected stream health-related data in the field. Specifically, a drop-down menu within this data collection app for each collected data point allows students to add a new sampling point (
Figure 1a) and enter the attributes of the stream that they observed in the field (
Figure 1b). The collected point and attributes are then sent from the app to the online geodatabase to populate various attributes in the created point feature class for stream health assessment. Students can also use this app to inspect individual or accumulated data points and visualize their distribution in the field from the iPad’s browser or later from a connected computer.
We instructed the students to use this customized app for a stream health assessment activity during a roughly 1-h class period. Students observed and logged 31 separate data points along the stream on the school’s property. The activity began with a short tutorial on using the app and troubleshooting any issues the students had, such as how to start a point over and find a lost place on the basemap. Then, students used the app to assess the stream on their grounds and log the appropriate data. Initial observations indicated that the ease-of-use of the app increased the productivity of the field work.
2.2. Pre- and Post-Survey Development
We conducted pre- and post-surveys before and after the stream health assessment activity. All survey questions were developed by the authors to be appropriate for the background and knowledge of 8th grade students. These questions were then modified and validated by the course instructor and approved by the IRB committee.
The pre-survey (see
Figure A2 in the
Appendix A) sought to understand how including a technological aspect would increase student engagement by asking, for example, whether or not they prefer to read from a textbook or a screen, and whether or not having a hands-on activity makes them enjoy the curriculum more than if they were to only read the intended material from a textbook or listen to a lecture. Open-ended short response questions asked personal opinions about how current school courses could be made more interesting for students who become inattentive. Likert-scale questions were used to quantify how students perceived technology before the planned data collection activity.
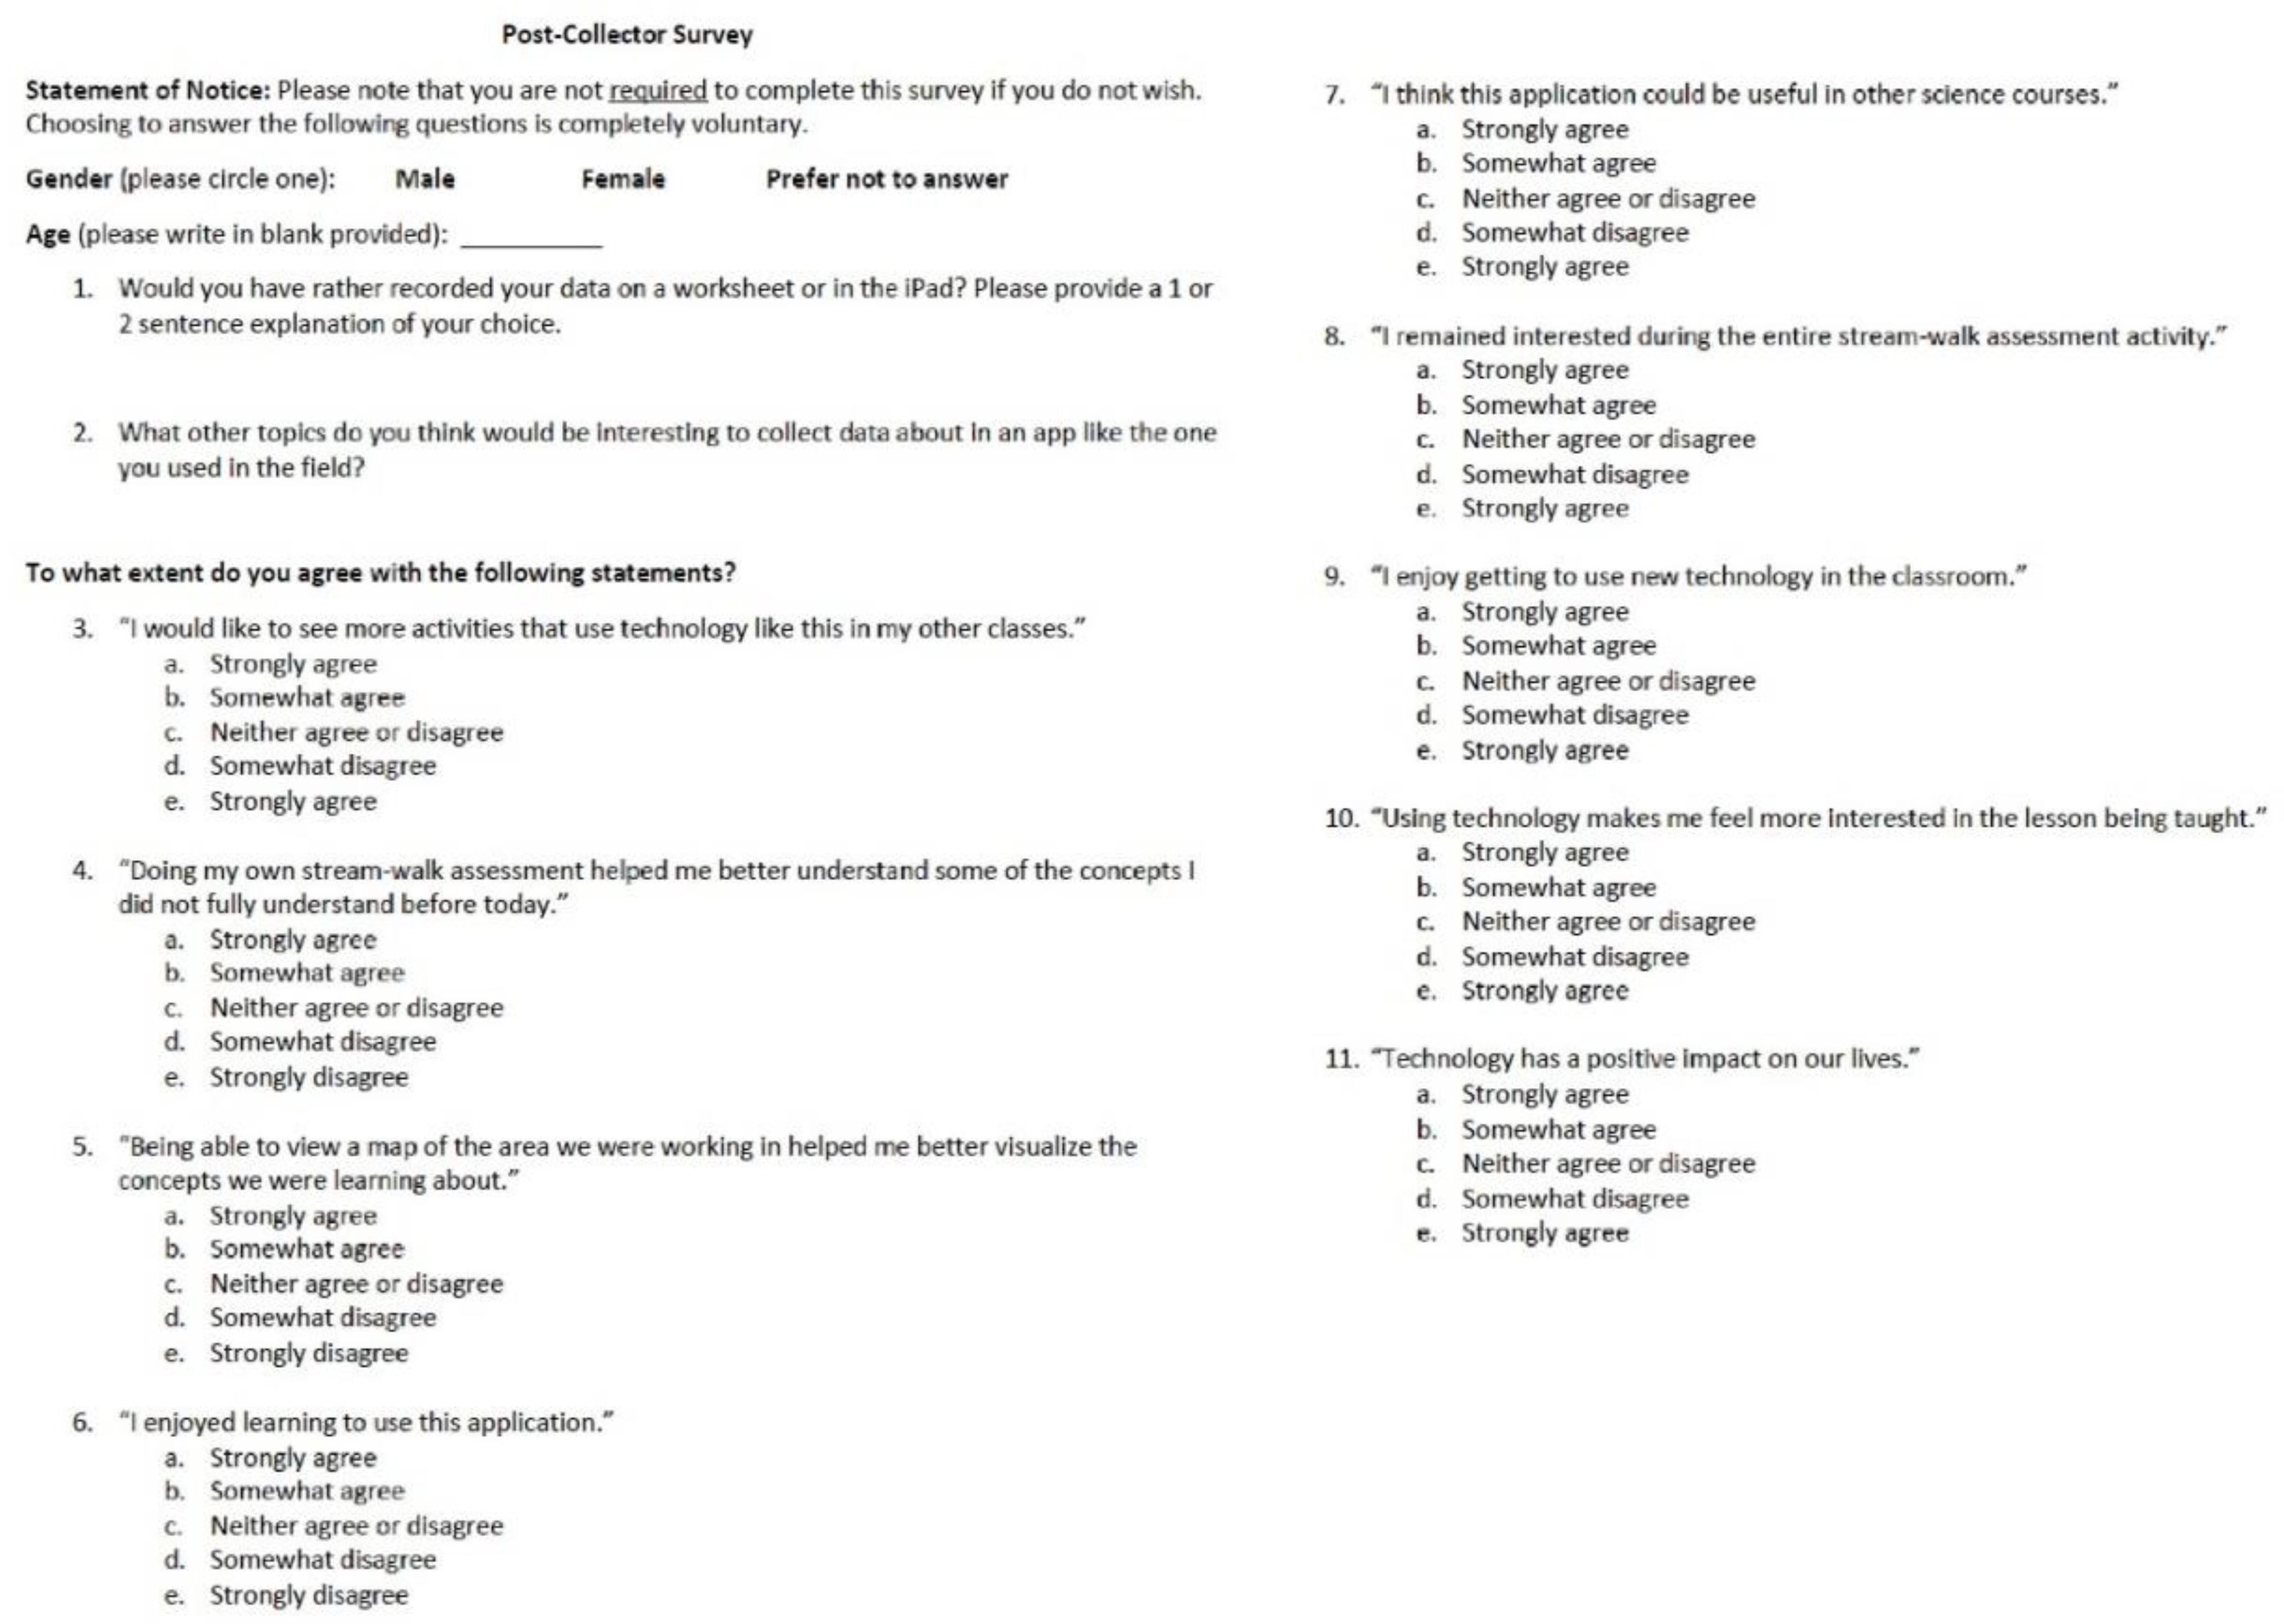
The post-survey (see
Figure A3 in the
Appendix A) focused on student impressions of the data collection app and the stream health assessment activity, their preferences for this type of electronic data collection compared to a traditional paper format, and their thoughts on applying similar technology to other courses. Likert-scale questions were again administered to assess how the students’ opinions may have changed after the field experience, how engaged the students felt throughout the activity, and how this type of technology could aid the students in connecting with the curriculum and its materials.
2.3. Survey Analysis
Pre- and post-surveys were analyzed with quantitative and qualitative methods. Likert-scale questions about preferences for hands-on and technology-driven lessons, perceptions of daily technology use, and enthusiasm for new technologies were analyzed to determine if the exercise had any positive or negative effects on how students perceive technology in the context of the curriculum. The Likert-scale used in this study included five letters (a, b, c, d, and e), corresponding to “strongly agree,” “somewhat agree,” “neither agree nor disagree,” “somewhat disagree,” and “strongly disagree,” respectively. These letters were converted to the numbers 1, 2, 3, 4, and 5, respectively, for further analysis.
Paired, two-tailed,
t-tests were used for Likert-scale questions that were repeated between the two surveys to quantify if statistically significant differences (at 95% significance level;
p < 0.05) exist in student enthusiasm and opinions before and after the data collection activity. A retrospective power analysis was also conducted for these questions to determine the power and sample size needed to detect a statistically significant difference [
20]. Both
t-tests and the power analyses were conducted using Microsoft Excel.
Responses to short answer questions were coded to identify any reoccurring content that the students mentioned (e.g., enjoyment, ease of use, attention). The coding helps remove the extraneous data that may be considered “noise” caused by excessive text [
21]. This analysis also helps identify the overarching contents and sub-contents of the findings.
3. Results
3.1. Student Background in Using Technology
The responses of the background questionnaire indicated that most students used technology in their free/recreation time each day and used it multiple times per week to aid their homework (
Figure 2). Smartphones and computers were the most frequently used electronic devices, with some students indicating that they also occasionally utilized iPads and tablets. In addition, more students prefer to read information from an electronic device rather than a textbook (
Figure 2). These results suggested that most participants entered this study with strong exposure to technologies in their course work and daily lives.
3.2. Responses to Likert-Scale Questions
We asked six and nine Likert-scale questions in the pre- and post-surveys, respectively, with three questions repeated in both surveys. Student responses for the six pre-survey questions indicated that they are in favor of, and generally tend to enjoy, non-traditional teaching methods based on computers and other technologies (
Figure 3). Specifically, a majority of the students (13 strongly agree and 10 somewhat agree, or 92% of the total 25 participants) identified themselves as hands-on learners. Generally, participants felt more comfortable with their learning process and information uptake when given the opportunity to physically partake in what they are learning, as opposed to reading from a book or listening to a lecture. Most students also enjoyed learning to use new technologies (10 strongly agree and nine somewhat agree, 76%) and getting to use new technology in the classroom (10 strongly agree and eight somewhat agree, 72%). The students also felt somewhat comfortable working with computers and related technologies and felt confident in their own abilities to use them (six strongly agree and 14 somewhat agree, 80%). The responses for the questions of “Using technology makes me feel more interested in the lesson being taught” and “Technology has a positive impact on our lives” were relatively split. Only 60% of participants (eight strongly agree and seven somewhat agree) agreed that using technology makes them feel more interested in class and three students disagreed and one student strongly disagreed with this argument. Similarly, only 56% of participants (six strongly agree and eight somewhat agree) thought that technology has a positive impact on their lives; nine students had the neutral opinion, and two students somewhat disagreed with this argument. These results support the idea that new geospatial technologies could benefit a student’s learning experience, whereas some reservations still exist if new technology makes them feel more interested in the class and has a positive impact on their lives. This is probably because innovative teaching approaches, such as the field stream health data collection assessment using our customized app, had not been used before we conducted the pre-survey.
For the Likert-scale questions in the post-survey, the student responses indicated a positive experience with the app and the stream health assessment activity, as well as a positive outlook about its potential applicability in other courses (
Figure 4). With 84% of positive responses (13 strongly agree and eight somewhat agree), a majority of the participants would like to see activities like this in other courses. About 92% of the students (12 strongly agree and 11 somewhat agree) thought that this stream health assessment helped them better understand the concepts that they did not fully understand before. The results also showed that students felt that viewing the map of the working area in the field helped them better visualize the concepts they had learned about (six strongly agree and 15 somewhat agree, 84%; and only one strongly disagree), as opposed to trying to visualize them conceptually in the classroom. Most students enjoyed learning using our customized app (nine strongly agree and 13 somewhat agree, 88%) and believed that this app and similar activities would be beneficial to other science courses (13 strongly agree and 11 somewhat agree, 96%). Students mostly agreed that they stayed interested throughout the entire duration of the activity (seven strongly agree and 11 somewhat agree, 72%).
We also observed positive increases in students’ perception of the role of technology in their learning and the impact of technology in their lives based on the responses of the three repeated Likert-scale questions in the pre- and post-surveys (
Figure 5). The positive responses for the question of “Using technology makes me feel more interested in lesson being taught” increased from 60% (eight strongly agree and seven somewhat agree) in the pre-survey to 76% (13 strongly agree and six somewhat agree) in the post-survey. The percentage of students who enjoy using the new technology in the classroom increased from 72% (10 strongly agree and eight somewhat agree) in the pre-survey to 96% (17 strongly agree and seven somewhat agree) in the post-survey. In the pre-survey, only 56% of participants agreed that technology has a positive impact on their lives (six strongly agree and eight somewhat agree), whereas, in the post-survey, this percentage increased to 88% (16 strongly agree and six somewhat agree).
After coding the different responses of Likert-scale questions to the 1–5 scale, we also examined if the increases in the positive responses of the three repeated questions were statistically significant based on paired
t-tests (
Table 1). We found that the positive responses to two of the questions: “Technology has a positive impact on our lives” and “I enjoy getting to use new technologies in the classroom” were statistically significant (
p < 0.05). Specifically, the mean response score to “Technology has a positive impact on our lives” improved from 2.28 in the pre-survey to 1.56 in the post-survey (
p < 0.002). The mean response score to the question: “I enjoy getting to use new technologies in the classroom” improved from 1.92 in the pre-survey to 1.36 (
p = 0.01) in the post-survey. We also observed the improvement of the mean response score from 2.28 to 1.80 for the question: “Using technology makes me feel more interested in the lesson being taught.” However, this improvement was found to be not statistically significant (
p = 0.15). Retrospective power analysis of this
t-test revealed only 30% power to detect a statistically significant difference with a minimum required difference of 0.66 between the means or a sample size of at least 47 participants. In contrast, the power analysis results of the other two questions were 93% and 86%, respectively.
3.3. Content Analysis of Short-Answer Questions
The pre-survey contained one short-answer question: “Whenever you find yourself becoming uninterested during class, what are some things the instructor could do to make the lesson more interesting?” Many responses mentioned interactivity, electronics, games, and active learning. The prevalent comment was the desire for the instructor to offer an alternative to the traditional pen-paper lecture style format. We also asked a multiple-choice question, “In what school subject do you think technology would be the most helpful to have available to your during class?”, in the pre-survey. Many responses pointed to science-related subjects (12 responses). Interestingly, eight responses selected the history-related subjects, likely because of the close linkage between geospatial technology, such as mapping, and history. Other responses also checked math (six responses) and English (three responses) related subjects. Note that some students checked multiple subjects, so that the total selected subjects are 29 by these 25 students.
The post-survey contained two short-answer questions. The first was, “Would you rather have recorded your data on a worksheet or in the iPad? Please provide a 1 or 2 sentence explanation of your choice.” Of the 25 participants, only four stated that they would have preferred writing their data manually as opposed to storing it digitally. Of the 21 participants who said they preferred to use the iPad, 18 mentioned the terms “easier” or “easy” when describing why they made that choice. Five participants used the terms “convenient” and “quicker,” and stated that they felt writing data by hand is much more time consuming than creating data points in the app. One participant mentioned a preference for the iPad because they did not believe that they had good handwriting, and the use of an iPad ensured that their words/ideas would not be misread. One participant also stated that it is easy to lose sheets of paper, and that the use of an iPad ensured that one could not lose track of the collected data.
The second post-survey short-answer question was, “What other topics do you think would be interesting to collect data about in an app like the one you used in the field today?” Twenty responses included topics related to physical, biological, and environmental sciences. Seven participants stated that this kind of app would be helpful for exploring the biodiversity data of an area. One participant indicated that it would be interesting to see a similar app used to record the locations and counts of stars in the sky from a particular viewpoint. Several responses were less specific about what subject the students thought would be interesting to use the app with, but the students did respond that this type of technology would be good for creating and storing records of various types of environmental data (e.g., temperature changes, stream speeds, and water chemistry).
In summary, content analysis revealed that students are more apt to embrace new technologies if the data logging methods are faster, easier, and more convenient than hand-written logs. The data collection app provided more time for students to focus on their fieldwork instead of manually recording the information on paper. Participants enjoyed that the app allowed for a new level of interactive hands-on work to their lessons.
4. Discussion
4.1. The Impact of the Geospatial Data Collection App on Student Engagement
This study reinforces prior research that introducing new technologies, particularly geospatial ones, into environmental science curricula can increase student engagement and raise interest in the topics being presented [
7,
8,
9,
11,
17]. The introduction of apps, such as the one described in this study, can benefit science courses by providing easier methods of data logging, speeding up the data collection process, and providing hands-on interactive methods to keep students physically engaged in their lessons. Technological support, especially in collaborative learning, is beneficial to both students and instructors [
19]. It is evident that technology is more than just a part of the acronym STEM; it is also at least partly responsible for STEM education’s success in raising student engagement and the positive perception to STEM from students and instructors alike. The growth of STEM, particularly informal STEM, has allowed for science curricula to integrate new teaching proxies that help students overcome the feelings of burn-out that they encounter when overexposed to traditional teaching methods [
22].
Survey analysis suggests that students in this study see themselves as hands-on learners, enjoy learning to use new technologies, feel relatively comfortable using computers, and are confident in their knowledge of how computers work. Participants acknowledged that they could see similar applications being useful in other courses and would like more experience using them in other classes. They use and experience different technologies multiple times per week, both at home and in school, indicating that they prefer reading information from an electronic device as opposed to a textbook. Most students expressed that they felt engaged during the duration of the stream health assessment activity, and while this may or may not be due to use of the iPads to log their data, this notion is reinforced by studies using iPads to aid in collaborative learning scenarios where students reported higher levels of self-perceived attentiveness [
23]. Students in another study also indicated a desire to include some sort of game activities with their lessons, an idea that could further increase levels of engagement as well as academic performance [
24].
While the app was developed for the purposes outlined in this study, it also ended up having other practical uses for the students as well. For example, as a part of their watershed curriculum, groups of three to four students conducted final projects that investigated watershed-related concepts. While there was no follow-up at the end of the academic school year to see how the data was applied to each project, the students informed the study team that they had chosen topics concerning algae growth, concentration of litter/trash in varying parts of the stream, and abundance of animal species present. The stream health assessment activity influenced the student’s choice of the particular types of data collected and used in their watershed project investigations. Additionally, thanks to the accessibility of the data provided by ArcGIS Online, they could access their collected points as often as they need to supplement their projects.
A common complaint among students in both this study and in the literature is that the traditional lecture format causes a disconnect with the material being taught; therefore, students are not able to see how it is applicable to real life [
25]. The use of geospatial technologies presents students with the opportunity to learn about the environmental sciences in a manner that allows experience through visualization of data and provides context concerning how this data is relevant to their own lives, resulting in enhanced student engagement. Previous studies support the notion that early disengagement from course materials (whether it was caused by lack of exposure to a topic or the pressure from existing stereotypes) substantially lowered the likelihood of students pursuing careers in STEM related fields. To counter this phenomenon, it is critical to include geospatial technologies in environmental science curricula as early as possible. By ensuring students remain engaged in the classroom, the popularity of informal STEM learning, as well as the number of students interested in STEM careers, will likely continue to increase.
4.2. Limitations of This Study
There are limitations of this study that may affect some of the findings. First, the relatively small sample size produced lower-than-ideal statistical power for the t-test analyses. Recruiting a larger sample size (e.g., conducting the study with two or more classes) could have helped improve the power of t-test analyses to detect statistically significant differences if they exist. If this study were to be repeated, we recommend using two or more classes to ensure that a sufficient sample size, as determined by an a priori power analysis, is achieved.
We also recommend future studies to include a control group during the data collection activity. In this study, all participants used the iPads and the developed app to see how it would increase their level of engagement. While the increases could be deemed statistically significant, other than the pre-survey scores, there was no control condition to compare the degree of change. A control group consisting of students logging their observations on a worksheet in the traditional pen-to-paper style could have been involved in the same activity, with pre- and post-surveys revised to gauge how the pen-to-paper method made them feel, and if they would have preferred to use a different method based on interactive geospatial technology. This would allow for the comparison of two sets of observations and t-tests to examine more conclusively whether the inclusion of the interactive geospatial technology with the iPad was what actually caused the improvement.


