1. Introduction
The rapid development of information technology has had a huge influence on education, and the application of the technology to maximize learning outcomes has always been a topic of discussion among scholars. Massive Open Online Courses (MOOCs) [
1] have aroused interest in educational circles and, currently, there are many mature MOOC learning platforms, including the US’ Coursera [
2], Udacity, edX [
3], Australia’s Open2Study, and the UK’s Futurelearn. MOOC refers to the establishment of learning communities through unrestricted participation and readily available online courses. Its characteristics include open sharing, expandability, open authorization of content, open architecture, and learning objectives.
Some students are easily distracted in traditional classrooms, which leads to a lot of time spent on review and homework after returning home. MOOCs are different from traditionally taught courses in that students can play back content if they do not understand the course. MOOCs provide online peer assistance for learners and opportunities to interact online with course teachers [
4]. Compared with the previous form of online education, MOOCs are closer to personalized learning—there is no teacher supervision, no entry threshold, and no need to pay expensive fees. MOOCs facilitate self-regulated and individualized learning in order to enable learners to achieve better learning results. Many studies are now focusing on analyzing the learning history records left by users of MOOCs [
5] in order to predict students’ possible achievements through analytical methods [
6] and to provide early guidance to students who need help.
MOOC courses are mainly based on video viewing and quizzes, which take the majority of the learners’ time. Many problems have been gradually found. First, many students neither continue to participate in learning after enrolling in a course nor meet the standards for passing the course after the course ends. This behavior of students not completing the courses [
7] prompts the question of how to stimulate the completion rate, which is a problem that every MOOC platform wants to solve [
8]. One reason for the low completion rates may be the students’ own problems, and some students may need more proper supervision [
9]. It may also be a problem with the video material, which may need to be adjusted or supplemented. There is no clear answer at present, thus, stimulating the completion rate is a major challenge for MOOCs [
10,
11].
Moreover, as the number of students taking MOOCs is much higher than that of traditional courses, it is difficult for teachers to cater to each student’s personal learning situation. At present, the simplest way is to engage more teaching assistants to solve the learning problems of the many students. However, as the number of students continues to increase, this is obviously not cost-effective. Therefore, helping students with poor participation rates and low motivation is an important issue.
The nature of this type of course is different. The style of the course videos depends on the teachers’ preference and the feasibility, or on the institutional guidelines other than structured theory [
12]. Moreover, there are significant characteristics that can be adapted, with respect to learners passing or failing a course, if the course videos are properly classified by their nature [
13].
This study used the course materials on the OpenEdu platform, which is a MOOC platform based on the edX open-source program. Because the platform provides a complete teaching environment, including course details and learning history records, we learned about the behavior patterns of students by browsing videos and processing and analyzing the collected data. We also classified the course videos and provided possible links between video viewing behaviors and learning outcomes through analysis of a combination of different video types. In our research, we used the video clickstream behavioral actions of the first two semesters of a course to normalize the clickstream feature sequences and build learning outcome prediction models based on the selected feature set. We then divided the videos into different types and used machine learning to establish the accuracy of each individual type and different combinations. A 2 × 2 contingency table was used to test and analyze the prediction accuracy. Then, the data of the third semester for the same course was used to make predictions with the best overall prediction model. In addition, we identified which type of video most affected whether students passed the course and will make this available to the instructors for reference. This will enable teachers to implement timely counseling measures for students with poor learning results.
2. Related Research
The experimental environment of this study adapts the OpenEdu platform, as established by the Chinese Open Education Consortium [
14] and based on edX open source software. The platform aims to continuously promote open courses, increase the level of influence of teaching innovation, follow the development trend of international digital learning, and narrow the gap between urban and rural areas, thus ensuring equal rights to education. To this end, the Chinese Open Education Consortium has joined many schools and institutions interested in developing MOOCs—including the organization’s fundraising and human operations—by providing construction guidance, teaching platform maintenance, promotion, and other services through the construction of the alliance system.
In their discussions of the low completion rate of the MOOCs course, the researchers analyzed the learners’ video viewing, scores [
15], and forum behavior records [
16]. In Anderson [
17], the students’ activity behavior patterns were divided into five types: Viewers, Solvers, All-rounders, Collectors, and Bystanders. In Rebecca [
18], the students’ activity behavior patterns were divided into seven types: Samplers, Strong Starters, Returners, Mid-way Dropouts, Nearly There, Late Completers, and Keen Completers. In Khalil [
19], the students’ activity behavior patterns were divided into four types: Dropout, Perfect Students, Gaming the System, and Social. In Sinha [
20], a cognitive video watching model was applied to explain the dynamic process of cognition involved in MOOC video clickstream interaction. The students’ activity behavior patterns were divided into seven types: Rewatch, Skipping, Fast Watching, Slow Watching, Clear Concept, Checkback Reference, and Playrate Transition. The purpose of the above discussion is to improve students’ participation in learning, to help solve the problem of the low course completion rate.
N-gram [
21] is easy to access with a rapid calculation and without any complicated algorithm. Therefore, such a method is used in natural language processing to increase calculation efficiency. Articles or sentences are segmented into many small parts when applying the N-gram method, and only a few parts will be affected in the case of an error in an article or a sentence. As such, the N-gram method provides a good error-tolerant rate in natural language processing, can be applied in correcting wrongly written or misspelled characters, and is often applied in calculating the similarity between different articles and sentences or retrieval of texts. Articles or sentences are segmented into many small parts, such that many text combinations of different lengths are also produced if a corpus with small data volume is used. Identical sentences in an article can be segmented into text combinations of different lengths to achieve the effect of multi-segmentation and to obtain more text combinations [
22]. In addition, N-gram extraction methods consist of N-gram by character and N-gram by term.
Machine learning is to classify collected data or train a prediction model through an algorithm, and when new data is obtained in the future, it can be predicted through the trained model. Machine learning techniques such as Naive Bayes, Random Forest, Decision Tree, and SVM (Support Vector Machine) can be used to predict the performance of students, which can help instructors to improve their course design accordingly [
23]. Dropout prediction used machine learning of SVM, Logistics Regression, Random Forest, and Gradient Boosting Decision Tree to make dropout predictions [
7]. Two types of neural network, Feedforward Neural Network (FFNN) and Self-Organised Map (SOM), were employed to predict if learners would receive certifications at the end of the course [
24]. The machine learning data is composed of feature data and real categories in the process of model training. For example, the first algorithm of KNN (K-Nearest Neighbor) in this study is generally used to classify data, where K represents a constant, and KNN takes the K points of the nearest distance to determine to which category the object belongs. The second algorithm of SVM [
25] is for supervised learning models, which is often used for pattern recognition, classification, and regression analysis. The third one is an ANN (Artificial Neural Network) [
26], composed of many neuron nodes, which can be divided into an input layer, an output layer, and a network model consisting of many hidden layers [
27]. The output of the result can only be in the two states of yes or no, while the traditional artificial neural network can train the model by way of back-propagation, thereby obtaining a neural network model to effectively solve the problem.
3. Research Method
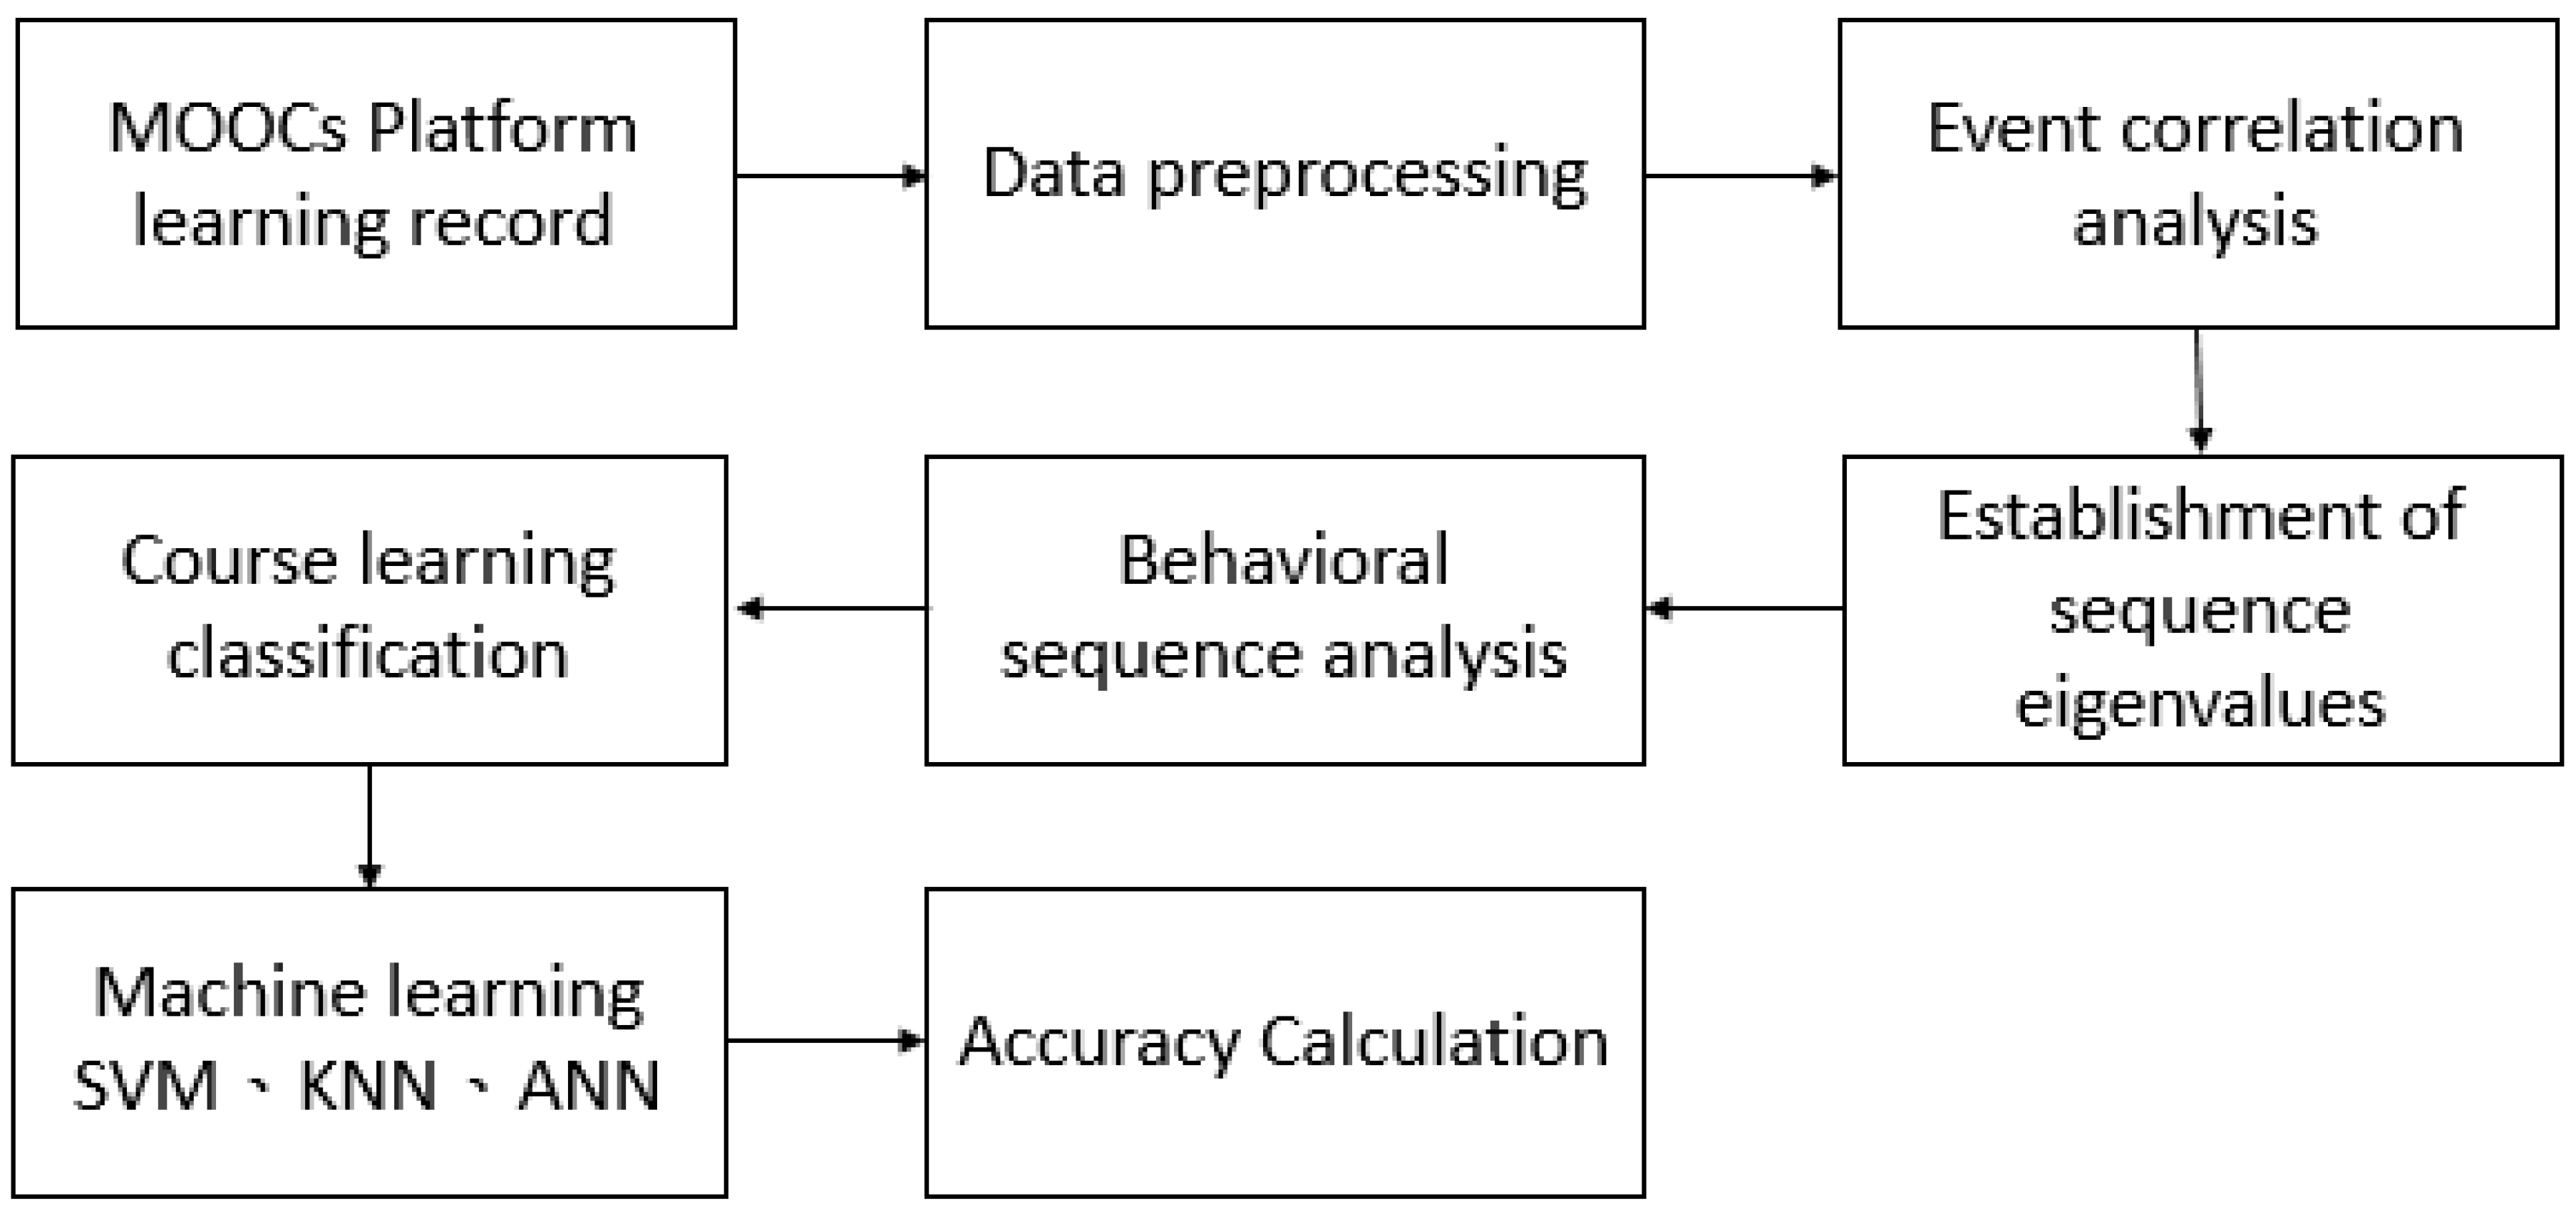
The process of this study is shown in
Figure 1. MOOCs platform learning records are OpenEdu MOOCs platform data stored in MySQL and MongoDB (
Figure 2), while the Tracking Log is stored on the server end in the JSON files format. The contents of the MySQL relational database include user profile, course records, course basic data, etc. The contents stored in the MongoDB NoSQL database include course discussion area content, course videos, course exercises, etc. The Tracking Log records the user’s behavior on the website, where the records are distinguished by events and have a time stamp.
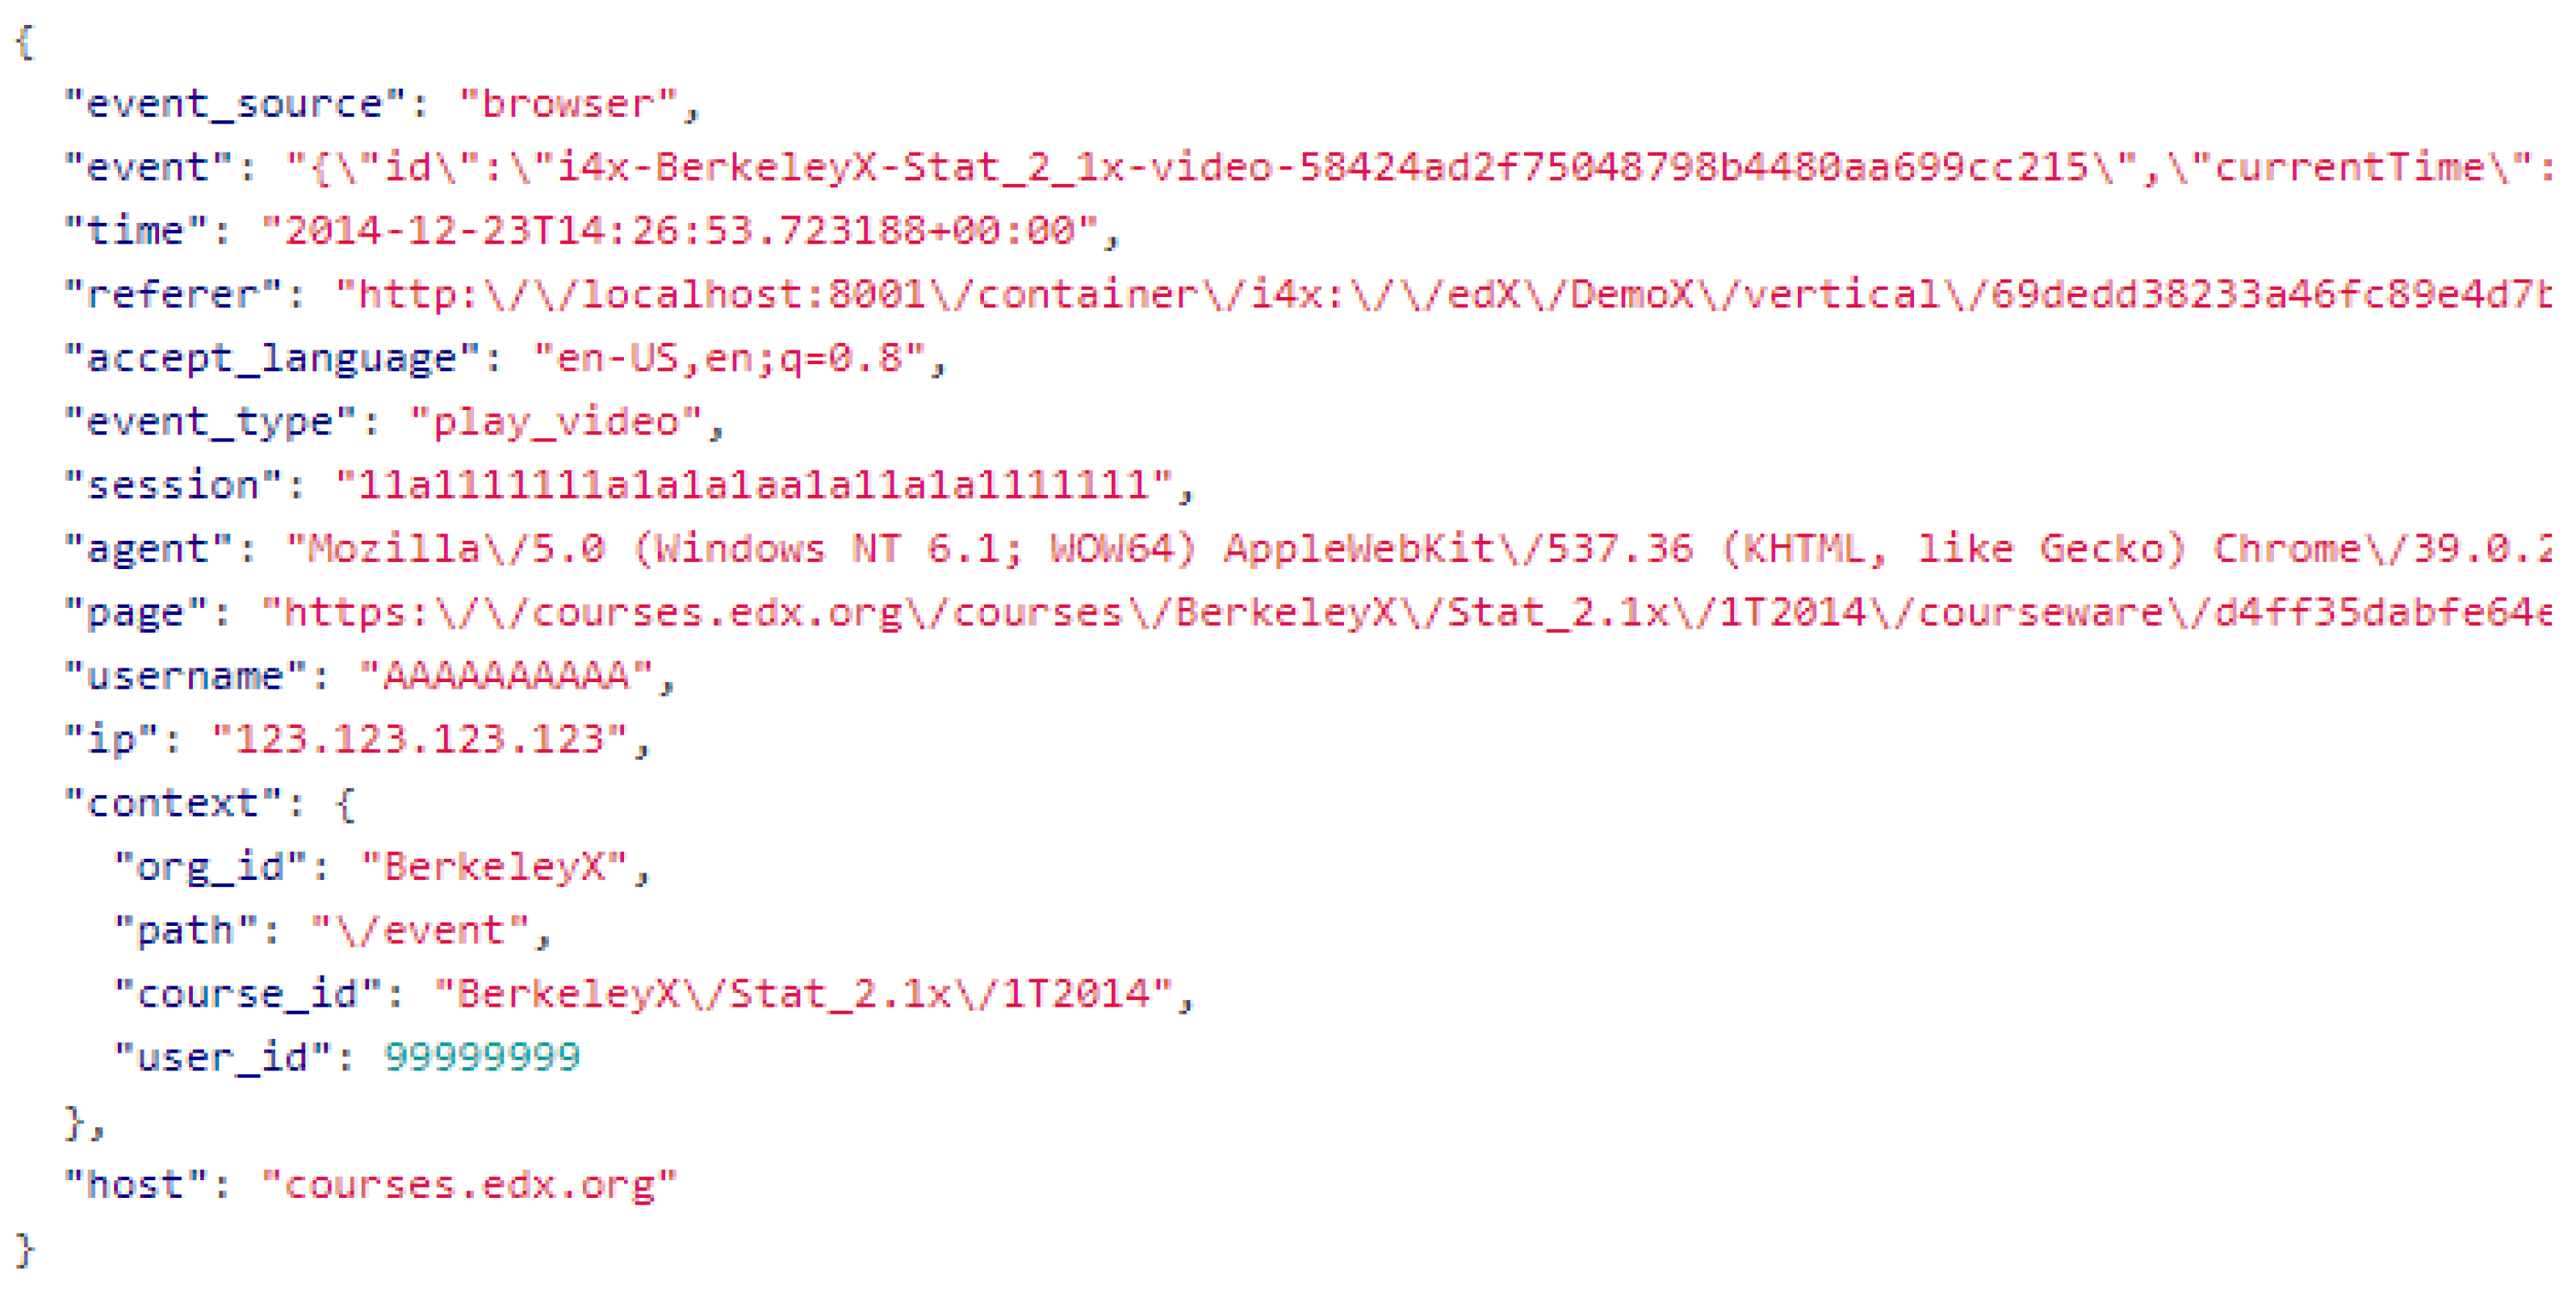
Figure 3 shows the record contents in JSON format when videos are played for students. All users’ operating activities on a website were recorded. Such records were classified by events and attached with a timestamp. The events included video playback events, discussion forum events, answering events, and browsing website events.
Table 1 sets out the description of each field of JSON contents, including username, session, ip, event source, event type, event, agent, page, time, and context. This study conducts follow-up studies with the data taken from viewing videos. The play action includes six events: load_video, play_video, pause_video, seek_video, speed_change_video, and stop_video [
28].
The video playback events were characterized and divided into eight kinds of feature events according to Khalil [
19]. The feature event was set as Pl by the start play action of the video (play_video), Pa by the pause action of the video (pause_video), Sf by the forward skipping action of the video (seek_video), and Sb by the backward skipping action of the video (seek_video); the feature event was set as Rf by accelerating the playrate action of the video (speed_change_video) and Rs by decelerating the playrate action of the video (speed_change_video) when the video was played; when the seeking actions of these videos occur within a small time range (<1 second), these seeking events were defined as scroll actions; when the video was played, the feature events were set as Cf and Cb, respectively, by the forward scroll action and the backward scroll action.
The loading action of the video (load_video) sets the feature event as Lo; the ending action of the video (stop_video) sets the feature event as Sp; the subtitle display action of the video (show_transcript) sets the feature event as Sh; and the subtitle hiding of the video (hide_transcript) sets the feature event as Hi.
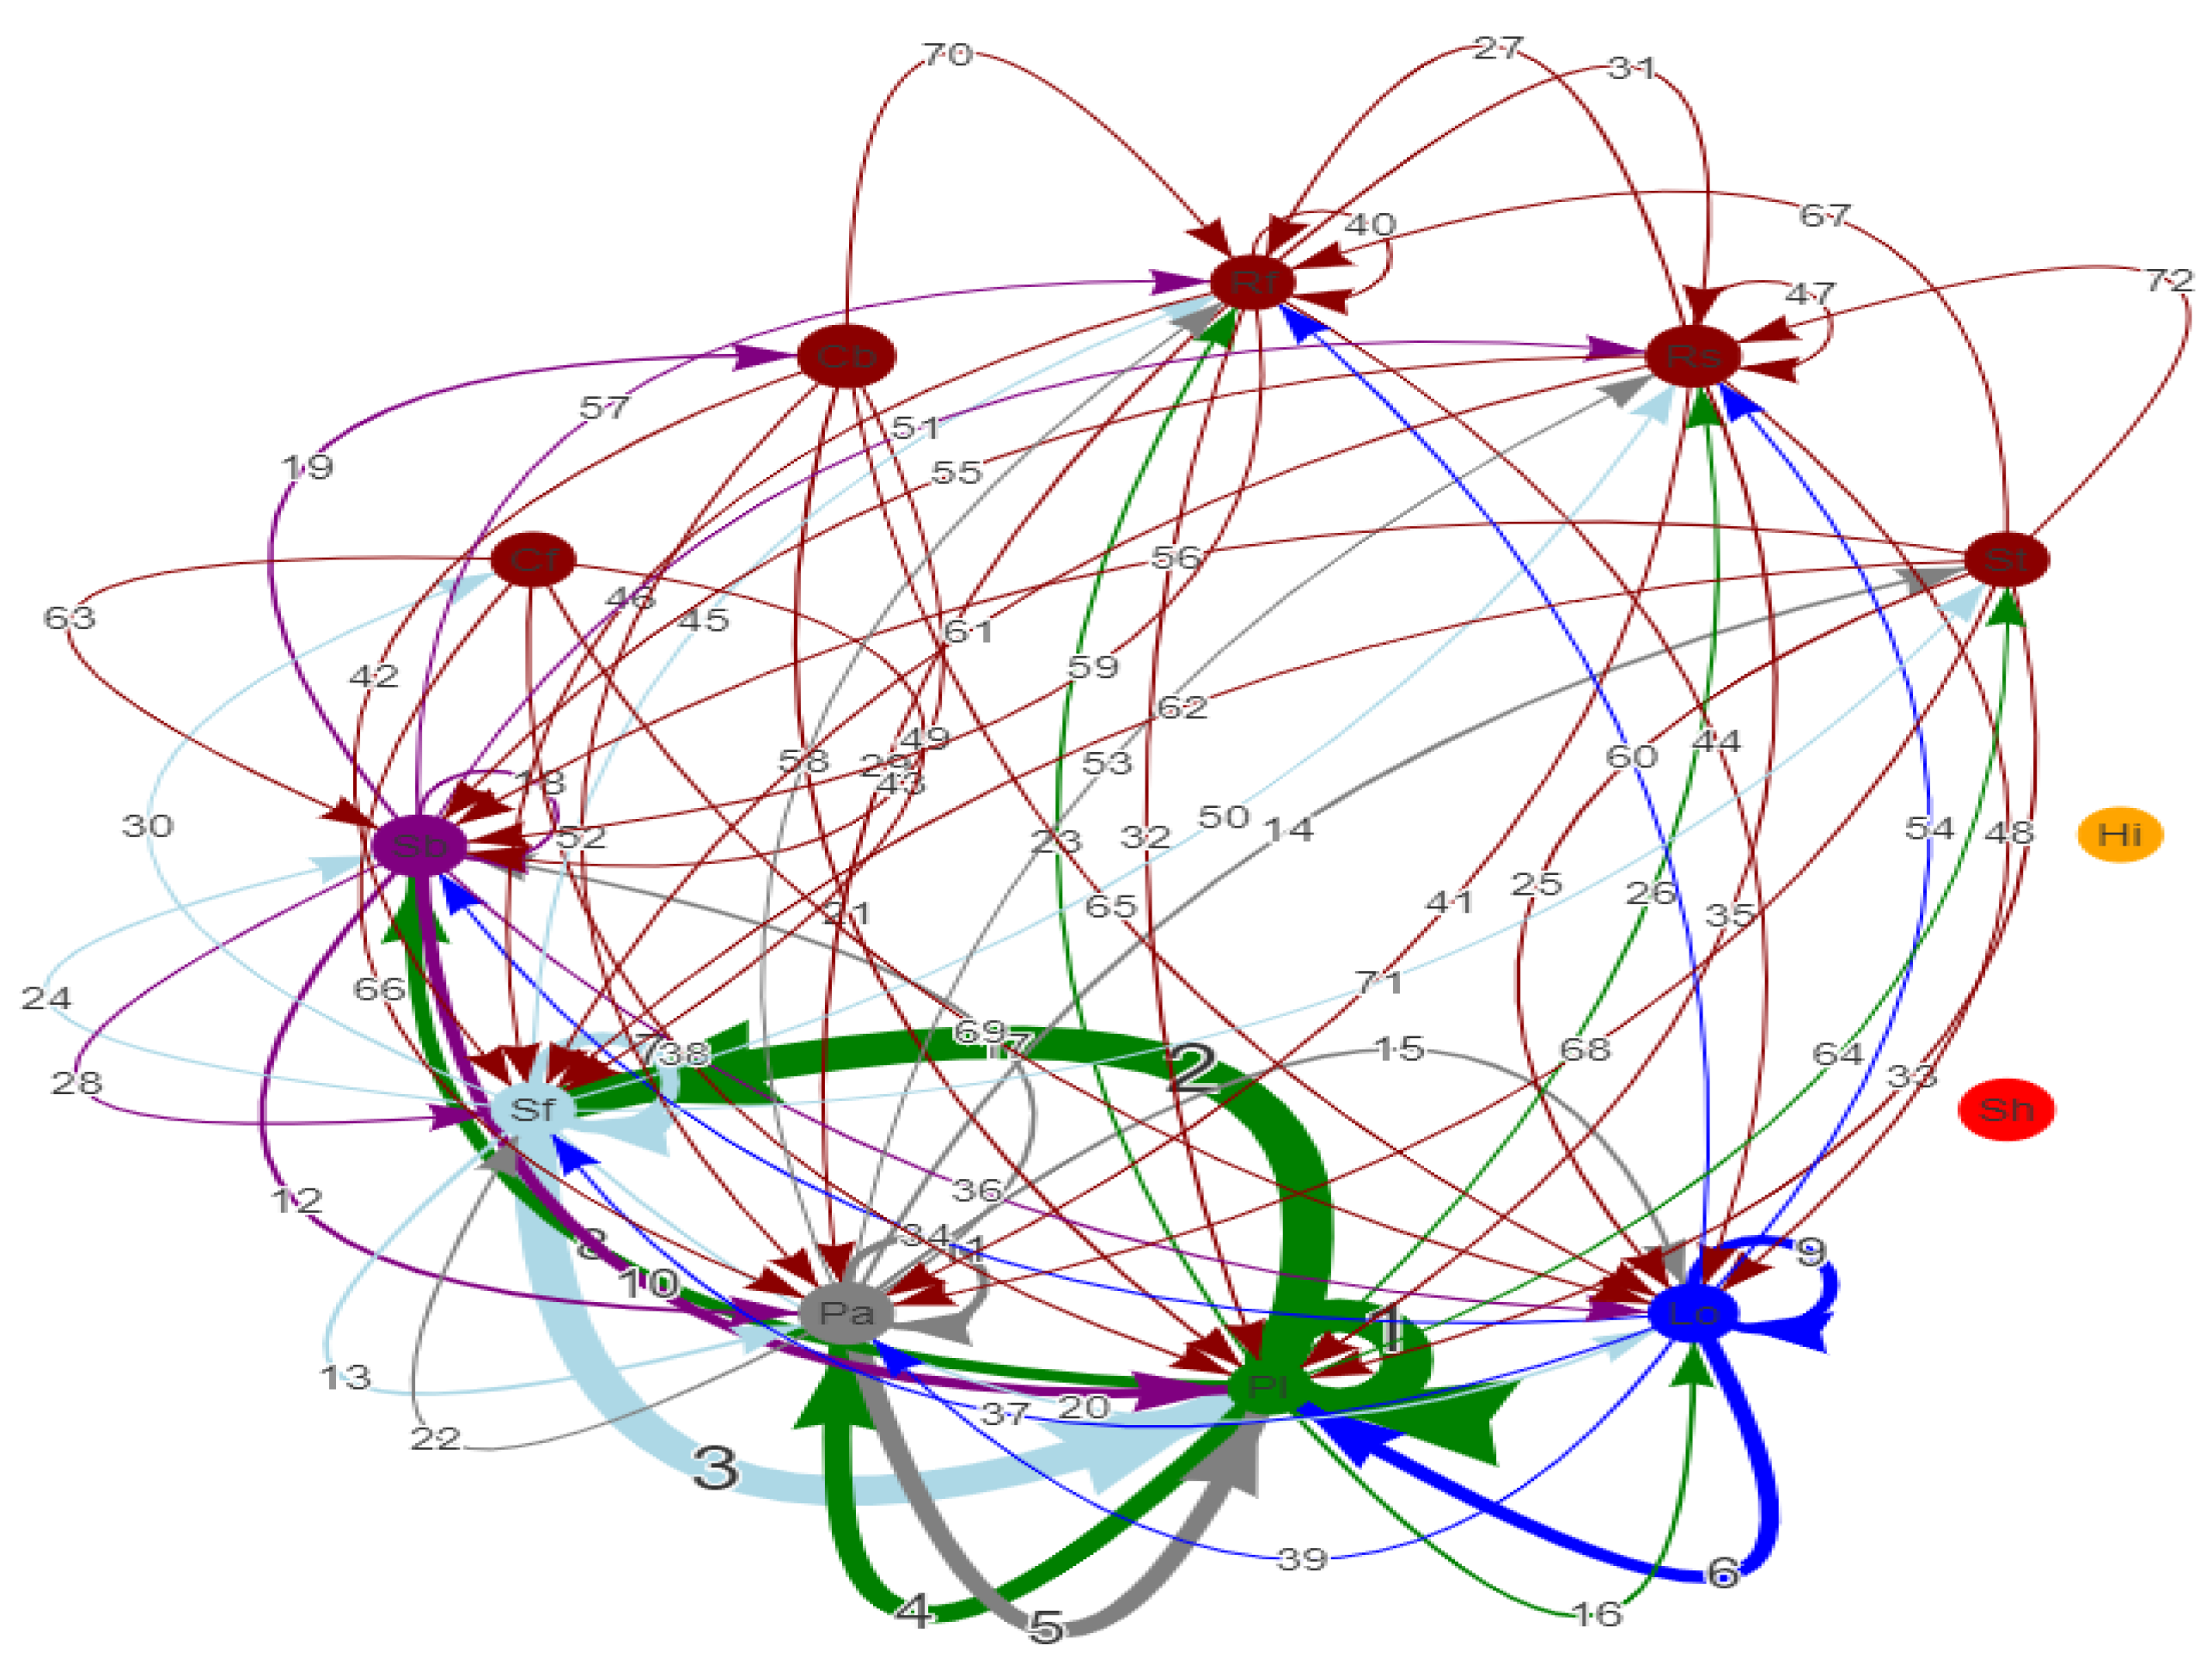
Figure 4 observes the occurrence frequency of any two feature events in a course we examined. Since Sh and Hi are less relevant to learning outcomes, they are not included in the observation. For example, in
Figure 4, two feature events, Pl and Sf, are generated online. These two feature events have a time-continuous relationship from Pl to Sf under the line number 2. The thicker the line, the greater the number of occurrences. Table 4 shows a total of 4044 times for line number 2.
Table 2 shows the set of 12 feature events derived from the eight OpenEdu video events.
In order to analyze the sequence of video viewing behaviors, we recorded the same session number upon learners opening a browser for networking when they logged in to view course videos and generate learning events. The process of events is recorded chronologically. Such a record was the behavior sequence of a learner in viewing a certain video. We studied event items in the behavior sequence to remove event items that are not related to learning, such as show_transcript and hide_transcript, and convert them into feature sequences. The feature sequences form a specific combination of features for the learner to view the continuity of the course unit video. The features combination is a continuous sentence composed of two specific characters, and then the word exploration is used to score the sentence similarity. Therefore, the content of each feature sequence is N-gram processed to observe the frequency and percentage of similarity occurrence.
Table 3 sets out the case studies on five example records, and each of them is a video-clicking operating record of each learner under the same session networking condition in viewing a certain course video. The No. 1 record is the learner’s viewing behavior sequence and ten feature events in total have been obtained by chronologically processing the 16 video events clicked by the learner.
After applying the N-gram package of R, this study observed that two feature events (2-grams) occurred in a total of 72 combinations, of which the combinations with the top 10 highest frequencies were PlPl, PlSf, SfPl, PlPa, PaPl, SfSf, LoPl, PlSb, SbPl, and LoLo, in sequence, as shown in
Table 4. The three feature events (3-grams) occurred in a total of 407 combinations, of which the combinations with the top 10 highest frequencies were Pl Pl Pl, Pl Sf Pl, Pl Pa Pl, Pa Pl Pa, Sf Pl Sf, Pl Pl Sf, Sf Pl Pl, Pl Sf Sf, Sf Sf Pl, and Pa Pa Pa, in sequence (
Table 5). In addition, four feature events (4-grams) occurred in a total of 1,508 combinations, of which the combinations of the top 10 highest frequencies were Pl Pl Pl Pl, Pa Pl Pa Pl, Pl Pa Pl Pa, Pl Sf Pl Sf, Sf Pl Sf Pl, Sf Pl Pl Sf, Pl Sf Sf Pl, Pl Pl Sf Pl, Pa Pa Pa Pa, and Sf Sf Pl Pl, in sequence (
Table 6). Based on Sinha [
20], we found that the length of 2-grams and 3-grams is too short to manually identify learning behaviors for video clickstreams. Therefore, 4-grams is used in our analysis, as determined empirically.
According to Sinha [
20], the behavioral actions of the video viewing sequence can be divided into seven types: Rewatch, Skipping, Fast Watching, Slow Watching, Clear Concept, Checkback Reference, and Playrate Transition. Next, the above twelve feature events of
Table 2 are used to define each type of behavioral actions, provided the said behavior conforms to one of the video playback feature sequences. Therefore, grouping clickstream sequences to form higher-level categories, instead of raw clicks, better exposes the browsing pattern of leaners. Due to the use of the fixed sequence mode, such as the top ‘k’ most frequent 4-grams, the frequency in full coincidence with the feature sequences is very low. Therefore, we use the *: don’t care eigenvalue mode to group clickstream feature sequences to form behavioral actions, as shown in
Table 7. For example, Rewatch is formed with the combinations of Seek Backward and Play, as well as two occurrences of don’t care [
6,
29].
The resulting feature records of video watching statistics and test results are merged based on the test unit of the course to record their answers and scores. If a video is not followed by a test in the current learning unit, its viewing statistics will be recorded in the next test unit, which can be used as a predictive feature of learning engagement. The feature items include the number of entries to the course unit, the number of online videos played, the number of playbacks, load times, play times, pause times, stop times, seek times, speed_change times, Rewatch, Skipping, Fast Watching, Slow Watching, Clear Concept, Checkback Reference, Playrate Transition, the number of tests used, the number of tests answered, the number of tests tried, unit test scores, final test scores, course scores, and course assignment scores. Therefore, the generated features of course unit activities have a total of 85 feature items. Through the feature selection function, we selected 14 feature values for machine learning model building and prediction, as shown in
Table 8. Note that video viewing and unit test activities are included in the feature set. This is because we found that some learners did not take the test after viewing the videos in a course unit. On the other hand, some learners took the test without viewing videos.
4. Analysis and Experiments
As the course contents of the MOOCs platform are very diversified, a foundation course, which had been offered at least three times, was selected to conduct analysis. The first class lasts for 6 weeks, contains 55 videos, and has a total of 532,579 learning process records. A total of 590 students took part in the course, of whom 264 obtained the certificate, while 327 failed to obtain the certificate. As mentioned at the end of the previous section, we found that there were 3706 records of learning activities in terms of course unit. (a) Among the 3706 records, there were 511 of them without taking unit tests. (b) For those taking the unit tests, there were 538 of them without viewing any video in a course unit. Therefore, it is necessary to include both the clickstream of the video viewing and unit test score in the feature set. The second class has a total of 256,000 learning process records; a total of 346 students participated in the course, of whom 137 obtained the certificate, while 209 failed to obtain the certificate. The third class has a total of 137,348 learning process records; a total of 427 students participated in the course, of whom 57 obtained the certificate, while 370 failed to obtain the certificate. We will combine the learning process records of the first two semesters to build prediction models and select the best model to verify the prediction accuracy with the data from the third semester.
As mentioned before, the N-gram method of R language is used with n = 4 and the sequence analysis results show that a total of 1508 combinations occurred in the four feature events (4-grams) from the data of the second class, of which the combinations of the top 10 highest frequencies are presented in
Table 6. Then, the don’t care eigenvalue mode is used to form the seven behavioral actions of learners’ learning engagement, as shown in
Table 7.
Table 8 presents the feature set of course unit activities for building prediction models.
First, when the KNN method of R language is used, the library(ISLR) suite should be loaded beforehand using the knn() function, including 70% of the feature data set for training, 30% of the feature data set for testing, and the real classification factors are pass (1) and fail (0) of the course, where the K value (# of neighbors) is calculated as the square root of the number of click counts, and the accuracy is 0.8624535.
As the accuracy of the KNN model is poor, we use the SVM method next. The library(e1071) suite should be loaded beforehand in R language, and svm() is used to train the classification model of SVM, including 70% data for training, 30% data for testing, and the target values are pass (1) and fail (0) as well. The accuracy of the built model is 0.9442379.
For further improvement, we use the ANN method of R language and the library(nnet) suites should be loaded beforehand using the ann() function, including 70% data for training, 30% data for testing, and the target values are pass (1) and fail (0). The number of units in the hidden layer was set from 1 to 10, the parameter of the specific gravity attenuation was 0.001, and the maximum number of repetitions was 1000. When the numbers of units in the hidden layer were 1 to 5, the highest accuracy of the model was 0.9516729. The ANN model has the highest average accuracy as well.
We also performed the experiments using 80% of the feature data set for training and 20% of the feature data set for testing. It is found that the accuracy of the 80–20% partition is better than that of the 70–30% partition. For example, the third column of
Table 9 shows that the highest accuracy of the ANN model for the first two classes offered is 0.955307263 when the number of hidden layers is 2 or 3. Then, based on the best ANN model built by using the first two classes data set, we use the third class data set as testing data to find the prediction accuracy, as shown in the fourth column of
Table 9. We can see that the average prediction accuracy of the third class data (0.977578475) is slightly better than the average model accuracy of the first two classes of data (0.950837989). The result is better than we expected, since the two classes were offered in different semesters.
Based on the built models, we can also make weekly predictions. Thus, the weekly tutoring list of students was provided for teachers to supervise students’ learning progress. There were 313 students who needed tutoring in the first week, 313 in the second week, 311 in the third week, 305 in the fourth week, and 297 in the fifth week.
In addition, we would like to generalize the research result and show that our approach can be applied to any new courses. We selected another MOOC course that lasts for 9 weeks, contains 95 videos, and has a total of 447,133 learning process records. A total of 977 students took part in the course, of whom 86 obtained the certificate, while 891 failed. First, 70%/30% partitions of course data into training/verification data were performed. The KNN, SVM, and ANN methods were used to generate prediction models and their model accuracies are 0.8787879, 0.9218182, and 0.9318182, respectively. ANN is still the best. Using 80%/20% partitions, the model accuracy of ANN increases to 0.9431818. This is consistent with the previous result of our approach.
5. Further Improvements
To make further improvements and provide more information for teachers, we classify course videos based on their contents and perform additional analysis. Course videos were classified into three classes: theoretical videos, experimental videos, and analytic videos. Types of video viewing behaviors were compared through cross-validation and analysis of the frequent values distribution diagram. There were indeed different significant features with respect to learners passing and not passing the course. It was found that students did not view and click all the videos in their video viewing model according to analysis of course learning records and course unit videos clicked by students. As such, we examined more details on these three types of video content, and seven types of models were formed through combinations, as shown in
Table 10. For example, there were a total of 55 videos with respect to the whole course in the overall class of all three of them, with a total of 13,124 video clicking records.
There were 21 prediction accuracy items of Size 1~3 of ANN implemented based on the seven types of models. In total, 13 items falling within the scope of ANN Size < 4 and Accuracy > 0.9 have been extracted (
Table 11). Library (stats) suite must be loaded first in R language. The contingency table analysis method was implemented by using table function. We use Overall or All of the three classes as the First category, and take the most accurate Size of the hidden layer as 1 (
Table 11). Using the First category of this item and taking the Size of the hidden layer as 1, the tandem analysis is performed on different Second categories, and the prediction accuracy is determined by using the contingency table, resulting in the top 13 items of
Table 12. Therefore, among those generated with the best accuracy in
Table 12, we find that there are 12 items above the minimum standard (>=75%), and the ratio accounts for 92%. There are 10 items above the winning bid of median standard (>=80%), with a ratio of 46%. There are four items above the best standard (>=90%), and the ratio accounts for 31%, as shown in
Table 13. The results are in line with our purpose.
It was found through the matching test that ANN size = 1 in the overall category was matched with ANN size = 1 in the theoretical and experimental category (see the first entry of
Table 12), and the prediction accuracy values were close (see the first two entries of
Table 11).
6. Conclusions
This study used the click records of MOOCs videos. Firstly, the feature sequence of the viewing learning behavior is established by using the 4-gram approach, and the feature sequence was defined with the don’t care mode as the type of learner’s cognitive participation. Then, we used the K-Nearest Neighbor Classification (KNN) method, Support Vector Machines (SVM), and Artificial Neural Network (ANN) to predict whether students pass the course. Using the course data from two semesters, the predicted results of the built models were KNN accuracy 0.8624535, SVM accuracy 0.9442379, and ANN accuracy up to 0.955307263.
In addition, the weekly tutoring list of students was provided for teachers to supervise students’ learning progress. There were 313 students who needed tutoring in the first week, 313 in the second week, 311 in the third week, 305 in the fourth week, and 297 in the fifth week.
Then, the prediction accuracy of the course data from the third semester was obtained, and the prediction accuracy of ANN under two hidden layers was as high as 0.986547085. We also used a second course to show that our approach can be generalized for application to any new courses.
The prediction of learning outcomes can be presented through an analysis of learning records, course video clicking, and testing records. Due to the different natures of course videos, however, we have classified overall course videos into three types, i.e., theoretical, experimental, and analytic, and seven types of models were formed through combinations. There were 21 items of prediction accuracy of size 1~3 of ANN implemented based on the seven models. Items falling within the scope of ANN size < 4 and Accuracy > 0.9 were extracted. Using the simple accuracy verification, the study verified through video classification that the overall, theoretical, and experimental prediction accuracy values are close through matching. Therefore, the prediction effect can be achieved by using the clicking records of certain course videos (such as theoretical and experimental ones) instead of the whole data set.
Therefore, through the inference and prediction mechanism, this study analyzed the behavioral patterns and features of students’ video browsing behaviors to determine the correlation between the video viewing behavior and learning outcomes, understand the features of students’ learning behaviors with good or poor learning outcomes, and make predictions, which will provide a reference for teachers, so that teachers can implement tutoring measures in a timely fashion for students with poor learning outcomes and the course completion rate can be improved. As for future work, we will continue to analyze different types of courses and those on the other MOOC platforms. It will also be useful to study the effect of improving course completion rates.


