1. Introduction
Improvement of social skills in social groups is considered crucial for achieving personal and team-based objectives. An important parameter denoting social status of a group is social cohesion. The current study focused on the evaluation of the effectiveness of an emotional education intervention approach targeting peers’ social competencies through the continuous measurement of the group cohesion. Group cohesion was selected as a strong indicator since its improvement has been linked by several studies to a range of positive effects. For instance, positive effects on motivation [
1], performance [
2], member satisfaction [
3], member emotional adjustment [
4], and the pressures felt by the member (theory of groupthink) are reported in existing studies.
Prior to delving into details regarding the main objectives and specificities of the current study, we consider it meaningful to provide a definition of the social cohesion indicator, given that it has multiple interpretations and has been a topic of long-term interest in sociology and psychology as well as in mental health and more recently in public health. Moreno, Festinger, Back, Janis and Carron are some of the investigators who have put the foundations of cohesion in social science [
5]. While researchers have reliably agreed over time that attraction to the group is an important element of group cohesion (from Festinger, Schachter, and Back in 1950, to Chiocchio and Essiembre in 2009) [
6,
7], the exact dimensionality of cohesion continues to be a source of debate. In the current manuscript, we focus on the definition provided by Carron [
8], according to which cohesion may be defined as “a dynamic process that is reflected in the tendency for a group to stick together and remain united in the pursuit of its instrumental objectives and/or for the satisfaction of member affective needs”.
One way to measure social cohesion is through the adoption of sociometric techniques. Sociometric procedures have very high levels of reliability and validity and may be powerful predictors of future social outcomes [
9]. Upon appropriate planning and support by specialized personnel, they can be easily applicable. In this study, sociograms and sociometric analysis were used to operationalize the construct of cohesion among a group of third grade primary school pupils. The applied commonly used technique is the peer nomination approach, originated from Moreno (1934). Children name classmates who fit a particular sociometric-oriented criterion while nominations may be based on positive or negative criteria.
In the current paper, an emotional intervention approach in a primary public school in Spain is detailed, where sociometrics were used as the main evaluation tool. The approach consisted of a set of steps focusing on evaluation of the initial status of social skills of the group and their emotional intelligence traits, used for the planning and realization of a set of targeted and continuous emotional intervention activities for improving social cohesion during the lifetime of the half-scholar year. Sociometric feedback collected per intervention phase was used for planning of the upcoming phase.
Two main hypotheses were examined, the first one claiming that improvement on social competences of a group of students ameliorates the social cohesion of the group, and the second one claiming that the use of sociograms as an instrument of quantifying the intervention and providing continuous feedback about participants interactions improves the effectiveness of the intervention, leading to higher social cohesion.
The design of the emotional intervention activities was based on the theoretical framework of emotional education of Bisquerra [
10] who defined emotional competence as a set of knowledge, capacities, abilities and attitudes that are necessary to understand, express and regulate in a proper way emotional phenomena. According to the adopted theoretical framework, emotional competences are expressed as five dimensions: emotional consciousness, emotional regulation, emotional autonomy, social competences and competencies for life and wellbeing. All emotional intervention activities realized during the current study were structured upon a set of micro-competences derived by the social competences dimension of the adopted theoretical framework.
The effect of the emotional intervention in a social group on the overall group sympathy, the social structure and the mutual elections among the group members is presented. It can be claimed that such parameters can be considered as interrelated, since upon configuring the proper intervention setup, it is shown that the emotional characteristics of a social group can be improved. Furthermore, a set of guidelines and lessons learnt are provided, targeting at supporting the replication of such an intervention in wider social groups in the future. Exploitation of the capabilities provided by ICT technologies for facilitating the work of a social scientist are highly considered and promoted through the presented approach.
The structure of the manuscript is as follows:
Section 2 summarizes existing work on the era as well as the provided contributions of the current study with regards to the state-of-the-art analysis.
Section 3 details the emotional intervention design and implementation, while, in
Section 4, the evaluation results and lessons learned from the application of the proposed approach are presented. Finally,
Section 5 concludes the manuscript with a set of summary results, limitations faced during the research work and main open issues for future work.
2. Related Work
Sociometric and peer assessment methods have been used for over 75 years since Moreno [
11] designed the procedure. Peer sociometric data are used and evaluated in various domains—especially in schools—leading to insights with regards to information related to social acceptance and rejection by peers, person’s social behaviors such as aggression, withdrawal, and leadership and other characteristics such as mood and peer group experiences (e.g., loneliness and victimization) [
12]. Moving one step further, emotional intelligence as a term and a set of characteristics has been mostly introduced since the late 1990s and has been studied in a series of scientific works [
13,
14,
15].
Given the significance of both domains for our study, in the current section, we provide a state-of-the-art analysis, focusing on their combination with the objective of improving a social group cohesion while in parallel satisfying the well-being of all the group participants.
2.1. Sociometric-Oriented Approaches
Even though sociometric techniques are mostly used in the educational domain, their applicability and investigation to a variety of domains reveals their potential as a ubiquitous methodological approach for better understanding social structures.
Sociogram techniques can be used as the basis for many data mining processes, upon which real world problems can be solved or emulated. In [
16], the authors proposed the Multiple Team Formation Problem (MTFP) as a mathematical programming model for maximizing the efficiency understood as the number of positive interpersonal relationships among people who share a multidisciplinary work cell. To this end, the “sociometric matrix”, one of the main tools for psychological analysis devised by Moreno, is used as the main input of the problem because it provides an excellent quantitative vision of how each potential group member perceives and is perceived by his/her fellow peers within a multidisciplinary group. Some features of sociograms have proven to be strongly related to the performance of groups. In the same direction, in [
17], a reverse engineering approach is proposed where the prediction of sociograms can take place according to the features of individuals. In the validation data of this study, the resulting simulated sociograms are similar to the real ones in terms of cohesion, coherence of reciprocal relations and intensity. In another context [
18], sociometrics are used for understanding how cyber defense teams are organized and leads to coordinating and working together to mount and conduct an effective cyber defense.
Teaching strategies have also been proven to influence the academic performance of students, while group sociometrics can be really valuable for design of appropriate strategies, since they have been proven to be directly related to group performance and cohesion. In [
19], a detailed technique that predicts the influence of a new teaching strategy on group sociometrics is proposed. The proposed approach simulates existing teaching strategies and compares the produced sociograms with the corresponding real sociograms reported in the literature, revealing that these are quite similar to the real cases. Sociograms and sociometric analysis have been also used to operationalize the construct of friendship among children. The lack of consensus on how to operationalize the friendship construct has limited our understanding of the role of friendship in social adjustment. The study in [
20] directly compares the psychometric properties (i.e., number of friendships identified, concordances, and stability) of the five major different definitions of friendship used in the literature. Each of the five definitions have been materialized with specific definitional criteria. In [
21], sociometrics are applied to examine the interactions of anxious solitary (AS) children considering their behavioral characteristics. Results reveal that agreeable AS children demonstrate significantly superior relational adaptation relative to other AS children, whereas normative, attention seeking–immature, and externalizing AS children demonstrated increasing relational adversity. Attention-seeking–immature AS children engage in particularly high rates of directed solitary behavior and are most ignored by peers. Externalizing AS children are most often victimized by peers.
The contribution provided in [
22] focuses on usage of sociometrics for social network analysis. Sociometrics and human relationships are used for analyzing social networks to manage brands, predict trends, and improve organizational performance. Sociometrics are also applied for discovering, describing and evaluating the social status and structure in sports groups as well as measure the acceptance or rejection felt between such groups [
23]. Subjects within a sport group are usually asked to pick members that they like or prefer working with or choose their leader or other variables depending on the context. The study in [
23] evaluates the connections within a school sports team and identifies affinities, mutual choice or rejection between students. These relationships can reveal school group dynamics and the structure and hierarchy of students in a sport group. Based on the provided results, the group cohesion (whether a group is united or divided), group preferences for the team captain or other social problems in the group have been evaluated while ways for improving group cohesion and stimulating positive behaviors have been formulated.
Considering the aforementioned studies, it can be claimed that sociograms applicability is wide enough and abundant in multidisciplinary domains. Results made available in per domain studies can prove very helpful towards the application of similar methods in other domains that possibly share similar group characteristics.
2.2. Group Cohesion Evaluation
While the concept of social cohesion is intriguing, it has also been frustrating, since the existence of multiple definitions prevent its meaningful measurement and application [
5]. There has been much theoretical and empirical research on social cohesion in both sociology and social psychology. A review of key studies of the concept from the late 19th century to the early 21st century shows that they seem to cluster around three methodological approaches: empirical, experimental, and social network analysis [
5]. Empirical studies provide great observations (Gustave Le Bon [
24], Sigmund Freud [
25]) about the hypnotic influence of crowds towards their members but lack a method for checking and extending these observations. From the early- to mid-20th century experimental, studies of social cohesion flourished. The major representative of the experimental approach is Moreno who invented sociometry, a quasi-quantitative technique that measures the degree of relatedness between people. Social network analysis (21st century) is building on top of the experimental analysis, putting emphasis on the structural cohesion in terms of sets of relationships rather than sets of individuals. Social network analysis also analyses the concept of perceived cohesion as an aspect not considered in at the experimental approach. Under this perspective, the current study focused at the social network analysis approach taking under consideration a set of definitions in well-known social science works, as shown in
Table 1. It is worth mentioning that the definitions proposed by the Council of Europe as well as by the Organization for Economic Co-operation and Development (OECD) are considered as the most widely used definitions today [
26].
Considering the aforementioned definitions of social cohesion, the current study adopted the definition provided by Carron and operationalized Arruga’s method (1997) [
32]. Arruga’s method is based on analyzing the responses of the group members to a sociometric questionnaire.
There are three techniques of composing a sociometric questionnaire. Peer ratings and peer nominations are the two main techniques employed to evaluate pupils’ social relationships, while cognitive mapping is the third one. Generally, peer ratings are used to ascertain the level of acceptance pupils enjoy within their class network and peer nominations are used to determine pupils’ social status [
33]. The peer nomination approach originated by Moreno (1934) has been the most commonly used sociometric technique. It requires children to name classmates who fit a particular sociometric criterion. Nominations may be based on positive criteria as well as negative criteria. An alternative sociometric technique is the “peer-rating” method, which asks pupils to rate all their classmates’ likeability on a Likert-type scale, rather than nominate a limited number of “liked” or “disliked” peers. Typically, a questionnaire is administered containing a register of all members of a class followed by a question requiring all pupils to indicate the degree of preference for spending time or working with each one of their fellow-pupils.
A third technique is the so-called social cognitive mapping (SCM) developed by Cairns and his collaborators [
33]. The technique obtains information about the nature of social networks and the relations among peers within a class by asking pupils the question “Are there any pupils in your class who hang around together a lot? Who are they?” Responses are aggregated to generate a composite social map of the class. Therefore, in the SCM approach individuals provide information about social clusters beyond their own immediate set of friends, resulting in the identification of all peer groups in a particular network. This makes it possible to determine if a pupil is a member of a group and with whom it affiliates, the number of peer clusters and the centrality of each cluster within the class network, and the centrality of each individual in its peer cluster. The SCM approach is based on the premise that children are expert observers of the peer clusters in their classrooms and can provide reasonably convergent information about these.
In this study, the peer nomination technique was used to formulate the initial sociometric questionnaire. Apart from being the most widely used technique, peer nomination is followed up by a systematic and clear statistical analysis method proposed by Arruga. Furthermore, it is semi-supported by open source software sociometric tools that facilitate the data meta-analysis, making it transparent and less-time consuming. Such features are in line with the objectives of our study, since we focused on the impact of emotional education interventions on social cohesion. The adopted social cohesion calculation model in the current study is presented into detail in
Section 3.1.
2.3. Emotional Intelligence Theories in Education
Emotional Intelligence (EQ or EI) is a term proposed by Salovey and Mayer and popularized by Goleman in his homonym book [
13] in 1996. Based on them, “Emotional Intelligence is defined as the ability to recognize, understand and manage our own emotions and recognize, understand and influence the emotions of others. In practical terms, this means being aware that emotions can drive our behavior and impact people (positively and negatively) and learning how to manage those emotions—both our own and others—especially when we are under pressure” [
13]. There are several proposed models, each one focusing on specific aspects and definition of the emotional intelligence construct. Three of the more representative models are briefly presented as follows.
The emotional intelligence capacity model [
14] is the first approach given by Salovey and Mayer and is structured in four interrelated branches: emotional perception, emotional facilitation of way of thinking, emotional comprehension and emotional management. This model is known as an ability model given that is focusing at the capacities of the persons. For example, there may be a person that has a high capacity of emotional intelligence but does not put it into practice. The Goleman model, the most widely disseminated model, introduces a distinct model of emotional intelligence and puts emphasis on the following aspects: self-awareness, self-regulation, self-motivation, empathy and social skills. The trait model of Petrides and Furnham [
15] is configured as a personality trait that integrates four factors: well-being, emotionality, sociability and self-control. Petrides approach is different from the Salovey and Mayer approach, since the latter examines mostly intelligence aspects, while the Petrides approach examines mostly what we understand as personality. It can be argued that the emotional intelligence is in the middle of the personality and the intelligence aspects. Depending on where our understanding leans, different models are emerged.
Even though many questions are still pending among theoretical scientists with regards to emotional intelligence, there is lot of evidence about the importance of prioritizing the acquisition of emotional competences at all educational levels. Bisquerra (2007) [
10] developed a model about emotional competences that can be resumed at five dimensions: emotional consciousness, emotional regulation, emotional autonomy, social competence, and competences for life and well-being. The model of emotional competences is based on the emotional intelligence but also goes beyond by including new aspects such as the positive psychology. It is a very flexible model and open to incorporate new elements. Research following the emotional competences model has shown that investing in the development of competences has highly positive consequences in multiple situations such as effectively resolving conflict situations [
34], improving interpersonal relationships [
35], persevering in a task until it is completed, better facing the challenges of life [
36], preventing conflicts [
34], etc. Having good emotional competences does not guarantee that they are used for good and not bad purposes. This is why the development and training about emotional competences should be always be followed by some ethical principles.
The emotional competencies model of Bisquerra is structured in five dimensions. Each dimension is subdivided in more concrete components, as presented at
Table 2.
In this study, all emotional interventions were focused on training the social competences dimension of the emotional competencies model of Bisquerra, considering that strengthening social competence acts towards increased social cohesion [
37,
38]. This model was selected thanks to its simplicity, the abundant set of activities that proposes and its clear focus on educational aspects. Prior to the design and implementation of the emotional training activities, pupils answered the TEI_QUE CSF (Trait emotional intelligence questionnaire simple form) Petrides questionnaire [
39], as detailed at
Section 3.
3. Materials and Methods
Considering the aforementioned approaches and theoretical background, in this study, focus was given on educational aspects, trying to examine the concrete effect of the design and application of sociometrics-aware teaching strategies in social cohesion. The presented study was based on an intervention realized over third-grade students in a public primary school in Spain. An experimental and a control group was formulated for comparison purposes.
Petrides trait emotional model was used to identify the emotional profile of the experimental and control group, while a set of activities was designed and implemented based on the emotional competencies model of Bisquerra. Sociometrics and more concretely the mathematical statistical analysis proposed by Arruga was used to control the initial, intermediate and final level of social cohesion of both groups.
Apart from observing the changes in the group cohesion levels, several indications for changes in the cohesion of a group were identified, following relevant work in the literature. Moreno, father of psychodrama, sociometry, group psychotherapy, psychodrama, and sociatry, mentioned a set of indications for identifying a marked change in the cohesion of the group to map social structure changes with group cohesion growth [
11]. The present study adopted the most applicable of them and combined them with some emotional profile indexes.
The group cohesion is augmented when after the end of a set of emotional training activities the number of mutual rejections is reduced, the number of isolated members is reduced (ideally it comes to zero), there is no rejected member compared to the initial or a previously created sociogram and the number of higher social structures have increased. In sociometry, the term “dyad” is used to denote a friendship between two persons while the term “clique” is used to refer to groups of three or more peers. Higher social structures refer to “cliques” that are mutually selected and contain more than two members. Another feature that was considered to correctly interpret the group cohesion index fluctuation is the distribution of attractions and rejections within the group.
Following the aforementioned indications about how to map social structure changes with group cohesion growth, a set of linear regression models was formulated and examined. In such models, the group cohesion index was used as a dependent variable while the dissociation index, as defined above; the number of mutual elections and mutual rejections; the high social structures (triangles, square and so forth), the number of stars, rejected, forgotten, sympathetics, antipathetics and controversials; and all the emotional dimensions calculated by the TEI_QUE CSF were used as independent variables.
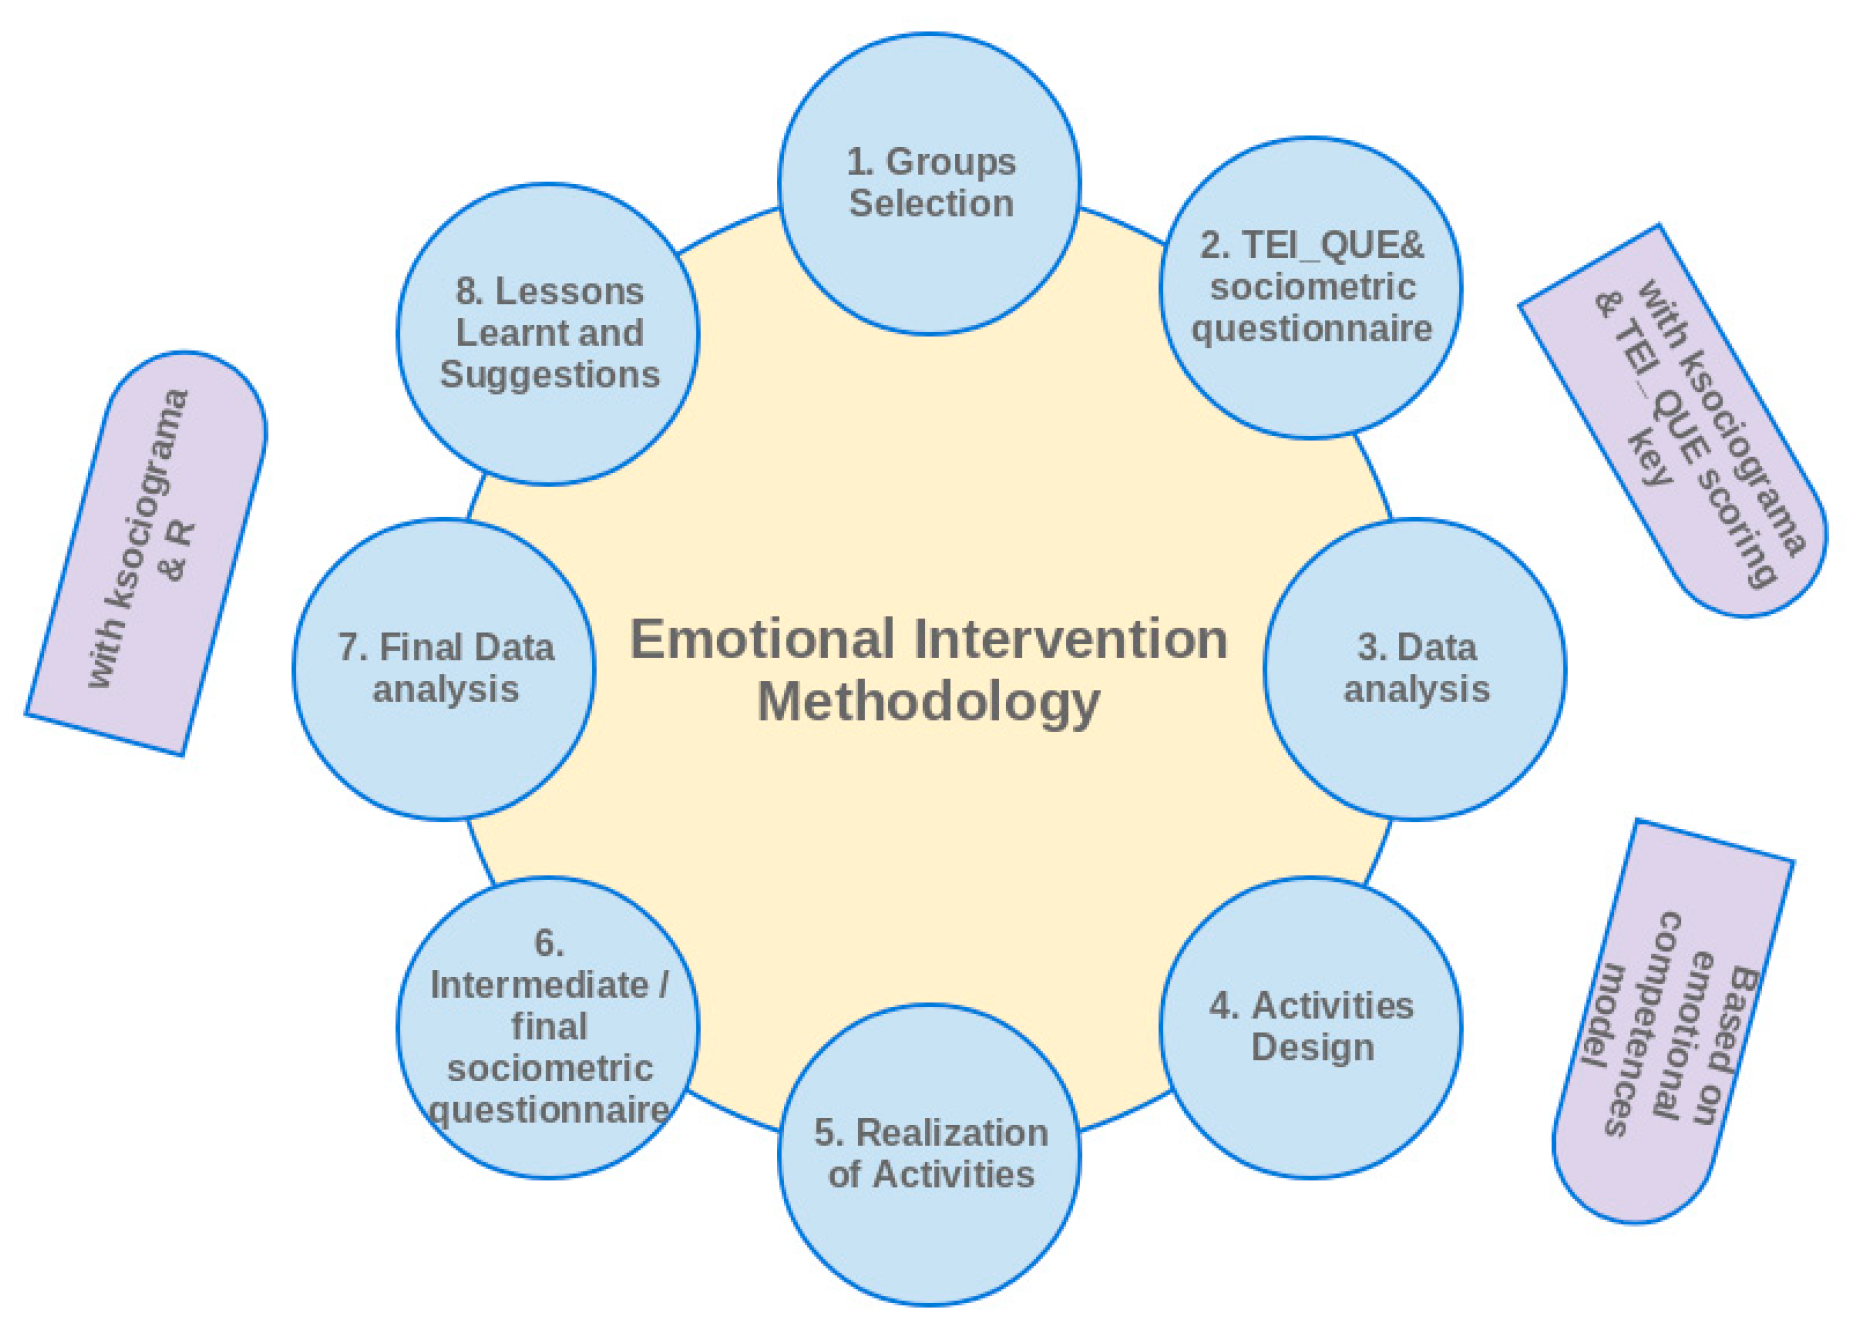
In the following, the step-by-step methodology followed for the applied emotional intervention (see
Figure 1), as it was designed and implemented at the school environment along with the adopted social cohesion model calculation, is presented. The methodology included steps for the formulation of the experimental and control groups; the completion of the TEI_QUE and the sociometric questionnaire by both groups; the analysis of the questionnaires’ results, the design of the set of activities to be realized based on the identified emotional needs of the experimental group; the realization of the designed activities; the collection of feedback from the pupils along with data from intermediate sociometric questionnaires’ responses aiming at the design and implementation of the next cycle of educational activities; the design of the new set of activities and their continuous evaluation; the completion of the final sociometric questionnaire; the realization of the final analysis and the production of set of analytics; lessons learnt and suggestions.
Figure 1 depicts the set of aforementioned steps, focusing on a continuous evaluation and follow-up activities design approach.
3.1. Social Cohesion Calculation Model
As stated in
Section 2, in this study, we adopted the peer nomination technique, while we applied the Arruga’s methodology for evaluating the social cohesion of the group. During this process, pupils were asked to choose classmates to carry out some leisure activities [
32]. Information about the social perception of the pupils was also gathered by adding some extra questions at the sociometric questionnaire. Specifically, the following questions were posed: Which three boys or girls from your class are the ones you would choose for doing an excursion with (aiming to capture the participants elections)? Which three boys or girls from your class are the ones you would not choose for doing an excursion with (aiming to capture the participants rejections)? Which three boys or girls from your class do you think they would select you for doing an excursion with (aiming to capture the participants perception upon possible elections)? Which three boys or girls from your class do you think they would not select you for doing an excursion with (aiming to capture the participants perception upon possible rejections)?
Based on the pupils’ responses, the relevant sociometric matrix was built. By processing the raw data obtained from the selections and rejections stated by the pupils, sociometric indexes were produced per pupil and per group. These indexes determined the position of each person within the group as well as the overall group sociometric indexes.
Table 3 details the symbols, concepts and significance of the main sociometric indexes that are used in the subsequent data analysis.
The processing of the direct sociometric indexes presented above led to the production of compound sociometric indexes (e.g., the Association Index in
Table 4 was produced based on the sum of the reciprocal elections of each member of the group). The compound sociometric indexes can be classified into two groups: the individual ones, which refers to the individuals within the group, and the group oriented, which refers to the structure of the group.
Table 4 shows the symbol, concept, significance and formula used to calculate the main compound—individual and group—sociometric indexes.
In this study, social cohesion was calculated based on the following group compound sociometric indexes: cohesion index, association index and dissociation index (as they are presented in
Table 4). The index of association (AI) and dissociation (DI) refer to the existing cohesion within a group and measure the structural strength level of the group based on the provided elections, rejections, reciprocities and opposition of feelings among the group members. These indexes are inversely proportional. The group will be more cohesive as the AI gets closer to 1, and the DI gets closer to 0. The cohesion index (CI) helps to understand the relationship between the reciprocal relationships existing in the group and the elections made. Its values vary from 0 to 1, where 1 refers to a totally coherent group and 0 to a non-coherent group [
40]. Since peer nominations were limited to three in the intervention, the social intensity (SI) index was not considered as a strong indicator for evaluating the cohesion status of the experimental and control group.
In this study, we observed the three indexes (AI, DI and CI) prior, during and upon the emotional interventions for both the experimental and the control group using as baseline the initially calculated cohesion levels. It can be argued that any changes in these three indexes that were due to the implemented emotional intervention. Such an interpretation was combined with relevant information coming from extra sociometric and emotional profile indexes, as provided through the overall statistical analysis realized upon the intervention that is detailed in the following sections.
3.2. Participants
The group selection regards the formulation of a control and an experimental group, both consisted of pupils of a public school in Cataluña, Spain. The experimental classroom had 25 8-year-old pupils (13 girls and 12 boys) and the control group had 26 pupils of the same age (13 girls and 13 boys). It should be noted that the synthesis of the experimental group had concerned the school direction, due to high frequency of conflicts within the group and the constant group’s attention disruption during the classes. Both groups attended regular sessions of emotional education activities, since the specific school officially adopted educational practices that facilitate increase of emotional awareness of the students, putting into practice techniques that promote the well-being, leadership and self-esteem, social tying and conflict resolution in a positive way. In our case, the experimental group had the possibility to get extra sessions of emotional education, adapted to the students’ needs.
Following the groups formulation, pupils answered the TEI_QUE CSF (Trait emotional intelligence questionnaire in its simple form) Petrides questionnaire [
39], as one of the most known, widely used, culturally weighted and open to public use emotional intelligence questionnaires. Petrides TEI_QUE CSF is designed for ages 8–12 and requires 10–15 min to be filled in. The produced score has 8 emotional dimensions: adaptability; emotion expression; emotional perception; emotional regulation; impulsiveness; relationships; self-esteem; and self-motivation.
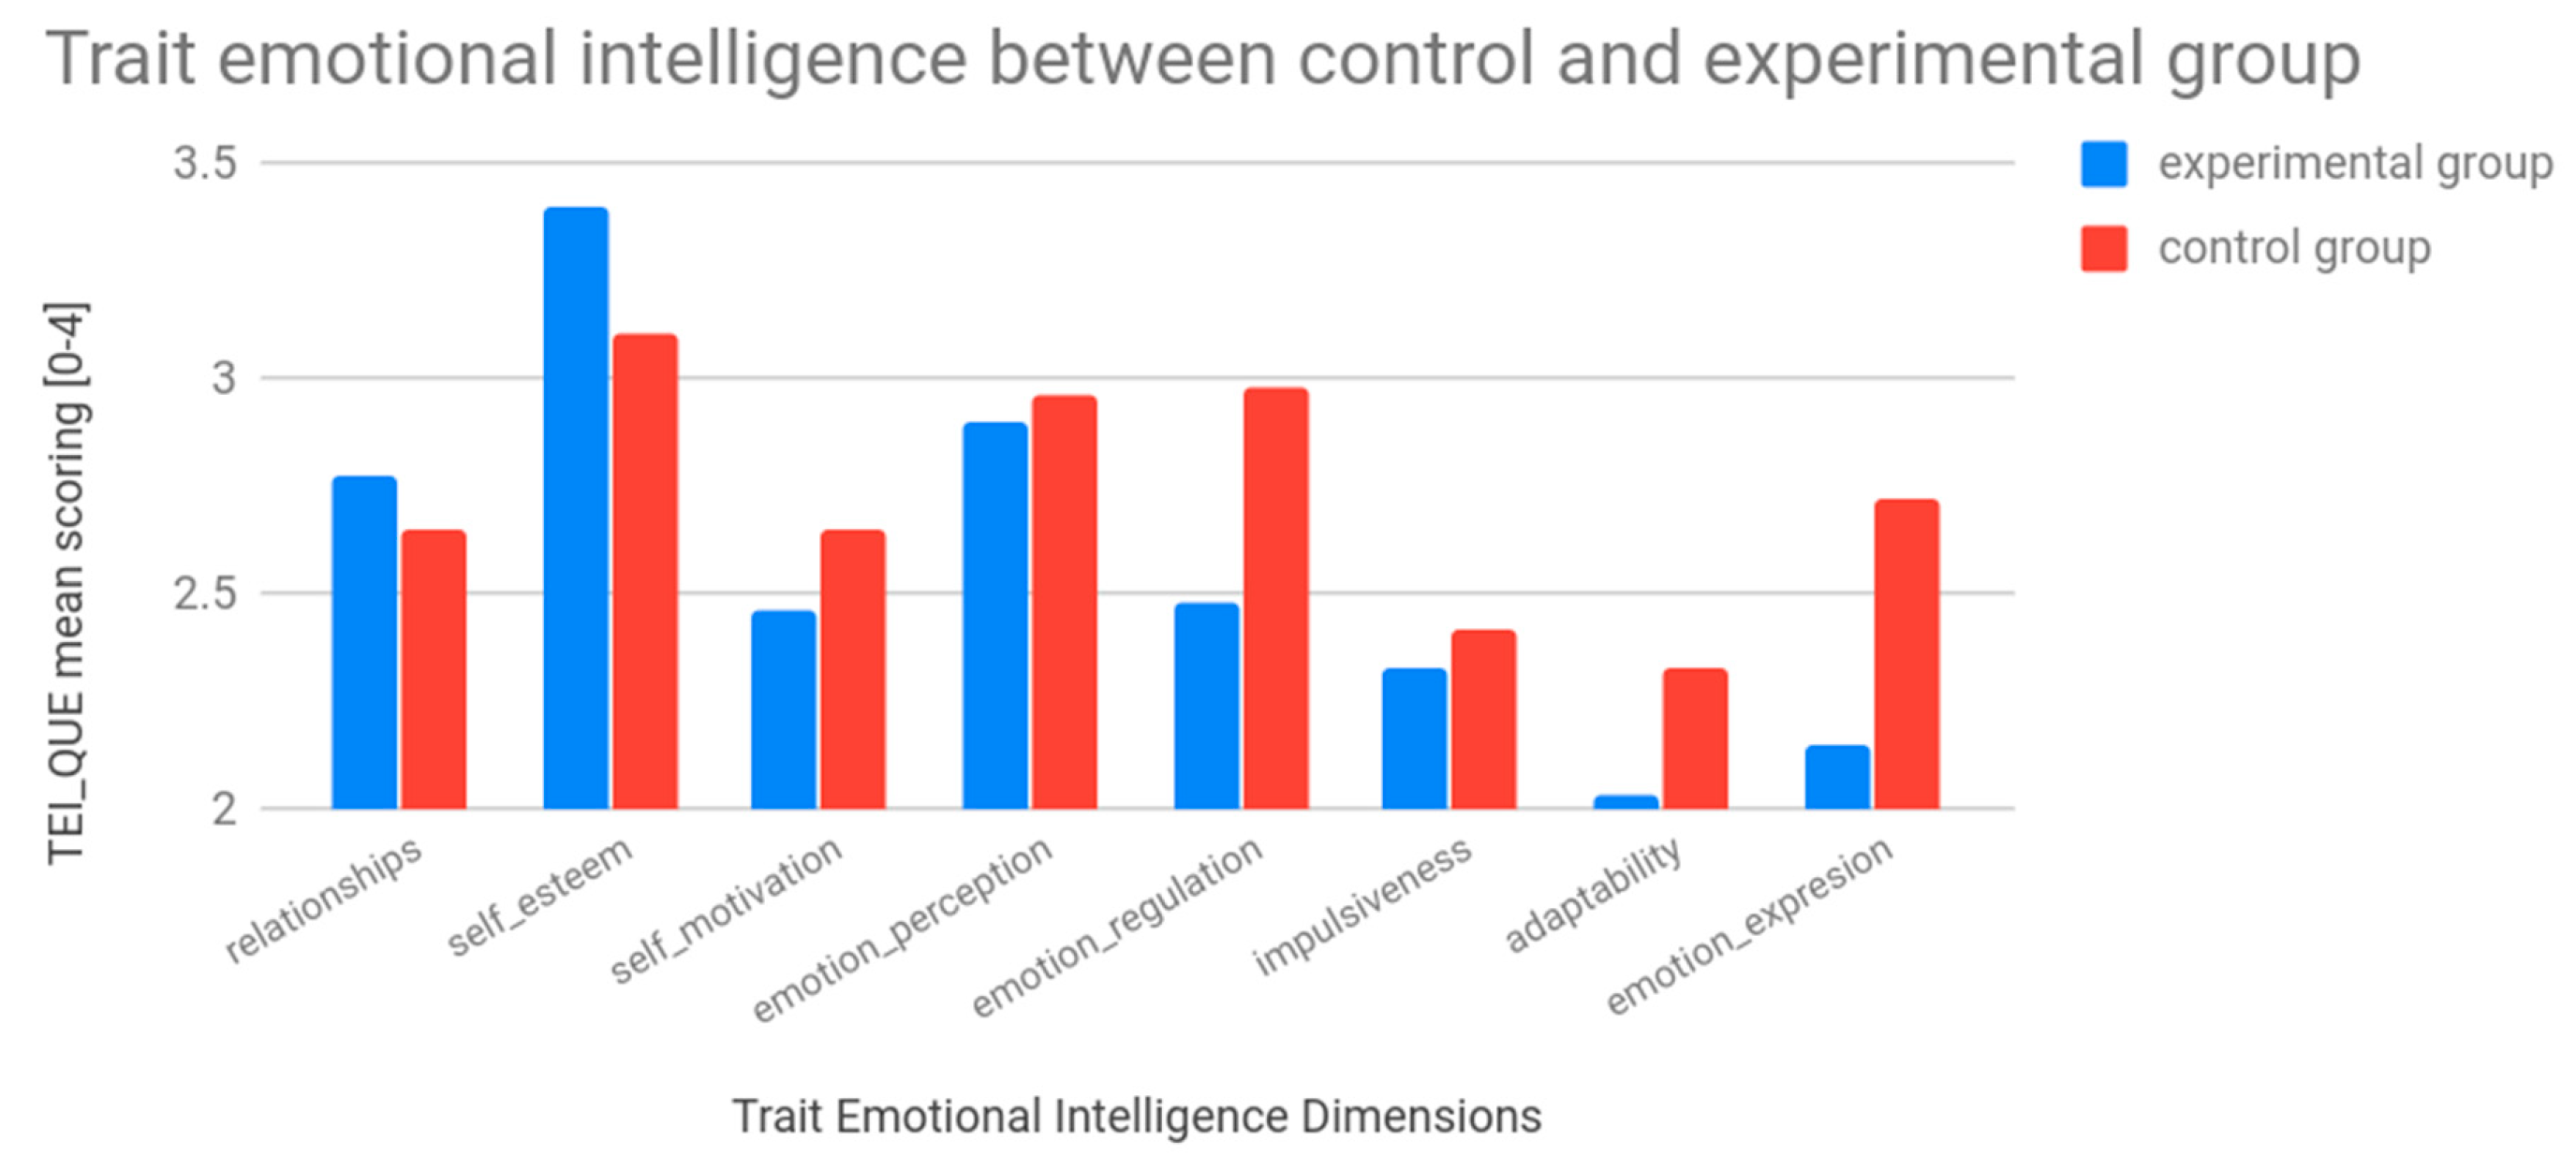
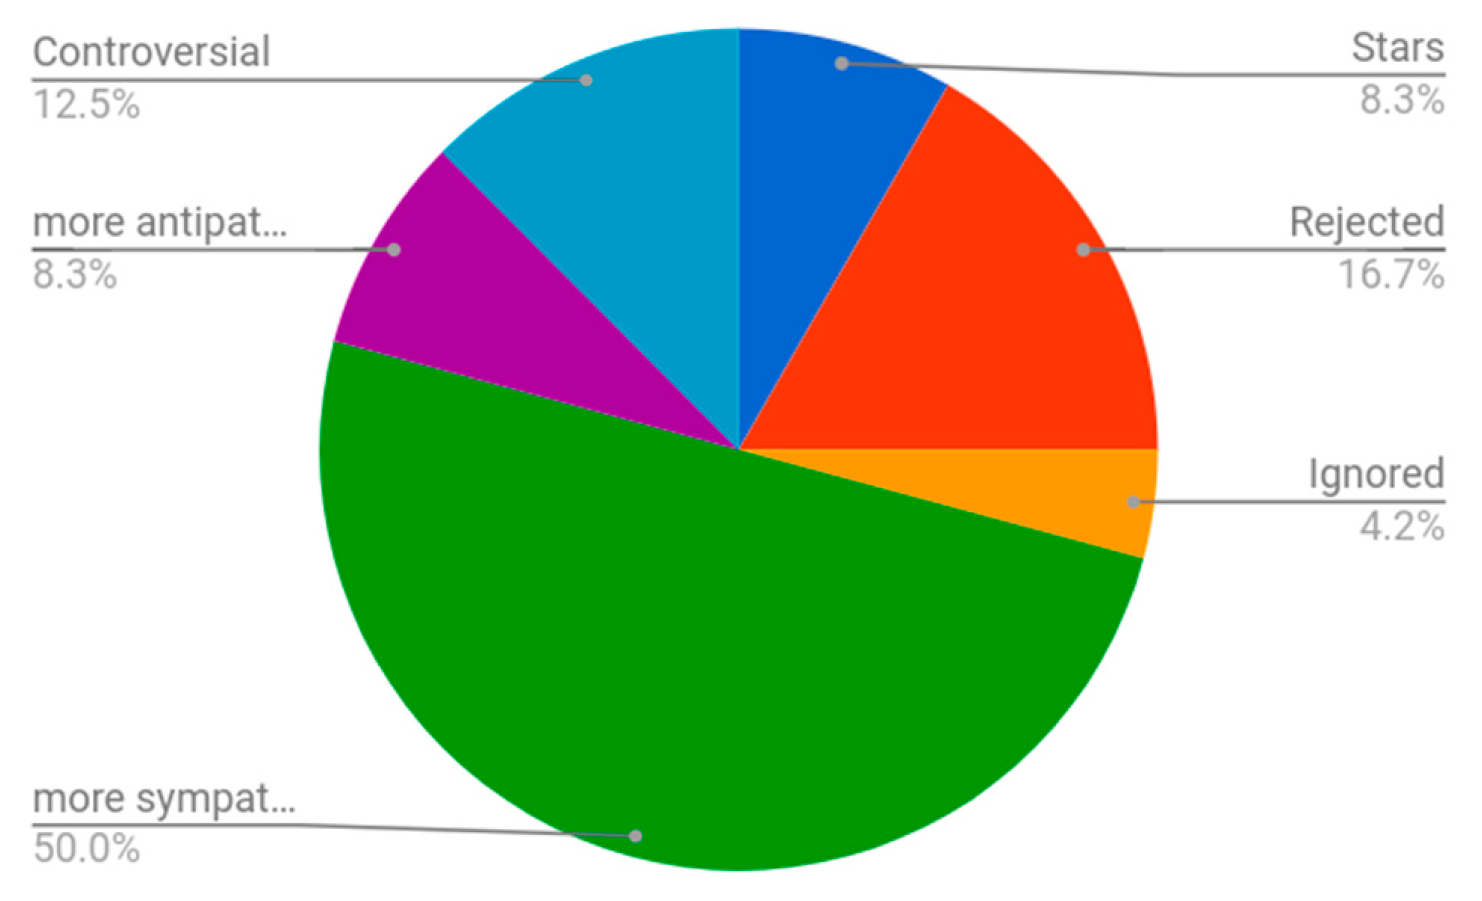
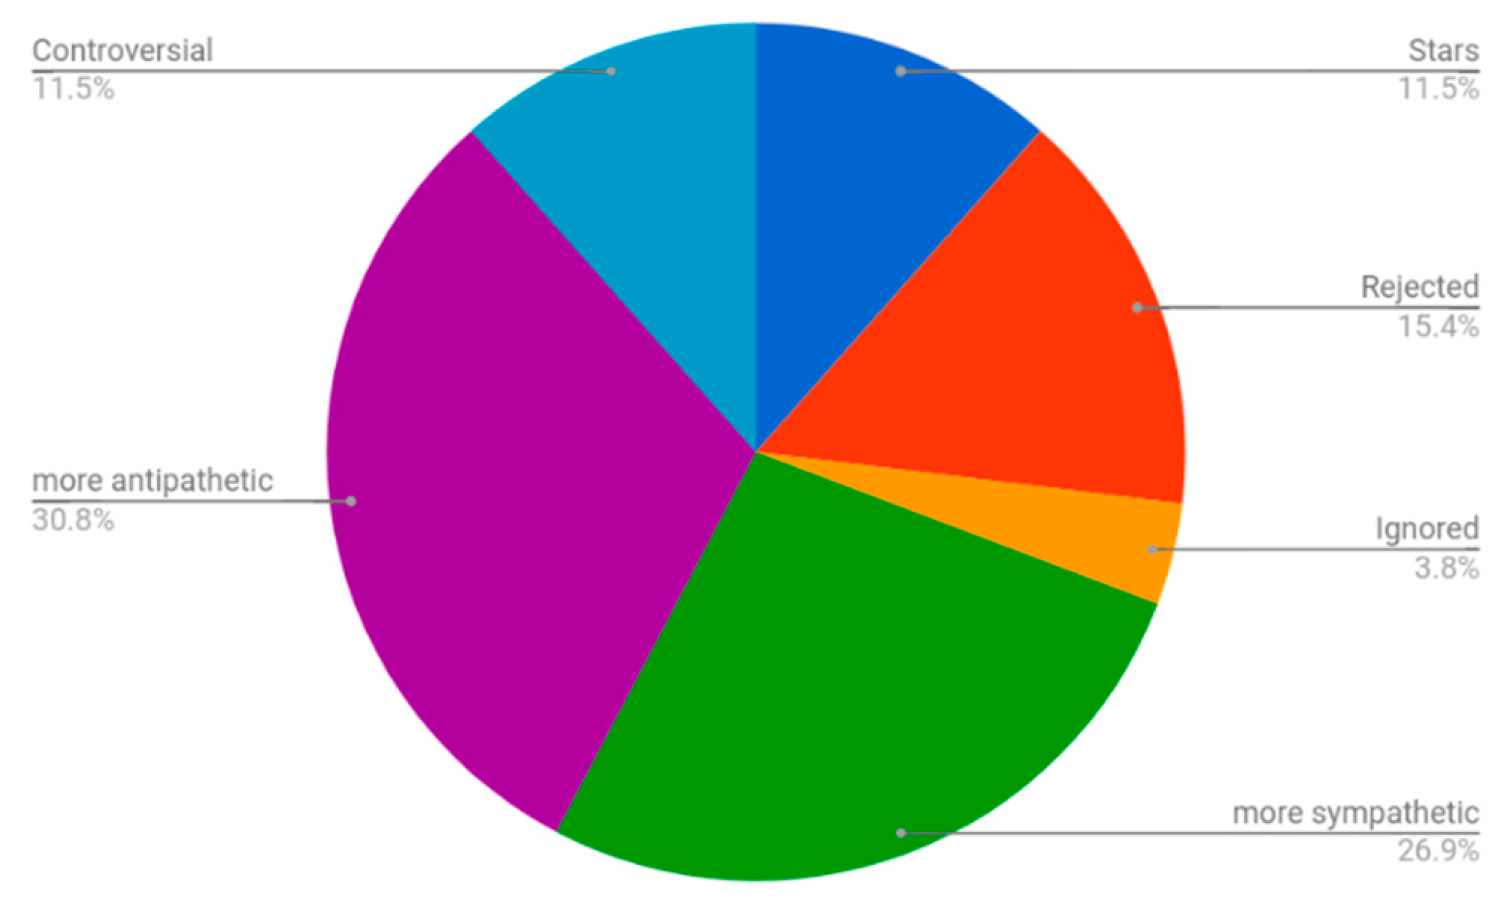
Upon providing the TEI_QUE and sociometric questionnaires to both classes, initial comparison of the results between the experimental and control group revealed specific emotional educational needs of the experimental group that were in line with the school’s observations. As depicted in
Figure 2,
Figure 3 and
Figure 4, TEI_QUE questionnaire results showed that the experimental group had lower scoring in self-motivation, emotional regulation, adaptability and emotional expression aspects than the control group, while, at the same time, it had significantly higher scoring in self-esteem. The initial sociometric statistical analysis also showed that the experimental group had a much higher level of antipathy between its members, lower sympathy levels and bigger set of rejected pupils.
3.3. Applied Methodology
Considering the initial results, a set of activities was designed with the objective of ameliorating the experimental group’s social cohesion indexes by creating positive social experiences between the peers and train them in enforcing their relationships via respectful interactions among each other. All designed activities were separated into three categories: free, neutral and interventive activities. In the free activities, participants could choose freely among themselves with whom to interact. This type of activities results in the creation of intermediate sociograms to study without having to pass explicitly a sociometric questionnaire. It is a more discreet and less-time consuming way of collecting data, while avoiding the response bias effect associated with the filling in of a sociometric questionnaire. In this study, sociometric questionnaires were used to collect data for a reliable statistical analysis, while intermediate sociograms from free activities were used only for qualitative observations and adjustments during the preparation and implementation of the realized educational activities. Neutral activities had a specific educational objective but did not result in any specific sociogram. They were mostly focused on the whole group and included multiple interactions between the group members without requirements for specific collaborations. Interventive activities also had an educational objective and were intended to increase the spontaneity and improve the quality of the interaction of the students. Peers’ matching in interventive activities was done by the educator, having in mind the social status of the group members as well as their preferences and rejections reported via the sociograms.
The first set of activities was intended to stimulate a set of social competences, namely empathy, respect and trust; group sharing of personal experiences and relevant emotions; knowledge of each other via positive ways (receptive and expressive communication); active listening; and grouped music relaxation techniques. The realization of the activities and the intermediate sociometric questionnaire analysis showed some changes at the social status of the more disadvantaged (ignored and rejected) members towards better scoring, however mutual rejections appeared to be more resistant to change. The experimental group enjoyed the outdoor activities more where practice of body language and movement characteristics was necessary. These aspects had a strong inclusion effect at the group, as some members could not communicate fluently in Spanish or Catalan language due to their origin. Considering these preliminary results as well as the feedback and preferences of the members over the realized activities, a second round of activities was designed. The second set of activities focused on the development of the cooperation capacity, the capacity to get synchronized within the group, the achievement of the group objectives, the maintenance of attitudes of kindness and respect to others (e.g., in biodanza activities), the sharing of emotions among the group members, the development of capacities for conflict resolution and emotional situations management. Upon the completion of the second set of activities, the final data analysis via ksociograma [
41] and R language [
42] ICT tools was realized, leading to the final evaluation results and the lessons learned, as presented in
Section 4.
3.4. Open-Source ICT Support
In this study, we used open-source tools for both academic and technological purposes. Open-source resources were consciously selected since they are freely accessible, supported and maintained by open-source communities and can be easily adopted by any interested party.
Towards this direction, a detailed research about open source tools was realized to select the more adequate ones. Regarding sociometric tools, even though many sociogram software creators and analyzers exist, to our knowledge, all of them have set of limitations or are not freely available. The only one that is open-source with a transparent and reliable way of calculating all its sociometric indexes is the ksociograma [
41] technical software for teachers. ksociograma supports teachers to make sociograms, based on a 2D network representation of a group of students. It is very useful to understand and predict inter-group relations. It provides an interface to fill in the questionnaire, realize the statistical calculations and produce the graphics result (sociograms), while it gives an overall view of the characteristics of the selected group. Even though ksociograma is the best solution found, it still has some limitations. It supports a limited set of responses on behalf of the students (three or five), it supports analysis by only using the peer nominations technique, and it has low portability given that it is developed on an obsolete Linux-based operating system (Ubuntu version 10.04).
Apart from the ksociograma usage, there was a need to combine the sociometric results with the emotional indexes. Comparison of the results between groups, correlation of the generated data, evaluation of the statistical significance of the results and multiple linear analysis was done using the R language [
42]. R is a programming language and free software environment for statistical computing and graphics that is supported by the R Foundation for Statistical Computing. It is widely used among statisticians and data miners for developing statistical software and data analysis.
Finally, the scoring key for Petrides TEI_QUE questionnaire is supported in the Statistical Package for the Social Sciences (SPSS) [
43]. SPSS is a software package used for interactive, or batched, statistical analysis. Long produced by SPSS Inc., it was acquired by IBM in 2009. Since a main principle of the current study was using open-source tools, PSPP was used instead of SPSS to further analyze the participants’ responses to the TEI_QUE questionnaire. PSPP is a free software application for analysis of sampled data, intended as a free alternative for IBM SPSS Statistics and supported by the GNU Scientific Library for its mathematical routines [
44].
4. Results and Discussion
In this section, the overall results produced from the intervention in the primary school in Spain along with their interpretation are provided. Initially, we provide a set of descriptive statistics related to basic evolution of the sociometric indexes of the participants as well as how their emotional traits affect and are affected by their sociometric status. Following, we examine the main hypotheses considered in this manuscript.
The comparison between the initial and the final sociometric indexes revealed an improvement tendency for both groups during the overall study, as shown at
Table 5. The second and third column compare the progress realized by each group, while the fourth column compares the change achieved in the experimental group compared to the change achieved in the control group. As an overall observation, it could be claimed that the experimental group showed better progress compared to the control group, without however the existence of huge differences. Following, detailed information about the changes noticed per sociometric index is provided.
Cohesion was improved in both groups; however, the final result was slightly better in the experimental group. An opposite trend was shown for the dissociation index, since it was slightly increased in the experimental group in comparison to slight decrease in the control group. Regarding the reciprocal elections and rejections, the experimental group had four more reciprocal elections upon the emotional intervention compared to three in the control group. Significant improvement was noticed in the construction of high social structures in the experimental group, since five more triangles among the students were created compared to one more triangle in the control group. The increase in such an index is considered very important given its correlation with the group cohesion growth, as mentioned in
Section 2.
Concerning the sociometric types of the group members, 12 students of the experimental group improved their social status compared to 10 students in the control group. For instance, it was noted that the experimental group had three more students classified as sympathetic and four fewer students classified as antipathetic upon the emotional intervention, compared to three fewer students classified as sympathetic and the same number of students classified as antipathetic in the control group. The experimental group had two fewer students classified as controversial upon the emotional intervention, while no change was noticed in the control group. Thus, it could be argued that the experimental group improved in terms of sympathy, antipathy and controversiality compared to the control group.
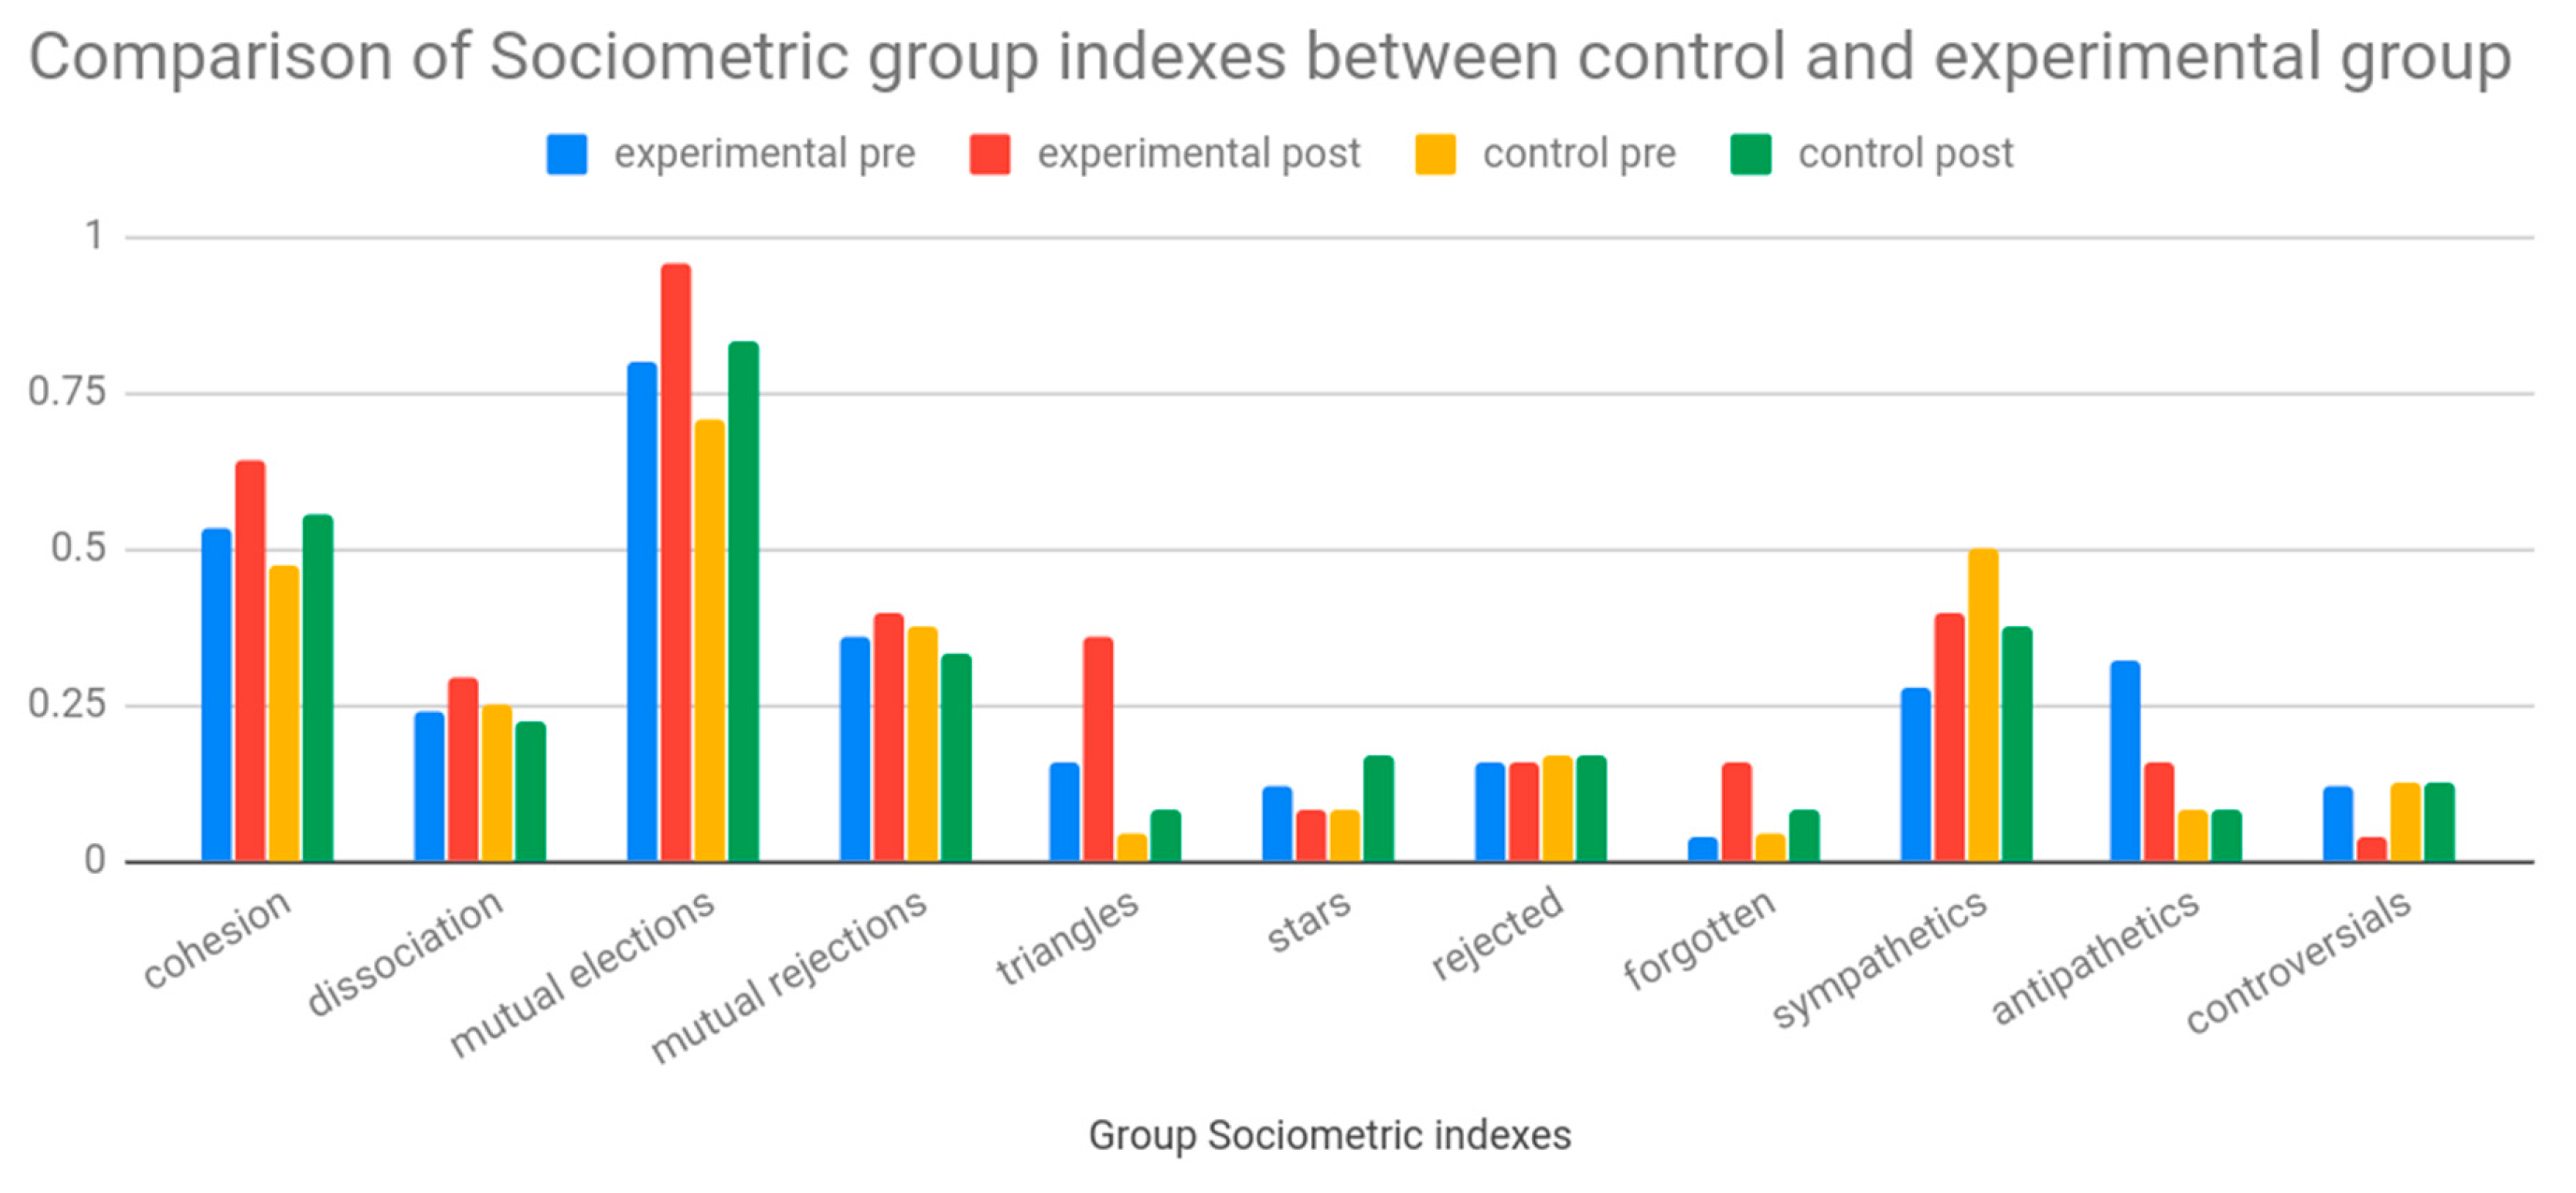
Figure 5 presents in the range of 0–1 the sociometric values for both groups at the beginning and the end of the study (based on the pre and post questionnaires). The values accord with the sociometric indexes comparison presented in
Table 5. It can be clearly depicted that—as already described—both groups tended to ameliorate their sociometric indexes, however with better results being achieved in the experimental group.
It should also be noted that the standard deviation associated with metrics in the control group was larger than the relevant values in the experimental group for almost all sociometric indexes (i.e., popularity, antipathy, affective connection, attention, perception and social status), providing hints for greater data consistency [
45] in the latter case.
Having acquired and analyzed a set of results based on data collection prior, during and after the intervention, we then examined the main hypotheses mentioned in the Introduction, related to the impact of the improvement on the social competences of a group of students to the social cohesion of the group and the impact of the use of sociograms as a teaching instrument to the effectiveness of the intervention, leading to higher social cohesion.
To examine the validity of the declared hypotheses, a set of multiple linear regression models was formulated and evaluated. In these models, the group cohesion index was used as a dependent variable while the dissociation index, mutual elections, mutual rejections, high social structures (triangles, square, etc.), number of stars, rejected, forgotten, sympathetics, antipathetics and controversials were used as independent variables. In the considered models, variables showing high collinearity were omitted. The results provide some hints about how some sociometric indexes affect the social cohesion index. For instance, it was shown that increasing the number of multiple reciprocal elections led to significant improvement of the social cohesion indexes (see linear regression results in
Table 6 where statistical significance is strong).
However, in opposition to the aforementioned result, in most cases, the produced results were not considered statistically significant (p > 0.05). This outcome was mainly due to the small sample size, given that the intervention was realized in a specific class, aiming at the validation of the feasibility and the effectiveness of the proposed approach. The realization of similar interventions targeted to extended datasets in the future is required for safer conclusions and to validate the identified trends in the current study.
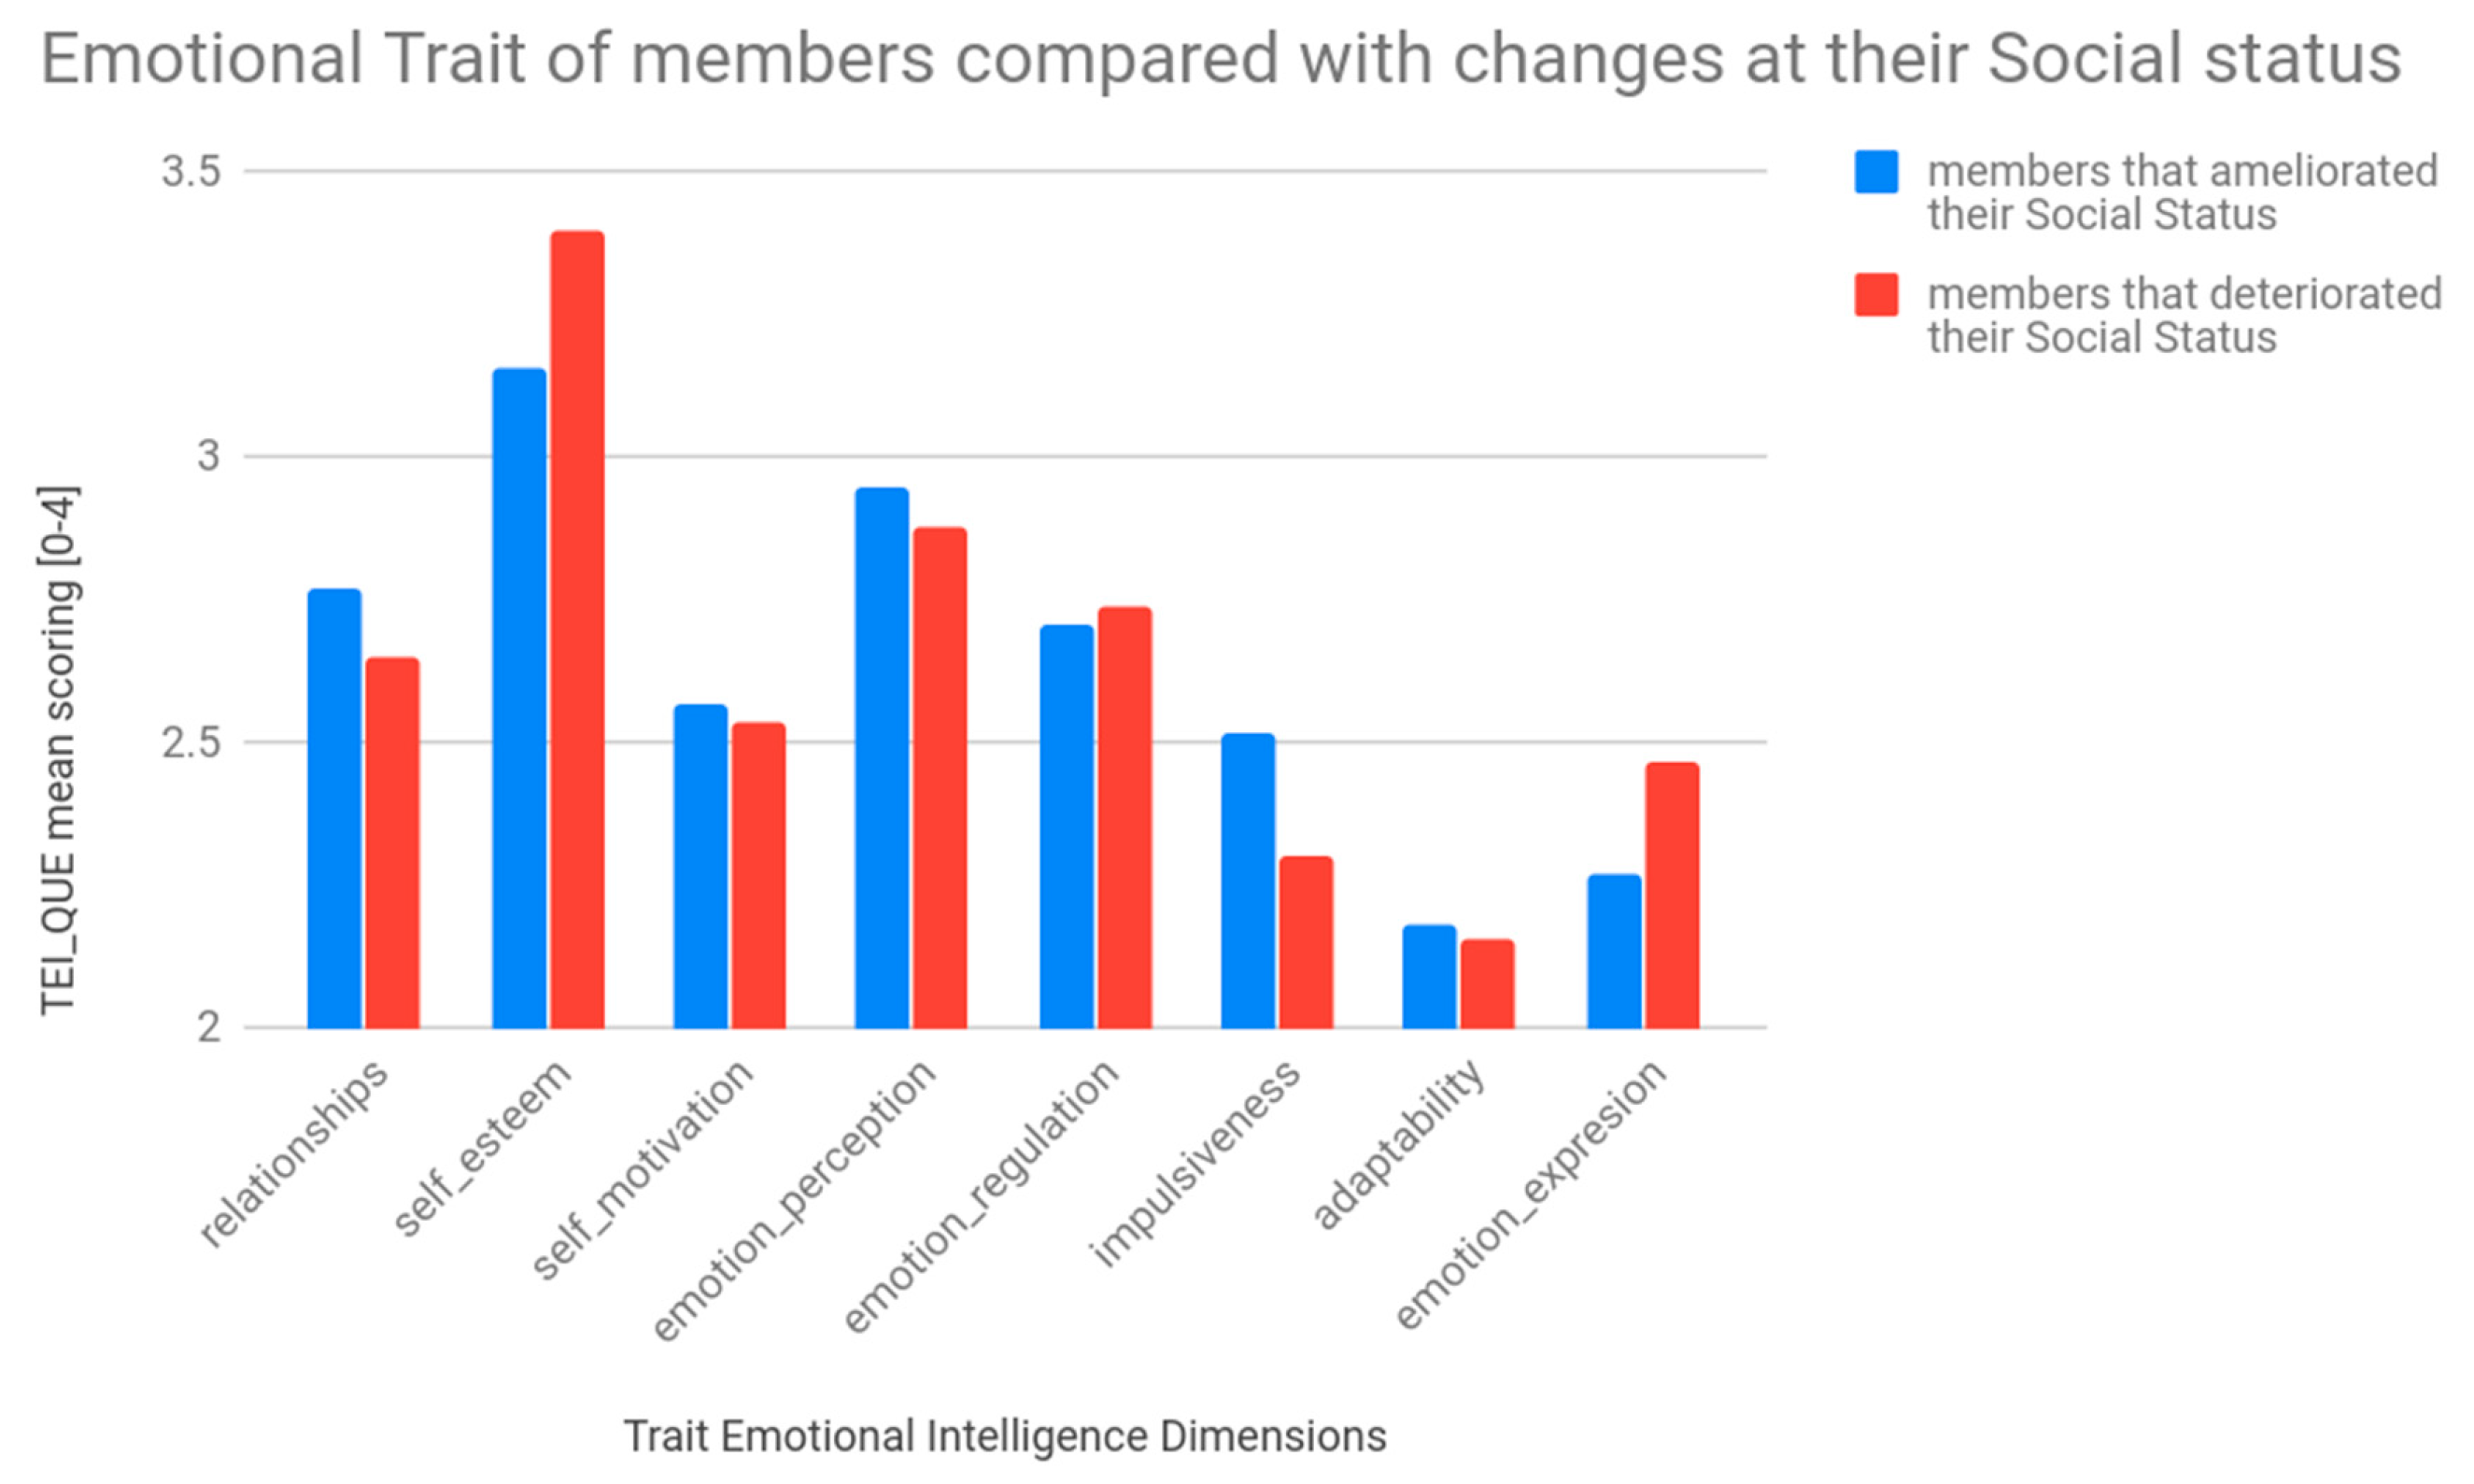
To provide further insights into the relationship among the various sociometric indexes and emotional intelligence metrics, we examined how the emotional profile of the participants affected their capacity for social change. To do so, we separated the participants group into two categories: those who during the academic year managed to ameliorate their social status or to maintain a positive social status and those who deteriorated it or maintained a negative one. Then, we compared the mean scoring values of these groups for all the emotional trait questionnaire dimensions.
Figure 6 presents the emotional trait profile between the members who ameliorated their social status and those who deteriorated it. Even though the number of participants was not big enough to generalize any observation, it seems that members with higher scoring at the relationships and impulsiveness dimensions were able to leap from a lower social status to a higher one, while members with higher self-esteem and emotional expression followed the opposite trend.
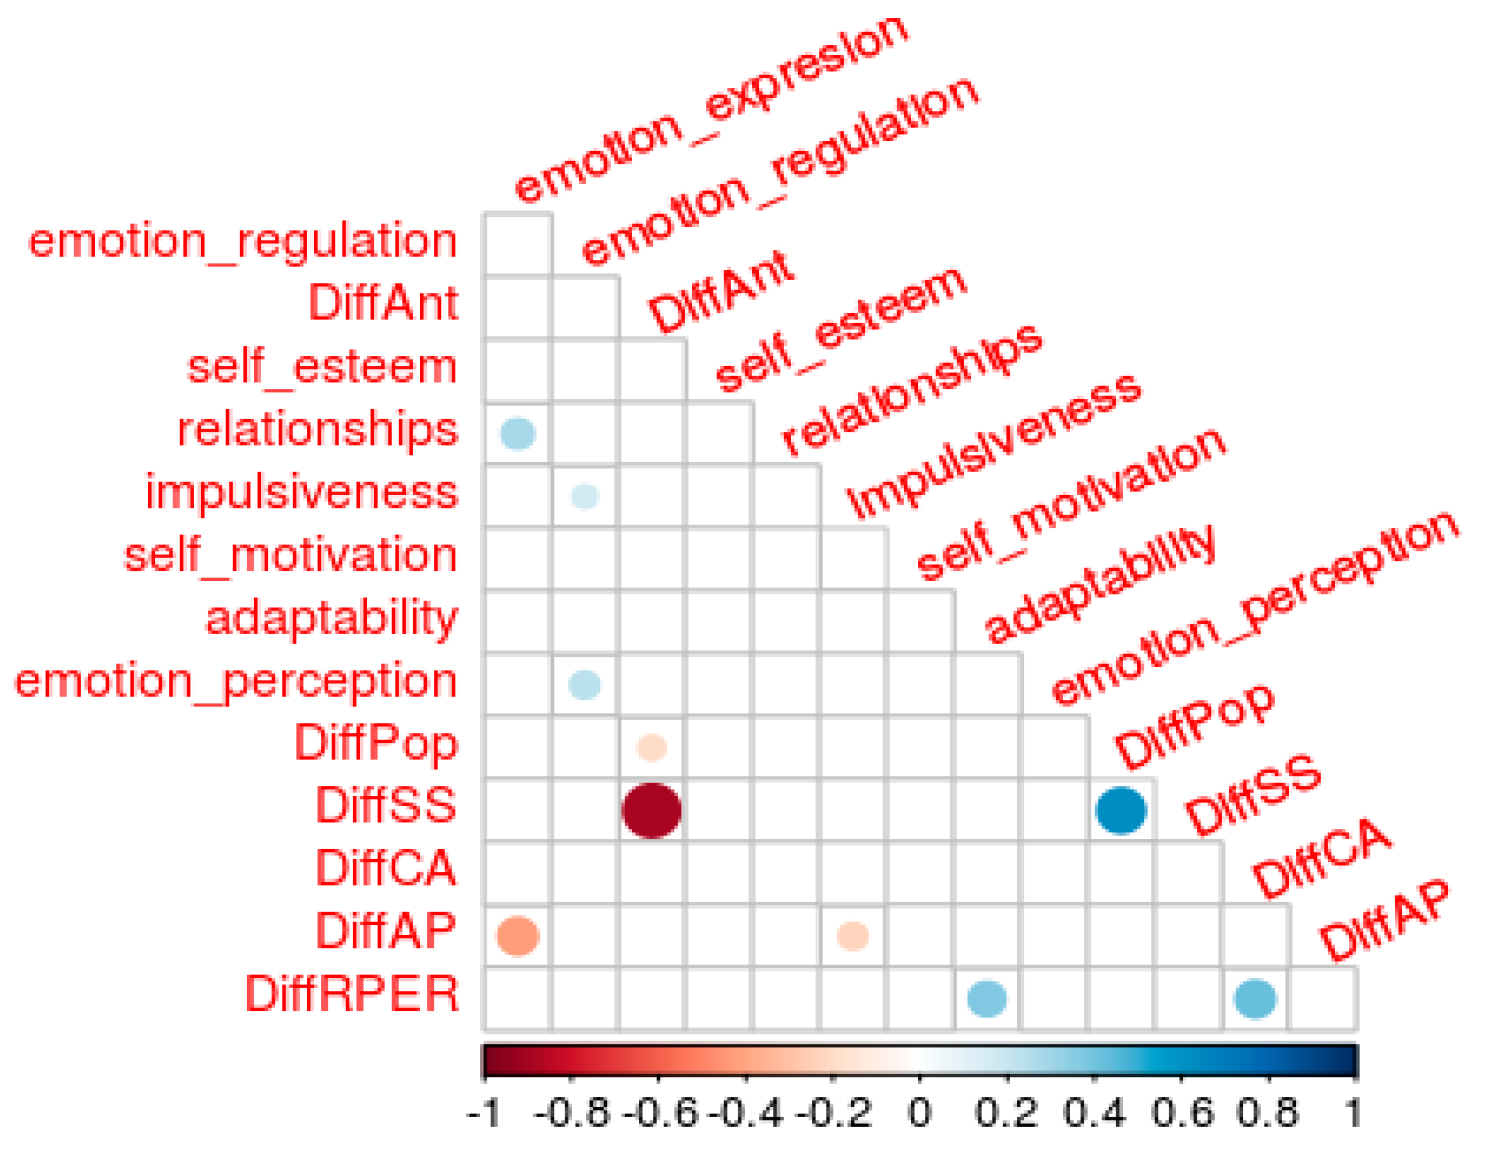
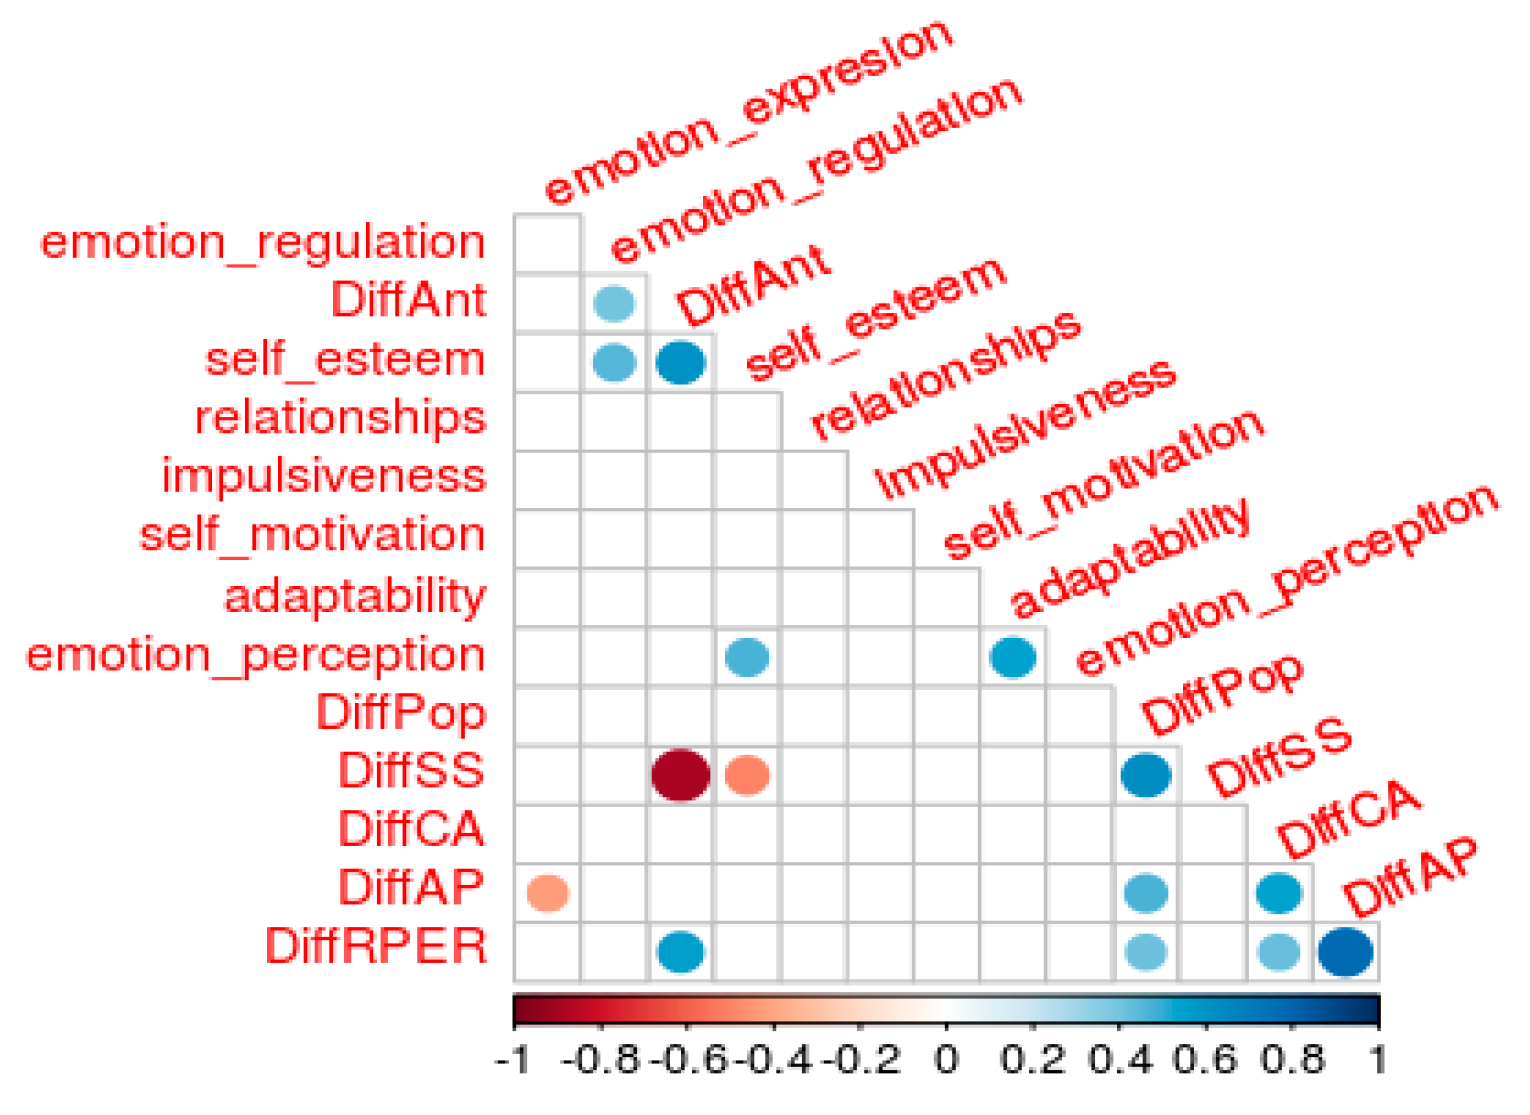
Finally, further data analysis pointed out some interesting correlation of sociometric and emotional intelligence values (with statistical significance level of 0.05), as depicted in
Figure 7,
Figure 8 and
Figure 9 (only the statistically significant values are depicted).
Both groups showed a strong negative correlation (-0.9) between social status (DifSS) and antipathy (DiffAnt), depicted with a bold red spot in
Figure 9. This means that higher social status of a group member was associated with lower level of antipathy. In the same line, social status (DifSS) and popularity (DiffPop) were highly and positively correlated (0.8), depicted with a bold blue spot. Impulsiveness was positively correlated (0.6) with emotional regulation. Probably, more impulsive members, tried to regulate and control their emotions. It is interesting to see that this correlation did not exist in the experimental group and this fact might explain the higher frequency of conflicts that was noticed between the experimental group’s members. On the other hand, experimental group presented an interesting positive correlation between self-esteem and level of antipathy (0.6) that was not present at the control group. This probably pinpoints that some members with good overall sense of self-worth or personal value were still looking for group’s recognition as well a place to be positioned within the group.
Considering all the aforementioned results, we provide some short justification regarding the approval or not of the realized hypotheses. The first hypothesis related to the impact of the improvement on the social competences of a group of students to the social cohesion of the group can be considered valid. Based on the collected results, it can be claimed that emotional training on social competences led to individual changes regarding the popularity levels of the group members who created a sense of widespread and reciprocal sympathy reflected in the social cohesion group indexes. Regarding the second hypothesis related to the impact of the use of sociograms as a teaching instrument to the effectiveness of the intervention, there was no clear indication for its approval, mainly due to the small sample size of our analysis. However, there were clear indications that it could be helpful for educational and social scientists. It can be argued that the use of sociograms as an instrument of continuous feedback about participants interactions was clearly a great help for the teaching staff in the current study. Intermediate sociograms provided valuable feedback to make the interventions more accurate and targeted at the identified emotional needs of the experimental group members. Under this perspective, we can also claim that the continuous sociometric feedback of the group facilitated the design and implementation of more focused interventions that led to a higher group cohesion level.
5. Conclusions
In this study, a set of emotional intervention activities based on a sociometric-oriented approach were designed and implemented in a primary school in Spain with the clear objective to augment social cohesion within members of a social group of primary school students. Based on the produced evaluation results, it could be argued that a group ameliorates its cohesion upon the reduction of group dissociation, mutual rejections, rejected and forgotten members as well as upon the increase of the mutual elections, the high social structures and the number of members who ameliorate their social status.
To obtain such a change, emotional education seems to be a good candidate, since it improved social group characteristics in a straightforward way. In this study, we successfully identified the social and emotional profile of a pupils’ group and implemented a set of emotional intervention activities with the clear objective to augment the social cohesion of the classroom. Even though the study results cannot be generalized due to the small sample group, the experimental group’s social cohesion was increased by 10%. In addition, some strong positive and negative correlations of cohesion and sociometric and emotional indexes were found. Α multiple linear regression model was also proposed to identify a wider set of independent variables upon which social cohesion depends.
It should be noted that, in the current study, the small sample size was the major limitation since it made it difficult to find statistically significant relationships from the collected and generated data. Time limitations of the intervention period should also be mentioned. The total amount of lectures devoted to emotional activities was restricted by the school program and should be completed within a small part of the academic year. ICT limitations, as presented in
Section 3.4, also posed some restrictions, making it difficult to calculate the Social Intensity index (SI), which would give extra information about the social expansiveness of participants. The limited set of responses on behalf of the students hid any possible intention to reveal the intensity of their social interaction with their classmates (proceed to more or less than three elections). Finally, a lack of prior research studies combining sociometry with emotional education was both a limitation as well as an important opportunity for extracting useful insights and paving the way for further research.
Under this perspective, it could be argued that the current study can act as a guide for more extended studies in the future with a larger sample group, aiming at extracting more advanced results. The adopted methodology and definition of social cohesion, the usage of the Petrides’ trait emotional model for identifying the emotional profile of the participants, the design of the emotional intervention activities considering Bisquerra’s emotional competencies model and the realization of a set of evaluations based on the detailed hypotheses constitute a set of steps that can be easily followed on and modified—where necessary—for replicating the presented approach in similar contexts. Towards this direction, researchers are encouraged to explore in detail the combination of sociometrics with the emotional intelligence domain applied in the education field to better prepare future active citizens. It is also interesting to examine which emotional profile is more probable to change its social status in a specific social group. Finally, it should be noted that the current study foresees a strong need for a complete and open-source ICT tool, aiming to facilitate social scientists to work over complex sociometric methodologies, avoiding existing painful and error-vulnerable processes.


