Article

Effects of van Hiele-Based Instruction on Pre-Service Teachers’ Geometric Thinking Across the School–University Transition

by
Nives Baranović
* and
Ivana Batarelo Kokić
Faculty of Humanities and Social Sciences, University of Split, 21000 Split, Croatia
*
Author to whom correspondence should be addressed.
Educ. Sci. 2026, 16(8), 1221; https://doi.org/10.3390/educsci16081221
Submission received: 8 June 2026 / Revised: 24 July 2026 / Accepted: 27 July 2026 / Published: 3 August 2026

Abstract

This study investigates how pre-service primary education teachers (PSTs) develop geometric thinking when exposed to an instructional approach based on van Hiele’s theory. Ninety undergraduate students were divided into experimental and control groups and were assessed before and after a semester of Euclidean geometry instruction. Using mixed-methods analysis, the study examined participants’ initial levels of geometric thinking, their progression over time, and the comparative impact of traditional and van Hiele-based instruction. Both groups began with similarly limited geometric understanding and showed improvement, yet only the experimental group achieved statistically significant gains. These findings demonstrate the effectiveness of van Hiele-based instruction in strengthening conceptual understanding and supporting PSTs’ transition from procedural school mathematics to the deductive structure of university geometry. By structuring learning through van Hiele’s levels of thinking and five phases of learning, the instructional approach provided accessible entry points, systematic scaffolding, and opportunities for building coherent conceptual networks. The results suggest that integrating van Hiele-informed approaches into tertiary mathematics courses can support the development of robust geometric thinking and better prepare PSTs for future teaching of geometry.

1. Introduction

Children take their first mathematical steps in primary education: they encounter initial ideas and concepts, solve their first mathematical tasks and problems, and begin to engage in mathematical discussions, explanations, and conclusions. In these early stages, they often experience uncertainty and require both emotional support and professional guidance from their teacher (Žilková, 2015). Primary teachers have a major responsibility: to meet students’ needs and create an environment where they can build mathematical understanding and develop diverse thinking skills through a range of activities and tools (Baranović, 2019). Successful teaching of initial mathematical ideas, concepts, and their connections is possible only if teachers themselves possess a deep understanding of these concepts and are familiar with a wide range of age-appropriate teaching methods (Günhan, 2014). Partial or incorrect understandings are difficult to correct later, and some become “resistant to any change” (De Villiers, 2010, p. 572).
Geometry has long been recognised as a demanding area of mathematics education, with Euclid famously noting that there is no royal road to its mastery (Dongwi, 2014). Mastery of deductively structured Euclidean geometry requires a sharpened geometric eye, developed through systematic visual training in controlled environments (Fujita & Jones, 2002). Because geometric figures embody both abstract and concrete properties (Fischbein, 1993), effective learning requires a careful balance of visual and analytical methods (Presmeg, 1986), ensuring that figures are interpreted by what they represent rather than what they show (Duval, 1995). Abstract geometric thinking emerges through the flexible use of multiple representational systems and the connections between them (van Hiele, 1986; Duval, 1998; Nakahara, 2007; Baranović, 2024).
Research in mathematics education consistently shows that students at all educational levels experience considerable difficulties when learning geometry (e.g., OECD, 2014; IEA, 2017), particularly in establishing connections between geometric concepts (e.g., Yerushalmy & Chazan, 1990; De Villiers, 1994; Fujita & Jones, 2007; Günhan, 2014; Baranović, 2019). These difficulties become especially pronounced when students transition from school to university mathematics (Gueudet & Thomas, 2020), as the discourse of school mathematics differs significantly from that of university mathematics (Liston & O’Donoghue, 2007; Witzke, 2016; Thoma & Nardi, 2017; Baranović et al., 2020). In school mathematics, geometric concepts are often mastered procedurally, with students memorising definitions, rules, and formulas without developing conceptual understanding (Hoffer, 1981; Bishop, 1986; Idris, 1998). In contrast, university-level geometry, which is deductively structured, requires higher levels of geometric thinking that many students completing secondary education do not yet possess (Usiskin, 1982; Crowley, 1987; De Villiers, 1998, 2010; Baranović et al., 2020). This gap in discursive development frequently manifests as commognitive conflict, where students use mathematical symbols, words, or routines according to one discourse while the task or teacher requires another, leading to errors, misunderstandings or inadequate solutions (Thoma & Nardi, 2017).
In light of the issues outlined above, an important question arises: how can prospective teachers be prepared to teach geometry effectively in primary education if they themselves are not yet ready to learn within the discourse of university-level deductive mathematics? Is it meaningful to insist on a deductive approach? If a change in instructional approach is needed, what constitutes a viable alternative?
Although numerous studies have confirmed the effectiveness of the van Hiele theory in developing geometric thinking across different age groups (a comprehensive review is provided by Senk et al., 2022), very few studies have explored whether van Hiele-based instruction can support PSTs’ geometric reasoning or facilitate their transition from school to university geometry. Existing interventions have typically been short and limited in scope (e.g., Armah et al., 2018; Di Martino et al., 2023; González et al., 2025). In Croatia, no research has investigated the use of van Hiele’s theory with prospective teachers, with the exception of one study examining PSTs’ understanding of relationships between quadrilaterals (Baranović, 2019) and another addressing difficulties in the school-to-university transition (Baranović et al., 2020).
Consequently, a significant gap remains in understanding how prospective teachers develop the geometric thinking necessary for their professional practice, and whether instruction based on the van Hiele model can support PSTs during the demanding transition from school mathematics to university-level deductive geometry. By addressing this gap, the present study contributes to the discussion on how to foster PSTs’ geometric reasoning and better prepare them for future teaching of geometry in primary education, thereby strengthening the mathematical foundations of their learners.

2. Features of van Hiele’s Theory

This section highlights only those aspects of van Hiele’s theory that directly informed the design of the intervention. In particular, it focuses on the hierarchical structure of geometric thinking, the linguistic and representational characteristics of the levels, and the five learning phases that guided the organisation of teaching activities throughout the semester.
Dina van Hiele-Geldof and Pierre M. van Hiele, seeking to explain the limited progress of their secondary school students, proposed a psychological–pedagogical theory of levels of thinking (Ding & Jones, 2007). The theory gained wider recognition in the 1980s after its translation from Dutch into English (Crowley, 1987). Thanks to extensive research across age groups, van Hiele’s theory has continued to evolve, with both confirmations of its validity and critical reviews that have refined and deepened its interpretation (e.g., Usiskin, 1982; Teppo, 1991; Gutiérrez, 1992; De Villiers, 2010; Armah et al., 2018; Chen et al., 2023; González et al., 2025). Today, van Hiele’s theory is widely recognised and accepted in the literature and educational research as a theoretical framework that explains the development of abstract thinking (particularly in geometry) by levels, and as a guide for planning learning and teaching processes that promote progression from one level of thinking to another (e.g., Crowley, 1987; Teppo, 1991; Ding & Jones, 2007; Abdullah & Zakaria, 2012; Siew et al., 2013; Dongwi, 2014; Armah & Kissi, 2019; Mbatha & Bansilal, 2023). Many subject curricula and accompanying textbooks worldwide attempt to follow the recommendations outlined in van Hiele’s theory, especially those related to geometry (Crowley, 1987; Kalyankar, 2019; Pegg, 2020).
van Hiele’s theory encompasses three key aspects: (a) a description of the development of abstract thinking, progressing hierarchically through five levels; (b) a discussion of the characteristics of the five-level model; and (c) a description of the five-phase learning process that facilitates progress from one level of thinking to the next (van Hiele, 1986). The characteristics of these aspects indicate possible causes of difficulties and provide guidance for effective learning and teaching of geometry (Crowley, 1987; Dongwi, 2014).
van Hiele (1986, p. 53) describes five hierarchical levels of thinking according to inherent characteristic activities, later given operational names in the literature (Hoffer, 1981; Gutiérrez, 1992; De Villiers, 2010):
Level 1: The visual level (Recognition). Objects are recognised by their external appearance, not by their properties.
Level 2: The descriptive level (Analysis). Objects are studied, analysed, and described based on their properties.
Level 3: The theoretical level with logical relations and geometry generated according to Euclid (Informal deduction). At this level, logical relationships are established between the properties of a particular object or between the properties of different objects. Only at this level is it possible to provide formal definitions and build a hierarchical classification of objects.
Level 4: Formal logic; the study of the lows of logic (Formal deduction). At this level, logical laws, the role of definitions, axioms, theorems, and proofs within the deductive axiomatic system as a whole are studied.
Level 5: The nature of logical laws (Rigour). At this level, different axiomatic systems are studied and compared using pure mathematical language.
van Hiele initially designated the levels as numbers from 0 to 4, but it proved more practical to use numbers from 1 to 5, as is done in this work. For example, referring to Level 2 when numbering from 0 to 4 actually means the third level of thinking, which can cause misunderstandings in communication. Furthermore, if the levels are numbered from 1 to 5, then 0 can indicate those who have not yet reached Level 1, named pre-recognition (Clements & Battista, 1990). While some researchers call Level 1 the “visualisation level,” this is misleading since visualisation encompasses more than recognition (Arcavi, 2003). A more accurate term is “perception level,” referring to recognition of objects at first glance (Duval, 1995).
In addition to the existence of thinking levels, knowledge of the key characteristics of the five-level model is essential for lesson planning (van Hiele, 1986). A review of the literature identifies five significant characteristics inherent in van Hiele’s theory (van Hiele, 1986; Crowley, 1987; Usiskin, 1982; Gutiérrez, 1992):
Property 1: Ordered and sequential. Thinking develops through a hierarchy of levels, each building on the previous one (except for rare cases of exceptional talent; Mason, 1989). To function successfully at a particular level, a learner must already possess the knowledge, skills, and language of the preceding levels (Crowley, 1987). These levels are not strictly discrete; learners may be in transition between them (Usiskin, 1982), and movement from one level to the next is a continuous process (Gutiérrez, 1992). Moreover, progress may vary across topics depending on depth of engagement—for instance, a student might classify triangles easily but struggle with quadrilaterals (De Villiers, 2010).
Property 2: Linguistics/Distinction. “Each level has its own linguistic symbols and its own system of relations connecting these symbols” (van Hiele, 1986, p. 246). Lower levels rely on informal language and limited vocabulary, while higher levels use formal and richer terminology. For example, the term proof may refer to verification (Level 2), informal deduction (Level 3), or formal deduction (Level 4) (Gutiérrez, 1992). Once a level is attained, its mode of thinking persists even if some content is later forgotten (van Hiele, 1986).
Property 3: Separation/mismatch. Learners who think at different levels cannot understand each other. If the teacher, instructional materials, content, or vocabulary operate at a higher level than the learner, desired learning and progress may not occur (van Hiele, 1986; Crowley, 1987).
Property 4: Intrinsic and extrinsic/adjacency. Each level has its own objects of study and inherent properties. What is intrinsic at one level becomes extrinsic at the next (Usiskin, 1982), meaning that the inherent objects at one level become the objects of study at the next level (Crowley, 1987).
Property 5: Advancement. Progress (or lack of it) through the levels of thinking depends more on teaching methods than on age or maturation (van Hiele, 1986; Crowley, 1987). Effective strategies can accelerate progress, while rote memorisation without understanding leads to rapid forgetting and poor outcomes (Abdullah & Zakaria, 2013; Usiskin, 1982; van Hiele, 1986).
To progress from one level of thinking to another, van Hiele (1986, p. 53) proposed five sequential phases of learning:
Phase 1: Information. Pupils become acquainted with the working domain.
Phase 2: Guided orientation. They are guided by tasks (set by the teacher or created by themselves) involving different relations within the network that must be formed.
Phase 3: Explicitation. They become aware of the relations, attempt to express them in words, and learn the technical language associated with the subject matter.
Phase 4: Free orientation. Through general tasks, they learn to find their own way within the network of relations.
Phase 5: Integration. They develop an overview of all they have learned about the subject and the newly formed network of relations now at their disposal.
Although the sequence is not a rigid formula but a flexible, nonlinear teaching process that have to be adapted to students’ prior knowledge and classroom dynamics (Dongwi, 2014), research on geometry teaching consistently shows that instruction aligned with the van Hiele phases enhances students’ geometric thinking, conceptual understanding, and achievement (Crowley, 1987; Teppo, 1991; van Hiele, 1999; Abdullah & Zakaria, 2012, 2013; Siew et al., 2013; Dongwi, 2014). The five-phase structure is widely recognised as a valuable pedagogical framework for organising teaching units and supporting students’ progression through levels of thinking (Abdullah & Zakaria, 2012, 2013; Dongwi, 2014), though further research is needed to examine its effectiveness across diverse groups and contexts.
Taken together, these theoretical principles provide a coherent framework for understanding how geometric thinking develops and how instruction can be structured to support progression through the van Hiele levels. They also offer clear pedagogical guidance for designing learning environments that align with students’ developmental needs, particularly during transitions between mathematical discourses. Building on these foundations, the present study applies van Hiele’s model to the context of tertiary Euclidean geometry instruction for prospective primary teachers. The following section outlines the aims of the study and the research questions that guided the investigation.

3. Aims and Research Questions

The study aimed to design, implement, and evaluate an alternative approach to geometry teaching that strengthens students’ geometric thinking, bridges the gap between school and higher education, enhances tertiary learning outcomes, and improves teacher preparation. A central question was how van Hiele’s theory can be operationalised in teaching Euclidean geometry to foster progress in students’ thinking. The main objective was to determine whether alternative teaching based on van Hiele’s model promoted the development of geometric thinking in the experimental group. Based on these aims, the study addressed the following research questions:
(1)
What levels of geometric thinking, according to the van Hiele model, do participants in both groups demonstrate before learning geometry?
(2)
Over the course of a semester, how do participants within each group progress in geometric thinking?
(3)
Does participation in van Hiele-based instruction lead to significantly greater improvement in geometric thinking compared with traditional instruction, after accounting for initial differences between groups?

4. Methodology

4.1. Research Design

This quasi-experimental study used non-equivalent groups (Cohen et al., 2007, p. 282) because the intervention took place during regular semester-long Euclidean geometry classes at two universities. This quasi-experimental study used non-equivalent groups (Cohen et al., 2007, p. 282) because the intervention took place during regular semester-long Euclidean geometry classes at two universities. The course was delivered over a 15-week semester. The first and last week were dedicated to introductory activities and testing, while the teaching intervention lasted 13 weeks. Each week included 2 h of lectures and 2 h of practical exercises. The Euclidean geometry content covered Euclid’s axioms, definitions and classification of 2D and 3D figures, their properties, related elementary statements, and basic proofs. The concepts addressed included: line, ray, segment, angle, triangle, quadrilateral, circle, prism, pyramid, cylinder, cone, and sphere.
Students at one university formed the experimental group and were taught using the alternative approach, while those at the other university formed the control group and received traditional instruction. The research design is presented schematically (Figure 1), where the dotted line between the groups indicates that the groups are not equivalent (Cohen et al., 2007, p. 283).
Pre- and post-tests used identical instruments to measure participants before instruction and after one semester, enabling evaluation of progress. The alternative approach was student-centred, guided by van Hiele’s model, its developmental stages, and the five learning phases. In contrast, the traditional approach relied on ex cathedra teaching within the deductive Euclidean framework, where lecturing and abstract content dominated, and students’ developmental levels, engagement, and participation played only a minor role.
To address the research questions, pre- and post-test data were analysed using descriptive and inferential statistics (Mann–Whitney U, Wilcoxon signed-rank, Spearman correlation), providing a comprehensive overview of participants’ progression (Lund, 2012). Descriptive methods summarised participant characteristics, and most analyses were conducted in SPSS 24.0.

4.2. Context of the Study

The data presented in this paper form part of the large-scale research project Cognitive Development and Learning Outcomes of Geometry in Primary Education Students (KRIUG). Within this project, an extensive experimental study was conducted to examine the development of geometric thinking and visual-spatial skills among prospective primary teachers, drawing on van Hiele’s theory and the method of directed observation. The full intervention, including its broader aims, structure, and methodological details, is described in Baranović (2024).
The present paper reports only one component of that experimental study—specifically, the part that investigates the development of geometric thinking and the operationalisation of van Hiele’s theory in tertiary Euclidean geometry instruction. The focus here is on analysing how van Hiele-based teaching influences prospective teachers’ progression through levels of geometric thinking during a semester-long university course.

4.3. Sample

The study included all teacher-education students enrolled in Euclidean geometry courses at two Croatian universities during the summer semester (N = 90). The experimental group consisted of 52 third-year students (mean age 21.8), while the control group consisted of 38 second-year students (mean age 19.4). These differences were unavoidable because the course is offered in different years at the two institutions, and the research was conducted in regular classroom settings.
Despite these differences, the groups were comparable on key characteristics. All students were female, and the Euclidean geometry curricula at both universities were closely aligned in learning outcomes, content, and assessment. All participants had completed the same national mathematics curriculum and had passed the lower level of the national graduation exam required for university admission. In addition, both institutions are located in culturally and educationally similar Mediterranean regions, limiting institutional or sociocultural variation.
Students came from diverse high-school backgrounds and had not studied geometry since secondary school, resulting in a two-year gap for the experimental group and a one-year gap for the control group, slightly favouring the latter. These contextual factors were considered when planning the intervention and interpreting the results. Participants were informed about the general aim of improving geometry learning outcomes, gave consent, and were assigned anonymous codes to ensure confidentiality and ethical compliance (Cohen et al., 2007).

4.4. Instrument, Data Collection and Analysis

Participants’ geometric thinking levels were assessed using the van Hiele Geometry Test (VH test), originally developed by Usiskin (1982) to measure secondary students’ thinking and validated on a large sample. Although initially designed for younger learners, the VH test has been used in studies involving older students, including pre-service teachers, because it assesses levels of geometric thinking rather than curriculum-specific content (e.g., Armah et al., 2018; Senk et al., 2022). Its conceptual nature makes it suitable for evaluating PSTs’ progression through the van Hiele levels, particularly given that the participants in this study entered university with relatively modest prior mathematical preparation. This alignment between the instrument’s focus and the characteristics of the sample supports its validity for the purposes of the present study. In addition, the VH test has consistently demonstrated strong validity and reliability across decades of research and is considered a robust instrument for assessing PSTs’ levels of geometric thinking (Armah et al., 2018).
The VH test consists of 25 multiple-choice items, each with one correct answer from five options. It is organised according to van Hiele’s levels of geometric thinking, sequentially in blocks of five items, with items at each level being of varying complexity. Items 1–5 measure students’ ability to recognise basic geometric figures based on their external appearance. Items 6–10 measure students’ ability to identify properties of figures. Items 11–15 measure students’ ability to analyse figures according to their properties and the relationships between these properties. Items 16–20 measure students’ ability to understand more complex statements and formal language. Items 21–25 measure students’ ability to navigate in an environment other than Euclidean geometry and to apply pure logical reasoning. All items are conceptual, requiring analysis rather than rote recall (Usiskin, 1982), which aligns well with the aim of assessing participants’ levels of geometric thinking.
Because the instructor also served as the researcher in the experimental group, particular care was taken to minimise potential bias (Tabach, 2011). The control group was taught by a different instructor following the traditional deductive syllabus, while both instructors covered the same officially prescribed Euclidean geometry content and learning outcomes. Embedding the intervention within regular semester-long coursework helped limit, though not eliminate, potential bias associated with the instructor–researcher’s dual role, as instructional decisions followed the pre-established syllabus rather than the assessment instrument. In addition, both groups completed the same standardised and externally validated VH test under identical administration conditions (35 min, weeks 1 and 15; Usiskin, 1982), which further limited potential instructor effects on assessment outcomes.
Following Usiskin’s (1982) procedure, each item was initially coded as correct or incorrect, after which the test was scored in five-item blocks. In the classic VH test (CVH), evaluation used both lenient and stricter criteria: mastery of a level was indicated by at least three correct answers out of five (CVH3) or, more rigorously, by four correct answers (CVH4). Total scores were calculated by adding up the corresponding points at all levels (Table 1). When the sequence criterion is satisfied, a person’s level of thinking is determined by their total score. If the criterion is not met, the level cannot be determined; instead, the individual is regarded as being in transition between levels, classified as “no fit” (Usiskin, 1982, p. 25). For example, a total score of 15 places a person at Level 4, since the sequence criterion is satisfied across all four levels (1 + 2 + 4 + 8 = 15). In contrast, a score of 19 meets the criterion for Levels 1, 2, and 5, but not for Levels 3 and 4 (1 + 2 + 0 + 0 + 16 = 19). In this case, the sequence criterion is broken, so the person’s level cannot be determined and is classified as “no fit” (Table 1).
If only a few participants reach Level 5, the evaluation is adjusted by removing that level and redistributing its points to the earlier levels (Table 1, last column). In this case, a modified van Hiele model (MVH) is applied: scores based on the lenient criterion are labelled MVH3, while those based on the stricter criterion are labelled MVH4. For statistical analysis, the same labelling applies to the total VH test scores, depending on whether the lenient (VH3) or stricter (VH4) criterion is used, and whether the classic (CVH) or modified (MVH) model is followed. Test labels also distinguish timing: 1VH for pre-testing at the semester’s start and 2VH for post-testing at the end. For example, 1CVH3 denotes pre-testing under the lenient criterion in the classic model, while 2MVH4 denotes post-testing under the stricter criterion in the modified model.

4.5. Intervention

Effective application of van Hiele’s model requires an in-depth understanding of each level of geometric thinking and each learning phase (Ding & Jones, 2007). To support this, van Hiele’s original work and subsequent research were reviewed to develop operational descriptions of the levels and phases used in the intervention (described below). Some of these requirements were partially tested in the classroom prior to the intervention to establish realistic expectations for students’ progression.
During the semester-long intervention, two main strategies guided instruction in the experimental group: organising content in accordance with the van Hiele model and applying the visual–analytical method of directed observation. Teaching activities were implemented accordingly and included the use of didactic tools (tangram, dot grid), drawing, construction (with straightedge and compass, with paper and pencil, or with a sketchpad), defining, formulating statements, proving, and problem-solving.
These activities were integrated through the visual–linguistic–symbolic (VLS) system, ensuring balanced development of visualisation, conceptual understanding, and symbolic reasoning. By applying this three-layered approach to learning geometry, participants were encouraged to flexibly transition between representational systems and to engage with geometric content at increasing levels of abstraction (Duval, 1998). Such coordinated movement across the VLS layers forms the foundation for the development of mathematical thinking and reasoning (Nakahara, 2007).
A detailed description of the three-layered VLS teaching system and the directed observation method, including extended examples and implementation guidelines, is provided in Baranović et al. (in press), particularly in the section Three-layered Teaching and Learning Geometry and Directed Observation Method. The present article focuses specifically on the components relevant to the development of geometric thinking measured through the VH test.

4.5.1. Operationalization of van Hiele Model

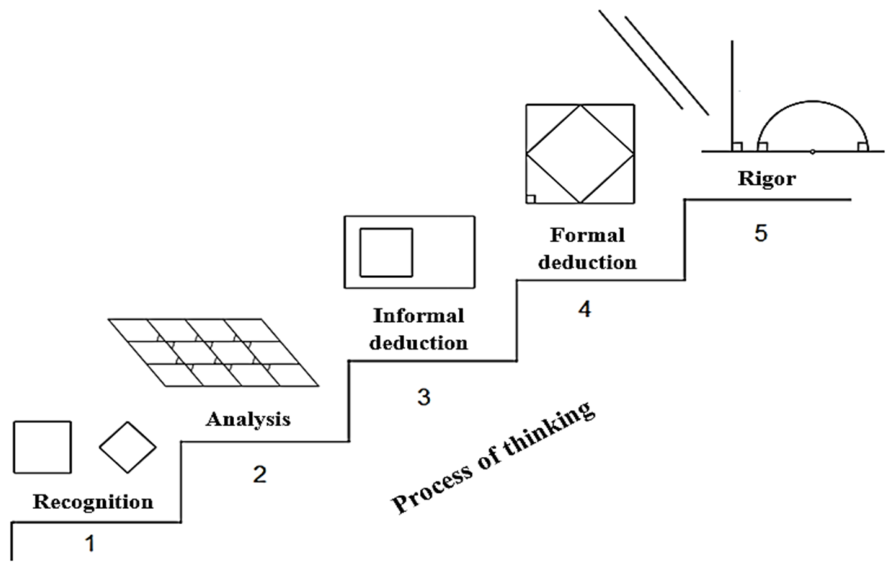
Successful teaching rests on effective communication, where students engage actively, and teachers can identify misconceptions and gaps in understanding (van Hiele, 1986). The visual representation of the van Hiele model (Figure 2) provided a clear framework for the learning process, familiarising students with the method and highlighting opportunities for active involvement. It also guided the selection of didactic tools and strategies. The description below supported the teacher in managing the process and introducing students to the structure of instruction, while explaining the rationale for each tool helped them understand the importance of their participation.
Level 1: Recognition. Learning Euclidean geometry begins with visual, non-verbal thinking, where figures are identified and named based on their external appearance (van Hiele, 1986). Mastery at this level involves recognising shapes regardless of their position, naming them, and classifying them into groups. To achieve this, students should engage in diverse activities using didactic tools such as arranging, colouring, counting, drawing, identifying shapes within complex figures, describing, and problem solving (Crowley, 1987). These hands-on experiences enhance shape recognition and gradually build a geometric vocabulary, which in turn strengthens communication and supports deeper learning (Siew et al., 2013).
Level 2: Analysis. At this stage, learners move beyond recognition to examine and describe the properties of geometric figures without yet establishing formal connections between them (van Hiele, 1986). Through repeated engagement, such as measuring, colouring, folding, or stacking, students compare figures based on properties, classify them by chosen criteria, and empirically derive rules or generalisations limited to the observed group of objects (Crowley, 1987). Mastery at this level is evident when students can skilfully operate with properties and begin to formulate their own definitions, even if they have not yet distinguished between necessary and sufficient conditions (De Villiers, 2010).
Level 3: Informal deduction. At this level, learners begin to establish logical connections between properties of figures, form meaningful definitions, classify, and justify conclusions, gradually recognising necessary and sufficient conditions (van Hiele, 1986). Mastery requires students to construct their own definitions and identify minimal defining properties, rather than receiving formal definitions prematurely, which often leads to misconceptions (De Villiers, 1998, 2010). Instruction should therefore encourage building inclusive relationships among figures, deriving formulae, and supporting arguments through varied representations—visual, symbolic, and verbal (De Villiers, 2003; Crowley, 1987; Duval, 1995, 1998). Students demonstrate competence when they can independently define concepts, classify hierarchically, and generalise properties, though they remain unable to construct formal proofs; they recognise the system of definitions, axioms, and theorems but do not yet grasp its full role (van Hiele, 1986; De Villiers, 1994).
Level 4: Formal deduction. Progression to this level occurs only after mastering the first three, enabling learners to construct formal proofs and grasp the necessity of axiomatic systems through learning rather than maturation (van Hiele, 1986). Students at this stage can formulate conditional statements, identify assumptions and conclusions, derive converses, distinguish between axioms and derived results, and test assertions through proofs or counterexamples (Crowley, 1987; De Villiers, 2003). They can understand the different roles of proof, know various strategies for proving, and establish connections across different representations in the proving process (De Villiers, 2003).
Level 5: Rigour. At this highest stage of abstract thinking, learners can compare different axiomatic systems and analyse definitions, theorems, and proofs across them (van Hiele, 1986). Mastery involves the ability to conduct indirect proofs, recognise consistency, independence, and completeness of the axiomatic system, and understand that geometry extends beyond the Euclidean system. Students at this level skilfully identify similarities and differences between systems, interpret concepts such as parallel lines within various frameworks, and derive corresponding equations and relationships.
Research shows that school mathematics often leaves students underprepared for university, creating a gap between secondary and tertiary discourses (Liston & O’Donoghue, 2007; Baranović et al., 2020). Identifying students’ levels of thinking before instruction is therefore essential for effective planning. In line with the characteristics of the van Hiele model, it should be kept in mind that progression from one level to the next is gradual (Property 1). Teaching must be aligned with students’ actual levels through appropriate language (Property 2), suitable materials and didactic tools (Property 3), and a coherent sequence of content and activities (Property 4). Age alone does not guarantee the prior knowledge required to follow a university curriculum (Property 5). To address these challenges, van Hiele proposed five sequential learning phases, whose operational description is given below.

4.5.2. Operationalization of Phases of Learning

A major principle of van Hiele’s model is that geometric learning progresses through a well-structured sequence of activities that move from exploration to concept formation and finally to consolidation (van Hiele, 1999, p. 311). This principle guided the structuring of instructional phases in the experimental group, while the control group followed the standard deductive Euclidean syllabus.
Phase 1: Inquiry/Information. Lessons begin with questions, brief investigations, or discussions that reveal students’ prior knowledge, language use, and misconceptions (van Hiele, 1986). Simple activities or short questionnaires engage learners and guide further work, while complex figures provide a basis for varied interpretation and classification. Building on observed knowledge avoids repetition, addresses gaps, and expands vocabulary. Different types of cognitive conflict and counterexamples can reveal incomplete understanding and promote deeper conceptual development (Meissner, 1986; Thoma & Nardi, 2017; Firmanti, 2022).
Phase 2: Guided Orientation. Following the introductory discussion, learners engage in structured tasks—drawing, measuring, calculating, and inferring—to uncover or clarify relationships and prepare for new concepts or proofs (van Hiele, 1986). Activities may be coordinated through direct interaction or designed for independent work, either individually or collaboratively. Short, focused tasks that yield specific answers are most effective, with sub-questions provided to support students who encounter difficulties (Crowley, 1987).
Phase 3: Explicitation. After guided research activities, a concise review consolidates key conclusions (van Hiele, 1986). When conducted through direct teacher–student interaction, Phases 2 and 3 overlap and complement each other. During independent work, students first articulate results in their own words before coordinating with the teacher to identify essential outcomes, new terminology, concepts, definitions, and statement inverses. This process fosters the development of mathematical vocabulary, strengthens the use of multiple representations, and enables the teacher to refine and improve students’ understanding (Crowley, 1987).
Phase 4: Free Orientation. At this stage, students engage with complex tasks that require higher cognitive effort, often involving multiple steps, diverse solution paths, or several possible outcomes (Crowley, 1987). By applying newly learned ideas in new contexts, students gradually build relational networks and deepen their understanding (van Hiele, 1986). As they work independently on research and problem-solving, the teacher supports them by monitoring progress, clarifying uncertainties, and offering guidance when necessary.
Phase 5: Integration. Students consolidate their learning by systematising concepts, terminology, conclusions, and connections, using varied representations to refine their expression, articulate definitions, derive formulae, and classify concepts (van Hiele, 1986). This activity should be student-led with teacher guidance; for example, exploring quadrilaterals can lead to hierarchical classifications and inclusive relationships that support informal deductive reasoning (Baranović, 2019). Through explanations such as “if…, then…” and the use of visual representations, students gradually abstract their language and develop higher-level thinking based on networks of geometric properties (Crowley, 1987; De Villiers, 2003).
The five-phase learning strategy places students at the centre of instruction (teacher–student–content), with teachers guiding and coordinating activities. Collaborative engagement supports the transition from informal to formal language, deepens geometric understanding, and improves outcomes (van Hiele, 1999; Siew et al., 2013; Armah et al., 2018). In contrast, the control group received traditional instruction, where lecturing and abstract content dominated (teacher–content–student), and little attention was given to students’ developmental levels or engagement.
In practice, topics were structured through five key activities aligned with van Hiele’s learning phases: introductory discussion (Phase 1), focused independent work (Phase 2), explanation and reflection (Phase 3), application through varied tasks (Phase 4), and integration of results into a coherent whole (Phase 5). These activities did not occur linearly but alternated according to the demands of each topic and students’ prior knowledge, with all phases sometimes realised within a single session or extended across several hours. Throughout the practical work, tasks of differing cognitive demands supported exploration, construction, justification, and the development of functional networks of concepts, enabling continuous application of the visual–analytical method of directed observation across all phases.
For example, work with tangrams was structured through the five phases: exploratory manipulation of shapes (Phase 1), focused tasks requiring identification of properties (Phase 2), guided reflection on emerging relationships (Phase 3), application in varied configurations (Phase 4), and consolidation through linking visual patterns with formal geometric concepts (Phase 5).

5. Results

Data were analysed using both quantitative and qualitative procedures, consistent with a mixed-methods design. The presentation of results follows the structure of the three research questions and integrates evidence from both strands of analysis. Findings are organised to show participants’ initial levels of geometric thinking, their progress after thirteen weeks of instruction, and differences between the experimental and control groups.
The first research question examines participants’ initial levels of geometric thinking before instruction, based on pre-test results analysed using classical and modified van Hiele criteria.

5.1. Levels of Geometric Thinking of Participants According to the VH Test Before Teaching

Before the pre-test, participants had no preparation and had been away from geometry for 2.5 years (experimental group) or 1.5 years (control group). The results therefore reflect their retained geometric knowledge from twelve years of schooling. The 1VH test results were analysed using both classical and modified van Hiele models, with milder and stricter criteria (1CVH3, 1CVH4, 1MVH3, 1MVH4). Graphs show the relative frequencies of achieved levels for both groups, allowing comparison of uniformity and differences in geometric thinking. Histograms display levels 0–5, plus “no fit” for unclassified participants, with percentages on the horizontal axis. The analysis included 80 participants (46 experimental, 34 control), as 10 (6/52 and 4/38) did not take the test. The following graphs summarise the distribution of levels for both groups, present the results separately for the experimental and control groups, whereas the accompanying explanation integrates these data to provide additional information and highlight patterns that are not immediately visible in the visual representation.
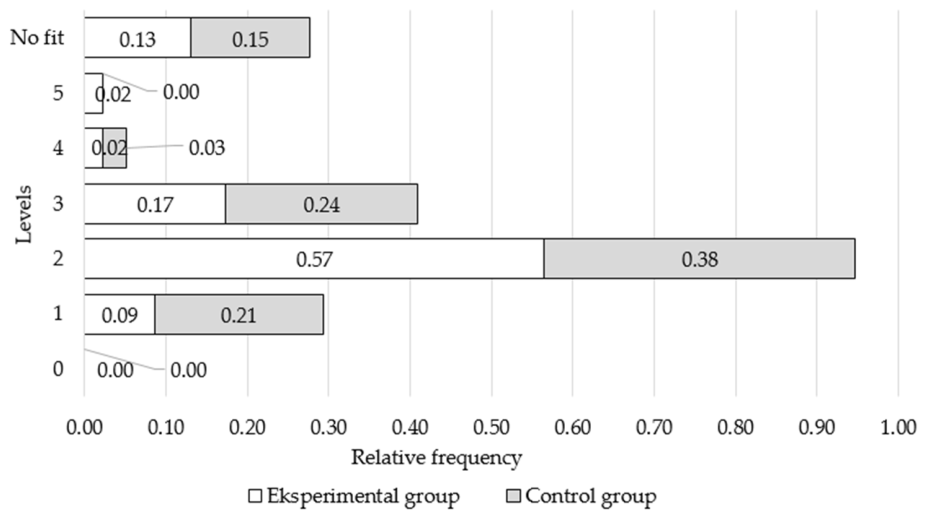
Comparative graphs (Figure 3) under the milder classical criterion (1CVH3) provide an overall view of geometric thinking levels in both groups before instruction.
Figure 3 shows that over half of the participants (50 of 80; 62.5%) scored at the first two levels of the 1VH test. One fifth (16; 20%) reached the third level, while only 3.75% (3 participants) achieved advanced levels. A further 13.75% (11 participants) were unclassified. This snapshot shows that most participants had not yet reached the geometric thinking levels required to succeed in tertiary-level geometry.
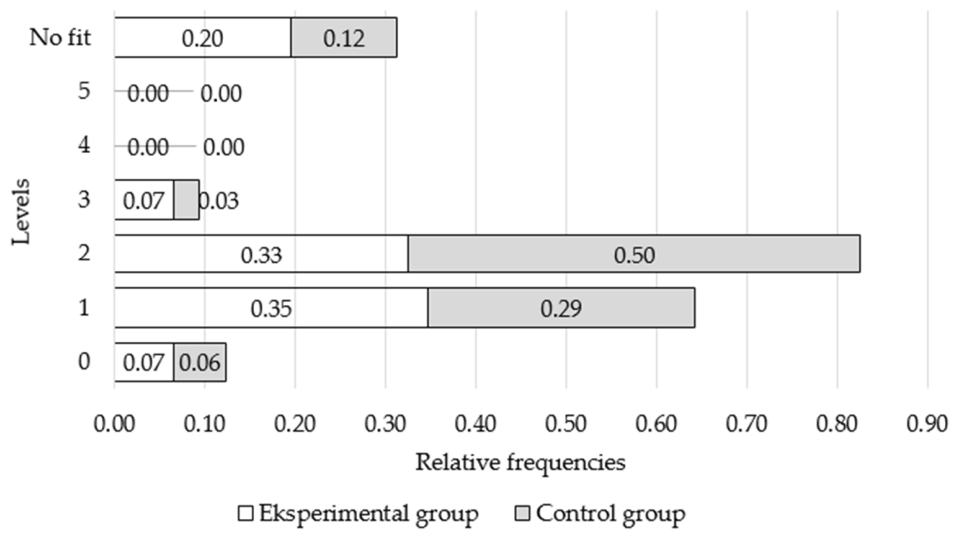
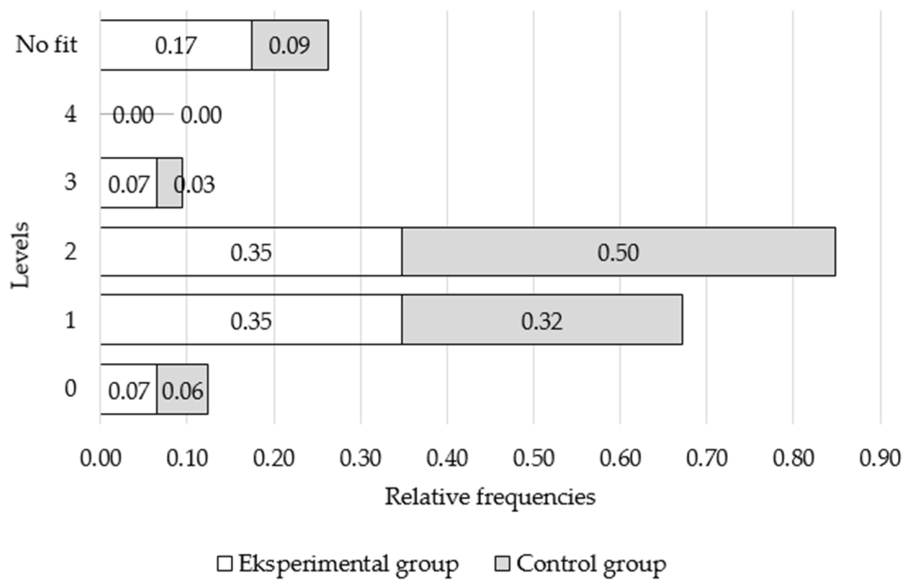
A comparative graphical representation of relative frequencies based on the stricter criterion of the classical van Hiele model (1CVH4) offers a more precise view of participants’ geometric thinking levels (Figure 4). Because some participants do not earn the required points at certain levels, removing levels can significantly change the distribution. If the final level is removed, a participant may shift to a lower group (e.g., from Level 3 to Level 2). If gaps are eliminated, an unclassified participant may be reassigned to a specific level (e.g., dropping Level 4 in the sequence 1 + 2 + 0 + 8 moves the participant to Level 2). However, if a level before the last achieved is removed, the sequence criterion is violated, and the participant is placed in the unclassified group.
Figure 4 shows that under the stricter criterion, participants in both groups perform considerably weaker than under the lenient one. None reached advanced levels, while the number of unclassified participants rose from 11 to 13 (16.25%), and those failing to master any level increased to 5 (6.25%). Many previously at Level 3 proved unstable, with only four remaining (5%), while over 70% (59 of 80) are now concentrated at Levels 1 and 2. These results clearly indicate that participants were not prepared to study geometry at the university level.
Since very few reached advanced levels, Usiskin (1982) suggests viewing the group through the modified van Hiele model, using both milder and stricter criteria. In this model, removing the 5th level reassigns unclassified participants to appropriate levels or leaves them unclassified, while those at Level 5 move to Level 4.
Figure 5 shows the comparative distribution of relative frequencies under the milder criterion of the modified model (1MVH3). More changes appear in the experimental group, where Levels 1, 2, and 4 increased compared to 1CVH3, as participants who partially reached Level 5 were redistributed to earlier levels. This suggests their geometric thinking is less stable than that of the control group. As a result, fewer participants remain unclassified, highlighting those who need further support to strengthen conceptual connections and achieve more stable reasoning. Notably, the number at Level 3 remained unchanged from 1CVH3, confirming that none of the Level 5 participants stabilised at Level 3—the stage where networks of conceptual connections are formed.
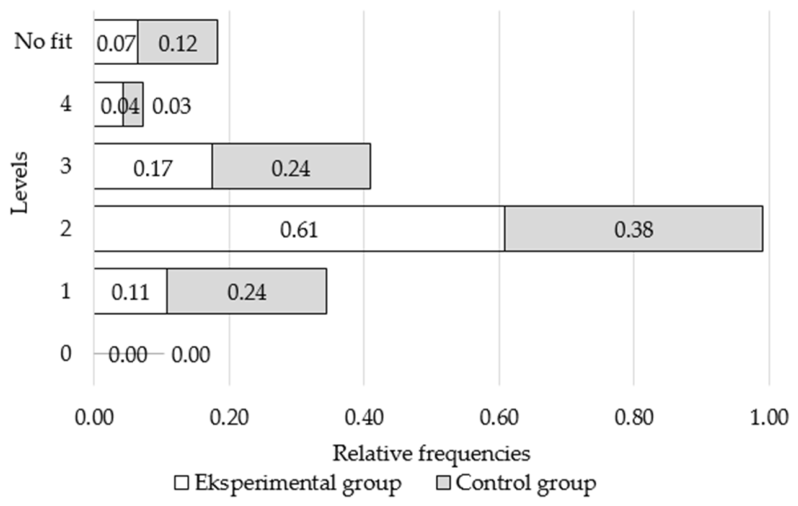
Figure 6 shows the comparative distribution of relative frequencies under the stricter criterion of the modified van Hiele model (1MVH4). The results closely resemble those obtained with the classical stricter criterion (1CVH4, Figure 4), indicating that the stricter criterion has a greater impact than the removal of Level 5. Some participants reach the early levels of geometric thinking but remain uncertain in their reasoning, leading to weak conceptual connections that are often disrupted by perceptual processes.
Interestingly, 15% of participants (12 of 80; 9 in E, 3 in C) show greater instability at the first level than at higher levels. After removing Level 5, these individuals either became unclassified or lost their only level. Notably, one control group participant showed stable Levels 2, 3, and 5 across all criteria but did not meet Level 1, suggesting that perceptual factors may hinder geometric reasoning despite adequate knowledge (Fischbein, 1993). This underscores the need to strengthen visualisation skills so that perceptual and mathematical processing can work together.
Although Figure 3, Figure 4, Figure 5 and Figure 6 appear similar, each displays distinct qualitative differences. Comparing results across criteria reveals shifts that highlight weak points and areas of instability in geometric thinking, which are crucial for tailoring instruction to the group’s needs.
In addition to quantitative analysis, it is essential to examine each participant’s complete answer sheet, including items answered incorrectly, in order to gain a more accurate sense of the quantitative results. Participants who achieve the same van Hiele level (e.g., Level 3) often differ substantially in the stability of that level, and many show correct responses at higher levels. In this sense, qualitative inspection of response patterns complements the numerical results and provides a deeper understanding of individual differences in geometric thinking.
Shapiro–Wilk tests showed significant deviations from normality for all VH variables (p < 0.001). Because of this, and given the ordinal and bounded nature of VH scores, non-parametric tests were used. Mann–Whitney U tests compared the experimental and control groups before instruction, and Wilcoxon signed-rank tests assessed within-group progress. Because VH test scoring varies across methods (VH3/4, CVH3/4, MVH3/4), significance was analysed separately for each. The Mann–Whitney U results are shown in Table 2.
Table 2 shows no statistically significant differences between the groups (p > 0.05) in their distribution across van Hiele levels, regardless of the evaluation method. For some criteria (1VH4, 1CVH4, 1MVH4), the control group shows slightly higher means, likely reflecting their shorter break from studying geometry (1.5 years in C compared to 2.5 years in E). Baseline differences between groups were minimal, as reflected in both the non-significant tests and the very small effect sizes. This establishes a reliable starting point for evaluating the impact of instruction.
Both Spearman and Pearson tests revealed statistically significant correlations. Given the small sample size (N < 100), Table 3 reports the Spearman correlation results across different evaluation methods of the VH test.
Table 3 confirms a positive correlation among the different forms of VH test evaluation, as expected. Notably, correlations are weaker between milder and stricter criteria than within the same type (i.e., between two milder or two stricter criteria). For instance, the correlation between 1VH3 and 1MVH4 is 0.459 (p < 0.01), whereas the correlation between 1VH3 and 1MVH3 is much stronger at 0.788 (p < 0.01). This pattern supports earlier observations: stricter criteria exclude participants with unstable reasoning, leading to significant shifts in the group profile.
Test reliability was assessed using Cronbach’s alpha. Although the VH test is widely recognised as valid and reliable across diverse groups, coefficients vary according to group characteristics (Usiskin, 1982; Armah et al., 2018). Because the Mann–Whitney U test showed no pre-intervention differences between groups, reliability was assessed using the pooled data. The sample’s Cronbach’s alpha was 0.576, which, although below the common 0.7 benchmark, can be acceptable in early-stage research given the participant characteristics (Nunnally, 1978). Therefore, the VH test can be considered sufficiently reliable, consistent with Usiskin’s (1982) findings for samples distributed across the first three levels of geometric thinking.
Answer to Research Question 1: Before instruction, results showed that both groups were predominantly at the lower van Hiele levels of geometric thinking. Using the milder criterion, fewer than 4% of participants demonstrated higher levels (Levels 4–5), while under the stricter criterion only 5% remained at Level 3, with the majority at Levels 0–2 or unclassified. This distribution suggests that prior schooling did not sufficiently develop students’ geometric thinking to support immediate engagement with university-level deductive geometry.
The second research question examines changes in participants’ geometric thinking after thirteen weeks of instruction, based on within-group comparisons of pre- and post-test results.

5.2. Levels of Geometric Thinking of Participants According to the VH Test After Teaching

After 13 weeks of instruction, with the experimental group following the van Hiele-based approach and the control group using traditional methods (Norton, 2024), the VH test (2VH) was re-administered to assess the extent of participants’ progress in geometric thinking. The study examined whether this progress was statistically significant both within and between groups. The results are presented below, along with analysis and discussion.

5.2.1. Comparison of Achievements Within Groups Before and After Teaching

To assess progress in the experimental group, Wilcoxon signed-rank tests were applied to all VH scoring criteria. The results are shown in Table 4.
As shown in Table 4, post-test scores in the experimental group were significantly higher than pre-test scores across all evaluation methods (Z values ranging from –2.67 to –4.12, p values from <0.001 to 0.008). These results show consistent, statistically significant improvements in geometric thinking after the 13-week intervention, regardless of the scoring method used.
In contrast, the control group exhibited no significant progress; in fact, their 2VH test scores declined across all parameters (negative values in column M). Several of these declines reached statistical significance at the 5% level, with weaker post-test performance observed for CVH3 (p = 0.046), VH4 (p = 0.023), CVH4 (p = 0.029), and MVH4 (p = 0.019). Effect sizes align with these findings: the experimental group demonstrates moderate to large improvements across all criteria, whereas the control group shows only small to moderate declines, confirming a clear divergence in learning outcomes.
To compare progress across individual levels of geometric thinking, participants are distributed by pre- and post-test levels, following Usiskin’s (1982) approach. This shows how many participants remained at the same level, advanced, or regressed, across all four criteria (milder and stricter versions of the classic and modified VH models). Only those who completed both the pre- and post-tests are included: 41 of 52 (78.85%) in the experimental group and 31 of 38 (81.58%) in the control group.
The data from Table 5 show that, in the experimental group, most participants either progressed or maintained their level (highlighted in bold and underlined), whereas in the control group progress was minimal, with a greater tendency toward retention at the same level and even regression.
The data from Table 6 reveal that results are more concentrated at the lower levels (0, 1, and 2), a redistribution already explained in the initial analysis of the 1VH test. Reviewing full test responses shows that some experimental group participants demonstrated greater stability across all achieved levels, maintaining higher levels even under the stricter criterion, an outcome not observed in the control group.
Table 7 and Table 8 present the frequency distributions by level according to both the milder and stricter criteria, with the 5th level removed (MVH3 and MVH4). This exclusion is justified, as only one participant reached the 5th level, and following Usiskin’s (1982, p. 32) recommendation, it is appropriate to omit this level from consideration. The data in Table 8, using the stricter criterion, provides a more reliable picture of each group’s actual progress across the levels of geometric thinking.
Examining participants’ complete test work provides deeper insight into the stability of their geometric thinking. In the experimental group, all students demonstrated meaningful progress at each level, including those who initially appeared to remain at the same level or regress. For instance, Table 5 shows one participant moving from Level 5 to Level 4 and another from Level 4 to Level 3.
A closer look at their complete work shows strong progress across the first three levels, suggesting that the apparent regression reflects instability at higher levels rather than a lack of learning, consistent with cumulative learning principles (Lee, 2012). In the control group, the pattern differs. Post-test results vary widely: some students show slight gains at certain levels, while others perform worse. Overall progress is minimal, even for those who appear to advance in the tables, indicating that these positive shifts do not reflect stable development.
Answer to Research Question 2: The experimental group showed clear, statistically significant gains in geometric thinking after thirteen weeks of instruction tailored to their prior knowledge and abilities. In contrast, the control group taught with conventional methods showed minimal progress, with some indicators suggesting decline.
The third research question examines differences between the experimental and control groups after instruction, based on comparisons of post-test performance across all van Hiele scoring criteria.

5.2.2. Comparison of Achievements Between Groups Before and After Teaching

To assess the statistical significance of differences in achievement between the experimental and control groups after 13 weeks of teaching, Mann–Whitney U tests were conducted on all 2VH scoring criteria. As shown in Table 9, the experimental group outperformed the control group in all evaluation methods. All differences were statistically significant (p < 0.001–0.003), indicating consistently higher post-test performance among students taught using the van Hiele-based approach. Effect sizes were moderate to large, confirming the magnitude of the experimental group’s post-test advantage.
These results further demonstrate that van Hiele’s theory offers a robust framework for planning and delivering geometry instruction that leads to improved learning outcomes. Its key features and structured learning phases support systematic progression and provide students at different starting points with opportunities to advance.
Answer to Research Question 3: The findings show that the experimental group, taught with instruction tailored to prior knowledge and structured by van Hiele’s model, made statistically significant gains in geometric thinking over thirteen weeks. The control group, taught using traditional methods, showed little progress, with some signs of stagnation or regression.
These results show that the alternative approach effectively supported progress in geometry learning, likely because it helped students at different starting points strengthen their understanding and progress through the van Hiele levels. Instruction aligned with van Hiele’s theory provides a coherent structure that supports conceptual connections, the development of definitions, and gradual engagement with deductive reasoning. At the same time, the quasi-experimental design, particularly the differences in institution and academic year, requires that conclusions about the effectiveness of the intervention be drawn with appropriate caution.

6. Discussion

The results are discussed in relation to the three research questions concerning pre-service teachers’ levels of geometric thinking in the experimental and control groups before and after tertiary-level instruction. The low initial achievement observed among participants in both groups serves as a clear starting point. It aligns with previous findings showing that many students complete secondary education while still operating at lower levels of geometric thinking (Usiskin, 1982; Crowley, 1987; De Villiers, 1998, 2010). Since university geometry is inherently deductive and therefore presupposes higher levels of geometric reasoning, these results indicate that participants are not adequately prepared for tertiary-level geometry. This conclusion is consistent with earlier studies reporting similar gaps in preparedness (e.g., Armah et al., 2018; Baranović et al., 2020). Such limited readiness poses serious challenges for entering and sustaining participation in university geometry discourse and often leads to persistent difficulties arising from discourse mismatches (Liston & O’Donoghue, 2007), commognitive conflicts (Thoma & Nardi, 2017), and, in some cases, withdrawal from studies (Di Martino et al., 2023). Taken together, these findings point to a structural discontinuity between secondary and tertiary mathematical discourse. As van Hiele (1986) suggests, targeted materials and instructional strategies aligned with students’ levels of geometric thinking offer a promising way forward.
Findings related to the first research question further show that both groups entered the study at predominantly low van Hiele levels, with only a few students reaching higher levels under either criterion. This distribution indicates that many participants possessed limited ability to coordinate properties, recognise invariants, or establish deductive relations. This finding is consistent with earlier research showing that pre-tertiary students often struggle to connect geometric concepts and to progress beyond visual or descriptive reasoning (e.g., Yerushalmy & Chazan, 1990; De Villiers, 1994; Fujita & Jones, 2007; Günhan, 2014). Although this low starting point reflects insufficient prior preparation, it should not be interpreted as a constraint on further learning. Rather, it clearly indicates where instruction must begin. In this sense, applying van Hiele’s (1986) framework offers a structured and developmentally aligned pathway for supporting students’ progression, enabling them to consolidate foundational reasoning and gradually move toward the deductive thinking required at the tertiary level.
Across all evaluation methods, the experimental group’s post-test performance was significantly higher than their pre-test results, whereas the control group showed no significant improvement and, in some cases, even regressed. These findings confirm that instruction tailored to participants’ prior knowledge supports measurable progress, while instruction that does not take prior knowledge into account may fail to do so and can even result in regression. This pattern is consistent with van Hiele’s theory (van Hiele, 1986) and with research linking geometry achievement to the quality and appropriateness of instruction (Usiskin, 1982; Howse & Howse, 2014; Siew et al., 2013; Armah et al., 2018). It also reflects broader evidence that active, student-centred approaches tend to outperform traditional lecture-based teaching (Norton, 2024).
The weaker results in the control group may partly reflect low motivation to retake identical tests when no immediate benefit is perceived. However, the contrast between groups is also pedagogically meaningful: the alternative approach followed van Hiele’s guidelines by adapting instruction to students’ prior knowledge and language, clearly specifying the learning sequence, and employing varied didactic tools. The results therefore show that van Hiele-based teaching effectively supports the development of geometric thinking, a conclusion consistent with previous studies (e.g., van Hiele, 1999; Abdullah & Zakaria, 2012; Siew et al., 2013; Dongwi, 2014; Armah et al., 2018; Armah & Kissi, 2019).
The finding that most experimental-group students progressed or maintained their level, while the control group showed minimal gains and a greater tendency towards stagnation or regression, further confirms the mismatch property: “if a student is at one level and the instruction is at a different level, the desired learning and progress may not occur” (Crowley, 1987). These results also reinforce the property of advancement, which states that “progress between levels depends more on the content and methods of instruction than on age or maturation” (Crowley, 1987). The regression observed in the control group suggests that some participants had not yet consolidated earlier levels, aligning with the concept of cumulative learning (Lee, 2012).
A closer analysis of students’ complete work reveals solid gains across the first three levels in the experimental group, indicating that the observed regression reflects instability at higher levels rather than a lack of learning, consistent also with cumulative learning principles (Lee, 2012). In contrast, the control group shows highly variable post-test results and minimal overall progress, with positive shifts lacking signs of stable development. These patterns reaffirm the sequential nature of the van Hiele model: levels cannot be skipped but have to be mastered step by step (van Hiele, 1986; Chen et al., 2023; González et al., 2025). The difficulty in achieving stability at higher levels without consolidating earlier ones further demonstrates that progression is continuous and layered (Gutiérrez, 1992; González et al., 2025). The presence of unclassified participants also underscores that the levels function as a continuum rather than strictly discrete categories (Usiskin, 1982).
Results related to the second research question indicate that the experimental group achieved statistically significant gains in geometric thinking, while the control group showed minimal progress and occasional decline. These findings highlight the value of instruction that addresses diverse learner profiles and the importance of structured, developmentally aligned teaching for meaningful progress in geometry (van Hiele, 1986; Ding & Jones, 2007; Dongwi, 2014; Armah et al., 2018). Additional qualitative analysis further clarifies the stability of learning: the experimental group showed substantial improvement across several levels, especially the initial ones, whereas the control group exhibited inconsistent and often unstable development. Very few participants reached Levels 4 or 5, particularly under stricter criteria, as their prior knowledge required starting from the basics. Even with exposure to elements of higher levels such as formal assertion, argumentation, and proof, most participants were unable to achieve stable progress to the highest levels within a 13-week period. This pattern confirms van Hiele’s (1986) view that attaining the upper levels of geometric thinking requires extended time and sustained instructional support, especially when learners begin from the initial levels.
Findings related to the third research question show that geometry learning and PST preparation improve when instruction is aligned with students’ prior knowledge and systematically structured within van Hiele’s framework. This conclusion is consistent with previous research (e.g., Crowley, 1987; De Villiers, 1998, 2003, 2010; van Hiele, 1999; Fujita & Jones, 2002; Abdullah & Zakaria, 2012, 2013; Siew et al., 2013; Dongwi, 2014; Howse & Howse, 2014; Armah et al., 2018; Senk et al., 2022). The low proportion of participants reaching Levels 4 and 5 indicates persistent difficulties in grasping the deductive structure of geometry developed through the axiomatic method, a challenge widely noted in the literature (e.g., Usiskin, 1982; De Villiers, 1994; Duval, 1995, 1998; Fujita & Jones, 2007; Ding & Jones, 2007; Günhan, 2014; Thoma & Nardi, 2017; Baranović, 2019). Although the van Hiele model led to substantial progress in the experimental group, the limited movement into the highest levels supports van Hiele’s (1986) view that developing abstract thinking at the top level requires extended time, even with well-designed instruction.

7. Recommendations

The findings of this study lead to several recommendations for improving the teaching and learning of geometry in pre-service teacher education. First, as most participants entered the study at low van Hiele levels, programmes should assess students’ geometric thinking at the outset and use this information to guide instructional planning. The clear contrast between the experimental and control groups demonstrates the importance of aligning instruction with students’ demonstrated levels to avoid mismatch and support meaningful progress.
Second, the significant gains observed in the experimental group further indicate that structured, sequenced instruction following van Hiele’s principles should be incorporated into geometry courses. Such approaches help students consolidate earlier levels and reduce the instability observed at higher levels. In contrast, the minimal progress and occasional regression in the control group highlight the limitations of traditional lecture-based teaching and the need for more active, student-centred learning environments.
Finally, the limited movement into Levels 4 and 5 suggests that developing higher-level deductive reasoning requires extended time and sustained engagement. Teacher-education programmes should therefore allocate sufficient time for foundational geometric reasoning and provide ongoing opportunities for students to work with formal argumentation and proof.

8. Conclusions

This study examined how applying van Hiele’s theory supports the development of geometric thinking in prospective primary teachers. Using a quasi-experimental design with groups from two comparable universities, the findings were interpreted through van Hiele’s model to assess its potential to strengthen geometric reasoning at the tertiary level.
Both groups began with similarly limited geometric knowledge, but after thirteen weeks only the experimental group taught with van Hiele-based instruction showed statistically significant improvement. The control group showed little or no progress. This confirms the effectiveness of van Hiele-aligned teaching in supporting the shift from procedural to deductive geometry. However, because the groups differed in institution and academic year, the conclusions regarding the effectiveness of the intervention should be interpreted with caution, and future studies using fully equivalent groups would help further validate these findings.
van Hiele’s theory emphasises structured progression, alignment with prior knowledge, and sequenced learning experiences that help learners build connections, refine definitions, and gradually engage in deductive reasoning. The results suggest that van Hiele-based instruction provides a coherent, developmentally appropriate approach to strengthening geometric understanding. Further research using additional measures could examine these relationships in greater depth.
Overall, the results highlight the value of integrating van Hiele’s theory into geometry curricula, materials, and teacher education practices. When included in teacher preparation, the framework serves as both a cognitive model and a structured pedagogical approach that supports meaningful engagement with geometry and strengthens future primary mathematics instruction.


9. Research Limitations

Several limitations should be noted. Conducting the study within regular Euclidean geometry courses limited systematic monitoring of individual engagement. The quasi-experimental design with non-equivalent groups also introduces constraints, as differences in age, year of study, and time since last learning geometry may have influenced outcomes. Although the two institutions follow similar curricula, contextual differences cannot be ruled out. The dual role of instructor and researcher is another consideration, as subtle effects related to instructional decisions or expectations may still have occurred despite standardised testing.
The sample included only female pre-service teachers, which limits generalisability. The one-semester duration and use of a single assessment instrument provide only a partial view of geometric reasoning, particularly given the developmental nature of van Hiele level transitions. The need for a modified scoring model and the presence of ‘no fit’ classifications further highlight the value of more detailed qualitative and longitudinal research to capture students’ progression more fully.

Author Contributions

Conceptualization, N.B. and I.B.K.; methodology, N.B. and I.B.K.; software, N.B. and I.B.K.; validation, N.B. and I.B.K.; formal analysis, N.B.; investigation, N.B.; resources, N.B. and I.B.K.; data curation, N.B.; writing—original draft preparation, N.B.; writing—review and editing, N.B. and I.B.K.; visualization, N.B.; supervision, I.B.K.; project administration, I.B.K.; funding acquisition, N.B. All authors have read and agreed to the published version of the manuscript.

Funding

This research was funded by Faculty of Humanities and Social Sciences, University of Split, grant number ID: FFST-INST-2015.

Institutional Review Board Statement

This study was conducted according to the guidelines of the Declaration of Helsinki and approved by the Ethics Committee of the Facutly of Humanities and Social Sciences, University of Split, Split, Croatia. Approval number class: 029-06/25-03/00002, file number: 2181-190-25-00171 with approval granted on 29 June 2025.

Informed Consent Statement

Informed consent was obtained from all subjects involved in the study.

Data Availability Statement

Data presented in this study are available upon request.

Conflicts of Interest

The authors declare no conflicts of interest.

References

  1. Abdullah, A. H., & Zakaria, E. (2012). The activities based on van Hiele’s phase-based learning: Experts’ and preservice teachers’ views. Journal of Mathematics and Statistics, 8(3), 385–395. [Google Scholar] [CrossRef][Green Version]
  2. Abdullah, A. H., & Zakaria, E. (2013). The effects of van Hiele’s phase-based instruction using the Geometer’s Sketchpad (GSP) on students’ levels of geometric thinking. Research Journal of Applied Sciences, Engineering and Technology, 5(5), 1652–1660. [Google Scholar] [CrossRef]
  3. Arcavi, A. (2003). The role of visual representations in the learning of mathematics. Educational Studies in Mathematics, 52(3), 215–241. [Google Scholar] [CrossRef]
  4. Armah, R. B., Cofie, P. O., & Okpoti, C. A. (2018). Investigating the effect of van Hiele phase-based instruction on pre-service teachers’ geometric thinking. International Journal of Research in Education and Science (IJRES), 4(1), 314–330. [Google Scholar] [CrossRef]
  5. Armah, R. B., & Kissi, P. S. (2019). Use of the van Hiele theory in investigating teaching strategies used by college of education geometry tutors. EURASIA Journal of Mathematics, Science and Technology Education, 15(4), em1694. [Google Scholar] [CrossRef] [PubMed]
  6. Baranović, N. (2019). Pre-service primary education teachers’ knowledge of relationships among quadrilaterals. In J. Milinković, & Z. Kadelburg (Eds.), Research in mathematics education (pp. 112–127). Mathematical Society of Serbia. Available online: https://dms.rs/wp-content/uploads/2019/12/Zbornik-ERME.pdf (accessed on 15 September 2025).
  7. Baranović, N. (2024). Teaching and learning geometry of pre-service primary education teachers based on the visual-analytical method of directed observation. In A. Gutiérrez Rodrigues, T. Lowrie, & F. Emprin (Eds.), Proceedings of the twenty-sixth ICMI study: Advances in geometry education (pp. 149–156). IREM de Reims. Available online: https://hal.science/hal-04577863 (accessed on 15 September 2025).
  8. Baranović, N., Abboud, M., Emprin, F., Mangiante, C., & Mwadzaangati, L. (in press). Teacher training, approaches and strategies: Opportunities and affordances. In A. Gutiérrez, & T. Lowrie (Eds.), Advances in geometry education. The 26th ICMI study. Springer.
  9. Baranović, N., Baras, I., & Kožul Blaževski, R. (2020). Kako premostiti razliku između onoga što studenti prve godine znaju i onoga što mi mislimo da bi trebali znati [How to bridge the gap between what first-year students know and what we think they should know]. Poučak: Časopis za Metodiku i Nastavu Matematike, 21(81), 13–33. [Google Scholar]
  10. Bishop, A. J. (1986). What are some obstacles to learning geometry? In R. Morris (Ed.), Studies in mathematics education (Vol. 5, pp. 141–159). UNESCO. [Google Scholar]
  11. Chen, Y.-H., Hsu, C.-L., Wu, Y.-J., Yi, Z., Wang, Y., & Thompson, D. R. (2023). Exploring attribute hierarchies of the van Hiele theory using diagnostic classification modeling and structural equation modeling. University of Chicago. [Google Scholar] [CrossRef]
  12. Clements, D. H., & Battista, M. T. (1990). The effects of Logo on children’s conceptualizations of angle and polygons. Journal for Research in Mathematics Education, 21(5), 356–371. [Google Scholar] [CrossRef] [PubMed]
  13. Cohen, L., Manion, L., & Morrison, K. (2007). Research methods in education. Routledge. [Google Scholar]
  14. Crowley, M. L. (1987). The van Hiele model of the development of geometric thought. In M. M. Lindquist (Ed.), Learning and teaching geometry, K–12: 1987 yearbook of the national council of teachers of mathematics (pp. 1–16). National Council of Teachers of Mathematics. [Google Scholar]
  15. De Villiers, M. (1994). The role and function of a hierarchical classification of quadrilaterals. For the Learning of Mathematics, 14(1), 11–18. [Google Scholar]
  16. De Villiers, M. (1998). To teach definitions in geometry or teach to define? In A. Olivier, & K. Newstead (Eds.), Proceedings of the 22nd conference of the international group for the psychology of mathematics education (Vol. 2, pp. 248–255). University of Stellenbosch. Available online: https://www.researchgate.net/publication/255605686 (accessed on 10 October 2025).
  17. De Villiers, M. (2003). Rethinking proof with the Geometer’s sketchpad. Key Curriculum Press. [Google Scholar]
  18. De Villiers, M. (2010). Some reflections on the van Hiele theory. In Proceedings of the 4th congress of teachers of mathematics of the Croatian mathematical society (pp. 559–588). Croatian Mathematical Society. [Google Scholar]
  19. Di Martino, P., Gregorio, F., & Iannone, P. (2023). The transition from school to university in mathematics education research: New trends and ideas from a systematic literature review. Educational Studies in Mathematics, 113(1), 7–34. [Google Scholar] [CrossRef] [PubMed]
  20. Ding, L., & Jones, K. (2007). Using the van Hiele theory to analyse the teaching of geometrical proof at grade 8 in Shanghai. In D. Pitta-Pantazi, & G. Philippou (Eds.), Proceedings of the fifth congress of the European society for research in mathematics education (pp. 612–621). ERME. Available online: https://eprints.soton.ac.uk/45354/ (accessed on 19 October 2025).
  21. Dongwi, B. L. (2014). Using the van Hiele phases of instruction to design and implement a circle geometry teaching programme in a secondary school in Oshikoto region: A Namibian case study [Master’s thesis, University of Namibia]. University of Namibia Repository. Available online: https://repository.unam.edu.na/handle/11070/2174 (accessed on 19 October 2025).
  22. Duval, R. (1995). Geometrical pictures: Kinds of representation and specific processes. In R. Sutherland, & J. Mason (Eds.), Exploiting mental imagery with computers in mathematical education (pp. 142–157). Springer. [Google Scholar] [CrossRef]
  23. Duval, R. (1998). Geometry from a cognitive point of view. In C. Mammana, & V. Villani (Eds.), Perspectives on the teaching of geometry for the 21st century (pp. 37–52). Kluwer Academic Publishers. [Google Scholar] [CrossRef]
  24. Firmanti, P. (2022). Student’s cognitive conflict in geometry learning. Al-Ishlah: Jurnal Pendidikan, 14(3), 4713–4722. [Google Scholar] [CrossRef]
  25. Fischbein, E. (1993). The theory of figural concepts. Educational Studies in Mathematics, 24(2), 139–162. [Google Scholar] [CrossRef]
  26. Fujita, T., & Jones, K. (2002). The bridge between practical and deductive geometry: Developing the “geometrical eye”. In A. D. Cockburn, & E. Nardi (Eds.), Proceedings of the 26th conference of the international group for the psychology of mathematics education (Vol. 2, pp. 384–391). University of East Anglia. [Google Scholar]
  27. Fujita, T., & Jones, K. (2007). Learners’ understanding of the definitions and hierarchical classification of quadrilaterals: Towards a theoretical framing. Research in Mathematics Education, 9(1), 3–20. [Google Scholar] [CrossRef]
  28. González, A., Gallego-Sánchez, I., Gavilán-Izquierdo, J. M., & Puertas, M. L. (2025). Assessing graph theory students’ use and formulation of definitions through the van Hiele model. International Journal of Research in Undergraduate Mathematics Education, 12, 65–90. [Google Scholar] [CrossRef]
  29. Gueudet, G., & Thomas, M. (2020). Secondary–tertiary transition in mathematics education. In S. Lerman (Ed.), Encyclopedia of mathematics education (2nd ed., pp. 762–766). Springer. [Google Scholar] [CrossRef]
  30. Gutiérrez, Á. (1992). Exploring the links between van Hiele levels and 3-dimensional geometry. Structural Topology, 18, 31–48. Available online: https://www.uv.es/Angel.Gutierrez/archivos1/textospdf/Gut92a.pdf (accessed on 20 September 2025).
  31. Günhan, B. C. (2014). An investigation of pre-service elementary school teachers’ knowledge concerning quadrilaterals. Çukurova University Faculty of Education Journal, 43(1), 1–17. [Google Scholar] [CrossRef]
  32. Hoffer, A. (1981). Geometry is more than proof. Mathematics Teacher, 74(1), 11–18. [Google Scholar] [CrossRef]
  33. Howse, T. D., & Howse, M. E. (2014). Linking the van Hiele theory to instruction. Teaching Children Mathematics, 21(5), 305–313. [Google Scholar] [CrossRef]
  34. Idris, N. (1998). Spatial visualization, field dependence/independence, van Hiele level and achievement in geometry: The influence of selected activities for middle school students [Doctoral dissertation, The Ohio State University]. [Google Scholar]
  35. International Association for the Evaluation of Educational Achievement (IEA). (2017). TIMSS 2017 international results in mathematics and science. IEA. [Google Scholar]
  36. Kalyankar, V. K. (2019). The van Hiele analysis of curricular materials: A comparative study [Doctoral dissertation, University of Arkansas]. ScholarWorks@UARK. Available online: https://scholarworks.uark.edu/etd/3511/ (accessed on 7 December 2025).
  37. Lee, J. M. (2012). Cumulative learning. In N. M. Seel (Ed.), Encyclopedia of the sciences of learning (pp. 887–893). Springer. [Google Scholar]
  38. Liston, M., & O’Donoghue, J. (2007). The transition from secondary school mathematics to university mathematics. In British educational research association annual conference. Institute of Education, University of London. [Google Scholar]
  39. Lund, T. (2012). Combining qualitative and quantitative approaches: Some arguments for mixed methods research. Scandinavian Journal of Educational Research, 56(2), 155–165. [Google Scholar] [CrossRef]
  40. Mason, M. M. (1989, March 27–31). The van Hiele levels of geometric understanding. Annual meeting of the american educational research association, San Francisco, CA, USA. [Google Scholar]
  41. Mbatha, M., & Bansilal, S. (2023). Using the van Hiele theory to explain pre-service teachers’ understanding of similarity in Euclidean geometry. Education Sciences, 13(9), 861. [Google Scholar] [CrossRef]
  42. Meissner, H. (1986). Cognitive conflicts in mathematics learning. European Journal of Psychology of Education, 1(2), 7–15. [Google Scholar] [CrossRef]
  43. Nakahara, T. (2007, December 9–14). Cultivating mathematical thinking through representation—Utilizing the representational system [Plenary paper]. APEC–Tsukuba international conference III: Innovation of classroom teaching and learning through lesson study, Tokyo/Kanazawa/Kyoto, Japan. Available online: https://www.criced.tsukuba.ac.jp/math/apec/apec2008/papers/PDF/1.Keynote%28Dec.9%29_Tadao_Nakahara_Japan.pdf (accessed on 10 August 2025).
  44. Norton, B. J. (2024). Comparing traditional and modern teaching methods in mathematics education: Effects on undergraduate students’ achievement and motivation. Psi Chi Journal of Psychological Research, 29(2), 150–160. [Google Scholar] [CrossRef]
  45. Nunnally, J. C. (1978). Psychometric theory (2nd ed.). McGraw-Hill. [Google Scholar]
  46. Organisation for Economic Co-Operation and Development (OECD). (2014). PISA 2012 results: What students know and can do—Student performance in mathematics, reading and science (revised ed., Vol. I). OECD Publishing. [Google Scholar]
  47. Pegg, J. (2020). The van Hiele theory. In S. Lerman (Ed.), Encyclopedia of mathematics education (pp. 896–900). Springer. [Google Scholar] [CrossRef]
  48. Presmeg, N. C. (1986). Visualization in high school mathematics. For the Learning of Mathematics, 6(3), 42–46. [Google Scholar]
  49. Senk, S. L., Thompson, D. R., Chen, Y.-H., Voogt, K., & Usiskin, Z. (2022). The van Hiele Geometry Test: History, use, and suggestions for revisions. University of Chicago School Mathematics Project. Available online: https://ucsmp.uchicago.edu/resources/van-hiele/ (accessed on 28 December 2025).
  50. Siew, N. M., Chong, C. L., & Abdullah, M. R. (2013). Facilitating students’ geometric thinking through van Hiele’s phase-based learning using tangram. Journal of Social Sciences, 9(3), 101–111. [Google Scholar] [CrossRef]
  51. Tabach, M. (2011). The dual role of researcher and teacher: A case study. For the Learning of Mathematics, 31(2), 32–34. [Google Scholar]
  52. Teppo, A. (1991). van Hiele levels of geometric thought revisited. The Mathematics Teacher, 84(3), 210–221. Available online: http://www.jstor.org/stable/27967094 (accessed on 21 September 2025). [CrossRef]
  53. Thoma, A., & Nardi, E. (2017). Transition from school to university mathematics: Manifestations of unresolved commognitive conflict in first year students’ examination scripts. International Journal of Research in Undergraduate Mathematics Education, 4(1), 161–180. [Google Scholar] [CrossRef]
  54. Usiskin, Z. (1982). van Hiele levels and achievement in secondary school geometry: Final report of the cognitive development and achievement in secondary school geometry project. University of Chicago. [Google Scholar]
  55. van Hiele, P. M. (1986). Structure and insight: A theory of mathematics education. Academic Press. [Google Scholar]
  56. van Hiele, P. M. (1999). Developing geometric thinking through activities that begin with play. Teaching Children Mathematics, 5(6), 310–316. [Google Scholar] [CrossRef]
  57. Witzke, I. (2016). The problem of transition from school to university mathematics. University of Siegen. Available online: https://www.uni-siegen.de/fb6/didaktik/personen/ingo-witzke/ (accessed on 5 September 2025).
  58. Yerushalmy, M., & Chazan, D. (1990). Overcoming visual obstacles with the aid of the Supposer. Educational Studies in Mathematics, 21(3), 199–219. [Google Scholar]
  59. Žilková, K. (2015). Misconceptions in pre-service primary education teachers about quadrilaterals. Journal of Education, Psychology and Social Sciences, 3(1), 30–37. [Google Scholar]
Figure 1. Research design.
Education 16 01221 g001
Figure 2. van Hiele model of thinking development (Baranović, 2019).
Education 16 01221 g002
Figure 3. Distribution according to criterion 1CVH3.
Education 16 01221 g003
Figure 4. Distribution according to criterion 1CVH4.
Education 16 01221 g004
Figure 5. Distribution according to criterion 1MVH3.
Education 16 01221 g005
Figure 6. Distribution according to criterion 1MVH4.
Education 16 01221 g006
Table 1. Points earned and VH opinion levels.
LevelPoints by LevelPoints for CVH Model by LevelPoint for CVH Model
by “No Fit”
Point for
MVH Model
0002 (0 + 2) 0 or 16
1114 (0 + 0 + 4)1 or 17
223 (1 + 2)5 (1 + 0 + 4)3 or 19
347 (1 + 2 + 4)9 (1 + 0 + 0 + 8) 7 or 23
4815 (1 + 2 + 4 + 8)11 (1 + 2 + 0 + 8) 15 or 31
51631 (1 + 2 + 4 + 8 + 16)13 (1 + 0 + 4 + 8) etc.-
Table 2. Comparison of achievements on the VH test between groups before the intervention.
Experimental GroupControl GroupMann–Whitney U
CriterionNMSDNMSDUZp (2-Tailed)r
1VH3465.8705.898345.5595.004756.00–0.270.787–0.030
1CVH3402.2250.768292.1030.817545.50–0.470.640–0.057
1MVH3432.1630.688302.0670.828605.00–0.500.618–0.059
1VH4462.6702.99343.7114.60674.00–1.110.268–0.124
1CVH4371.4860.768301.5670.679511.00–0.610.543–0.075
1MVH4381.5000.762311.5480.675558.50–0.400.686–0.048
Table 3. Spearman correlation coefficient between different forms of test evaluation.
1VH31CVH31MVH31VH41CVH41MVH4
1VH3-1.000 **0.788 **0.599 **0.487 **0.459 **
1CVH3 -1.000 **0.591 **0.572 **0.572 **
1MVH3 -0.514 **0.574 **0.578 **
1VH4 -1.000 **0.937 **
1CVH4 -1.000 **
1MVH4 -
** p < 0.01.
Table 4. Comparison of achievements within groups before and after the intervention.
Experimental GroupControl Group
CriterionMSDZp (2-Tailed)rMSDZp (2-Tailed)r
2VH3—1VH33.9767.914–2.8960.004–0.452–0.1948.154–0.6180.537–0.111
2CVH3—1CVH30.7270.876–3.6360.000–0.568–0.3810.805–1.9990.046–0.359
2MVH3—1MVH30.7370.795–2.6650.008–0.416–0.3480.832–1.8900.059–0.339
2VH4—1VH41.9513.794–4.1180.000–0.643–2.1295.012–2.2760.023–0.409
2CVH4—1CVH40.5860.983–2.7860.005–0.435–0.3750.770–2.1790.029–0.391
2MVH4—1MVH40.6000.969–2.8960.004–0.452–0.4000.764–2.3520.019–0.422
Table 5. Frequency distribution according to the CVH3 criterion for both groups.
N = 41E2CVH3N = 31C2CVH3
LevelsE1CVH3012345No FitC1CVH3012345No Fit
00 0
14 13 5 1 4
224 893 413 471 1
37 421 7 124
41 1 1 1
51 1 0
No fit4 12 15112 1
Table 6. Frequency distribution according to the CVH4 criterion for both groups.
N = 41E2CVH4N = 31C2CVH4
LevelsE1CVH4012345No FitC1CVH4012345No Fit
0321 1 1
1151246 29152 1
2131 82 216168 1
32 11 1 1
40 0
50 0
No fit8 1121 34121
Table 7. Frequency distribution according to the MVH3 criterion for both groups.
N = 41E2MVH3N = 31C2MVH3
LevelsE1MVH301234No FitC1MVH301234No Fit
00 0
15 14 61 1 4
225 10113113 472
37 43 7 124
42 11 1 1
No fit2 11 4 13
Table 8. Frequency distribution according to the MVH4 criterion for both groups.
N = 41E2MVH3N = 31C2MVH3
LevelsE1MVH301234No FitC1MVH301234No Fit
0321 1 1
1151246 210252 1
2141 83 216168 1
32 11 1 1
40 0
No fit7 111133 21
Table 9. Comparison of achievements on the VH test between groups after the intervention.
Experimental GroupControl GroupMann–Whitney U
CriterionNMSDNMSDUZp (2-Tailed)r
2VH3469.5006.931336.4246.937473−2.9390.003–0.331
2CVH3392.8970.754251.8800.781188−4.3950.000–0.549
2MVH3442.8410.680291.9310.753265−4.5170.000–0.529
2VH4464.3023.46331.7631.20389.5−3.7890.000–0.426
2CVH4382.0261.078301.2670.640306.5−3.4190.001–0.415
2MVH4382.0261.078301.2670.640306.5−3.4190.001–0.415
Disclaimer/Publisher’s Note: The statements, opinions and data contained in all publications are solely those of the individual author(s) and contributor(s) and not of MDPI and/or the editor(s). MDPI and/or the editor(s) disclaim responsibility for any injury to people or property resulting from any ideas, methods, instructions or products referred to in the content.