Review

Teaching and Teacher Educating Data Literacy in K-12 STEM Education: Looking Back, Moving Forward (AA)

by
Azita Manouchehri
1,* and
Aula Andika Fikrullah Al Balad
2
1
Faculty of STEM Education/College of Education and Human Ecology, The Ohio State University, Columbus, OH 43210, USA
2
STEM Education, Department of Teaching and Learning/College of Education and Human Ecology, The Ohio State University, Columbus, OH 43210, USA
*
Author to whom correspondence should be addressed.
Educ. Sci. 2026, 16(6), 860; https://doi.org/10.3390/educsci16060860 (registering DOI)
Submission received: 15 February 2026 / Revised: 25 May 2026 / Accepted: 26 May 2026 / Published: 29 May 2026
(This article belongs to the Special Issue Data Literacy in STEM Education)

Abstract

The growing centrality of data in contemporary society has intensified calls to expand data literacy across K–12 education, positioning teachers as key agents in this effort. This article traces the emergence of data literacy as a domain of educational research and reports findings from a systematic review of empirical studies on K–12 STEM teacher data literacy published between 2015 and 2025. Guided by the PRISMA framework, searches of Academic Search Complete, APA PsycINFO, and supplementary sources yielded a final sample of 26 studies. The review examines (1) what has been prioritized in research on teaching data literacy and (2) the conceptual models used to study data literacy in educational contexts. Findings indicate that existing research primarily emphasizes teachers’ knowledge, beliefs, and use of technological tools, with comparatively limited attention to classroom enactment and student learning. Conceptually, the field is characterized by the use of diverse and often disconnected frameworks, including competency-based, statistical reasoning, and pedagogical models, resulting in a fragmented knowledge base. We argue that this fragmentation stems from underlying epistemological, methodological, and contextual tensions that have yet to be theoretically reconciled. In response, we propose an integrative perspective that conceptualizes data literacy as a situated, practice-based, and socio-epistemic phenomenon. This framing highlights the dynamic interplay among interpretive reasoning, instructional design, mediational tools, and contextual conditions. Advancing the field requires moving beyond isolated lines of inquiry toward theoretically coherent approaches that connect teacher cognition, instructional practice, and student learning in order to support meaningful and equitable participation in a data-driven world.

1. Introduction

The notion of data literacy and the need to expand individuals’ capacity in this area have gained global attention in recent years. In a world where nearly every interaction is mediated through data (Desjardins, 2019; Estrellado et al., 2021), productive citizenship increasingly relies on the ability to read, interpret, and make decisions based on data. Recognizing this need, professional organizations have advocated for the formal advancement of data science and data literacy education. In the United States, for instance, the Next Generation Science Standards (NGSS) (NGSS Lead States, 2013) and the Common Core State Standards for Mathematics (Common Core State Standards Initiative, 2010) highlight data education as a core practice, requiring K–12 students to collect, analyze, and interpret data within the context of scientific inquiry and engineering design. Students are expected to engage actively with data, construct explanations, and design solutions to complex problems.
Internationally, similar efforts have been underway. Forbes (2014) noted that New Zealand has integrated data and statistics into its pre-university curriculum. In Europe, Scotland implemented a national data education program, fully supported by the Scottish and UK governments through initiatives such as Data Schools (n.d.). The United Nations Educational, Scientific and Cultural Organization (UNESCO, 2022) has developed curricula targeting data literacy, enhanced with artificial intelligence, specifying skills and outcomes across elementary, lower, and upper secondary levels. These curricula have been endorsed by eleven governments with the goal of broad school implementation. The Organization for Economic Co-operation and Development (OECD) Learning Compass 2030 emphasizes that preparing students for the 21st century requires knowledge, skills, attitudes, and values beyond traditional literacy and numeracy, including data and digital literacy, health, and social–emotional skills (OECD, 2019). Teachers are recognized as central to fostering these skills in students.
As efforts to advance data literacy in school populations continue, it is important to examine previous research to identify areas requiring further attention. This article summarizes key priorities in studies on teaching data literacy in STEM education and the conceptual models used by researchers to study curriculum and instruction, with the goal of highlighting gaps and guiding future scholarly inquiry. We specifically aim to examine: (1) what has been prioritized in research on teaching data literacy, and (2) what conceptual models have been used to study data literacy in educational settings.

2. Defining Data Literacy

The concept of data literacy has its roots in statistical literacy, where early discussions emphasized the evaluation of information as a central component (Shields, 2005; Bieza, 2020). The formal development of statistics accelerated in the early to mid-20th century, leading to gradual transformations in school curricula that incorporated statistical thinking and data-based reasoning. This shift was strongly influenced by John Tukey, whose advocacy for data-centered thinking and exploratory data analysis helped shape modern approaches to statistics education (Wild et al., 2018). Increased national attention and funding during the 1980s and 1990s further supported these developments (Scheaffer, 1988). During this period, the growing use of technology in data analysis expanded the scope of statistical literacy beyond procedural competence, emphasizing its role in supporting informed decision-making and social participation.
Since then, data literacy has been defined in multiple ways depending on context and purpose. Broadly, it is understood as the ability to understand how data are generated and to use them effectively for informed decision-making (Mandinach & Gummer, 2016; Ridsdale et al., 2015). More expansive definitions highlight capacities such as selecting, analyzing, visualizing, interpreting, and communicating data, including the ability to construct narratives from data (Wolff et al., 2016). Within educational contexts, data literacy has been further conceptualized as the ability to transform diverse forms of data into actionable instructional knowledge that informs teaching practice (Gummer & Mandinach, 2015). More importantly, scholars emphasize that data literacy builds on statistical literacy, requiring foundational competencies such as interpreting graphs, analyzing trends, and reasoning about data (Wahid et al., 2018; Ridsdale et al., 2015). This has led to calls for integrating data literacy into teacher education, enabling teachers to design meaningful tasks, analyze student thinking, and adapt instruction accordingly (Mandinach & Gummer, 2016; Williams & Coles, 2007; Bauer & Prenzel, 2012).
Early perspectives framed data interpretation primarily as a tool for decision-making (Chen, 1976). Over time, this view expanded to encompass a broader set of competencies required in a data-driven society, including the ability to interpret, critique, and draw insights from complex datasets (Martin, 2014; Wolff et al., 2016). Across definitions, there is general agreement that data literacy involves not only understanding data but also using it to inform decisions, communicate insights, and engage in design-oriented processes.
In educational settings, engaging with data and making informed decisions are central to the knowledge and practices that instruction must support. As a result, increasing attention has been directed toward teachers’ roles, practices, and knowledge in relation to data use. This focus gained momentum following initiatives such as the Conference Board of the Mathematical Sciences (2012), which emphasized the importance of strengthening teachers’ preparation in statistics. This work informed the development of the Statistical Education of Teachers (SET) guidelines, which outlined key domains of knowledge for both pre-service and in-service teachers. These recommendations stressed the importance of conceptual understanding, statistical problem solving, and the development of habits of mind characteristic of statistical thinking, including reasoning, modeling, and generalizing. The guidelines also identified the GAISE framework as a central resource for informing curriculum and professional development across K–16 education. Although initially developed within the United States, the GAISE I framework has been widely adopted and referenced internationally (Franklin et al., 2007).
Foundational research in statistics education provides an important basis for contemporary approaches to data literacy. Rubin (2020) traces the development of reasoning with data, highlighting key constructs such as variability, distribution, and informal inferential reasoning. This work underscores that meaningful engagement with data extends beyond procedural fluency to include the interpretation of patterns, uncertainty, and context.
Building on this foundation, the GAISE II report, developed by the American Statistical Association, provides a comprehensive framework for K–12 statistics and data science education (Bargagliotti et al., 2020). GAISE II emphasizes the statistical problem-solving process, the use of authentic data, and the integration of computational thinking, reflecting a shift toward interdisciplinary and applied approaches. This evolution has been shaped in part by the increasing availability of large-scale datasets and policy initiatives in the United States, including the No Child Left Behind Act and the Every Student Succeeds Act (ESSA, 2015), which elevated the role of data in educational decision-making. Similar developments have occurred internationally, further expanding the scope of data literacy beyond its origins in mathematics education.
In positioning data literacy within this broader policy and disciplinary landscape, the Data Literacy for Teacher (DLFT) framework proposed by Ellen Mandinach and Edith Gummer offered a critical bridge between abstract conceptions of data use and the realities of classroom practice (Mandinach & Gummer, 2016). By extending Shulman’s (1986) notion of pedagogical content knowledge, the authors made visible the specialized knowledge teachers must mobilize to transform data into instructional action. Importantly, this model situated data literacy not as an isolated competency, but as deeply intertwined with teachers’ understanding of learners, contexts, and purposes—an orientation that aligns with the broader emphases of American Statistical Association’s GAISE II framework and policy shifts such as the No Child Left Behind Act and Every Student Succeeds Act. As such, the DLFT framework not only proposed what teachers need to know, but also underscored that meaningful data use emerges through the integration of these knowledge domains in practice, reinforcing a view of data literacy as inherently situated, interpretive, and decision-oriented.
Since its conception, the DLFT framework has become one of the most widely recognized and frequently cited conceptualizations of teacher data literacy, cited across teacher data literacy research, though the practicality of its use as an analytical framework has been limited.

3. Methodology

3.1. Search Strategy and Data Sources

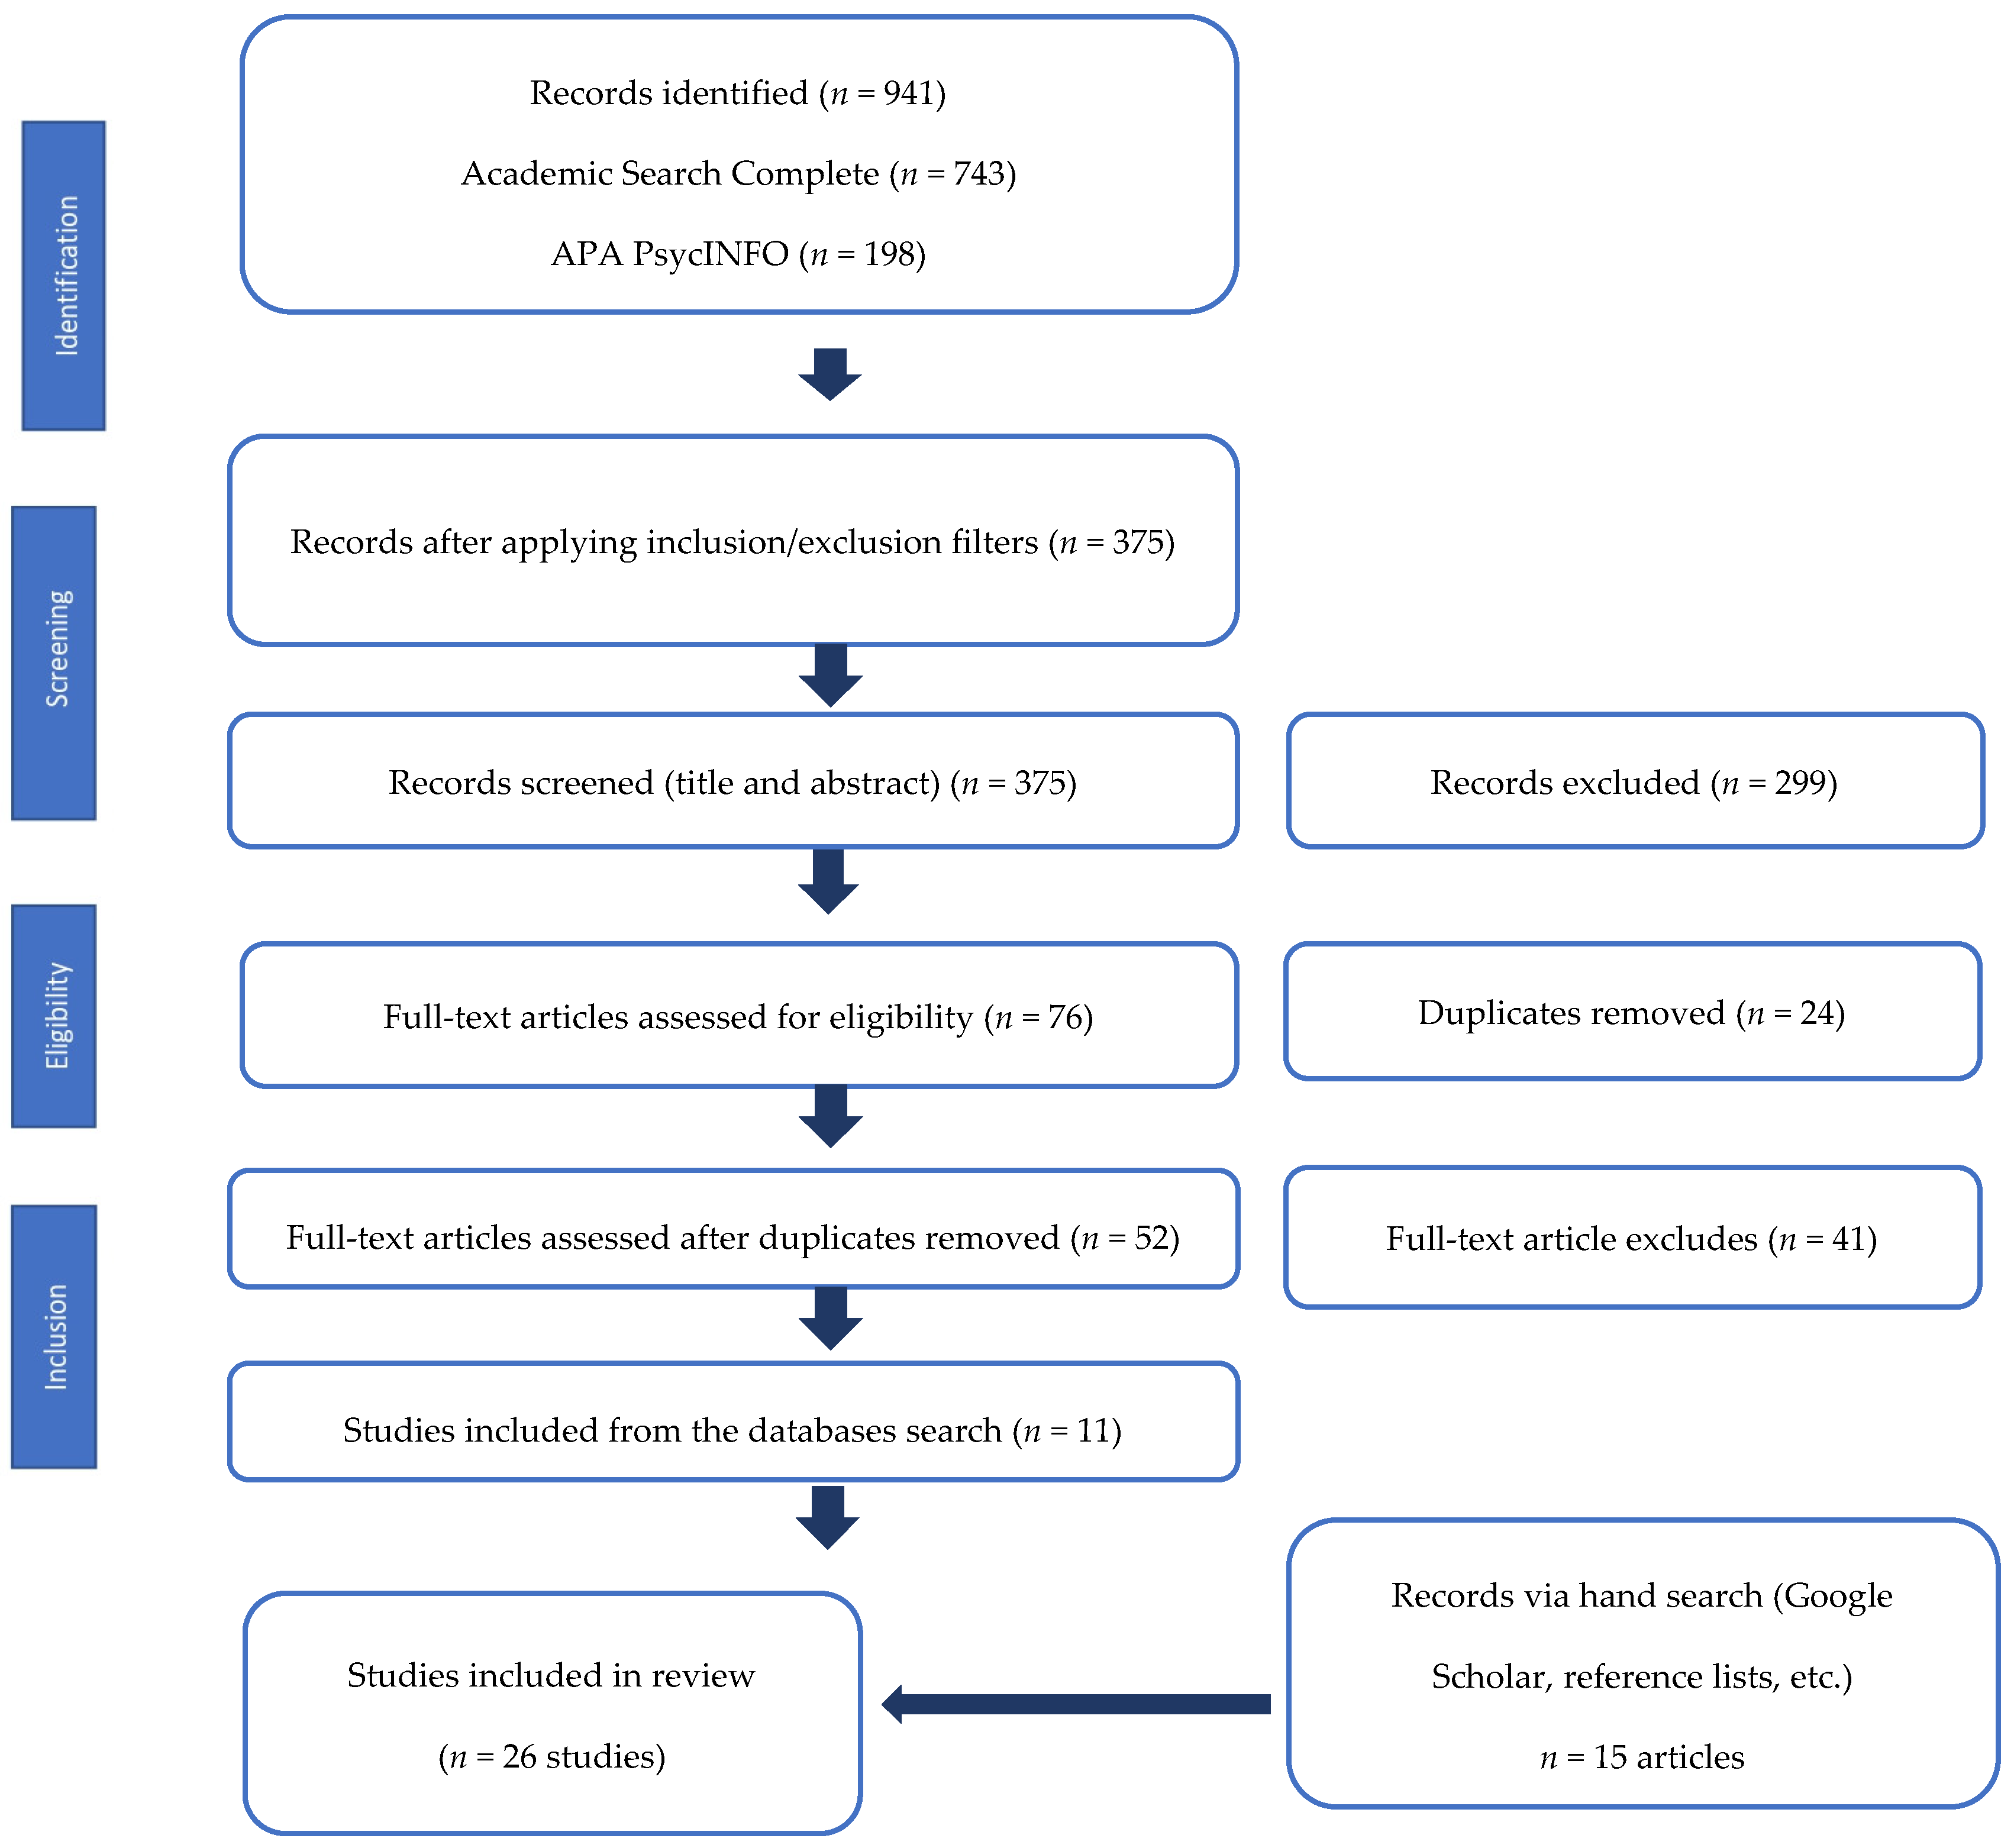
Methodologically, we aim not only to map the landscape of STEM teacher data literacy studies in the past couple of years, but more importantly to critically engage with how data are generated in the educational setting and which conceptual models are most frequently used by researchers. Therefore, we conducted a systematic review with thematic synthesis, following the Preferred Reporting Items for Systematic Reviews and Meta-Analyses (PRISMA) framework (Moher et al., 2009) to ensure the transparency and rigor of the process (see Figure 1). A summary of the search and selection procedures is presented in Figure 2.
The review proceeded in several stages. First, we identified relevant keywords and conducted database searches in Academic Search Complete and APA PsycINFO in early October 2025. These databases were selected for their broad and complementary coverage of research across the humanities, social sciences, and STEM education, making them well suited for capturing interdisciplinary scholarship on data literacy. The search string combined terms related to “data literacy,” “statistical literacy,” “evidence-based,” “STEM education,” “science education,” “science teaching,” “science learning,” “science instruction,” and “K–12 teachers.”
In the initial screening phase, a structured search across both databases yielded 743 records from Academic Search Complete and 198 from APA PsycINFO, resulting in a total of 941 articles. This process confirmed that the term data literacy is widely used beyond educational contexts—including health, business, media, and government—and frequently appears in non-English publications (e.g., Umbach, 2022; Jewell et al., 2020; Gichohi, 2020; Federer et al., 2016; Hamilton et al., 2022; Hagen, 2022; Nguyen & Hekman, 2024).
To ensure rigor, the search strings and Boolean operators were iteratively refined alongside the development of formal inclusion and exclusion criteria. However, narrower search combinations risked excluding potentially relevant studies. Therefore, a broader search strategy was maintained to maximize coverage and minimize the risk of omission during the identification stage (see Table 1).

3.2. Inclusion and Exclusion Criteria

Following the screening phase, eligibility criteria were applied to determine studies for full-text review. Inclusion criteria were (a) availability of full text, (b) focus on K–12 STEM teachers, (c) inclusion of references, (d) publication in peer-reviewed journals, (e) publication within the past decade (2015–October 2025), (f) publication in English, and (g) empirical research design.
Studies were excluded at the eligibility stage if they did not meet these criteria. Specifically, exclusion criteria included (a) no accessible full text, (b) focus outside STEM education (e.g., music, health, or government contexts), (c) non-peer-reviewed sources, including book reviews, magazines, trade publications, and non-empirical review articles (e.g., systematic, scoping, or editorial reviews), (d) publication in a language other than English, and (e) publication prior to 2015. After applying these criteria, 375 records remained for further review.

3.3. Screening and Selection Process

In the subsequent screening stage, titles and abstracts were reviewed to assess alignment with the study focus on data literacy in K–12 STEM education, with particular attention to teacher populations. Studies that referenced data literacy but did not address STEM contexts or K–12 teachers were excluded. For example, Nguyen and Beijnon (2024) examined communication practices related to critical data literacy without a focus on STEM education or teachers, while Palsa and Mertala (2024) investigated data literacy in the context of recreational running. Such studies were therefore excluded from further analysis.
This stage yielded 76 studies. Duplicate records were then removed using Zotero 9 reference management software, including its automated duplicate detection function across databases. After deduplication, 52 studies remained for full-text review. Full-text articles were then assessed for eligibility, resulting in a final set of 11 studies included in the synthesis.
The reduction from 52 full-text articles to 11 included studies reflects the specificity of the review focus rather than methodological error. Instead, it highlights a substantive feature of the field: while “data literacy” is widely used across domains, empirical studies explicitly examining K–12 STEM teachers remain limited.

3.4. Expanded Search Strategy

The limited number of eligible studies identified through database searches indicated that research on data literacy in STEM education, particularly with a focus on teachers, remains underdeveloped. To address this limitation and enhance the comprehensiveness of the review, a snowballing search strategy was employed, consistent with established systematic review practices for identifying studies not captured through database searches. This involved supplementary searches in Google Scholar as well as systematic examination of reference lists from all studies that met the inclusion criteria. Snowballing is particularly appropriate in emerging and interdisciplinary fields, where relevant work may be dispersed across journals and not consistently indexed in major databases. Through this process, 15 additional studies were identified, resulting in a final sample of 26 studies included for full-text analysis and synthesis. To further reduce publication bias and capture emerging empirical work, dissertations were also included. This decision was intentional: dissertations typically provide more comprehensive methodological detail, whereas conference proceedings often present preliminary findings with limited methodological reporting. As such, dissertations offered a more robust source of evidence for this review.

3.5. Data Coding and Validation Strategy

A systematic thematic synthesis was conducted to ensure methodological rigor. Each of the 26 articles was read in full, and key information—including research context, methodology, theoretical framework, and findings—was systematically extracted. The analysis was then organized into thematic categories aligned with the study’s research questions. To enhance analytic rigor, coding was conducted independently, followed by collaborative refinement of themes through an iterative consensus process, ensuring that the final synthesis was firmly grounded in the data.

4. Results

4.1. Trends and Themes of Research on Teachers and Teaching of Data Literacy

Due to its historical positioning within mathematics curricula, research on data literacy remains disproportionately concentrated in mathematics and statistics, with comparatively limited attention to other STEM domains such as physics, biology, engineering, computer science, and chemistry (Engledowl & Tarr, 2020; Leavy et al., 2021). While this concentration reflects the field’s origins, it also signals a narrowing of scope that may constrain broader conceptualizations of data literacy as a cross-disciplinary practice. At the same time, the literature has expanded in recent years, particularly in relation to teachers’ roles in designing and enacting data-focused instruction. However, closer examination reveals that this growth is uneven, with research clustering around a limited set of themes rather than offering a comprehensive account of teaching and learning. Table 2 offers an overview of studies reviewed along with their key findings.
Across studies, three dominant lines of inquiry reveal (1) teachers’ knowledge, beliefs, and dispositions toward data literacy, (2) the development and application of models intended to support teacher learning, and (3) the use of technological tools to mediate engagement with data. While these strands provide important insights, they also reflect a tendency to prioritize teacher-related constructs over analyses of classroom practice and student learning.
Research on teachers’ knowledge and reasoning consistently points to a gap between procedural competence and deeper conceptual understanding (see Table 2). For instance, Merk et al. (2020) found that teachers often demonstrated low baseline data literacy, leading to a reliance on their intuition rather than systematic evidence-based decision-making (Kippers et al., 2018). This struggle is exacerbated by high ‘learning costs’ and administrative loads that prevent the translation of statistical knowledge into instructional actions (J. Lee & Lee, 2025). Quiroz (2025) found that elementary teachers often lack pedagogical content knowledge (PCK) and mathematical background. Studies of both pre-service and in-service teachers indicate that while individuals can often interpret basic representations or apply familiar procedures, they struggle to connect statistical ideas, justify their reasoning, or apply concepts in socially meaningful contexts (Çebi et al., 2022; Wu et al., 2023; Engledowl & Tarr, 2020; Wahid et al., 2018). This pattern suggests that existing approaches to teacher preparation may emphasize isolated skills rather than coherent understanding of data as situated and interpretive. Moreover, findings related to teachers’ perceptions of student ability indicate that limitations in teachers’ own knowledge may shape how they assess and respond to student thinking, further complicating instructional decision-making (Reisoglu & Çebi, 2020; Rosenberg et al., 2022).
A parallel body of work examines teachers’ attitudes and confidence, documenting generally positive dispositions toward data literacy with persistent perceptions of difficulty (Miller, 2022; Leavy et al., 2021; Umugiraneza et al., 2022). However, these studies tend to rely on self-reported measures, offering limited insight into how teacher confidence impacts and interacts with practice. More importantly, the emphasis on attitudes positions data literacy as an individual attribute rather than a practice shaped by instructional contexts, resources, and disciplinary guides. Furthermore, to move beyond surface-level attitudes, recent scholarship utilizes sociocognitive framing to examine how teachers’ mental representations shape their interpretation of data (Jennings, 2023). This suggests that their beliefs are not fixed; rather, teachers often view students through ‘achiever’ vs. ‘learner’ frames, which also dictates how they prioritize data for accountability versus instructional improvement (Bolhuis et al., 2019).
Efforts to address these challenges frequently take the form of intervention-based studies, including professional development programs and instructional models designed to enhance teachers’ knowledge and decision-making. While such studies report gains in specific competencies—such as data-based decision-making or inquiry-oriented instruction—they often focus on short-term outcomes and provide limited evidence of sustained changes in classroom practice (LaLonde et al., 2023; Bilgin et al., 2017). As a result, the field has generated a growing body of intervention research without a corresponding understanding of how these interventions are taken up, adapted, or resisted in authentic educational settings.
The role of technology constitutes a third major area of focus, with studies highlighting its potential to support data visualization, analysis, and inquiry (see Table 3). However, technology is frequently framed in instrumental terms—as a tool for improving efficiency or accuracy—rather than as a mediating structure that shapes how data are interpreted and used. Common tools such as spreadsheets or Microsoft Excel are widely employed to support procedural engagement with data, while more advanced platforms and immersive technologies are introduced to enhance engagement and authenticity (Suh et al., 2020; Schoen et al., 2019; Reisoglu & Çebi, 2020; Leavy et al., 2021).
Recent developments include the integration of generative AI as a “teacher’s assistant” to automate complex analytical tasks (J. Lee & Lee, 2025) and the use of Data-Art Inquiry to integrate creative expression with conventional data practices (Matuk et al., 2022, 2024). Additionally, emerging work on “smart city” contexts (Wolff et al., 2019) prepares students to engage with large-scale datasets beyond traditional classroom environments.
Despite these developments, relatively little attention has been given to how technology reshapes classroom practice or how learners interact with data in technology-rich environments. Table 3 offers an overview of studies reviewed along with the technological tools utilized in the reported work.
Importantly, the three strands of research—teacher knowledge, instructional interventions, and technological tools—tend to operate in isolation rather than as integrated dimensions of teaching and learning. This separation limits the field’s ability to account for the complexity of data literacy as a practice that is simultaneously cognitive and pedagogical. Moreover, the relative absence of studies examining classroom enactment and student engagement suggests that current research remains only partially connected to the realities of classrooms.
Taken together, these patterns indicate that while the field has made progress in identifying key components of data literacy, it is yet to develop a cohesive account of how these components interact in practice. Moving beyond divided lines of inquiry will require research that explicitly connects teacher knowledge, instructional design, and student learning within authentic classroom contexts, particularly across diverse STEM disciplines. Without such integration, efforts to advance data literacy risk remaining conceptually rich but practically limited.

4.2. Conceptual Models Used in Organizing Research on Data Literacy in STEM Education

Conceptual models used in the reviewed studies (see Table 4) vary widely, reflecting the interdisciplinary nature of data literacy in STEM education and different ways that the construct is defined and operationalized. Seventeen studies explicitly reported the use of conceptual or theoretical frameworks; however, these models differ substantially in their underlying assumptions, focal constructs, and intended purposes. Rather than converging toward a shared understanding, the field appears characterized by the use of multiple frameworks.
Broadly, the models identified can be grouped into three overlapping categories: (1) competency-based digital and data literacy frameworks, (2) statistical reasoning and literacy models, and (3) pedagogical or instructional design frameworks. While each category offers valuable insights, the absence of integration highlights a fragmented conceptual landscape.
Competency-based frameworks, such as the Digital Competence of Educators (DigCompEdu) model (Reisoglu & Çebi, 2020), conceptualize data literacy primarily in terms of skills related to accessing, evaluating, and using digital information. Studies employing this model emphasize teachers’ technical and information-processing abilities, often identifying gaps in higher-order competencies such as data-informed decision-making. While these frameworks are useful for identifying skill deficits, they tend to conceptualize data literacy in decontextualized terms, with limited attention to how such competencies are enacted in classroom settings.
In contrast, statistical literacy and reasoning models—including LOCUS (Engledowl & Tarr, 2020; Suh et al., 2020), Gal’s model of statistical literacy (Jairaman et al., 2016), and the GAISE framework (Umugiraneza et al., 2022)—foreground conceptual understanding of data, including interpretation, inference, and critical evaluation. These models emphasize how individuals make sense of data and develop increasingly sophisticated forms of reasoning. While traditional statistical models (e.g., GAISE or 4-Step Investigation) prioritize mathematical and procedural structures, emerging data literacy models such as Critical Data Literacy (Louie et al., 2022) and Data-Art Inquiry (Matuk et al., 2022) extend the construct to include social justice, artistic expression, and ethical reflection, positioning data literacy within a broader interdisciplinary space. However, even within this category, there is considerable variation in how key constructs—such as reasoning, thinking, and literacy—are defined and operationalized. Moreover, these models are often used to assess individual understanding rather than to examine how such understanding develops through instructional processes.
A third group of studies draws on pedagogical and design-oriented frameworks, including PPDAC (Leavy et al., 2021), inquiry-based models (e.g., 5E) (Bilgin et al., 2017), constructivist approaches (Hariyanti et al., 2025), and action research or data-driven decision-making cycles (Green et al., 2018). These frameworks emphasize processes of teaching and learning, particularly task design, inquiry, and reflection. Collectively, they position data literacy as something developed through sustained engagement in structured learning activities. Recent “inquiry–intervention” models further attempt to bridge the theory–practice divide. These include the 8-Step Data Use Intervention for collaborative data teams (Bolhuis et al., 2019) and the DATA Acronym Process for AI-supported inquiry (J. Lee & Lee, 2025). Such models move beyond documenting teacher knowledge to structuring the processes of data-informed decision-making (DIDM). However, these frameworks are often used primarily to guide instructional interventions rather than to theorize the nature of data literacy itself, reinforcing a separation between instructional design and conceptual definition.
Some studies attempt to bridge these domains by integrating multiple frameworks. Kuş and Çakiroğlu (2020) extend statistical contexts to include broader models of critical reasoning. Similarly, Savard and Manuel (2016) emphasize interdisciplinary connections, and Green et al. (2018) integrate statistical inquiry with reflective teaching practices. Although these efforts represent important steps toward more holistic approaches, they remain relatively limited and often lack explicit theoretical integration.
Across the reviewed studies, conceptual models are frequently used instrumentally—to structure data collection, guide intervention design, or categorize outcomes—rather than as objects of sustained theoretical development. As a result, the field has produced a wide range of frameworks without clearly articulating the relationships among them. This lack of integration limits the comparability of findings across studies and constrains the accumulation of coherent knowledge about what data literacy entails in practice.
Moreover, the choice of conceptual model often shapes the focus of the research itself. Studies grounded in competency frameworks tend to emphasize measurable skills; those using statistical literacy models prioritize individual reasoning; and those drawing on pedagogical frameworks focus on instructional processes. Few studies, however, bring these dimensions together to examine how teacher knowledge, instructional practice, and student learning interact. This reinforces a broader pattern identified in this review: the separation of conceptual, pedagogical, and empirical strands of research.
Methodologically, the use of qualitative approaches, including interviews, observations, and artifact analysis is prominent (Reisoglu & Çebi, 2020; Giamellaro et al., 2020). While these methods provide rich insights into teachers’ thinking and experiences, they are often applied within narrowly defined conceptual frames. Only a small number of studies employ quantitative or experimental designs, such as repeated-measures studies (Suh et al., 2020; Leavy et al., 2021) or controlled trials (Schoen et al., 2019), limiting the field’s ability to draw broader generalizations about the impact of specific approaches.
At present, three dominant theoretical orientations can be identified across the literature: (1) competency-based frameworks that emphasize individual skills and dispositions (e.g., DigCompEdu), (2) disciplinary models of statistical reasoning that foreground interpretation and inference (e.g., GAISE and LOCUS), and (3) pedagogical and design frameworks that structure inquiry processes (e.g., PPDAC and inquiry-based learning models). Each captures an important dimension of data literacy; however, their separation has contributed to a fragmented knowledge base in which cognition, instruction, and context are treated as analytically distinct rather than mutually constitutive. These orientations are elaborated in the next section. Even with a relatively small corpus of 26 studies, this review revealed clear and persistent fragmentation in how data literacy is conceptualized and studied. This pattern is not simply a consequence of limited sampling; rather, it reflects broader conditions within the field. The diversity of conceptual frameworks, methodological approaches, and research foci within this modest set of studies underscores the absence of a shared theoretical foundation. Indeed, the fact that fragmentation is so evident within a constrained sample suggests that it is a structural feature of the research landscape rather than an artifact of scope. Thus, the findings point not to limitations of this review but to the need for integrative frameworks capable of bringing greater coherence to research on data literacy in STEM education.

5. Sources of Fragmentation

This fragmentation arises from three structural tensions in how data literacy is conceptualized and studied. Rather than signaling a lack of maturity, it reflects the coexistence of competing epistemologies, methodological commitments, and disciplinary contexts that have yet to be theoretically reconciled.
First, fragmentation is rooted in epistemological differences concerning what it means to “know” data. Competency-based frameworks conceptualize data literacy as a set of transferable skills and dispositions, emphasizing individuals’ abilities to access, evaluate, and use data. In contrast, statistical reasoning models privilege disciplinary forms of knowing, including reasoning about variability, inference, and uncertainty. Pedagogical and design-oriented frameworks, meanwhile, position knowledge as emerging through participation in structured activities and inquiry processes. These are not simply different emphases; they are grounded in distinct theories of knowledge—cognitive, disciplinary, and practice-based—that are rarely made explicit or reconciled. As a result, studies operationalize data literacy in incompatible ways, limiting cumulative knowledge building across the field.
Second, fragmentation is reinforced by methodological commitments that foreground particular aspects of data literacy while obscuring others. Survey and self-report studies tend to emphasize beliefs, attitudes, and perceived competencies, often detached from classroom practice. Experimental and intervention studies focus on measurable gains in discrete skills, typically within constrained timeframes that fail to capture sustained instructional change. Qualitative studies offer rich accounts of teacher thinking and experience but are often situated within narrowly bounded conceptual frames. These methodological orientations are not neutral; they shape what counts as evidence and, in doing so, segment data literacy into cognitive, behavioral, or contextual components rather than treating it as an integrated phenomenon.
Third, fragmentation reflects the contextual divide of data literacy across disciplinary and institutional settings. Although historically rooted in mathematics and statistics education, data literacy now spans science, engineering, computer science, and informal learning environments. Each domain brings distinct norms, tools, and purposes for engaging with data, producing divergent interpretations of what data literacy involves. In the absence of a unifying theoretical framework, these domain-specific approaches remain loosely connected, contributing to ongoing conceptual divergence. Taken together, these epistemological, methodological, and contextual tensions explain why research on data literacy has expanded without converging. Fragmentation, in this sense, is not a temporary condition of an emerging field but a structural problem that requires deliberate theoretical integration.
To address this, we propose an integrative perspective that reconceptualizes data literacy as a situated, practice-based, and socio-epistemic phenomenon. From this standpoint, data literacy is not reducible to discrete competencies or isolated instructional strategies; rather, it emerges through the interaction of individuals, tools, tasks, and contexts in the course of meaningful activity. This perspective aligns with sociocultural and practice-based theories of learning, which do not separate knowing from doing and developing through participation in socially organized practices.

6. Discussion: Moving Toward Bridging

The range of perspectives on data literacy speaks to a field in transition—from a predominantly technical conception of competence toward a more situated, humanistic, and justice-oriented vision of data science education. However, this shift has not been matched by corresponding theoretical coherence. Increasingly, data literacy is understood not as a set of technical skills alone but as a complex practice involving interpretation, communication, and critical engagement. While foundational frameworks such as GAISE II remain important for structuring statistical reasoning, emerging perspectives call for a broader reimagining of what it means to be data-literate.
In response to the limitations of purely technical approaches, scholars have advanced a humanistic reorientation of data science education. V. R. Lee et al. (2021) argue that data science should be understood as a fundamentally human endeavor shaped by identity, ethics, and power. Similarly, Louie (2022) advances the notion of critical data literacy, emphasizing learners’ capacity to interrogate how data are produced, represented, and mobilized within systems of power. Across this work, data literacy extends beyond technical proficiency to include agency, critique, and civic engagement.
A consistent theme across the literature is the centrality of context in supporting meaningful engagement with data. Studies demonstrate that locally relevant, culturally meaningful, and interest-driven contexts deepen interpretive reasoning and position data analysis as a form of participation rather than abstraction. In this view, context is not an instructional add-on but a constitutive element of how meaning is made.
Building on these perspectives, we conceptualize data literacy as emerging through four interrelated dimensions: interpretive reasoning, instructional design, mediational tools, and contextual framing. Interpretive reasoning encompasses how learners make sense of data; instructional design structures the tasks and interactions that shape engagement; mediational tools include the technological and representational resources that enable and constrain reasoning; and contextual framing captures the disciplinary, cultural, and sociopolitical conditions that give data its meaning. This framework does not replace existing models but repositions them as partial accounts of a broader phenomenon. Competency-based approaches capitalize on individual capabilities, disciplinary models emphasize forms of reasoning, and pedagogical frameworks organize inquiry processes. However, if viewed in an integrative manner, these are not competing definitions but complementary perspectives on a shared practice.

An Illustrative Example of the Model in Action

Let us consider an example of how the same data may be treated, studied and interpreted differently in research and according to instructional design and students’ forms of reasoning. Our World in Data (https://ourworldindata.org, accessed on 15 May 2026) provides real, organic and uncrated data on a range of issues that capture current global state of approximately ten topics (Global Change Data Lab, n.d.). For illustrative purposes, we focus on the use of the datasets on access to healthcare globally.
In a technical or competency-based framing, students might be provided with data on global indicators such as physician density, hospital availability, or life expectancy and asked to construct graphs, compute descriptive statistics, and compare countries using pre-specified criteria. In this approach, data literacy is operationalized as the ability to accurately read, represent, and summarize structured datasets, with emphasis placed on procedural fluency and correct interpretation of visualizations.
By contrast, in a situated and socio-epistemic framing using the same data, students might be asked to examine why access to care varies across countries, consider how metrics such as “access” are defined and measured, and explore how variables like income inequality and geography shape health outcomes. Rather than treating the dataset as neutral, students are asked to critique what is included, what is omitted, and how representations shape our understanding of global health disparities. In this framing, data literacy involves interpreting, questioning, and situating data within social and political contexts. This contrast highlights how differing theoretical orientations not only influence task design but also define what counts as legitimate data literacy practice.
In this particular context, in accordance with past practice, a typical study might evaluate teachers’ data literacy by administering a survey or test aligned with competency frameworks such as DigCompEdu (Reisoglu & Çebi, 2020), focusing on whether teachers can correctly interpret graphs, identify averages, or report confidence in using data for instruction where the research product is often a score or proficiency level, and the analytic focus remains at the level of the individual teacher. In contrast, in research informed by situated and critical perspectives designs studies around authentic instructional episodes, a classroom-based study might examine how teachers and students jointly investigate global health inequities using datasets from Our World in Data, such as differences in life expectancy, vaccination rates, or physician availability across countries. Instead of asking whether the teacher “knows” how to interpret such data, the analysis focuses on how instructional decisions shape what students notice, how they reason about disparities, and what explanations become possible in discussion. In our proposed framing, the unit of analysis shifts to the interaction among teacher guidance, student reasoning, tools, and context. Researchers might analyze classroom talk, task design, and student artifacts to understand how data becomes meaningful within instruction. They may find that when teachers emphasize comparison without contextual explanation, students interpret differences in healthcare access as individual or natural variation. However, when instruction explicitly connects data to structural factors (policy, geography, and resource distribution), students begin to construct more critical explanations. This shift also changes how “impact” is defined. Rather than measuring gains in procedural skill (e.g., interpreting bar charts), studies examine whether students develop richer forms of reasoning—such as recognizing inequity, questioning data sources, or connecting patterns to real-world systems.
In studies grounded in the GAISE framework (Umugiraneza et al., 2022; Bargagliotti et al., 2020), research tends to examine how well instruction aligns with the four-step statistical problem-solving process: formulating questions, collecting data, analyzing data, and interpreting results. A classroom study might, for example, evaluate whether teachers guide students through each phase when working with datasets on global health indicators such as those from Our World in Data. The primary focus is on whether students can correctly generate questions, compute summaries, or interpret graphs, and whether instruction follows the expected sequence of statistical inquiry. In this design, teaching quality is often inferred from fidelity to the model and student performance on defined statistical tasks. In contrast, research informed by situated and socio-epistemic perspectives uses GAISE not as a strict instructional sequence but as one component within a broader analytic lens. For instance, a study might still draw on GAISE to recognize stages of statistical reasoning, but instead of evaluating whether each step is completed, it examines how those steps are taken up, modified, or disrupted in authentic classroom activity. When students analyze healthcare disparities across countries, researchers might focus on how teachers frame the task (e.g., as computation vs. inquiry into inequity), how students interpret variation in access to care, and how contextual explanations shape reasoning about the data. In this newer framing, GAISE becomes a partial descriptor of practice rather than a prescriptive checklist. The emphasis shifts from “Did instruction follow the four steps?” to “How do instructional decisions shape the kinds of reasoning students are able to develop within and across those steps?” For example, two classrooms may both engage in “analysis” of the same dataset, but one may focus on calculating averages of healthcare access, while the other uses the same analysis to question structural inequities in insurance coverage and resource distribution.
This comparison highlights the broader shift in data literacy research: from evaluating alignment with structured models toward understanding how those models are enacted within complex instructional systems where meaning-making, context, and relations shape what counts as data reasoning. This evolution in research reflects a move from treating data literacy as an individual cognitive competency toward understanding it as a distributed practice shaped by instruction, tools, and context, where learning is evidenced in how students participate in meaningful data interpretation rather than in isolated test performance.
Researchers can consider whether students are asked to move beyond reading values to explaining variability, questioning representations, and constructing claims from data. Teaching quality becomes evidenced by the extent to which students are regularly positioned as sense-makers rather than producing answers (interpretive reasoning), how tasks are sequenced and whether they facilitate development of more sophisticated analysis and interpretation of data (design coherence), how technologies (spreadsheets, visualization tools, or datasets such as those from Our World in Data) are used (mediational tool usage), and how they shape reasoning: do they expand inquiry into real-world inequities or do they reduce data work to procedural manipulation.
Teaching quality in this model is evaluated by the extent to which instruction enables students to interpret, question, and communicate with data in ways that are intellectually rigorous, contextually grounded, and socially meaningful. This shifts the evaluation away from checklist-based measures of “data skills taught” toward a more analytic account of how classroom activity structures opportunities for participation in data-informed reasoning. The goal is not to disregard development of technical knowledge but to study its development beyond technical framing. Technical framing (e.g., GAISE, LOCUS, and PPDAC) are certainly viable in such studies as guides for the organization of activities and skills but they do not serve as the objects of research.

7. Final Comments

Reframing data literacy in the manner we described has several implications. It calls for research that examines the relationships among teacher knowledge, instructional practice, and student learning as dynamically interconnected. It positions technology as a mediating structure that shapes epistemic activity rather than as a neutral tool. It foregrounds the sociopolitical dimensions of data, including issues of power, representation, and equity. And it highlights the need to understand how data literacy develops across diverse contexts, including informal and interdisciplinary settings.
Advancing the field, we argue, requires moving beyond parallel lines of inquiry toward a multidimensional account of practice. By bringing existing perspectives into dialogue, the field can build a cumulative and theoretically grounded understanding of data literacy—one capable of supporting meaningful, critical, and equitable participation in a data-driven world.
Finally, we acknowledge that, although this study followed PRISMA guidelines, several limitations must be noted. First, the search was restricted to English-language publications, which may have excluded relevant work published in other languages. Second, the review relied on only two databases (Academic Search Complete and APA PsycINFO), potentially limiting coverage of studies indexed elsewhere. Third, while hand-searching techniques were used to identify additional sources, this approach may have favored more established research networks. Due to these constraints, the findings should be interpreted as indicative rather than exhaustive. This suggests that future reviews may incorporate a broader range of languages, databases, and search strategies.

Author Contributions

Conceptualization, A.M.; methodology, A.A.F.A.B.; software, A.A.F.A.B.; writing—original draft preparation, A.A.F.A.B. and A.M.; writing—review and editing, A.M. and A.A.F.A.B. All authors have read and agreed to the published version of the manuscript.

Funding

This research received no external funding.

Institutional Review Board Statement

Not applicable.

Informed Consent Statement

Not applicable.

Data Availability Statement

The datasets used and/or analyzed during the current study are available from the corresponding author on reasonable request.

Acknowledgments

During the preparation of this manuscript/study, the authors used Software Manager, Zotero, for the purposes of generating references The authors relied on AI for final editing of the paper. The authors have reviewed the output and take full responsibility for the content of this publication.

Conflicts of Interest

The authors declare no conflicts of interest.

Abbreviations

The following abbreviations are used in this manuscript:
NGSSNext Generation Science Standards
UKUnited Kingdom
UNESCOUnited Nations Educational, Scientific, and Cultural Organization
OECDOrganization for Economic Co-operation and Development
STEMScience Technology Engineering and Mathematic
SETStatistical Education of Teachers
GAISEGuidelines for Assessment and Instruction in Statistics Education
ESSAEvery Student Succeeds Act
DLFTData Literacy for Teacher
XRExtended Reality
CKContent Knowledge
PCKPedagogical Content Knowledge
SPSSStatistical Package for the Social Sciences
DigCompEduDigital Competence of Educators
LOCUSLevels of Conceptual Understanding in Statistics
GDLGuided Discovery Learning
SLStatistical Literacy
STStatistical Thinking
CTCritical Thinking
DDDMData-Driven Decision-Making
PPDACProblem, Plan, Data, Analysis, Conclusion
PaCCsPattern and Connectivity in Conceptual Knowledge Structures

References

  1. Bargagliotti, A., Franklin, C., Arnold, P., Gould, R., Johnson, S., Perez, L., & Spangler, D. A. (2020). Pre-K-12 guidelines for assessment and instruction in statistic education (GAISE) report II. American Statistical Association and National Council of Teachers of Mathematics. [Google Scholar]
  2. Batiibwe, M. S. K. (2019). Teachers’ pedagogical content knowledge and the teaching of statistics in secondary schools in Wakiso district in Uganda. Journal of Education and Practice, 10(25), 93–101. [Google Scholar] [CrossRef]
  3. Bauer, J., & Prenzel, M. (2012). European teacher training reforms. Science, 336(6089), 1642–1643. [Google Scholar] [CrossRef]
  4. Biehler, R., De Veaux, R., Engel, J., Kazak, S., & Frischemeier, D. (2022). Editorial: Research on data science education. Statistics Education Research Journal, 21(2), 1–4. [Google Scholar] [CrossRef]
  5. Bieza, K. E. (2020). Digital literacy: Concept and definition. International Journal of Smart Education and Urban Society (IJSEUS), 11(2), 1–15. [Google Scholar] [CrossRef]
  6. Bilgin, A. A. B., Date-Huxtable, E., Coady, C., Geiger, V., Cavanagh, M., Mulligan, J., & Petocz, P. (2017). Opening real science: Evaluation of an online module on statistical literacy for pre-service primary teachers. Statistics Education Research Journal, 16(1), 120–138. [Google Scholar] [CrossRef]
  7. Bolhuis, E., Voogt, J., & Schildkamp, K. (2019). The development of data use, data skills, and positive attitude towards data use in a data team intervention for teacher educators. Studies in Educational Evaluation, 60, 99–108. [Google Scholar] [CrossRef]
  8. Burnett, C., Merchant, G., & Guest, I. (2021). What matters to teachers about literacy teaching: Exploring teachers’ everyday/everynight worlds through creative data visualization. Teaching and Teacher Education, 107, 103480. [Google Scholar] [CrossRef]
  9. Chen, P. P. S. (1976). The entity-relationship model—Toward a unified view of data. ACM Transactions on Database Systems, 1(1), 9–36. [Google Scholar] [CrossRef]
  10. Common Core State Standards Initiative. (2010). Common core state standards for mathematics. Available online: https://corestandards.org/wp-content/uploads/2023/09/Math_Standards1.pdf (accessed on 8 September 2025).
  11. Conference Board of the Mathematical Sciences (Ed.). (2012). The mathematical education of teachers II. Mathematical Association of America. [Google Scholar]
  12. Çebi, A., Özdemir, T. B., Reisoğlu, İ., & Çolak, C. (2022). From digital competences to technology integration: Re-formation of pre-service teachers’ knowledge and understanding. International Journal of Educational Research, 113, 101965. [Google Scholar] [CrossRef]
  13. Data Schools. (n.d.). About our project. Available online: https://dataschools.education/about-us/ (accessed on 9 September 2025).
  14. Desjardins, J. (2019). How much data is generated each day? World Economic Forum. Available online: https://www.weforum.org/agenda/2019/04/how-much-data-is-generated-each-day-cf4bddf29f/ (accessed on 9 October 2025).
  15. Engledowl, C., & Tarr, J. E. (2020). Secondary teachers’ knowledge structures for measures of center, spread & shape of distribution supporting their statistical reasoning. International Journal of Education in Mathematics, Science and Technology, 8(2), 146–167. [Google Scholar] [CrossRef]
  16. Estrellado, R. A., Freer, E. A., Mostipak, J., Rosenberg, J. M., & Velasquez, I. C. (2021). Data science in education using R. Routledge. [Google Scholar]
  17. Every Child Succeeds Act (ESSA). (2015). Public law no. 114-95, S.1177, 114th cong. Available online: https://www.congress.gov/114/plaws/publ95/PLAW-114publ95.pdf (accessed on 8 September 2025).
  18. Federer, L. M., Lu, Y.-L., & Joubert, D. J. (2016). Data literacy training needs of biomedical researchers. Journal of the Medical Library Association, 104(1), 52–57. [Google Scholar] [CrossRef]
  19. Forbes, S. (2014). The coming of age of statistics education in New Zealand, and its influence internationally. Journal of Statistics Education, 22(2), 1–19. [Google Scholar] [CrossRef]
  20. Franklin, C., Kader, G., Mewborn, D., Moreno, J., Peck, R., Perry, M., & Scheaffer, R. (2007). Guidelines for assessment and Instruction in Statistics Education (GAISE) report: A Pre-K-12 curriculum framework. American Statistical Association. Available online: https://www.amstat.org/asa/files/pdfs/gaise/gaiseprek-12_full.pdf (accessed on 12 February 2026).
  21. Giamellaro, M., O’Connell, K., & Knapp, M. (2020). Teachers as participant-narrators in authentic data stories. International Journal of Science Education, 42(3), 406–425. [Google Scholar] [CrossRef]
  22. Gichohi, B. W. (2020). Leveraging on big data and advanced technologies to enhance domestic revenue mobilization. Statistical Journal of the IAOS, 36, 111–119. [Google Scholar] [CrossRef]
  23. Global Change Data Lab. (n.d.). Our world in data. Available online: https://ourworldindata.org (accessed on 2 April 2026).
  24. Green, J. L., Smith, W. M., Kerby, A. T., Blankenship, E. E., Schmid, K. K., & Carlson, M. A. (2018). Introductory statistics: Preparing in-service middle-level mathematics teachers for classroom research. Statistics Education Research Journal, 17(2), 216–238. [Google Scholar] [CrossRef]
  25. Gummer, E., & Mandinach, E. (2015). Building a conceptual framework for data literacy. Teachers College Record, 117(4), 1–22. [Google Scholar] [CrossRef]
  26. Guven, B., Baki, A., Uzun, N., Ozmen, Z. M., & Arslan, Z. (2021). Evaluating the statistics courses in terms of the statistical literacy: Didactic pathways of pre-service mathematics teachers. International Electronic Journal of Mathematics Education, 16(2), em0627. [Google Scholar] [CrossRef]
  27. Gümüş, M. M., & Kukul, V. (2023). Developing a digital competence scale for teachers: Validity and reliability study. Education and Information Technologies, 28(3), 2747–2765. [Google Scholar] [CrossRef]
  28. Hagen, A. N. (2022). Datafication, literacy, and democratization in the music industry. Popular Music & Society, 45(2), 184–201. [Google Scholar] [CrossRef]
  29. Hamilton, C., Filia, K., Lloyd, S., Prober, S., & Duncan, E. (2022). “More than just numbers on a page?” A qualitative exploration of the use of data collection and feedback in youth mental health services. PLoS ONE, 17(7), e0271023. [Google Scholar] [CrossRef] [PubMed]
  30. Hariyanti, F., Budayasa, I. K., & Setianingsih, R. (2025). Design and evaluation of a guided discovery learning model to enhance junior secondary students’ statistical literacy. The Journal of Education Culture and Society, 16(2), 685–708. [Google Scholar] [CrossRef]
  31. Jairaman, K., Rahim, S. S. B. A., & Zamri, S. N. A. B. S. (2016). A pre-service mathematics teacher’s subject matter knowledge of the mode: A case study. Malaysian Online Journal of Educational Sciences, 4(3), 1–11. [Google Scholar]
  32. Jennings, A. S. (2023). Understanding students as achievers and learners: A mixed methods study of how frames shape, and are shaped by, teachers’ interpretation of interim assessment data. The Elementary School Journal, 123(4), 485–512. [Google Scholar] [CrossRef]
  33. Jewell, P., Reading, J., Clarke, M., & Kippist, L. (2020). Information skills for business acumen and employability: A competitive advantage for graduates in Western Sydney. Journal of Education for Business, 95(2), 88–105. [Google Scholar] [CrossRef]
  34. Kalobo, L. (2016). Teachers’ perceptions of learners’ proficiency in statistical literacy, reasoning and thinking. African Journal of Research in Mathematics, Science and Technology Education, 20(3), 225–233. [Google Scholar] [CrossRef]
  35. Kippers, W. B., Poortman, C. L., Schildkamp, K., & Visscher, A. J. (2018). Data literacy: What do educators learn and struggle with during a data use intervention? Studies in Educational Evaluation, 56, 21–31. [Google Scholar] [CrossRef]
  36. Kuş, M., & Çakiroğlu, E. (2020). Prospective mathematics teachers’ critical thinking processes about scientific research: Newspaper article example. Turkish Journal of Education, 9(1), 22–45. [Google Scholar] [CrossRef]
  37. LaLonde, K., VanDerwall, R., Truckenmiller, A. J., & Walsh, M. (2023). An evaluation of a decision-making model on preservice teachers’ instructional decision-making from curriculum-based measurement progress monitoring graphs. Psychology in the Schools, 60(7), 2195–2208. [Google Scholar] [CrossRef]
  38. Leavy, A. M., Hourigan, M., Murphy, B., & Yilmaz, N. (2021). Malleable or fixed? Exploring pre-service primary teachers’ attitudes towards statistics. International Journal of Mathematical Education in Science and Technology, 52(3), 427–451. [Google Scholar] [CrossRef]
  39. Lee, J., & Lee, J. (2025). Generative AI chatbot for teachers’ data-informed decision-making: Effects and insights. Educational Technology & Society, 28(3), 298–317. [Google Scholar] [CrossRef]
  40. Lee, V. R., Wilkerson, M. H., & Lanouette, K. (2021). A call for a humanistic stance toward K–12 data science education. Educational Researcher, 50(9), 664–672. [Google Scholar] [CrossRef]
  41. Louie, J. (2022). Critical data literacy: Creating a more just world with data (Technical report). In National Academy of Sciences’ workshop on foundations of data science for students in grades K–12. National Academy of Sciences. [Google Scholar]
  42. Louie, J., Stiles, J., Fagan, E., Chance, B., & Roy, S. (2022). Building toward critical data literacy with investigations of income inequality. Educational Technology & Society, 25(4), 142–163. [Google Scholar]
  43. Mandinach, E. B., & Gummer, E. S. (2016). What does it mean for teachers to be data literate: Laying out the skills, knowledge, and dispositions. Teaching and Teacher Education, 60, 366–376. [Google Scholar] [CrossRef]
  44. Martin, E. R. (2014). What is data literacy? Journal of EScience Librarianship, 3(1), 1–2. [Google Scholar] [CrossRef]
  45. Matuk, C., DesPortes, K., Amato, A., Vacca, R., Silander, M., Woods, P. J., & Tes, M. (2022). Tensions and synergies in arts-integrated data literacy instruction: Reflections on four classroom implementations. British Journal of Educational Technology, 53(5), 1159–1178. [Google Scholar] [CrossRef]
  46. Matuk, C., Vacca, R., Amato, A., Silander, M., DesPortes, K., Woods, P. J., & Tes, M. (2024). Promoting students’ informal inferential reasoning through arts-integrated data literacy education. Information and Learning Sciences, 125(3/4), 163–189. [Google Scholar] [CrossRef]
  47. Merk, S., Poindl, S., Wurster, S., & Bohl, T. (2020). Fostering aspects of pre-service teachers’ data literacy: Results of a randomized controlled trial. Teaching and Teacher Education, 91, 103043. [Google Scholar] [CrossRef]
  48. Miller, K. M. (2022). Developing pedagogical content knowledge for STEM integration through data literacy: A case study of high school science teachers (Publication No. 29321391) [Ph.D. thesis, University of Pennsylvania]. ProQuest Dissertations and Theses Global. [Google Scholar]
  49. Moher, D., Liberati, A., Tetzlaff, J., & Altman, D. G. (2009). Preferred reporting items for systematic reviews and meta-analyses: The prisma statement. PLoS Medicine, 6(7), e1000097. [Google Scholar] [CrossRef]
  50. Muñiz-Rodríguez, L., Rodríguez-Muñiz, L. J., & Alsina, Á. (2020). Deficits in the statistical and probabilistic literacy of citizens: Effects in a world in crisis. Mathematics, 8(11), 1872. [Google Scholar] [CrossRef]
  51. NGSS Lead States. (2013). Next generation science standards: For states, by states. National Academies Press. [Google Scholar] [CrossRef]
  52. Nguyen, D., & Beijnon, B. (2024). The data subject and the myth of the ‘black box’ data communication and critical data literacy as a resistant practice to platform exploitation. Information, Communication & Society, 27(2), 333–349. [Google Scholar] [CrossRef]
  53. Nguyen, D., & Hekman, E. (2024). The news framing of artificial intelligence: A critical exploration of how media discourses make sense of automation. AI & Society, 39(2), 437–451. [Google Scholar] [CrossRef]
  54. Organisation for Economic Co-operation and Development (OECD). (2019). OECD future of education and skills 2030. OECD learning compass 2030: A series of concept notes. OECD Publishing. Available online: https://www.oecd.org/content/dam/oecd/en/about/projects/edu/education-2040/1-1-learning-compass/OECD_Learning_Compass_2030_Concept_Note_Series.pdf (accessed on 15 September 2025).
  55. Palsa, L., & Mertala, P. (2024). Contextualizing everyday data literacies: The case of recreational runners. International Journal of Human–Computer Interaction, 40(19), 5845–5856. [Google Scholar] [CrossRef]
  56. Quiroz, F. S. (2025). Data-literacy professional development: Improving teachers’ understanding for a K-5 mathematics intervention (Publication No. 31995968) [Ph.D. thesis, University of Wyoming]. ProQuest Dissertations and Theses Global. [Google Scholar]
  57. Reisoglu, İ., & Çebi, A. (2020). How can the digital competences of pre-service teachers be developed? Examining a case study through the lens of DigComp and DigCompEdu. Computers & Education, 156, 103940. [Google Scholar] [CrossRef]
  58. Ridsdale, C., Rothwell, J., Smit, M., Ali Hassan, H., Bliemel, M., Irvine, D., Kelley, D., Matwin, S., & Wuetherick, B. (2015). Strategies and best practices for data literacy education: Knowledge synthesis report. Dalhousie University. [Google Scholar] [CrossRef]
  59. Rosenberg, J. M., Schultheis, E. H., Kjelvik, M. K., Reedy, A., & Sultana, O. (2022). Big data, big changes? The technologies and sources of data used in science classrooms. British Journal of Educational Technology, 53(5), 1179–1201. [Google Scholar] [CrossRef]
  60. Rowe, S., Riggio, M., De Amicis, R., & Rowe, S. R. (2020). Teacher perceptions of training and pedagogical value of cross-reality and sensor data from smart buildings. Education Sciences, 10(9), 234. [Google Scholar] [CrossRef]
  61. Rubin, A. (2020). Learning to reason with data: How did we get here and what do we know? Journal of the Learning Sciences, 29(1), 154–164. [Google Scholar] [CrossRef]
  62. Savard, A., & Manuel, D. (2016). Teaching statistics: Creating an intersection for intra and interdisciplinarity. Statistics Education Research Journal, 15(2), 239–256. [Google Scholar] [CrossRef]
  63. Scheaffer, R. L. (1988). Statistics in the schools: The past, present, and future of the quantitative literacy project. Journal of Educational Technology Systems, 17(1), 47–58. [Google Scholar] [CrossRef]
  64. Schoen, R. C., LaVenia, M., Chicken, E., Razzouk, R., & Kisa, Z. (2019). Increasing secondary-level teachers’ knowledge in statistics and probability: Results from a randomized controlled trial of a professional development program. Cogent Education, 6(1), 1613799. [Google Scholar] [CrossRef]
  65. Shields, M. (2005). Information literacy, statistical literacy, and data literacy (pp. 6–11). IASSIST Quarterly Summer Fall. Available online: https://iassistquarterly.com/public/pdfs/iqvol282_3shields.pdf (accessed on 9 September 2025).
  66. Shulman, L. S. (1986). Those who understand: Knowledge growth in teaching. Educational Researcher, 15(2), 4–14. [Google Scholar] [CrossRef]
  67. Suh, H., Kim, S., Hwang, S., & Han, S. (2020). Enhancing preservice teachers’ key competencies for promoting sustainability in a university statistics course. Sustainability, 12(21), 9051. [Google Scholar] [CrossRef]
  68. Sujarwanto, E. (2022). Data literacy of prospective physics teacher students in STEM learning. In Proceedings of the 4th international conference on innovation in education (ICoIE 4 2022) (pp. 287–291). SciTePress. [Google Scholar] [CrossRef]
  69. Umbach, G. (2022). Statistical and data literacy in policy-making. Statistical Journal of the IAOS, 38(2), 445–452. [Google Scholar] [CrossRef]
  70. Umugiraneza, O., Bansilal, S., & North, D. (2022). Analysis of teachers’ confidence in teaching mathematics and statistics. Statistics Education Research Journal, 21(3), 1–17. [Google Scholar] [CrossRef]
  71. United Nations Educational, Scientific and Cultural Organization (UNESCO). (2022). K-12 AI curricula: A mapping of government-endorsed AI curricula. United Nations Educational, Scientific and Cultural Organization. [Google Scholar] [CrossRef]
  72. Wahid, N. A. A., Rahim, S. S. A., & Syed, S. N. A. (2018). Statistical graph interpretation skills among preservice teachers. International Research Journal of Education and Sciences (IRJES), 2(1), 13–17. [Google Scholar]
  73. Wild, C. J., Utts, J. M., & Horton, N. J. (2018). What is statistics? In D. Ben-Zvi, K. Makar, & J. Garfield (Eds.), International handbook of research in statistics education (pp. 5–36). Springer. [Google Scholar] [CrossRef]
  74. Williams, D., & Coles, L. (2007). Teachers’ approaches to finding and using research evidence: An information literacy perspective. Educational Research, 49(2), 185–206. [Google Scholar] [CrossRef]
  75. Wolff, A., Gooch, D., Montaner, J. J. C., Rashid, U., & Kortuem, G. (2016). Creating an understanding of data literacy for a data-driven society. The Journal of Community Informatics, 12(3), 9–26. [Google Scholar] [CrossRef]
  76. Wolff, A., Wermelinger, M., & Petre, M. (2019). Exploring design principles for data literacy activities to support children’s inquiries from complex data. International Journal of Human-Computer Studies, 129, 41–54. [Google Scholar] [CrossRef]
  77. Wu, X., Xu, T., & Zhang, Y. (2023). Research on the data analysis knowledge assessment of pre-service teachers from China based on cognitive diagnostic assessment. Current Psychology, 42(6), 414–417. [Google Scholar] [CrossRef]
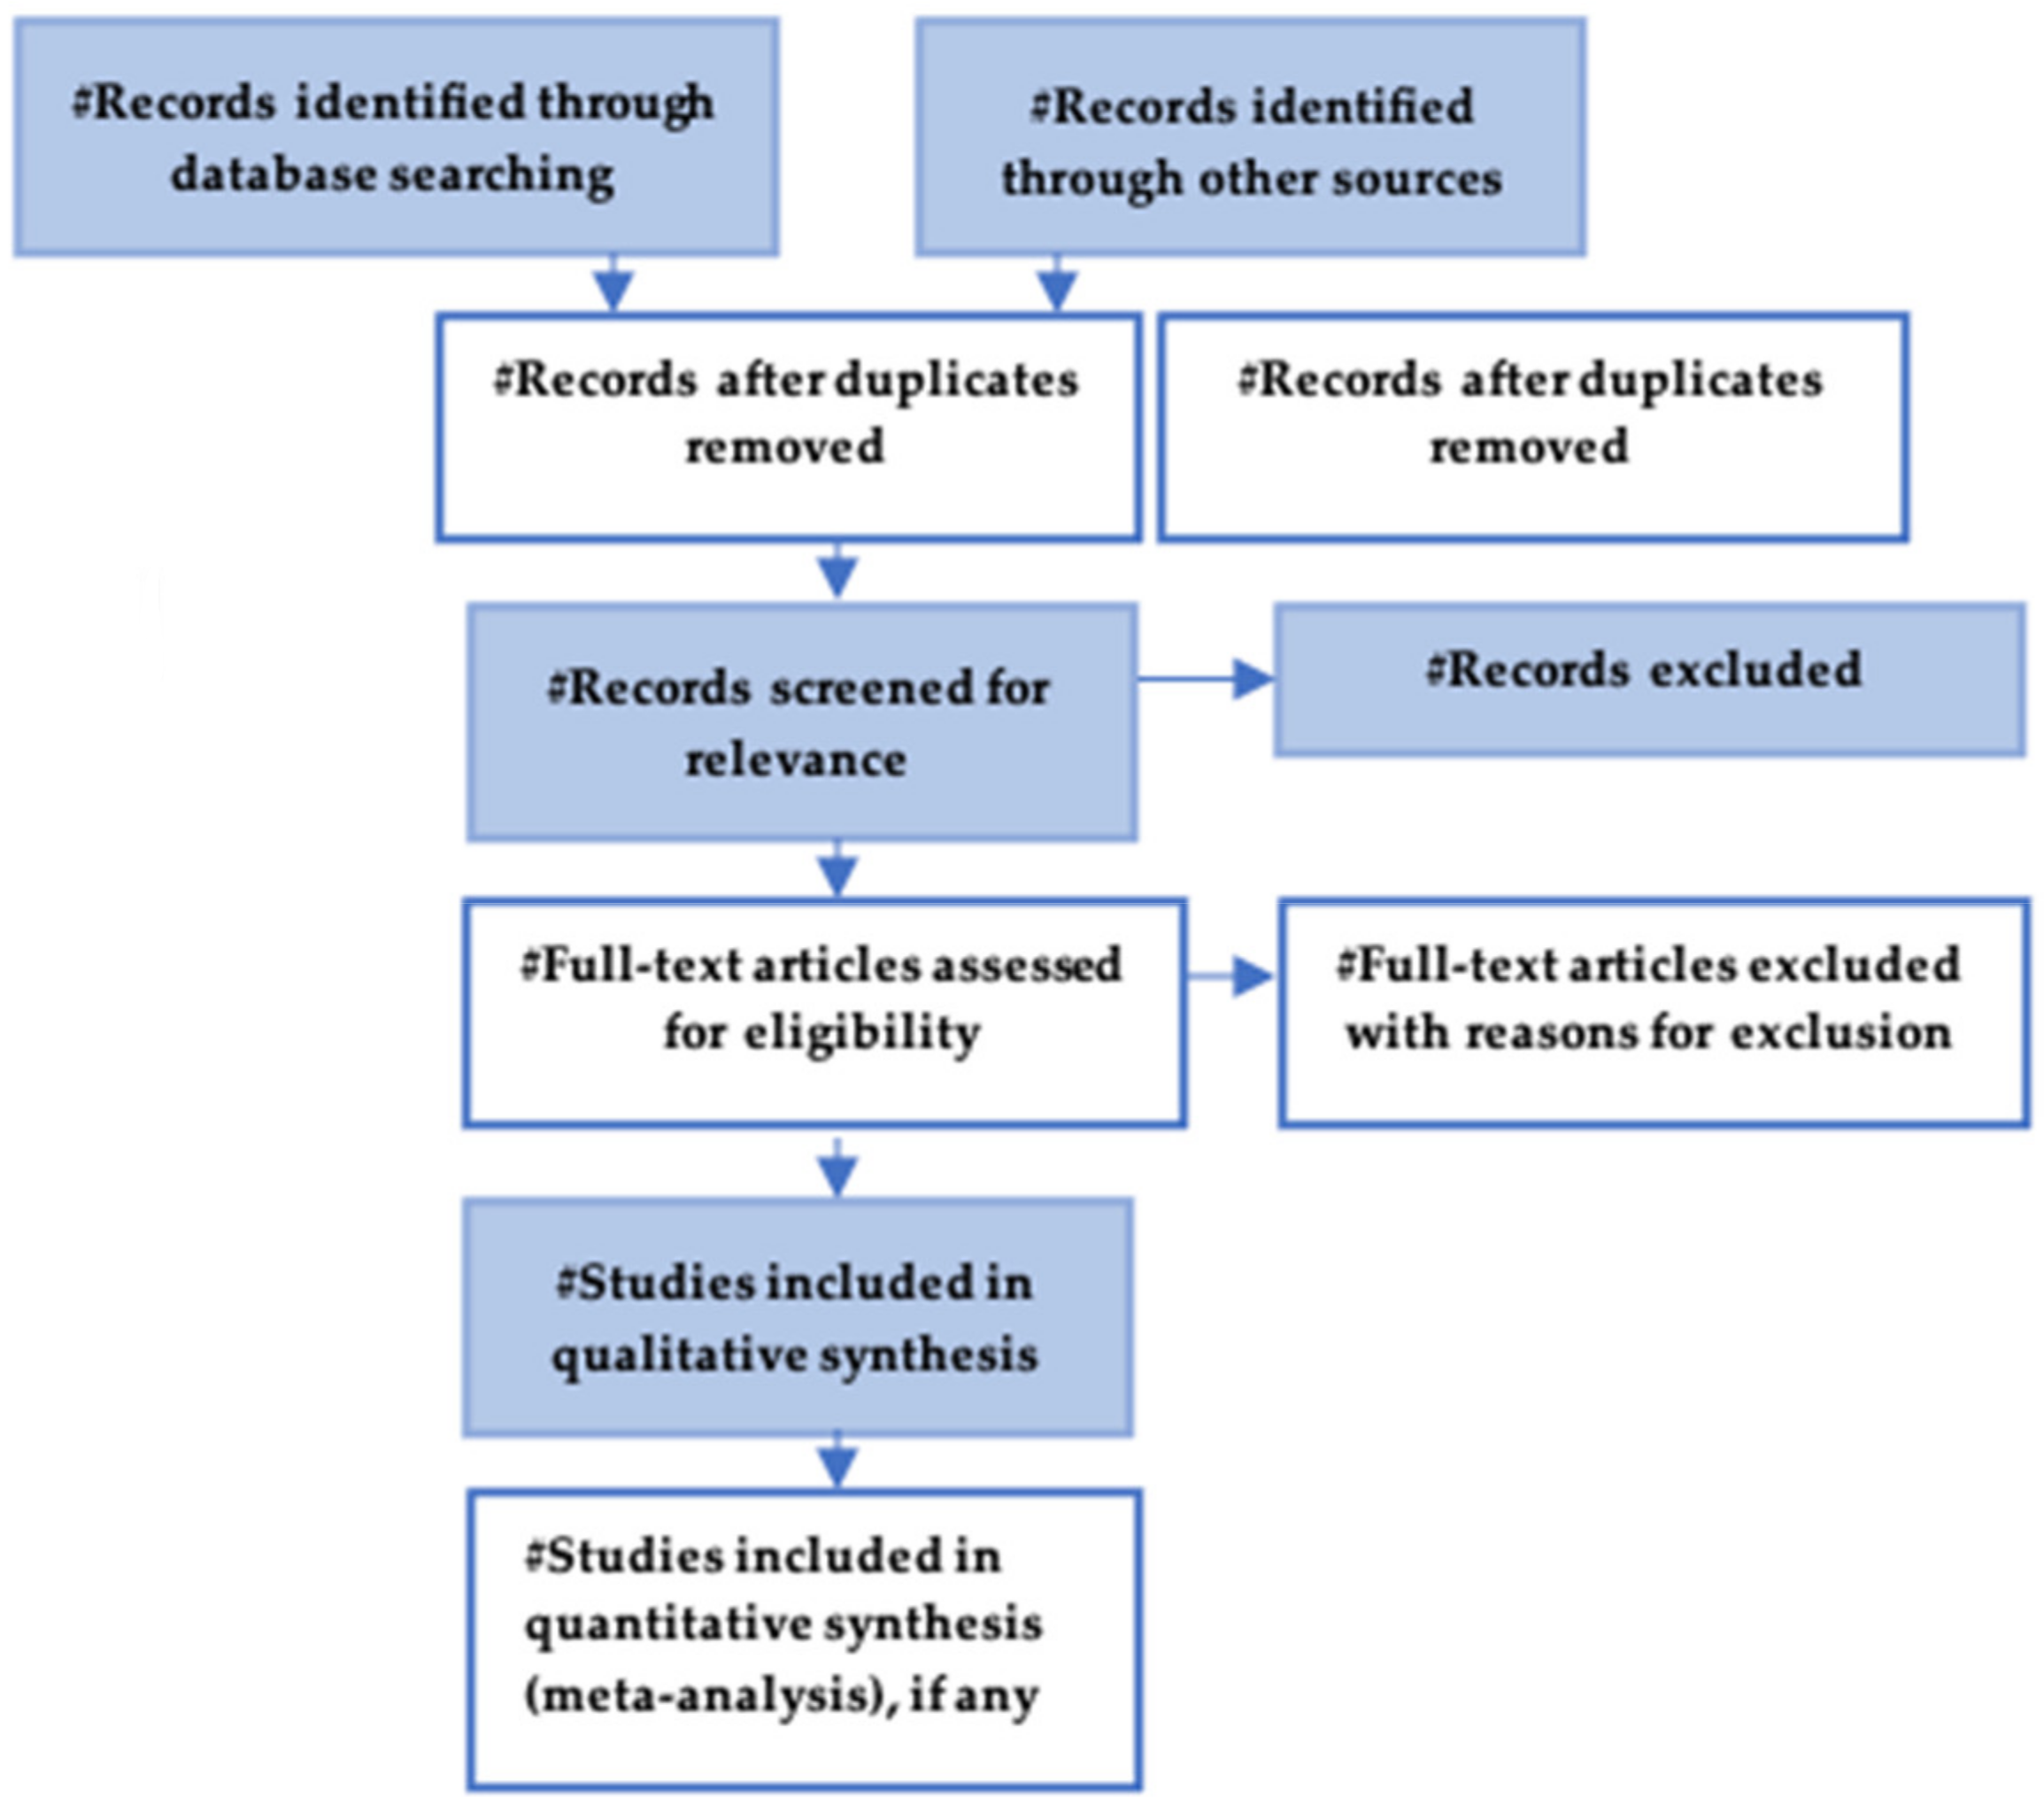
Figure 1. PRISMA diagram.
Education 16 00860 g001
Figure 2. Flow diagram of the selection process. (Copyright: © 2009 Moher et al. This is an open-access article distributed under the terms of the Creative Commons Attribution License).
Education 16 00860 g002
Table 1. Search string.
DatabaseSearch String
Academic Search Complete“Data literacy” OR “statistical literacy” AND “STEM education” AND “k-12 teachers”
APA PsycInfo“Data literacy” OR “statistical literacy” AND “STEM education” AND “k-12 teachers”
Table 2. Teacher knowledge and reasoning gaps.
AuthorsDimensions of KnowledgeKey Findings
(Engledowl & Tarr, 2020; Wahid et al., 2018; Wu et al., 2023)Procedural and conceptual gapsAble to apply isolated procedural skills and basic representations, but often struggle with deep conceptual and justification of reasoning.
(Quiroz, 2025)Pedagogical content knowledgeDeficit in PCK, but Data Error Literacy Protocol helps to improve teachers’ skill to identify students’ misconceptions.
(Merk et al., 2020)Baseline data literacy (DLFT)Teachers often demonstrate low levels of data literacy knowledge and feel poorly prepared.
(Jennings, 2023)Sociocognitive framesMental representations (viewing students as ‘achievers’ vs ‘learners’) shape how teachers interpret data.
(Miller, 2022)Teachers’ identity and data literacyHigh school science teachers are often insecure to develop conceptual definitions of data integrity through collaborative reflection.
(Kippers et al., 2018; Reisoglu & Çebi, 2020)Decision-making (DBDM); instructional decision-makingTeachers frequently rely on personal knowledge rather than data-based decision-making.
(Miller, 2022; Leavy et al., 2021; Umugiraneza et al., 2022)AttitudesPositive dispositions toward data literacy while also persistent perception of individual attitude of how data literacy is practiced.
Table 3. Technological tools used and mentioned in the studies.
AuthorsTechnological Tools
(Suh et al., 2020; Schoen et al., 2019; Reisoglu & Çebi, 2020; Leavy et al., 2021; Quiroz, 2025)Microsoft spreadsheet
(Jairaman et al., 2016; Bolhuis et al., 2019)Calculator
(Umugiraneza et al., 2022; Kalobo, 2016; Hariyanti et al., 2025)Rasch analysis software and R, spss, and win step program
(Rowe et al., 2020)(XR) tools for data visualization
(Gümüş & Kukul, 2023)They do not mention tools, but suggest tools to apply in their study
(J. Lee & Lee, 2025)Gen AI for automated data-informed decision-making
(Suh et al., 2020)Online communication tools
(Wolff et al., 2019; Biehler et al., 2022; Muñiz-Rodríguez et al., 2020; Burnett et al., 2021)Interactive tools and visualization platforms: Menti meter, Dear Data, Lost Words, and Gap minder
(Matuk et al., 2022, 2024)Data-art digital platform
(Miller, 2022)Bioinformatics tools, Google Sheets, and Padlets
Table 4. Conceptual models used in the mentioned studies.
Model Used in the StudyAuthors
The Digital Competence of Educators (DigCompEdu)(Reisoglu & Çebi, 2020)
Levels of Conceptual Understanding in Statistics (LOCUS); Pattern and Connectivity in Conceptual Knowledge structures (PaCCs)(Suh et al., 2020; Engledowl & Tarr, 2020)
Sociocognitive Framing(Jennings, 2023)
Gal’s model of statistical literacy(Jairaman et al., 2016; Savard & Manuel, 2016)
Statistical literacy, statistical analysis(Kalobo, 2016; Umugiraneza et al., 2022; Sujarwanto, 2022)
Pedagogical content knowledge(Batiibwe, 2019)
transformational professional competence model (deconstruction, co-construction, and reconstruction)(Muñiz-Rodríguez et al., 2020)
Guided discovery learning (GDL)(Hariyanti et al., 2025)
Data-driven decision-making (DDDM) and the GAISE four-phase statistical problem-solving process(Green et al., 2018)
RCM (refined consensus model)(Miller, 2022)
PPDAC (problem, plan, data, analysis, conclusion)(Leavy et al., 2021; Bilgin et al., 2017)
Critical thinking and statistical literacy(Kuş & Çakiroğlu, 2020)
DELP (Data Error Literacy Protocol); DATA process; Data-Art Inquiry(Quiroz, 2025; J. Lee & Lee, 2025; Matuk et al., 2022)
Rasch model(Guven et al., 2021)
Data Literacy for Teachers(Merk et al., 2020)
Disclaimer/Publisher’s Note: The statements, opinions and data contained in all publications are solely those of the individual author(s) and contributor(s) and not of MDPI and/or the editor(s). MDPI and/or the editor(s) disclaim responsibility for any injury to people or property resulting from any ideas, methods, instructions or products referred to in the content.