Article

Anxiety Levels in Teachers of Initial English Language Training in Ecuador

by
Johanna Elizabeth Bello Piguave
1,
Nahia Idoiaga-Mondragon
2,*,
Jhonny Saulo Villafuerte Holguin
3,
Aitor Garagarza
4 and
Israel Alonso
5
1
Department of Education, Tourism, Arts and Humanities, Eloy Alfaro University of Manabí, Manta 130802, Ecuador
2
Department of Developmental and Educational Psychology, University of the Basque Country UPV/EHU, 48940 Leioa, Spain
3
Research Group, Pedagogical Innovations for Human and Sustainable Development, Universidad Laica Eloy Alfaro de Manabí (ULEAM), Manta 130802, Ecuador
4
Department of Educational Science, University of the Basque Country UPV/EHU, 48940 Leioa, Spain
5
Department of Didactics and School Organization, University of the Basque Country UPV/EHU, 48940 Leioa, Spain
*
Author to whom correspondence should be addressed.
Educ. Sci. 2025, 15(8), 972; https://doi.org/10.3390/educsci15080972
Submission received: 27 April 2025 / Revised: 30 June 2025 / Accepted: 14 July 2025 / Published: 29 July 2025
(This article belongs to the Special Issue Stress Management and Student Well-Being)

Abstract

Anxiety is a significant mental health concern in universities worldwide. This study examines the structure of anxiety symptoms and their relationship with contextual stressors among pre-service English teachers. The sample included 269 students enrolled in a Teaching English as a Foreign Language program at a public university in Manabí, Ecuador. Data were collected using the Zung Self-Rating Anxiety Scale and a custom-designed questionnaire identifying anxiety triggers. Results showed that while most students reported normal or mild anxiety levels, a considerable portion exhibited moderate to severe symptoms. Cluster analysis revealed three emotional profiles, with the high-anxiety group strongly associated with stressors such as economic hardship and job insecurity. Academic pressure and financial instability emerged as the strongest predictors of anxiety. These findings highlight the urgent need to develop and evaluate targeted psycho-educational strategies to prevent and reduce anxiety within teacher training programs in higher education.

1. Introduction

The transition to university is a critical developmental stage often requiring significant psychosocial adjustments. Globally, anxiety is a significant mental health concern among university students (Eisenberg et al., 2009). Students frequently face academic pressure, separation from family support networks, performance expectations, and identity challenges, particularly when adequate institutional support is lacking (Beiter et al., 2015).
Over the past two decades, Ecuadorian higher education has rapidly expanded, resulting in increased access, but there are still persistent inequalities in quality, funding, and student support services (Ordorika & Rodríguez-Gómez, 2020; Schwartzman, 2020). Teacher training programs are generally embedded within public universities and often serve students from low- to middle-income backgrounds. Structural constraints, including rigid curricular pathways, limited access to mental health services, and high job market uncertainty, are particularly pronounced in this context, creating unique challenges for pre-service teachers (Moreta-Herrera et al., 2021). Auerbach et al. (2016) found that students in competitive academic environments frequently experience elevated anxiety levels due to examinations, substantial study requirements, and temporal constraints (Ginevra et al., 2016; Khoshaim et al., 2020; Son et al., 2020). As demonstrated in the relevant literature, these pressures are particularly pronounced during the period leading up to graduation and entry into the workforce (Vázquez et al., 2021; Yánez Yánez, 2023).
As posited by Ashqui et al. (2024) and Moreta-Herrera et al. (2021), feelings of anxiety are known to intensify when students—especially women—contemplate their employment prospects, career expectations, or the fear of academic failure. This gender disparity is further supported by Velásco et al. (2021) and Izurieta-Brito et al. (2022), who report higher levels of anxiety and stress among female students.
This study explores anxiety levels and their causes among pre-service English teachers in Manabí, Ecuador. Anxiety related to foreign language teaching has been identified as a key stressor (Adrianzén, 2021), along with pressures from standardized testing and international accreditation—factors tied to job market access (Villafuerte et al., 2023; Clerque Acuña et al., 2024). Pre-service teachers must balance university demands with preparing for roles involving emotional and educational support for children and families. These challenges are compounded by broader societal insecurity in Ecuador, which impacts the education system (Chamba, 2024).
This study aims to deepen our understanding of anxiety during teacher training by analyzing four key constructs: (1) the mental health of university students, (2) anxiety assessment in higher education, (3) academic and contextual stressors, and (4) multidimensional approaches to emotional risk. The research addresses the following questions:
  • What is the factor structure and reliability of the Zung Self-Report Anxiety Scale (SAS) among Ecuadorian pre-service English teachers?
  • How are anxiety levels and stressors distributed across academic and personal contexts?
  • What emotional risk profiles emerge from the 38 sources of contextual anxiety identified?
  • To what extent do sociodemographic factors and stressors predict anxiety levels?

1.1. University Students’ Mental Health: A Growing Concern

University students have become increasingly vulnerable to mental health issues, particularly in the post-pandemic context, where academic disruptions, social isolation, financial difficulties, and uncertainty about the future have created a highly stressful environment (Son et al., 2020). International studies—including the WHO global surveys (World Health Organization, 2022) and the World Mental Health Surveys (Auerbach et al., 2016)—report elevated rates of anxiety, depression, and suicidal ideation among this population. In Ecuador, research conducted during the COVID-19 pandemic similarly highlights the psychological toll on students, with women disproportionately affected (Izurieta-Brito et al., 2022; Velásco et al., 2021).
The transition to university life represents a critical developmental phase, marked by academic pressure, geographical separation from family support, and identity formation—all of which heighten the risk of psychological distress, particularly in the absence of adequate institutional resources (Beiter et al., 2015). The academic and social consequences are profound: mental health challenges are associated with reduced academic performance, diminished life satisfaction, and increased dropout rates (Chapell et al., 2005; Eisenberg et al., 2009; Palma-Delgado & Barcia-Briones, 2020). Anxiety, in particular, impairs cognitive functions such as attention, memory, and decision making (Owens et al., 2012), and when left untreated, can result in long-term psychological consequences and a rising demand for health services (Hunt & Eisenberg, 2010). Addressing these concerns is both a public health priority and a matter of educational equity.

1.2. Anxiety Assessment in Higher Education

Anxiety is a multidimensional psychological construct encompassing emotional, cognitive, behavioral, and somatic domains. It is conceptualized both categorically—based on diagnostic systems such as the DSM-5—and dimensionally, along a continuum from mild discomfort to severe dysfunction (Spielberger, 1983; Taylor, 2014). In academic settings, anxiety may manifest as generalized worry, test-related fear, social apprehension, and psychosomatic symptoms, all of which can significantly hinder students’ academic and emotional functioning.
One of the most widely used tools for assessing anxiety in higher education is the Zung Self-Rating Anxiety Scale (SAS; Zung, 1971), a 20-item instrument designed to capture affective and somatic symptoms. Its self-administered format enables rapid screening in large student populations (Dunstan et al., 2017). The scale adopts a dimensional approach, assessing emotional tension and fear alongside physical symptoms such as insomnia, fatigue, or gastrointestinal discomfort (Zung, 1965; Taylor, 2014). Its extensive cross-cultural validation and robust psychometric properties (Beck & Steer, 1993) support its utility for detecting subclinical symptoms often overlooked in clinical assessments (De la Ossa et al., 2009; Emiro Restrepo et al., 2022; Khoshaim et al., 2020; Zhao et al., 2022). This study employs the SAS to examine the contextual and educational factors that contribute to anxiety among pre-service teachers.

1.3. Academic and Contextual Stressors in Higher Education

Beyond individual predispositions, contextual stressors play a significant role in shaping students’ emotional well-being. University life often entails academic overload, financial hardship, and shifting social roles (Misra & McKean, 2000). Concerns about career prospects, self-imposed expectations, and fear of failure are frequently cited as key sources of anxiety, particularly among students from disadvantaged backgrounds (Ashqui et al., 2024; Ginevra et al., 2016; Moreta-Herrera et al., 2021).
Academic stressors include exam pressure, excessive reading assignments, tight deadlines, and perceived imbalances between demands and available resources (Khoshaim et al., 2020; Ruiz-Segarra, 2021; Salmela-Aro & Upadyaya, 2014). These pressures can lead to disengagement, burnout, or dropout when sustained over time. Financial concerns—ranging from tuition fees and student debt to the need for part-time employment—further compromise academic performance and heighten anxiety (Robotham, 2008; Vázquez et al., 2021; Yánez Yánez, 2023). Anticipatory anxiety regarding employability tends to peak among students approaching graduation (Arnett, 2004; Verger et al., 2019). Additionally, familial conflict, such as separation or domestic tension, undermines emotional stability and weakens critical support networks (Bronfenbrenner, 1979; Levecque et al., 2017).
The Job Demands–Resources (JD-R) model (Bakker & Demerouti, 2007) offers a useful framework for understanding these dynamics. According to this model, stress arises when external demands—whether academic, financial, or social—exceed an individual’s coping resources. In Ecuador, recent social unrest, systemic insecurity, and economic inequality have intensified these stressors (Cedeño & Villafuerte-Holguín, 2024; Encalada & Vega, 2024). Without adequate support mechanisms, students are at increased risk of emotional exhaustion and academic disengagement (Schaufeli et al., 2009; Browning et al., 2021). These risks are especially pronounced among vulnerable groups (Levecque et al., 2017), underscoring the urgent need for early psychological support interventions (Chamba, 2024). This model offers a theoretical framework for understanding how academic, economic, and social stressors interact to produce emotional exhaustion, particularly in the absence of compensatory resources (Bakker & Demerouti, 2007).

1.4. Multidimensional Approaches to Emotional Risk in Student Populations

The biopsychosocial model proposed by Engel (1977) emphasizes the interaction between biological, psychological, and social factors in shaping emotional well-being. In university settings, emotional risk refers to the likelihood of experiencing psychological distress that disrupts learning and academic engagement (Khoshaim et al., 2020). Recent research supports the use of cluster analysis to identify anxiety profiles, allowing for the classification of student subgroups based on shared vulnerabilities and protective factors (Cairns et al., 2014).
From a psychopedagogical perspective, emotional intelligence plays a vital role in self-regulation and academic resilience (Salovey et al., 2001; Nguyen et al., 2021). Preventive strategies such as social-emotional learning programs have shown promising results in promoting well-being and reducing stress (CASEL, 2020). Financial instability remains a potent predictor of anxiety (Brougham et al., 2009; Moreta-Herrera et al., 2021), particularly among students balancing academic demands with financial dependency. While some studies report no significant correlation between anxiety and academic performance (Yánez Yánez, 2023; Ashqui et al., 2024), others identify a clear negative relationship (Palma-Delgado & Barcia-Briones, 2020; Moreta-Herrera et al., 2021).
Additional contributors to emotional risk include high parental expectations, fear of failure, and uncertainty about career outcomes (Saravanan & Wilks, 2014). The COVID-19 pandemic intensified academic and economic pressures (Son et al., 2020), while social insecurity and student debt emerged as key triggers of psychological distress (Vázquez et al., 2021). These findings support the need for nuanced, multidimensional interventions that reflect the lived realities of university students.
Building on the previous literature and the theoretical framework presented, we propose the following hypotheses:
H1. 
The Zung Self-Rating Anxiety Scale will demonstrate an acceptable fit to a unidimensional structure in this context, although bifactorial and second-order models may also provide adequate fit.
H2. 
The majority of Ecuadorian pre-service English language teachers will report anxiety levels within the normal or mild range, with a significant subgroup presenting subclinical or moderate symptoms.
H3. 
Contextual distress factors will cluster into distinct emotional risk profiles, including at least one group characterized by high cumulative stress exposure.
H4. 
Students in the high-distress cluster(s) will report significantly elevated anxiety levels compared to those in lower-risk clusters.
H5. 
Academic demands, economic insecurity, and fear of professional failure will significantly predict anxiety levels, beyond the effects of age and gender.

2. Materials and Methods

2.1. The Sample

This study included 269 students, aged between 18 and 36 years (M = 21.12; SD = 2.67). Of the participants, 70.3% identified as female (n = 189) and 29.7% as male (n = 80). Students represented a range of academic levels, distributed as follows: Second (14.1%), Third (13.0%), First A (12.3%), First B (11.5%), Ninth (10.4%), Seventh (8.9%), Eighth (8.6%), Sixth (8.6%), Fourth (6.7%), and Fifth (5.9%). A total of 400 students were enrolled in the degree program, and 269 of them participated in this study, representing a high response rate that strengthens the representativeness of the sample.

2.2. Instruments

2.2.1. The Zung Anxiety Self-Assessment Scale (SAS)

This instrument, created by William Zung in 1971, measures affective and somatic anxiety symptoms. It consists of 20 items that describe anxious behaviors, with responses rated on a 4-point ordinal scale (1 = very seldom; 4 = almost always). For this study, the instrument was adapted to the context of foreign language teacher training. The adapted version was reviewed by a panel of experts from Universidad Laica Eloy Alfaro de Manabí (ULEAM) in Ecuador and the University of the Basque Country in Spain. The panel included specialists in psychology, foreign language education, and educational innovation. They recommended revising the syntax of certain items to ensure clarity for participants and proposed a pilot study to confirm item comprehension. The final version was administered via Google Forms, with an estimated completion time of 10–15 min.

2.2.2. Survey of Causal Factors of Anxiety in Teacher Training

This ad hoc instrument was developed by the research team to identify the factors that trigger anxiety among pre-service foreign language teachers. It includes five demographic questions and 38 potential sources of anxiety, grouped into four categories: (a) curricular and non-curricular activities, (b) family and friends, (c) personal relationships, and (d) potential work environment. Participants rated each item using a 4-point scale, ranging from low to high concern. They were also given the option to add other university-related sources of anxiety not listed. A panel of experts in psychology, foreign language instruction, and linguistics reviewed the instrument. They recommended revising item wording to ensure clarity and comprehension. The final version was administered in printed format, with an estimated completion time of 3–4 min.

2.3. Procedure

The research team carried out the following stages:

2.3.1. Sample Selection (February 2024)

The sample was drawn from a captive group of students enrolled in the English as a Foreign Language teacher training program. All 400 students in the program were invited to participate, and 269 students voluntarily completed the instruments, yielding a 67.25% response rate. This approach helped minimize the risk of selection bias, as participation was open to the entire population enrolled in the program, with no exclusion criteria beyond enrollment status. These students also participated in a broader research initiative titled Human Development and Professional Profile: Mentoring and Socio-Emotional Learning, funded and implemented by Universidad Laica Eloy Alfaro de Manabí (ULEAM), Ecuador.

2.3.2. Data Collection Instrument Selection (March 2024)

The Zung Self-Report Anxiety Scale (SAS) was selected based on its internationally recognized validity, reliability, and relevance to this study’s objectives. In addition, the research team developed an ad hoc survey to identify the primary causes of anxiety within the target group. The decision to use the Zung SAS was based on its strong psychometric properties, its balanced assessment of somatic and cognitive symptoms, and its prior use in Spanish-speaking populations. Unlike the GAD-7, which focuses primarily on generalized anxiety symptoms, or the Beck Anxiety Inventory (BAI), which emphasizes somatic manifestations, the SAS offers a broader diagnostic scope suited to identifying emotional risk patterns among university students. Additionally, the Spanish version of the SAS has been validated in Latin American contexts, including Ecuador (Morán Murillo et al., 2024), reinforcing its cultural and linguistic relevance for the target population.

2.3.3. Instrument Validation (April–May 2024)

To assess the instruments’ clarity and cultural relevance within the Ecuadorian context, a pilot test was conducted with students from the language teacher training program. The results showed that 95% of participants understood the items, supporting their appropriateness. Additionally, a panel of experts reviewed and validated the instruments.

2.3.4. Informed Consent

Institutional approval was obtained prior to data collection. Participants were informed of this study’s objectives and voluntarily agreed to participate by signing an informed consent form. The anonymity of participants and the ethical use of data were ensured following [blinded for peer-reviewed] standards and the American Psychological Association (APA) guidelines.

2.3.5. Instrument Administration (June 2024)

The research team administered the instruments in the presence of three faculty members from the [blinded for peer-reviewed] National and Foreign Language Pedagogy program. This stage spanned five days and took place on [blinded for peer-reviewed] premises. The average time to complete the Zung Anxiety Scale was 15 min, while the anxiety causes survey took approximately 4 min. Although the Zung Anxiety Scale was administered via Google Forms, data collection took place in person under the supervision of three faculty members. This setup allowed for real-time monitoring of participants’ completion behavior. All items were mandatory in the form, preventing incomplete responses. As all items are mandatory, no data are lost.

2.4. Data Analysis

2.4.1. Analysis of the Internal Structure and Consistency of the Zung Scale

Several statistical analyses were carried out to evaluate the internal structure and consistency of the Zung Anxiety Self-Assessment Scale (SAS). All estimations were performed using the R statistical environment (R Core Team, 2023), with the lavaan package (Rosseel, 2012) used for structural equation modeling and semTools (Jorgensen et al., 2021) for calculating reliability indices. Before analysis, all responses were screened for completeness. Participants with missing data on any item of the Zung SAS or the distress factor survey were excluded listwise. The overall missing data rate was below 3%, which is unlikely to affect statistical power or introduce systematic bias.

2.4.2. Evaluation of the Internal Structure

Confirmatory factor analysis (CFA) was used to examine the factor structure of the scale, employing the Diagonally Weighted Least Squares (DWLS) estimator, which is recommended for ordinal data from Likert-type items (Li, 2016). Based on Zung’s original theoretical framework (Zung, 1965, 1971), the unidimensional model was fitted first and then compared with alternative models, including first-order, second-order, and bifactor structures. The model’s goodness of fit was assessed using the following indices: chi-square (χ2), the chi-square to degrees of freedom ratio (χ2/df), the Comparative Fit Index (CFI), the Tucker-Lewis Index (TLI), the Root Mean Squared Error of Approximation (RMSEA), and the Standardized Root Mean Squared Residual (SRMR). Values considered indicative of a good model fit were: χ2/df ≤ 5, CFI and TLI ≥ 0.95, RMSEA ≤ 0.06, and SRMR ≤ 0.08 (Hu & Bentler, 1999).
In addition, standardized factor loadings (λ) were examined to assess their statistical significance and magnitude. Loadings above 0.30 were considered acceptable, while those below this threshold were evaluated based on their theoretical and psychometric relevance (Brown, 2015).

2.4.3. Evaluation of Internal Consistency

The internal consistency of each scale was estimated using McDonald’s omega coefficient (ω), which is considered a more accurate measure than the traditional Cronbach’s alpha—particularly in cases where factor loadings are heterogeneous or when latent variable models are used (Revelle & Zinbarg, 2009; Dunn et al., 2014). The omega coefficient was calculated directly from the AFC model, allowing for the consideration of both common and item-specific variance. Consistency was considered acceptable when the omega value was equal to or greater than 0.80 (Nunnally & Bernstein, 1994).
Although no a priori power analysis was conducted, the sample size (n = 269) is considered methodologically adequate for the statistical techniques employed. In the case of Confirmatory Factor Analysis (CFA), existing guidelines recommend a minimum of 200 participants and a participant-to-parameter ratio of at least 10:1, especially for models of moderate complexity (Brown, 2015; Kline, 2016). Given the 20-item structure of the Zung scale and the relatively simple models tested (unidimensional, bifactor, and second-order), the sample satisfies these criteria. Likewise, the sample size provides sufficient power for ANOVA and k-means cluster analysis, supporting the detection of moderate effect sizes and the identification of stable group structures. These factors confirm the statistical adequacy and robustness of the results.

2.4.4. Descriptive Analysis of Anxiety and Contextual Factors of Distress

Measures of central tendency (mean, median) and dispersion (standard deviation, interquartile range, minimum, and maximum) were calculated for continuous variables: anxiety, age, and total number of distress factors. For categorical variables (sex, academic year, and presence/absence of 38 potential distress factors), absolute and relative frequency tables were generated. These analyses used R basis functions and the dplyr package (Wickham et al., 2023). Distributions were visualized through violin and density plots using the ggplot2 package (Wickham, 2016), allowing for assessment of distribution shape and symmetry across sociodemographic groups.
To examine differences in anxiety levels and total distress between men and women, independent-samples Student’s t-tests were conducted. To assess differences by age, the variable was recategorized into four groups (≤20, 21–23, 24–26, and ≥27 years), and one-way analyses of variance (ANOVA) were performed. Assumptions of normality and homogeneity of variances were checked using Q–Q plots and Levene’s test. These analyses used base R functions and the car package (Fox & Weisberg, 2019). Results were visualized with density plots to enhance the interpretability of group differences.

2.4.5. Cluster Analysis (Clustering)

A k-means cluster analysis was performed to identify distinct student profiles based on the presence or absence of contextual distress factors (variables @1 to @38). Prior to clustering, all variables were standardized to ensure comparability across scales. The optimal number of clusters was determined using the elbow method, implemented with the factoextra package (Kassambara & Mundt, 2020).
Cluster structures were examined and described using group-specific means tables and ANOVA tests for anxiety and total distress. Additionally, boxplots were generated for each variable by cluster, providing a visual interpretation of differences among groups. Given the exploratory nature of cluster analysis, Hypothesis 3 was addressed using a descriptive approach to identify naturally occurring distress patterns. Inferential testing of profile-based group differences was limited to subsequent ANOVA comparisons (see Section 3.4). Supervised classification methods were deemed beyond the scope of this study.

3. Results

The presentation of the results follows the logic of the research questions.

3.1. Factor Structure and Reliability Analysis of the Zung Anxiety Self-Assessment Scale (SAS)

A confirmatory factor analysis (CFA) was conducted to examine the internal structure of the Anxiety Self-Assessment Scale (SAS; Zung, 1971), a 20-item instrument designed to quantitatively assess anxiety symptoms on a 4-point ordinal scale (1 = very seldom; 4 = almost always). The scale measures both affective and somatic components of anxiety.
In line with the theoretical framework, three alternative factor models were evaluated to determine the best fit for the instrument’s latent structure.
First, a unidimensional model was tested, assuming all items reflect a single general anxiety factor. This model showed an excellent fit to the empirical data: χ2(170) = 248.63, p < 0.001, χ2/gl = 1.46, CFI = 0.978, TLI = 0.975, RMSEA = 0.039, CI90% [0.028, 0.049], and SRMR = 0.054. However, standardized factor loadings varied: while most items demonstrated adequate loadings (≥0.50), a few, such as items A16 and A17, showed low loadings (<0.20), suggesting a weaker contribution to the overall anxiety construct.
Next, a two-factor correlated model was evaluated, separating affective and somatic symptoms. This model also presented an excellent fit, closely matching the unidimensional model: χ2(169) = 244.54, p < 0.001, χ2/gl = 1.45, CFI = 0.979, TLI = 0.976, RMSEA = 0.038, CI90% [0.027, 0.049] and SRMR = 0.053. Although factor loadings aligned with theoretical expectations, several somatic items still showed moderate to low saturation. Furthermore, the high correlation between factors (r = 0.96) indicated that much of the variance is shared, supporting a general anxiety dimension.
Finally, a second-order hierarchical model was evaluated, in which affective and somatic factors were explained by a general anxiety factor. This model also demonstrated an excellent fit: χ2(168) = 147.94, p = 0.865, χ2/gl = 0.88, CFI = 0.999, TLI = 0.998, RMSEA = 0.000, CI90% [0.000, 0.016] and SRMR = 0.053.
However, this structure did not resolve previous limitations—several items (e.g., A17) continued to show low loadings, and the variance explained by the first-order factors overlapped substantially with the general factor. See Figure 1 for a visual representation of the models.
Table 1 summarizes each model’s main fit indices to facilitate comparison between the different factor structures evaluated. While all three models demonstrated excellent fit, the differences between them were minimal. Given the negligible improvement in model performance, the added complexity of the bifactor and hierarchical models is not justified relative to the more parsimonious unidimensional structure.
Additionally, although the alternative models demonstrated comparable statistical fit, the unidimensional model offers the most parsimonious solution. It aligns with the clinical use of the instrument, which is typically interpreted based on the total score across all items. This scoring approach supports the presence of a single underlying anxiety factor.
Finally, internal consistency analysis yielded a McDonald’s omega value of ω = 0.86, indicating high internal reliability of the SAS.
Although items A16 and A17 showed factor loadings below 0.20, they were retained in the model to maintain alignment with the original structure of the Zung SAS and to ensure comparability with prior research. These items form part of the clinically validated 20-item version, which is typically interpreted as a unidimensional total score. Their inclusion did not compromise the overall model fit or internal consistency. However, their low contribution is noted, and future studies may consider revising or replacing these items in adapted versions of the scale.

3.2. Descriptive Analysis of Anxiety and Contextual Factors of Distress

Anxiety levels were assessed using the Anxiety Self-Assessment Scale (SAS; Zung, 1971). The mean score in the sample was M = 41.54 (SD = 10.13). Based on established clinical cut-off points, the majority of students fell within the normal range (57.6%, n = 155), while 24.5% (n = 66) exhibited symptoms consistent with minimal to moderate anxiety. A smaller group, 4.8% (n = 13), reported marked or severe anxiety levels. No participants fell into the category of extreme or maximal anxiety.
As shown in the violin plot in Figure 2, anxiety scores ranged approximately from 20 to 75, with a median close to 42. The distribution appears moderately symmetrical, with a higher concentration of scores around the center. This pattern aligns with the clinical categorization of most participants falling within the normal or mild anxiety range.

3.2.1. Distribution of Anxiety by Sex

No statistically significant differences were observed between men and women (t(262) = 1.05, p = 0.295). Both groups displayed a similar distribution of anxiety scores.

3.2.2. Distribution of Anxiety by Age Group

Anxiety levels tended to cluster at moderate levels across all age groups. The 21–23 age group showed a slight tendency toward higher scores, potentially reflecting a more demanding stage of academic progression; however, these differences were not statistically significant (F(3, 260) = 0.32, p = 0.809).

3.2.3. Contextual Stressors Across Sociodemographic Subgroups

In addition to emotional symptoms, the presence (1) or absence (0) of 38 contextual factors potentially contributing to distress was assessed using dichotomous coding. These factors included academic, personal, family, social, and structural domains. Their frequency varied widely, highlighting the diversity of stressors experienced by students in the sample.
The decision to use a dichotomous (presence/absence) response format was guided by both methodological and practical considerations. First, given the number of items (n = 38), this format reduced cognitive load and completion time, enabling efficient administration in classroom settings. Second, binary responses were better suited to the intended analytic strategy—specifically, cluster analysis—where the goal was to identify emotional risk profiles based on combinations of stressors rather than perceived intensity. While a Likert-type scale could have captured subjective severity more precisely, the binary format facilitated clearer segmentation of distress patterns and improved the interpretability of the resulting clusters.
The most frequently reported factors included:
  • The degree completion process (@3)—reported by 41.6% of participants, likely reflecting anxiety around graduation requirements and related administrative procedures;
  • The certification process (@4), present in 34.9%, representing another formal academic demand;
  • Fear of not finding a job after graduation (@5)—noted by 40.9%, underscoring concerns about post-graduation employment;
  • Personal economic situation (@21)—reported by 27.9%, pointing to material hardship as a contributor to anxiety;
  • To a lesser extent, parental relationship issues (@22), cited by 8.2%, potentially reflecting family conflict observed from the student’s perspective.
At the other extreme, several factors showed low prevalence:
  • Issues with academic authorities (@7)—reported by only 4.5%, suggesting minimal concern related to institutional management.
  • Disinterest in the chosen career (@12)—4.8%, indicating low levels of vocational misalignment.
  • Social pressure from friends (@25)—7.1%.
  • Romantic relationships (@26)—8.2%).
  • Current employment (@38)—11.5%, suggesting that relatively few students face emotionally distressing work conditions.
These results offer a nuanced profile of the distress experienced by students, indicating that the most prominent sources of concern are academic demands, job insecurity, and financial hardship. In contrast, interpersonal or vocational dissatisfaction appears less prevalent in this sample.
A general distress index was also calculated by summing the number of contextual stressors reported per participant. Scores ranged from 0 to 31 out of a possible 38, with a mean of 8.34. Quartile analysis showed that 25% of students reported one or no source of distress, 50% reported up to eight, and 75% reported 13 or fewer. These results reflect substantial individual variability in exposure to stressors, with many students experiencing multiple, concurrent sources of emotional distress.
Twenty-five percent of the sample reported one or no source of distress, while 50% experienced up to eight, and 75% reported 13 or fewer. These findings indicate substantial individual variability in exposure to anxiety-related risk factors, with many students facing multiple concurrent sources of emotional distress.

3.2.4. Distribution of Total Reported Stress Factors by Sex

No significant differences were found between men and women in the total number of reported distress factors. Both groups tended to report a moderate range of contextual stressors (t(262) = 0.73, p = 0.468).

3.2.5. Distribution of Total Reported Stress Factors by Age Group

Similarly, no significant differences were observed across age groups in the total distress factors reported (F(3, 260) = 0.69, p = 0.562). However, the cumulative presence of risk factors may act as a predictor of emotional symptomatology and is therefore included in the multivariate analyses that follow to assess its relative impact on anxiety levels.

3.3. Participants’ Emotional Risk Profiles

A cluster analysis using the k-means algorithm was conducted to identify emotional risk profiles among participants, based on the presence or absence of 38 dichotomous variables representing potential causes of emotional distress (coded as @1 to @38).
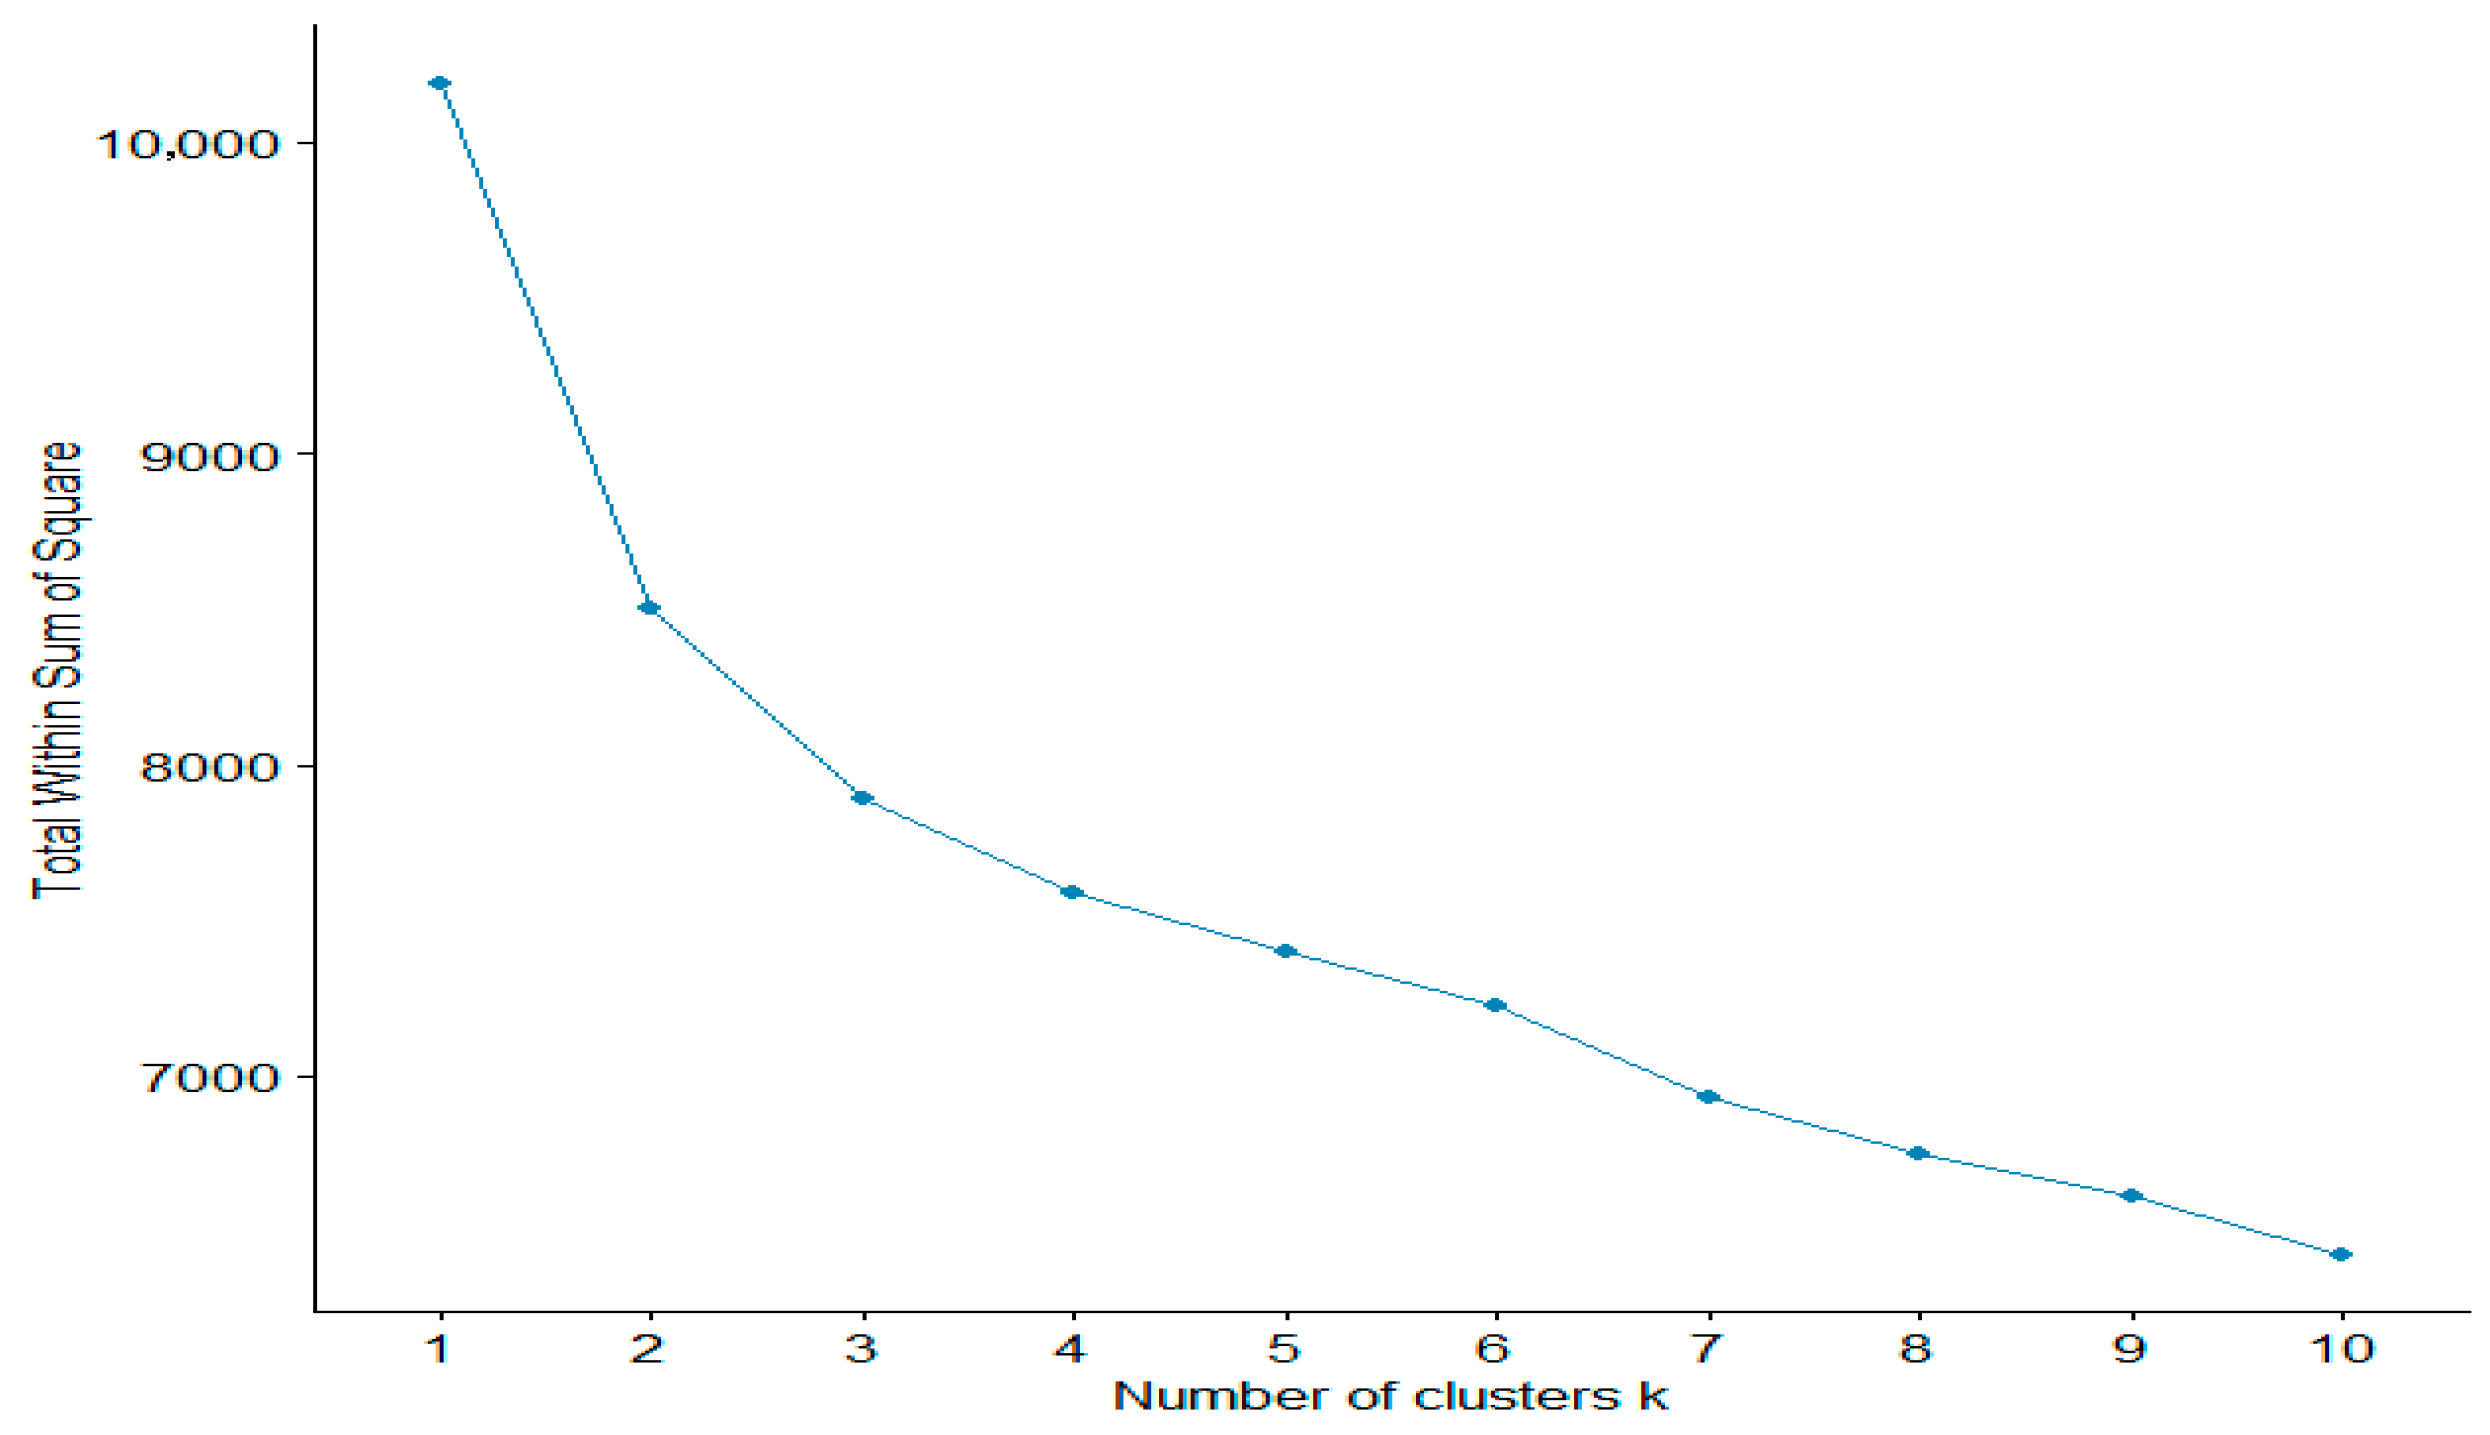
The elbow method was applied to determine the optimal number of clusters (see Figure 3). This method plots the Total Within-Cluster Sum of Squares (WSS) against increasing values of k (number of clusters). As shown, the WSS drops sharply from k = 1 to k = 3, after which the curve begins to flatten. This inflection point suggests diminishing returns in model improvement beyond three clusters, indicating that k = 3 provides a suitable balance between model simplicity and data representation. Although the elbow method is a practical and widely used criterion for determining the number of clusters, we acknowledge that alternative internal validation techniques (e.g., silhouette analysis or hierarchical clustering) could offer additional insights. These approaches are recommended for future research. Accordingly, a three-cluster solution was selected as the most parsimonious and meaningful approach for describing participants’ psychological profiles based on the 38 reported sources of emotional distress.
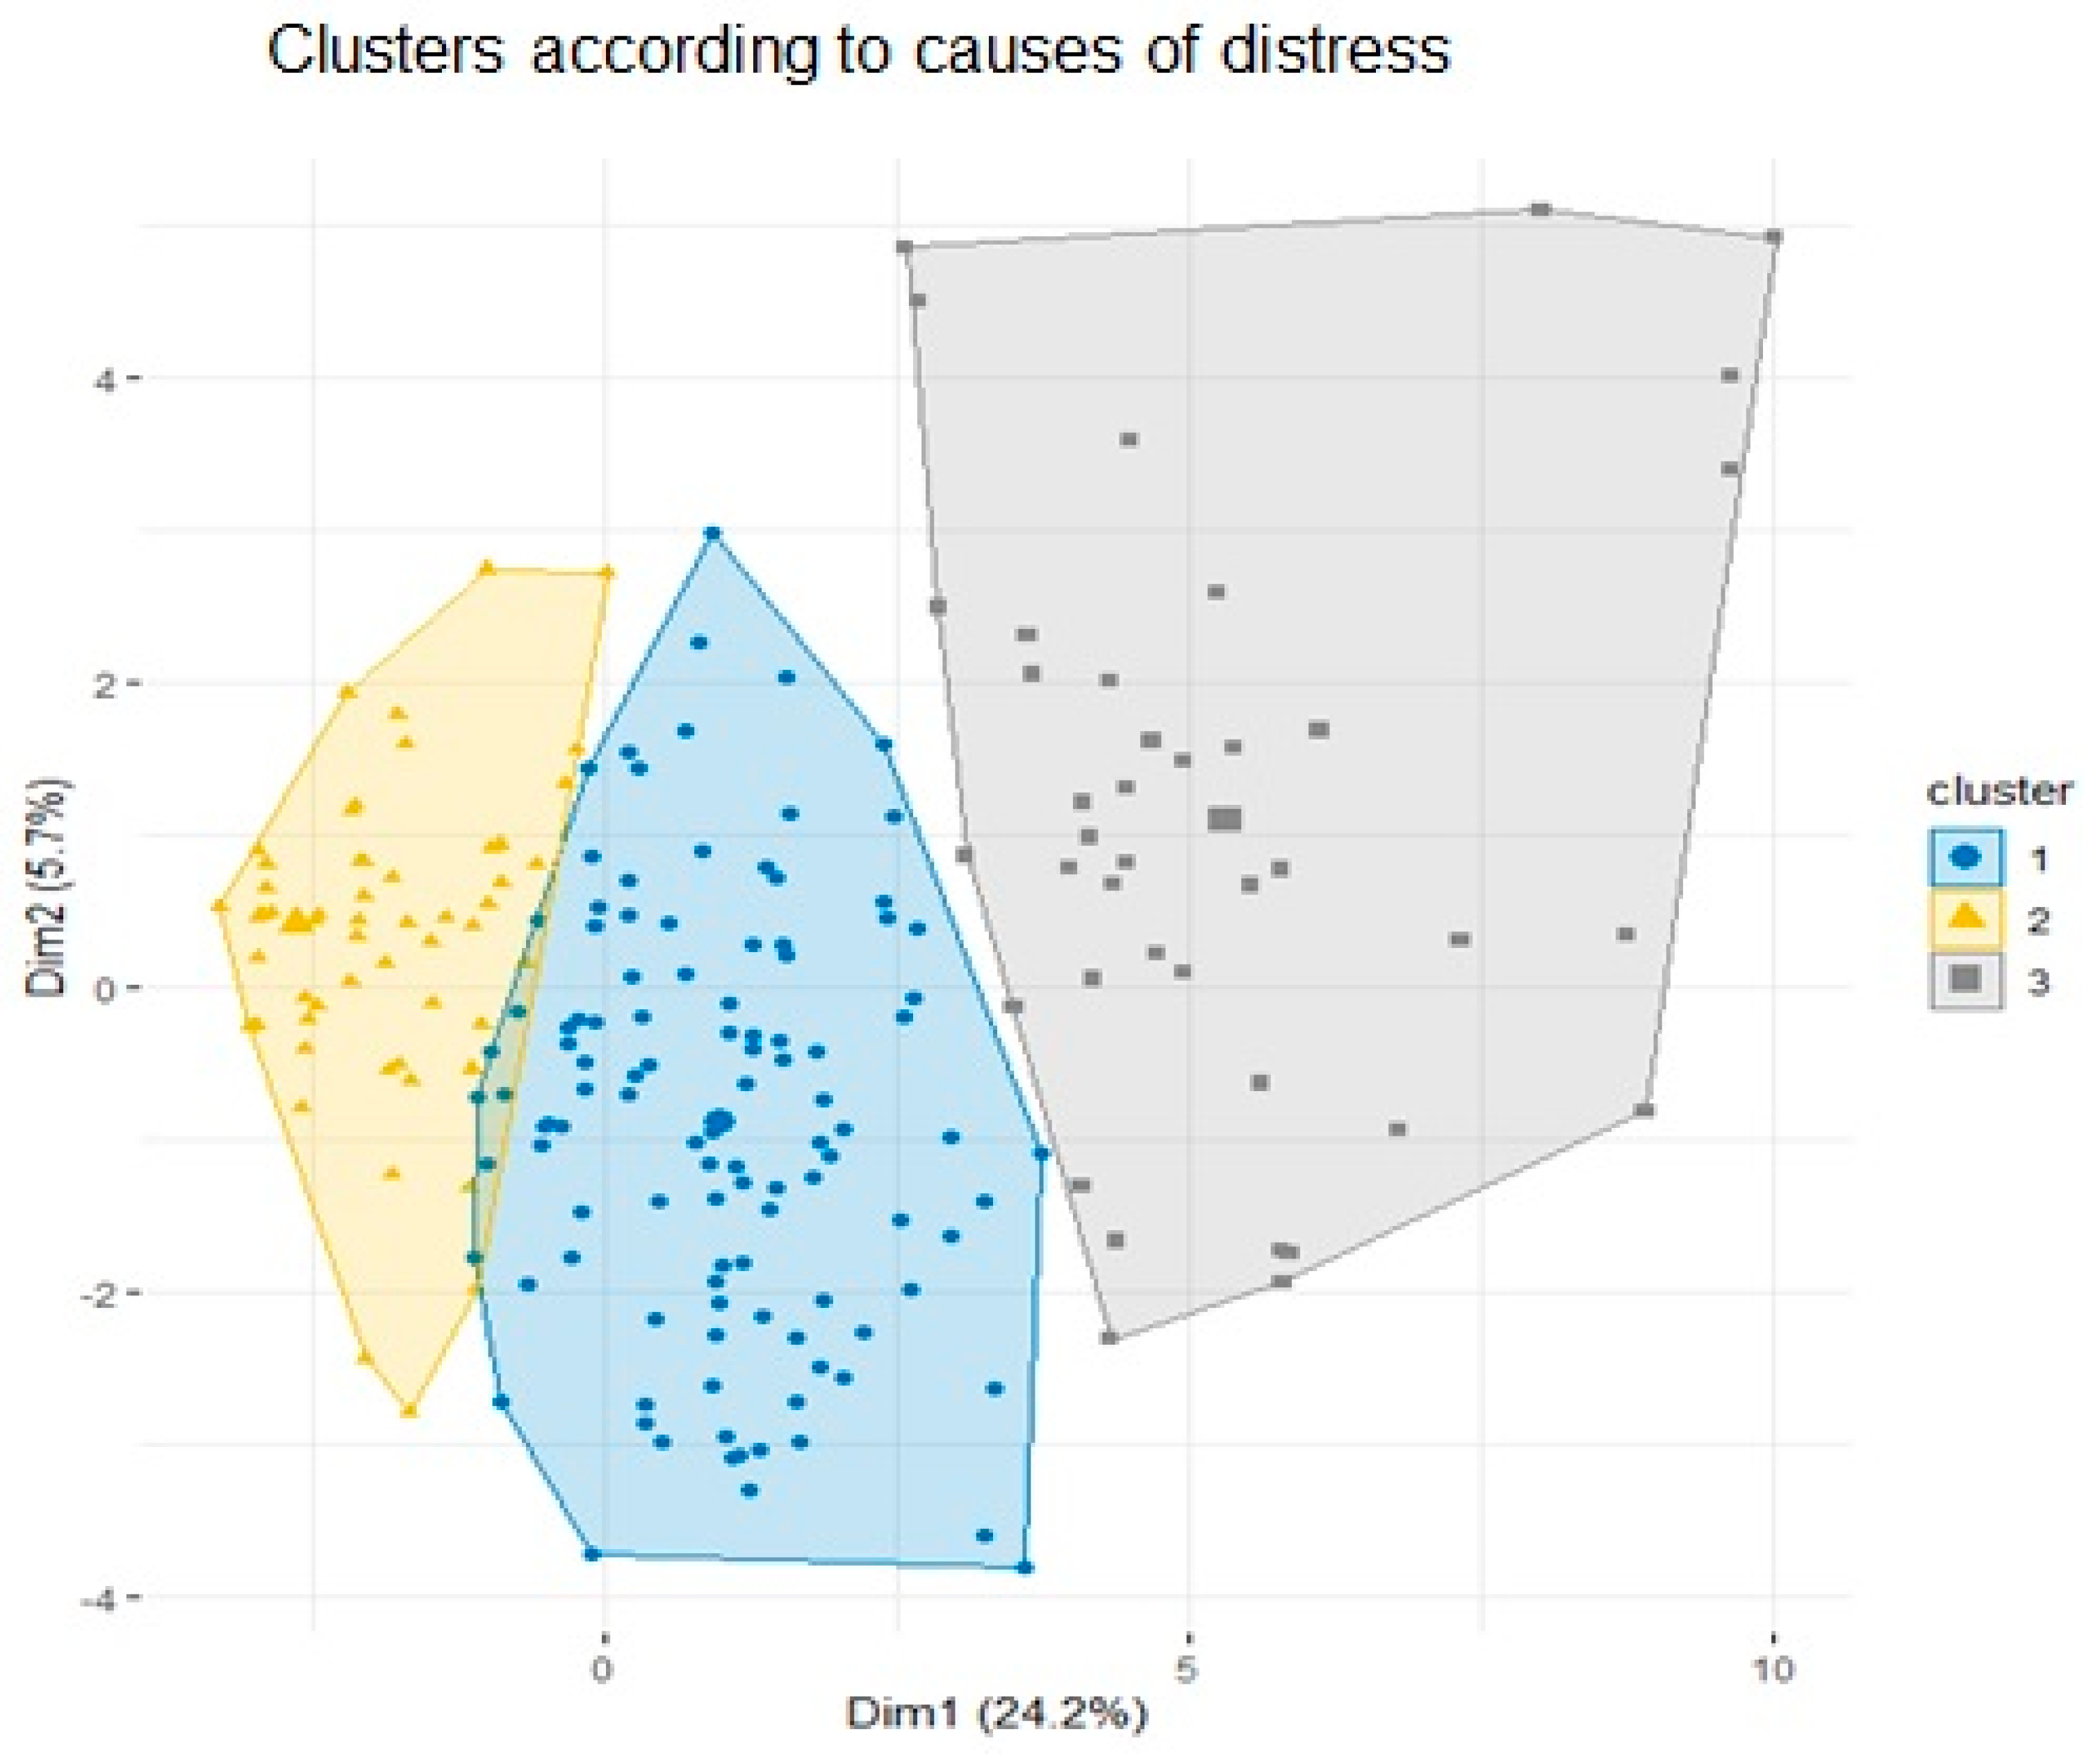
Figure 4 presents the projection of participants onto two principal dimensions extracted through principal component analysis (PCA), which together account for 30% of the total variance (Dim1 = 24.2%, Dim2 = 5.7%). Each point represents an individual participant, grouped according to their cluster assignment. Convex ellipses are used to delineate the space occupied by each cluster, providing a visual representation of group separation and overlap.
Based on PCA projection in Figure 4, the following conclusions can be drawn:
-
Cluster 1 (blue, dots) is the largest and most dispersed group, spanning a broad section of the horizontal axis. Its central concentration suggests a mixed profile, characterized by a moderate and varied presence of distress factors without a dominant pattern of accumulation or absence.
-
Cluster 2 (yellow, triangles) is positioned to the left of the factor space and displays a more compact structure. Its concentration in negative Dim1 values likely indicates a profile with a low number of distress factors, consistent with lower overall emotional risk.
-
Cluster 3 (gray, squares) appears on the right side of the graph and represents participants with a higher accumulation of distress factors, as indicated by their extreme position on Dim1. The expanded shape of this cluster reflects greater internal variability in the types and combinations of stressors reported.
Overall, the cluster analysis effectively segmented participants into distinct groups based on their exposure to emotional distress factors. This segmentation provides a valuable foundation for identifying psychosocial risk profiles and tailoring future interventions to the specific needs of each group.

3.4. Anxiety Levels According to Distress Clusters

One-factor analyses of variance (ANOVA) were conducted to examine whether there were significant differences in anxiety scores as a function of the clusters obtained from the 38 distress factors.
The analysis revealed statistically significant differences in anxiety levels across the three clusters, F(2, 231) = 17.54, p < 0.001, partial η2 ≈ 0.13. This represents a medium effect size, suggesting that cluster membership, based on distress profiles, accounts for a meaningful proportion of the variance in anxiety levels. In other words, participants’ anxiety levels differed consistently depending on their exposure to various distress factors.
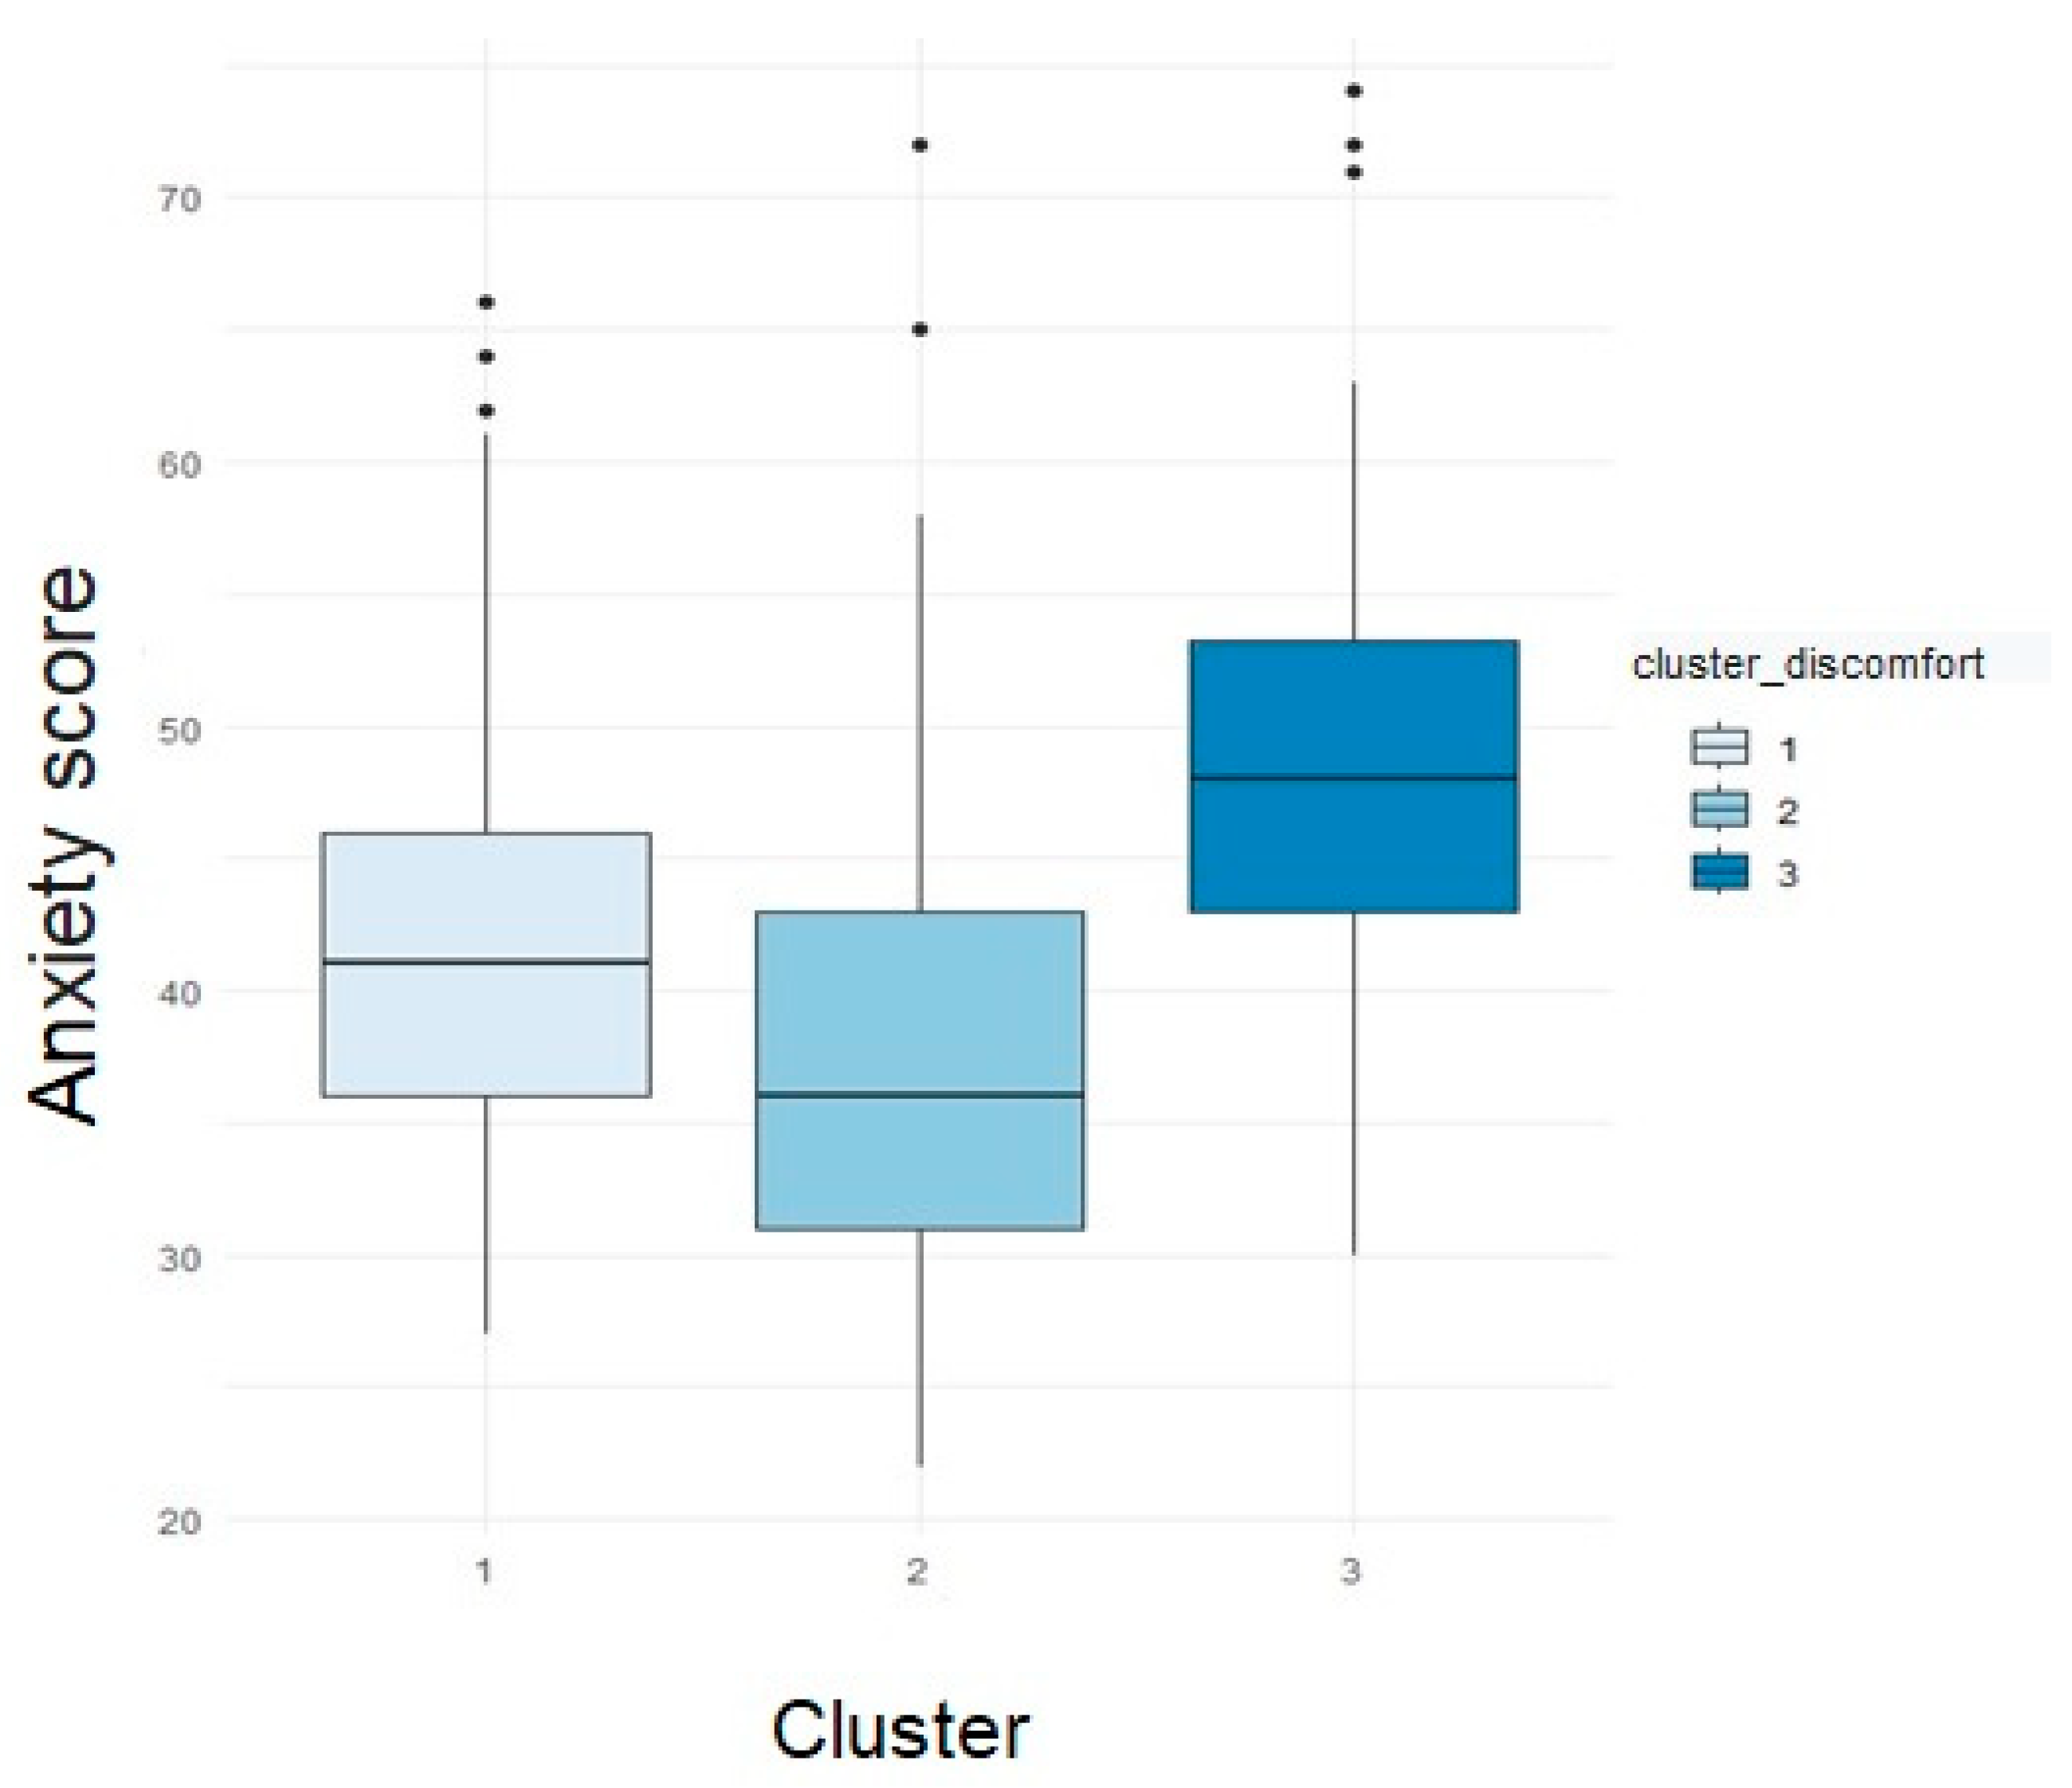
Figure 5 displays a boxplot illustrating the distribution of anxiety scores by cluster:
  • Cluster 1 shows a median anxiety score around 41, with moderate dispersion and a few outliers exceeding 60 points.
  • Cluster 2 exhibits the lowest median (~35), indicating the lowest concentration of anxiety symptoms. This group also shows a higher density of cases in the lower quartiles, suggesting a profile of relatively low emotional vulnerability.
  • Cluster 3, in contrast, has the highest median (~48) and a wider interquartile range, suggesting greater internal variability and heightened emotional vulnerability within the group. Extreme values further reflect the heterogeneous nature of this cluster.
These results are consistent with the ANOVA findings, which indicated statistically significant differences between groups, F(2, 231) = 17.54, p < 0.001, supporting the existence of distinct emotional risk profiles based on contextual distress exposure.

4. Discussion

This study provides a comprehensive understanding of anxiety among pre-service English language teachers in Ecuador, confirming key theoretical assumptions while offering novel empirical evidence from an underrepresented regional context. The findings, framed within five hypotheses, illuminate the factorial structure of anxiety assessment tools, the prevalence and typology of anxiety symptoms, the impact of contextual stressors on emotional risk profiles, and the predictive role of academic and socioeconomic pressures. Together, these results reveal the multifaceted nature of anxiety in teacher education, particularly in environments marked by structural precarity, social and political conflict, and uncertain professional prospects.

4.1. Discussion by Hypothesis

Hypothesis 1. 
Factorial Structure of the SAS.
Consistent with Zung’s original model and previous studies in student populations (De la Ossa et al., 2009; Dunstan et al., 2017; Taylor, 2014), confirmatory factor analysis validated the unidimensional structure of the Zung Self-Rating Anxiety Scale (SAS) for this cohort. While alternative factorial models presented marginally better statistical fit, the unidimensional model demonstrated greater parsimony and practical value, particularly for use in educational settings. Given its simplicity and ease of interpretation, this structure is well suited for screening purposes within pre-service teaching programs, where clarity and efficiency are essential.
Hypothesis 2. 
Prevalence of Anxiety Levels.
Hypothesis 2 predicted that most participants would report anxiety levels within the normal or mild range, with a significant minority experiencing moderate or subclinical symptoms. The findings supported this prediction: most respondents fell within the normal to mild categories. However, a notable proportion of students reported moderate to severe symptoms, aligning with the post-pandemic anxiety trends documented by Son et al. (2020) and the World Health Organization (2022). These results highlight the enduring psychological burden faced by university students and confirm that academic and occupational stressors—particularly uncertainty about future employment—remain key triggers of anxiety (Ginevra et al., 2016).
Hypothesis 3. 
Emotional Risk Profiles and Contextual Stress.
This hypothesis proposed that contextual stressors would cluster into distinct emotional risk profiles. Cluster analysis confirmed this prediction, identifying three differentiated profiles, one of which was characterized by high cumulative stress exposure. This high-risk group showed elevated anxiety levels primarily associated with economic hardship and fear of unemployment, stressors directly aligned with the Job Demands–Resources (JD-R) model (Bakker & Demerouti, 2007). These findings not only confirm the heterogeneity of stress responses among students, but also reinforce the argument that perceived professional instability is a key contributor to emotional distress during the transition to the workforce (Arnett, 2004).
Hypothesis 4. 
Anxiety Levels Across Risk Profiles.
Consistent with Hypothesis 4, students in the high-stress cluster reported significantly higher anxiety levels compared to those in lower-risk groups. This pattern supports prior findings highlighting the cumulative effect of stress on academic anxiety and emotional well-being (Gkonou, 2017; Liu & Jackson, 2008). Similarly, studies by Vázquez et al. (2021) and Yánez Yánez (2023) have linked contextual insecurity to adverse emotional and academic outcomes. Interestingly, while some research (Ashqui et al., 2024; Ruiz-Segarra, 2021) suggests that moderate to severe anxiety does not always impair academic performance, this discrepancy may be explained by individual coping strategies or access to institutional support, which can buffer the adverse effects of stress.
Hypothesis 5. 
Predictive Role of Contextual Factors.
Multiple regression analysis confirmed that academic demands, economic insecurity, and fear of professional failure significantly predicted anxiety levels, independent of gender and age. Specifically, academic pressure and financial instability emerged as the strongest predictors, highlighting the dominant influence of contextual stressors over demographic variables. These findings align with the conceptualization of anxiety as an adaptive response to overwhelming demands in the absence of sufficient coping resources (Spielberger, 1983; Bakker & Demerouti, 2007). Consistent with the prior literature, this study reinforces the emotional impact of academic overload (Salmela-Aro & Upadyaya, 2014), fear of unemployment (Verger et al., 2019), and the erosion of family and institutional support systems (Beiter et al., 2015; Levecque et al., 2017)—all of which contribute significantly to the psychological strain observed among pre-service teachers in this study.

4.2. Integrative Discussion: Cross-Hypothesis Insights

Beyond the specific findings related to each hypothesis, the results of this study invite broader reflection on the multifactorial nature of anxiety among pre-service English language teachers. One particularly notable pattern concerns the influence of developmental timing. Although no statistically significant differences emerged across academic levels, students aged 21 to 23—typically nearing graduation—reported higher anxiety levels. This suggests that approaching workforce entry is a key stressor, heightening uncertainty and self-doubt. These findings partly diverge from those of Moreta-Herrera et al. (2021), who emphasized socio-academic factors, but align with research on vulnerabilities linked to emerging adulthood (Arnett, 2004). While academic level was recorded, it was not included as a predictor in the analyses. Age was used as a proxy, assuming academic progression generally aligns with age. Future research should model academic level directly to assess whether different stages of teacher training are associated with distinct emotional risk profiles.
Another key insight concerns the role of gender. Contrary to expectations based on prior studies (e.g., Izurieta-Brito et al., 2022; Velásco et al., 2021), no significant gender-based differences in anxiety levels were observed. This suggests that, within the Ecuadorian context, shared structural pressures, such as economic hardship and job insecurity, may override traditional gender differences, leading to a convergence of vulnerability profiles among male and female students. This finding highlights the need for further research into how collective contextual stressors may homogenize emotional responses among diverse student subgroups.
Several factors may explain the absence of gender-based differences in anxiety levels. Structural stressors, such as financial precarity, academic overload, and employment uncertainty, may affect male and female students with comparable intensity, overshadowing traditional gender disparities in emotional vulnerability. Additionally, the Zung SAS may lack the sensitivity to detect gender-specific patterns in the expression of anxiety symptoms (Dunstan & Scott, 2020). Cultural norms around emotional disclosure may also play a role: for instance, in certain Latin American societies, men may be more inclined to express distress, whereas women may downplay or trivialize their emotional struggles. These factors, collectively, may contribute to the statistical convergence observed and warrant further qualitative investigation.
While Hypotheses 1 and 5 were tested using formal inferential procedures (e.g., confirmatory factor analysis and regression analysis), Hypotheses 3 and 4 involved exploratory techniques such as cluster analysis. These methods enabled the identification of emergent emotional profiles but were not designed to provide formal statistical tests of group classification. Consequently, the descriptive nature of these analyses limits the generalizability of the findings. Future research could enhance the inferential strength of group-based hypotheses by incorporating supervised classification models or latent class analysis.
One limitation of the clustering procedure is the absence of internal validation methods, such as silhouette analysis or dendrogram-based comparisons. While the elbow method supported a three-cluster solution, future studies should apply multiple algorithms and validation indices to increase the robustness and generalizability of emotional profile classifications.
Another limitation of this study lies in the use of a dichotomous (presence/absence) response format in the survey of contextual anxiety factors. While this approach supported efficient administration and was well suited to the cluster analysis design, it did not capture the perceived intensity of each stressor. Future research could incorporate Likert-type scales to assess both the presence and severity of anxiety-inducing factors, allowing for more nuanced analyses of emotional vulnerability.
The findings of this study can also be meaningfully interpreted through the lens of the Job Demands–Resources (JD-R) model (Bakker & Demerouti, 2007). According to this framework, stress arises when external demands exceed available personal or institutional resources. In our sample, factors such as heavy academic workload, uncertainty about graduation, and financial instability functioned clearly as ‘demands’, while protective resources such as emotional support, mentoring, or financial aid were notably absent or underutilized. The emotional risk profiles identified via cluster analysis reflect this imbalance: the group with the highest cumulative anxiety also faced the greatest concentration of academic and economic pressures. The JD-R model thus offers a coherent theoretical lens through which to interpret the variability in emotional outcomes observed in this study.
This study also reaffirms the complex interplay between personal perceptions and structural conditions. Many students reported external concerns —such as job scarcity—and internalized distress, including self-doubt and fears of professional inadequacy. This dual dimension supports Ginevra et al.’s (2016) assertion that employability anxiety arises from a combination of external realities and internal beliefs about competence and readiness.
By integrating statistical and contextual insights, this study reveals a multidimensional landscape of student anxiety. Confirmatory factor analysis validated a factorial structure combining both affective and somatic symptoms, suggesting that anxiety manifests in complex, embodied ways among future teachers. These dimensions are not abstract; they map directly onto students’ lived experiences, including persistent financial concerns, perceived job scarcity, and demanding academic workloads. Similarly, the three emotional risk profiles identified via cluster analysis reflect not only individual psychological tendencies but also structural inequalities and institutional blind spots. This synthesis underscores the importance of interpreting quantitative findings as expressions of real and systemic challenges faced by students in Ecuadorian higher education, not as isolated psychological phenomena.
Finally, the role of media exposure was revealed to be a potentially underexplored source of psychological distress. In line with Chamba (2024), students exposed to extensive media coverage of violence and insecurity reported increased fear and emotional vulnerability. In this regard, media representations not only provide information but also act as emotional amplifiers, influencing students’ perceptions of safety, control, and stability in academic and broader social contexts.

4.3. Educational and Institutional Implications

Beyond their academic relevance, this study’s findings have practical implications for educational institutions, teacher educators, and policymakers. The presence of significant anxiety, even among students at early or intermediate stages of their academic careers, suggests that mental health support should not be reserved for students nearing graduation. Instead, educational institutions should implement preventive strategies that promote emotional well-being from the outset of teacher training.
Curricular reforms can play a key role in this effort. Incorporating formative assessment strategies, fostering low-stakes speaking opportunities, and integrating emotional scaffolding into practicum and language modules may help reduce anxiety related to communication performance and pedagogical self-efficacy. These approaches align with the findings of Gkonou (2017) and Chapell et al. (2005), who emphasized the long-term impact of academic anxiety on student engagement and the formation of professional identity.
At the institutional level, it is critical to ensure that mental health services, academic mentoring, and financial aid are both accessible and destigmatized. Students facing socioeconomic vulnerability require comprehensive and coordinated support systems that address the combined effects of academic pressure, economic hardship, and emotional strain. As Saravanan and Wilks (2014) and Beiter et al. (2015) argue, effective interventions must be multidimensional, targeting not only individual symptoms but also structural inequalities that exacerbate emotional risk.
Moreover, the results underscore the need to build resilient educational ecosystems. Universities should cultivate environments that prioritize psychosocial safety, encourage peer solidarity, and support the development of adaptive coping mechanisms. Achieving this requires cross-sector collaboration among academic, administrative, and psychological services, with special attention to students nearing the transition to professional life, who appear particularly vulnerable.
From a structural perspective, this study invites reflection on the role of teacher preparation programs as platforms for developing both professional and emotional readiness. Preparing future educators must involve not only equipping them with pedagogical competencies but also strengthening their ability to cope with uncertainty, manage stress, and foster emotional resilience. These skills are essential not only for personal well-being but also for fostering inclusive, emotionally supportive learning environments for future learners.
Ultimately, these findings call for a broader, systemic commitment to embedding mental health support into the foundation of teacher education—not as a reactive response, but as an integral component of pedagogical training. Future policies must recognize that the emotional well-being of prospective educators is a prerequisite for educational quality, with long-term implications for resilience and inclusivity within educational systems. Building emotionally sustainable schools begins with emotionally supported teachers.

5. Conclusions

This study provides empirical evidence of the multidimensional impact of contextual stressors on anxiety among pre-service English language teachers in Ecuador. By identifying distinct emotional risk profiles and key anxiety predictors, the findings lay the groundwork for more targeted and effective interventions aimed at fostering resilience, confidence, and emotional well-being in future educators.
The results highlight academic pressure and financial insecurity as the most significant predictors of anxiety in this population, followed by high parental expectations, fear of failure, and uncertainty about future career prospects. These findings emphasize the urgent need to prioritize emotional well-being during teacher training, particularly in contexts characterized by structural precarity.
In psychometric terms, this study also provides strong evidence to support the validity and practical utility of the Zung Self-Rating Anxiety Scale (SAS) in higher education settings. The unidimensional structure of the SAS proved the most parsimonious and interpretable, reinforcing its suitability for educational screening purposes. While most students reported normal or mild anxiety levels, the presence of moderate to severe symptoms in a substantial proportion of the sample highlights the ongoing mental health crisis within university environments.
A key contribution of this study is its identification of contextual factors that exacerbate perceptions of vulnerability and emotional strain. In particular, citizen insecurity and exposure to emotionally charged social media content were identified as amplifiers of distress, influencing students’ personal and academic well-being. These findings are consistent with the previous literature linking anxiety to diminished academic performance and an increased risk of dropout, even if such relationships do not always reach statistical significance. The results point to the importance of adopting a multi-causal, nuanced perspective when analyzing academic and emotional outcomes.
As with any study, certain limitations must be acknowledged. The sample was restricted to pre-service English teachers from a single public university in Ecuador, limiting generalizability to other educational programs or geographical contexts. The use of self-report instruments introduces potential response bias, especially given the sensitivity of anxiety-related disclosures (Paulhus & Vazire, 2007). Moreover, the cross-sectional design prevents causal inference.
Additional limitations include the absence of qualitative data, which constrains this study’s ability to explore subjective nuances—such as students’ personal narratives of anxiety or the language they use to describe emotional distress. Future studies would benefit from a mixed-methods approach incorporating interviews or narrative analysis (Creswell & Poth, 2016), as well as longitudinal designs that track anxiety trajectories across different stages of teacher preparation.
Further research should also examine the role of institutional culture, integrate evidence-based socioemotional training programs into teacher education curricula, and investigate teacher identity development as a mediating factor in emotional outcomes. These areas of inquiry are critical to building emotionally sustainable pathways in teacher education.
Based on these findings, we recommend that teacher training institutions, particularly in low- and middle-income contexts, implement concrete measures to address anxiety and emotional risk among pre-service teachers. These include: (1) integrating socioemotional learning modules into the curriculum to build coping skills and emotional literacy; (2) establishing culturally responsive mentoring programs that provide both academic and personal support; and (3) implementing early-warning systems using brief mental health screening tools, with protocols for timely referral to psychological services. Collectively, these actions can help build a more resilient, supported, and emotionally prepared teaching workforce.

Author Contributions

Conceptualization, J.E.B.P. and N.I.-M.; methodology, J.E.B.P.; software, J.S.V.H.; validation, J.E.B.P., N.I.-M. and J.S.V.H.; formal analysis, J.E.B.P.; investigation, J.E.B.P.; resources, A.G.; data curation, J.E.B.P.; writing—original draft preparation, J.E.B.P.; writing—review and editing, N.I.-M.; visualization, A.G.; supervision, N.I.-M.; project administration, I.A.; funding acquisition, N.I.-M. All authors have read and agreed to the published version of the manuscript.

Funding

This research was funded by the KideOn Research Group of the Basque Government.

Institutional Review Board Statement

The study was conducted in accordance with the Declaration of Helsinki, and approved by the Ethics Committee of the University of the Basque Country (UPV/EHU) (protocol code M10_2022_324, 24 February 2023).

Informed Consent Statement

Informed consent was obtained from all subjects involved in the study.

Data Availability Statement

The data that support the findings of this study are available from the corresponding author upon reasonable request.

Acknowledgments

The authors collaborated with the Basque Country University in Spain and Eloy Alfaro University in Ecuador.

Conflicts of Interest

The authors declare no conflicts of interest.

References

  1. Adrianzén, C. S. (2021). Influencia de la ansiedad en el aprendizaje del idioma inglés como lengua extranjera en estudiantes de educación superior. INNOVA Research Journal, 6(3), 58–78. [Google Scholar] [CrossRef]
  2. Arnett, J. J. (2004). Emerging adulthood: The winding road from the late teens through the twenties. Oxford University Press. [Google Scholar]
  3. Ashqui, A., Zambrano, M., Vallejo, T., Figueroa, P., Salazar, R., & Alvarado, J. (2024). Influence of emotional health on academic performance in students of a higher education institution. LATAM Revista Latinoamericana de Ciencias Sociales y Humanidades, 5(2), 1154–1166. [Google Scholar] [CrossRef]
  4. Auerbach, R. P., Mortier, P., Bruffaerts, R., Alonso, J., Benjet, C., Cuijpers, P., Demyttenaere, K., Ebert, D. D., Green, J. G., Hasking, P., Murray, E., Nock, M. K., Pinder-Amaker, S., Sampson, N. A., Stein, D. J., Vilagut, G., Zaslavsky, A. M., & Kessler, R. C. (2016). WHO World mental health surveys international college student project: Prevalence and distribution of mental disorders. Journal of Abnormal Psychology, 127(7), 623–638. [Google Scholar] [CrossRef] [PubMed]
  5. Bakker, A. B., & Demerouti, E. (2007). The job demands–Resources model: State of the art. Journal of Managerial Psychology, 22(3), 309–328. [Google Scholar] [CrossRef]
  6. Beck, A. T., & Steer, R. A. (1993). Beck anxiety inventory manual. Psychological Corporation. [Google Scholar]
  7. Beiter, R., Nash, R., McCrady, M., Rhoades, D., Linscomb, M., Clarahan, M., & Sammut, S. (2015). The prevalence and correlates of depression, anxiety, and stress in a sample of college students. Journal of Affective Disorders, 173, 90–96. [Google Scholar] [CrossRef] [PubMed]
  8. Bronfenbrenner, U. (1979). The Ecology of Human Development: Experiments by Nature and Design. Harvard University Press. [Google Scholar] [CrossRef]
  9. Brougham, R. R., Zail, C. M., Mendoza, C. M., & Miller, J. R. (2009). Stress, sex differences, and coping strategies among college students. Current Psychology: A Journal for Diverse Perspectives on Diverse Psychological Issues, 28(2), 85–97. [Google Scholar] [CrossRef]
  10. Brown, T. A. (2015). Confirmatory factor analysis for applied research (2nd ed.). Guilford Press. [Google Scholar]
  11. Browning, M. H. E. M., Larson, L. R., Sharaievska, I., Rigolon, A., McAnirlin, O., Mullenbach, L., Cloutier, S., Vu, T. M., Thomsen, J., Reigner, N., Metcalf, E. C., D’Antonio, A., Helbich, M., Bratman, G. N., & Reigner, N. (2021). Psychological impacts from COVID-19 among university students: Risk factors across seven states in the United States. PLoS ONE, 16(1), e0245327. [Google Scholar] [CrossRef] [PubMed]
  12. Cairns, S. L., Massfeller, H. F., & Deeth, S. C. (2014). Why do post-secondary students seek counselling? Canadian Journal of Counselling and Psychotherapy, 44(1), 34–50. [Google Scholar]
  13. CASEL. (2020). The CASEL guide to schoolwide social and emotional learning. Collaborative for Academic, Social, and Emotional Learning (CASEL). Available online: https://casel.org/ (accessed on 12 April 2025).
  14. Cedeño, A., & Villafuerte-Holguín, J. (2024). Educación es la ruta para superar la violencia e inseguridad: Análisis de la novela “Los Sangurimas” de José de Cuadra. In Innovaciones pedagógicas para el desarrollo humano y sostenible (pp. 64–82). Mawil Ecuador. [Google Scholar] [CrossRef]
  15. Chamba, J. T. (2024). Inseguridad en Quevedo, Ecuador: Percepciones, influencias y repercusiones en la cotidianidad. Revista De Ciencias Sociales, (183), 101–118. [Google Scholar] [CrossRef]
  16. Chapell, M. S., Blanding, Z. B., Silverstein, M. E., Takahashi, M., Newman, B., Gubi, A., & McCann, N. (2005). Test anxiety and academic performance in undergraduate and graduate students. Journal of Educational Psychology, 97(2), 268–274. [Google Scholar] [CrossRef]
  17. Clerque Acuña, K. d. P., Díaz Villarruel, J. J., & Cabascango Vinueza, D. J. (2024). Depresión, ansiedad y estrés en estudiantes universitarios post covid 19 en la carrera de pedagogía de los idiomas nacionales y extranjeros (español—francés—inglés). LATAM Revista Latinoamericana de Ciencias Sociales y Humanidades, 5(4), 1069–1080. [Google Scholar] [CrossRef]
  18. Creswell, J. W., & Poth, C. N. (2016). Qualitative inquiry and research design: Choosing among five approaches. Sage Publications. [Google Scholar]
  19. De la Ossa, S., Martinez, Y., Herazo, E., & Campo, A. (2009). Study of internal consistency and factor structure of three versions of the Zung’s rating instrument for anxiety disorders. Colombia Médica, 40(1), 71–77. [Google Scholar] [CrossRef]
  20. Dunn, T. J., Baguley, T., & Brunsden, V. (2014). From alpha to omega: A practical solution to the pervasive problem of internal consistency estimation. British Journal of Psychology, 105(3), 399–412. [Google Scholar] [CrossRef]
  21. Dunstan, D. A., & Scott, N. (2020). Norms for Zung’s self-rating anxiety scale. BMC Psychiatry, 20(1), 90. [Google Scholar] [CrossRef]
  22. Dunstan, D. A., Scott, N., & Todd, A. K. (2017). Screening for anxiety and depression: Re-evaluating the utility of the Zung scales. BMC Psychiatry, 17, 329. [Google Scholar] [CrossRef] [PubMed]
  23. Eisenberg, D., Golberstein, E., & Gollust, S. E. (2009). Help-seeking and access to mental health care in a university student population. Medical Care, 47(3), 294–301. [Google Scholar] [CrossRef]
  24. Emiro Restrepo, J., Castañeda Quirama, T., & Zambrano Cruz, R. (2022). Sintomatología de depresión y ansiedad en estudiantes universitarios colombianos durante la pandemia covid-19. Ciencia y Enfermería, 28, 19–39. [Google Scholar] [CrossRef]
  25. Encalada, J., & Vega, M. (2024). Efecto de los factores socioeconómicos en la inseguridad social en Ecuador. Revista Ñeque, 7(18), 277–288. [Google Scholar] [CrossRef]
  26. Engel, G. L. (1977). The need for a new medical model: A challenge for biomedicine. Science, 196(4286), 129–136. [Google Scholar] [CrossRef] [PubMed]
  27. Fox, J., & Weisberg, S. (2019). An R companion to applied regression (3rd ed.). Sage. [Google Scholar]
  28. Ginevra, M. C., Pallini, S., Vecchio, G. M., Nota, L., & Soresi, S. (2016). Future orientation and attitudes mediate career adaptability and decidedness. Journal of Vocational Behavior, 95, 102–110. [Google Scholar] [CrossRef]
  29. Gkonou, C. (2017). Towards an ecological understanding of language anxiety. In C. Gkonou, M. Daubney, & J.-M. Dewaele (Eds.), New insights into language anxiety: Theory, research and educational implications (pp. 135–155). Multilingual Matters. [Google Scholar]
  30. Hu, L. T., & Bentler, P. M. (1999). Cutoff criteria for fit indexes in covariance structure analysis: Conventional criteria versus new alternatives. Structural Equation Modeling, 6, 1–55. [Google Scholar] [CrossRef]
  31. Hunt, J., & Eisenberg, D. (2010). Mental health problems and help-seeking behavior among college students. Journal of Adolescent Health, 46(1), 3–10. [Google Scholar] [CrossRef]
  32. Izurieta-Brito, D., Poveda-Ríos, S., Naranjo-Hidalgo, T., & Moreno-Montero, E. (2022). Trastorno de ansiedad generalizada y estrés académico en estudiantes universitarios ecuatorianos durante la pandemia COVID-19. Revista de Neuro-Psiquiatría, 85(2), 86–94. [Google Scholar] [CrossRef]
  33. Jorgensen, T. D., Pornprasertmanit, S., Schoemann, A. M., & Rosseel, Y. (2021). semTools: Useful tools for structural equation modeling (R package version 0.5-4). Available online: https://CRAN.R-project.org/package=semTools (accessed on 17 April 2025).
  34. Kassambara, A., & Mundt, F. (2020). factoextra: Extract and visualize the results of multivariate data analyses (R package version 1.0.7). Available online: https://CRAN.R-project.org/package=factoextra (accessed on 1 April 2025).
  35. Khoshaim, H. B., Al-Sukayt, A., Chinna, K., Nurunnabi, M., Sundarasen, S., Kamaludin, K., Baloch, G. M., & Hossain, S. F. A. (2020). Anxiety level of university students during COVID-19 in Saudi Arabia. Frontiers in Psychiatry, 11, 579750. [Google Scholar] [CrossRef] [PubMed]
  36. Kline, R. B. (2016). Principles and practice of structural equation modeling (4th ed.). Guilford Press. [Google Scholar]
  37. Levecque, K., Anseel, F., De Beuckelaer, A., Van der Heyden, J., & Gisle, L. (2017). Work organization and mental health problems in PhD students. Research Policy, 46(4), 868–879. [Google Scholar] [CrossRef]
  38. Li, C. H. (2016). Confirmatory factor analysis with ordinal data: Comparing robust maximum likelihood and diagonally weighted least squares. Behavior Research Methods, 48(3), 936–949. [Google Scholar] [CrossRef] [PubMed]
  39. Liu, M., & Jackson, J. (2008). An exploration of Chinese EFL learners’ unwillingness to communicate and foreign language anxiety. The Modern Language Journal, 92(1), 71–86. [Google Scholar] [CrossRef]
  40. Misra, R., & McKean, M. (2000). College students’ academic stress and its relation to their anxiety, time management, and leisure satisfaction. American Journal of Health Studies, 16(1), 41–51. [Google Scholar]
  41. Morán Murillo, G. A., Amaiquema Márquez, F. A., Vera Zapata, J. A., & Landívar Morán, G. E. (2024). Medición de la ansiedad en población ecuatoriana una revisión sistemática. Revista Pertinencia Académica. [Google Scholar] [CrossRef]
  42. Moreta-Herrera, R., Zambrano-Estrella, J., Sánchez-Vélez, H., & Naranjo-Vaca, S. (2021). Salud mental en universitarios del Ecuador: Síntomas relevantes, diferencias por género y prevalencia de casos. Pensamiento Psicológico, 19(1), 1–26. [Google Scholar] [CrossRef]
  43. Nguyen, H. T., Do, B. N., Pham, K. M., Kim, G. B., Dam, H. T., Nguyen, T. T., Nguyen, T. T. P., Nguyen, Y. H., Sørensen, K., Pleasant, A., & Duong, T. V. (2021). Fear of COVID-19 scale—Associations of its scores with health literacy and health-related behaviors among medical students. International Journal of Environmental Research and Public Health, 18(8), 4164. [Google Scholar] [CrossRef] [PubMed]
  44. Nunnally, J. C., & Bernstein, I. H. (1994). Psychometric theory (3rd ed.). McGraw-Hill. [Google Scholar]
  45. Ordorika, I., & Rodríguez-Gómez, R. (2020). Field of higher education research in Latin America. In P. N. Teixeira, & J. C. Shin (Eds.), The International Encyclopedia of Higher Education Systems and Institutions (pp. 437–443). Springer. [Google Scholar] [CrossRef]
  46. Owens, M., Stevenson, J., Hadwin, J. A., & Norgate, R. (2012). Anxiety and depression in academic performance: An exploration of the mediating factors of worry and working memory. School Psychology International, 33(4), 433–449. [Google Scholar] [CrossRef]
  47. Palma-Delgado, G. M., & Barcia-Briones, M. F. (2020). El estado emocional en el rendimiento académico de los estudiantes en Portoviejo, Ecuador. Dominio De Las Ciencias, 6(2), 72–100. [Google Scholar]
  48. Paulhus, D. L., & Vazire, S. (2007). The self-report method. Handbook of research methods in personality psychology, 1(2007), 224–239. [Google Scholar]
  49. R Core Team. (2023). R: A language and environment for statistial computing. R Foundation for Statistical Computing. [Google Scholar]
  50. Revelle, W., & Zinbarg, R. E. (2009). Coefficients alpha, beta, omega, and the glb: Comments on Sijtsma. Psychometrika, 74(1), 145–154. [Google Scholar] [CrossRef]
  51. Robotham, D. (2008). Stress among higher education students: Towards a research agenda. Higher Education, 56(6), 735–746. [Google Scholar] [CrossRef]
  52. Rosseel, Y. (2012). Lavaan: An R package for structural equation modeling. Journal of Statistical Software, 48(2), 1–36. [Google Scholar] [CrossRef]
  53. Ruiz-Segarra, M. I. (2021). Ansiedad ante exámenes y hábitos de estudio en educación superior. Horizontes. Revista De Investigación En Ciencias De La Educación, 4(16), 461–468. [Google Scholar] [CrossRef]
  54. Salmela-Aro, K., & Upadyaya, K. (2014). School burnout and engagement in the context of demands–resources model. British Journal of Educational Psychology, 84(1), 137–151. [Google Scholar] [CrossRef]
  55. Salovey, P., Woolery, A., & Mayer, J. D. (2001). Emotional intelligence: Conceptualization and measurement. In Blackwell handbook of social psychology: Interpersonal processes (pp. 279–307). Blackwell Publishers Ltd. [Google Scholar]
  56. Saravanan, C., & Wilks, R. (2014). Medical students’ experience of and reaction to stress: The role of depression and anxiety. The Scientific World Journal, 2014(1), 737382. [Google Scholar] [CrossRef]
  57. Schaufeli, W. B., Bakker, A. B., & Van Rhenen, W. (2009). How changes in job demands and resources predict burnout, work engagement, and sickness absenteeism. Journal of Organizational Behavior, 30(7), 893–917. [Google Scholar] [CrossRef]
  58. Schwartzman, S. (2020). Higher education in Latin America and the challenges of the 21st century. In S. Schwartzman (Ed.), Higher education in Latin America in the 21st century (pp. 1–17). Springer. [Google Scholar] [CrossRef]
  59. Son, C., Hegde, S., Smith, A., Wang, X., & Sasangohar, F. (2020). Effects of COVID-19 on college students’ mental health in the United States: Interview survey study. Journal of Medical Internet Research, 22(9), e21279. [Google Scholar] [CrossRef]
  60. Spielberger, C. D. (1983). Manual for the state-trait anxiety inventory (STAI). Consulting Psychologists Press. [Google Scholar]
  61. Taylor, S. (2014). Anxiety sensitivity: Theory, research, and treatment of the fear of anxiety (2nd ed.). Routledge. [Google Scholar]
  62. Vázquez, J. M. H., Lagunas, J. R., & Piña, M. A. L. (2021). Inseguridad escolar y problemas académicos en una universidad pública mexicana. Revista de Investigación Educativa de la REDIECH, 12, e1114. [Google Scholar] [CrossRef]
  63. Velásco, R. J., Cunalema, J. A., Franco, J. A., & Vargas, G. M. (2021). Estrés percibido asociado a la pandemia por COVID-19 en la ciudad de Guayaquil, Ecuador. Bol. malariol. Salud Ambient, 3, 38–46. Available online: https://docs.bvsalud.org/biblioref/2021/04/1177559/art-2-i-2021.pdf (accessed on 11 April 2025).
  64. Verger, P., Combes, J. B., Kovess-Masfety, V., Evangelista, J. A., Guagliardo, V., Rouillon, F., & Peretti-Watel, P. (2019). Psychological distress in first-year university students: Socioeconomic and academic stressors, mastery and social support in young men and women. Social Psychiatry and Psychiatric Epidemiology, 44(8), 643–650. [Google Scholar] [CrossRef]
  65. Villafuerte-Holguín, J., Bello Piguave, J., Pacheco Delgado, E., & Zavala-Alcivar, A. (2023). Ansiedad y resiliencia laboral en la acreditación de docentes de inglés. Profesorado: Revista de Currículum y Forma-ción del Profesorado, 27(1), 229–253. [Google Scholar]
  66. Wickham, H. (2016). ggplot2: Elegant graphics for data analysis. Springer. Available online: https://ggplot2.tidyverse.org (accessed on 5 July 2025).
  67. Wickham, H., François, R., Henry, L., & Müller, K. (2023). dplyr: A grammar of data manipulation (R package version 1.1.2). Available online: https://CRAN.R-project.org/package=dplyr (accessed on 10 January 2025).
  68. World Health Organization. (2022). World mental health report: Transforming mental health for all. WHO. Available online: https://www.who.int/publications/i/item/9789240049338 (accessed on 11 April 2025).
  69. Yánez Yánez, M. G. (2023). Ansiedad y rendimiento académico en estudiantes de la escuela de medicina de la PUCESA. Available online: https://repositorio.puce.edu.ec/handle/123456789/45343 (accessed on 12 April 2025).
  70. Zhao, H., Rafik-Galea, S., Fitriana, M., & Song, T.-J. (2022). Translation and psychometric evaluation of Smartphone Addiction Scale—Short Version (SAS-SV) among Chinese college students. PLoS ONE, 17(11), e0278092. [Google Scholar] [CrossRef] [PubMed]
  71. Zung, W. W. K. (1965). A self-rating depression scale. Archives of General Psychiatry, 12(1), 63–70. [Google Scholar] [CrossRef]
  72. Zung, W. W. K. (1971). A rating instrument for anxiety disorders. Psychosomatics, 12(6), 371–379. [Google Scholar] [CrossRef]
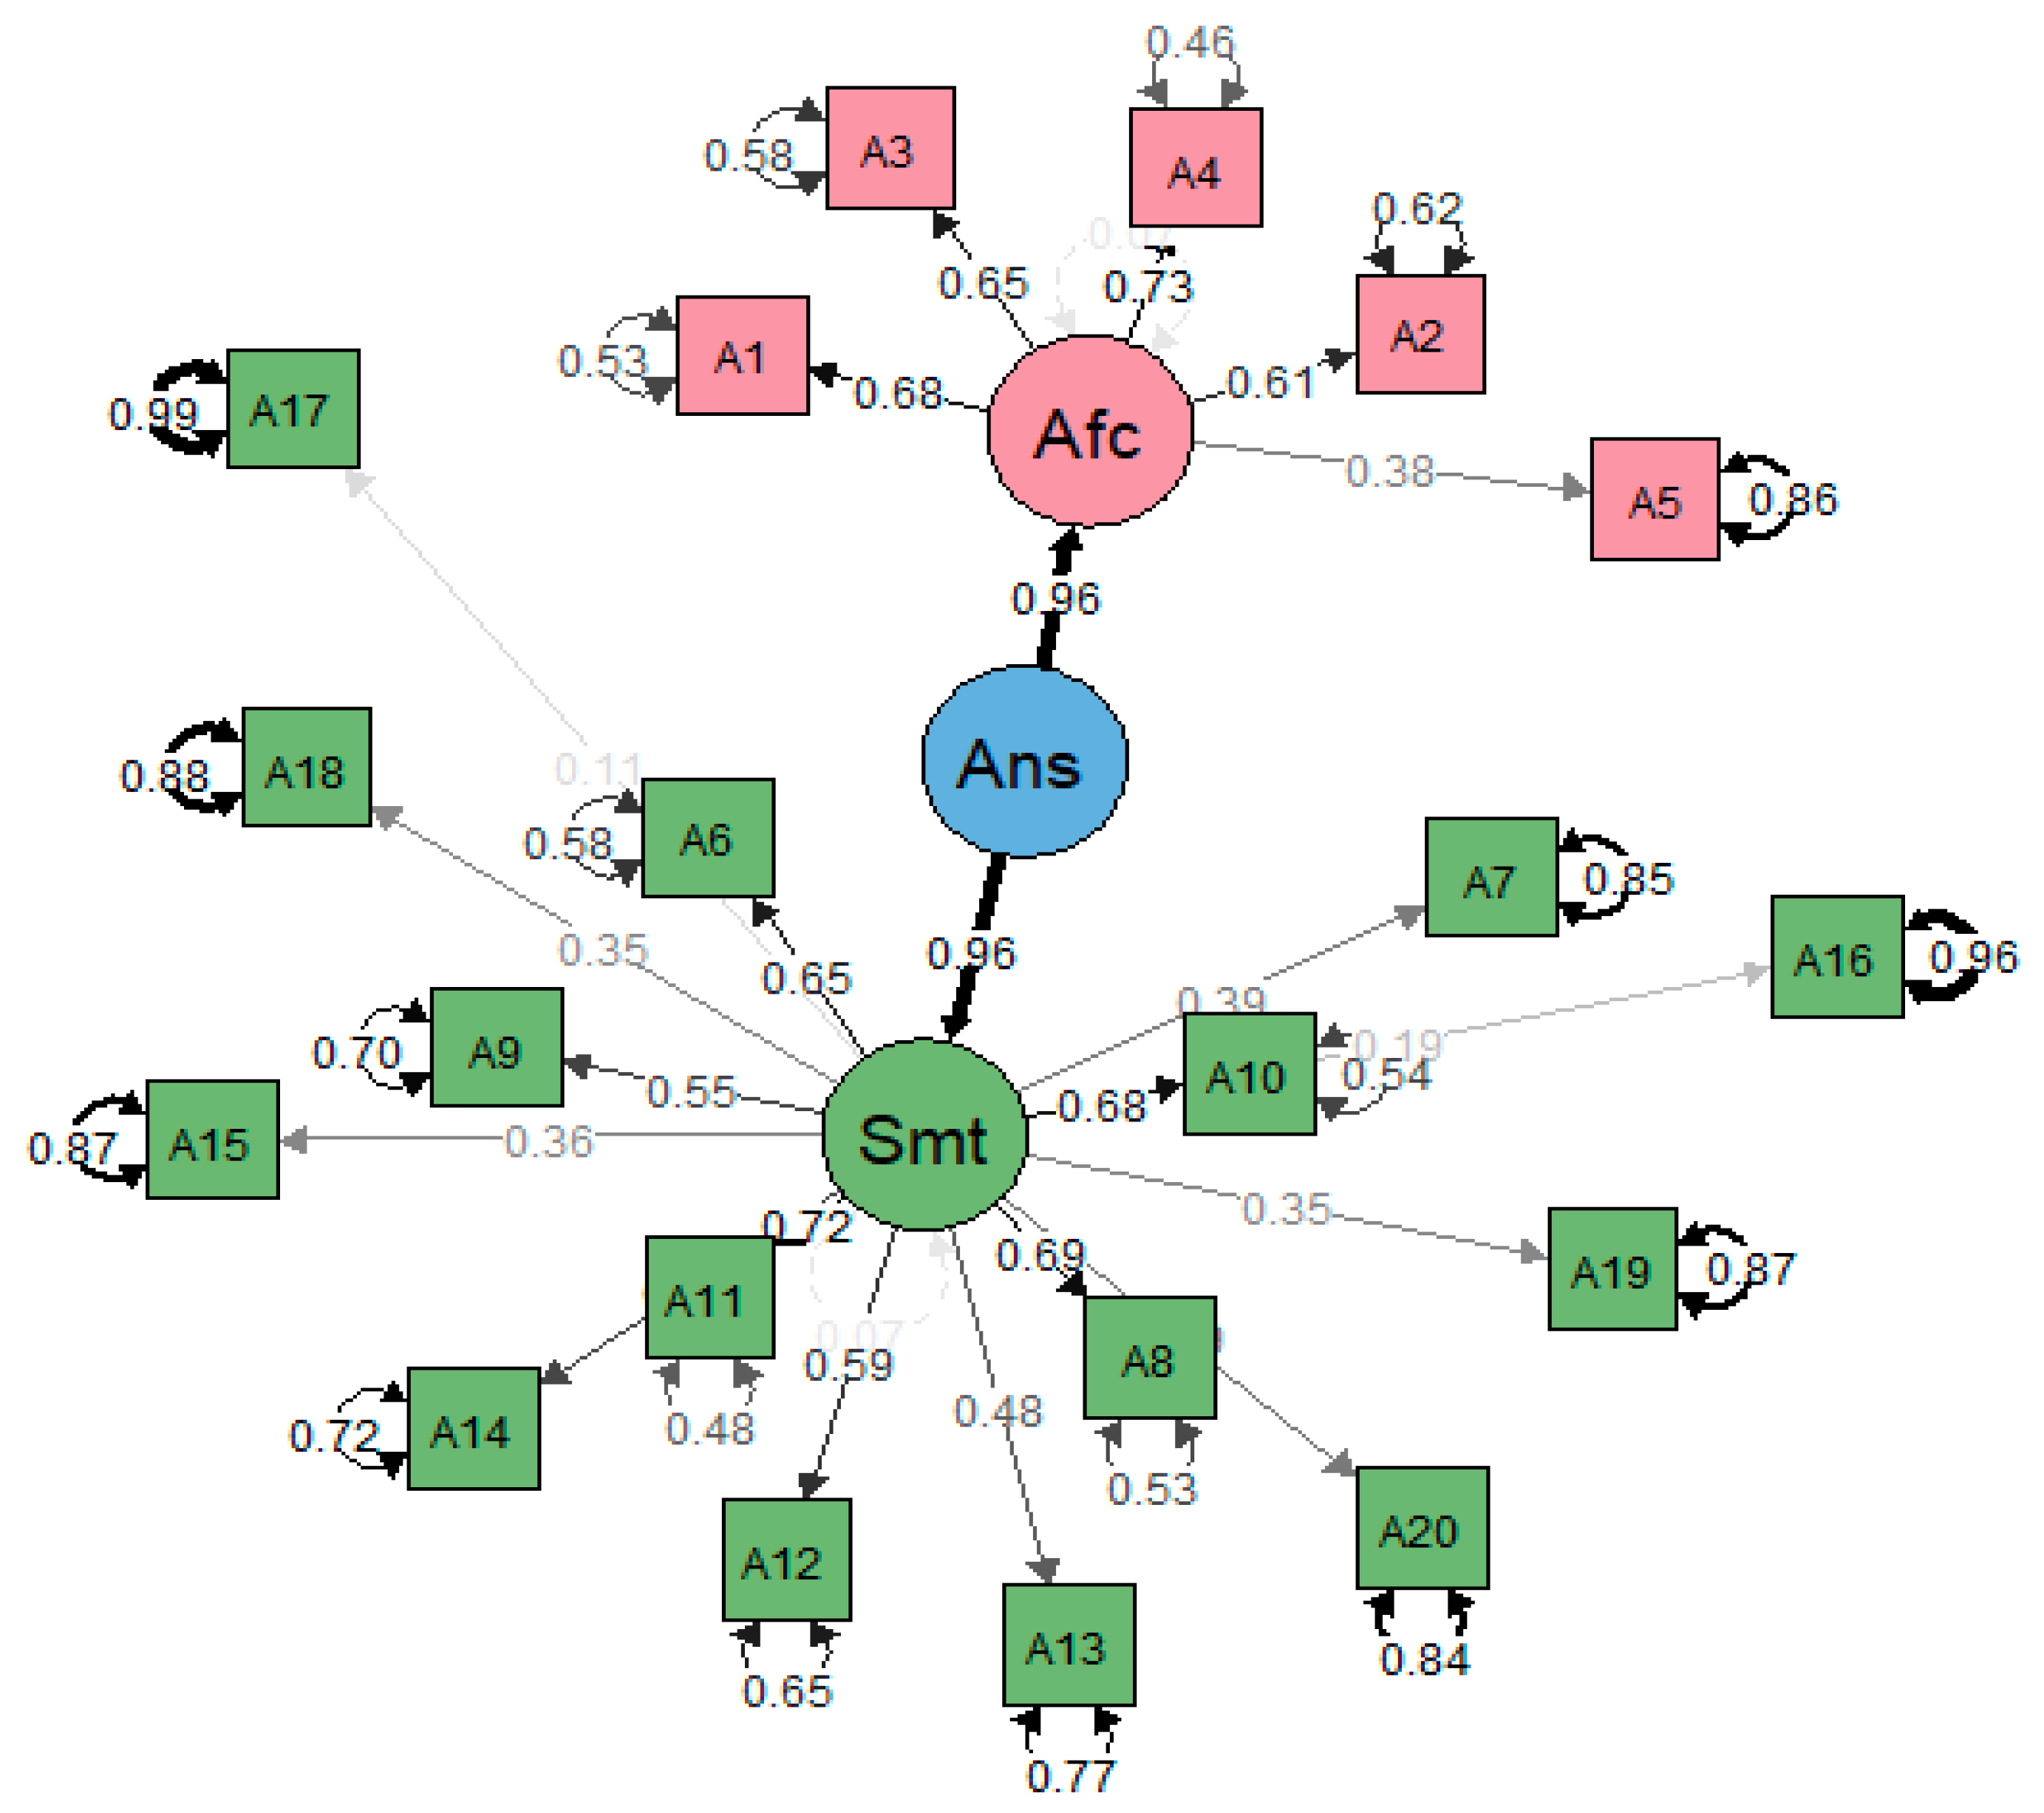
Figure 1. Standardized factorial saturation in the model with two first-order and one second-order dimension.
Education 15 00972 g001
Figure 2. Distribution of total scores on the SAS (anxiety).
Education 15 00972 g002
Figure 3. Number of clusters to be extracted.
Education 15 00972 g003
Figure 4. Cluster representation based on distress factors.
Education 15 00972 g004
Figure 5. Distribution of anxiety levels by distress cluster.
Education 15 00972 g005
Table 1. Comparison of fit indices between models.
Modelχ2 (gl)IFCTLIRMSEASRMR
One-dimensional248.63 (170)0.9780.9750.0390.054
Bifactor (2 factors)244.54 (169)0.9790.9760.0380.053
Second order (2 + 1)147.94 (168)0.9990.9980.0000.053
Disclaimer/Publisher’s Note: The statements, opinions and data contained in all publications are solely those of the individual author(s) and contributor(s) and not of MDPI and/or the editor(s). MDPI and/or the editor(s) disclaim responsibility for any injury to people or property resulting from any ideas, methods, instructions or products referred to in the content.