Article

Active Learning Methodologies for Increasing the Interest and Engagement in Computer Science Subjects in Vocational Education and Training

by
Belkis Díaz-Lauzurica
*,† and
David Moreno-Salinas
Department of Computer Science and Automatic Control, Universidad Nacional de Educación a Distancia (UNED), 28040 Madrid, Spain
*
Author to whom correspondence should be addressed.
These authors contributed equally to this work.
Educ. Sci. 2025, 15(8), 1017; https://doi.org/10.3390/educsci15081017 (registering DOI)
Submission received: 10 April 2025 / Revised: 4 August 2025 / Accepted: 4 August 2025 / Published: 7 August 2025
(This article belongs to the Special Issue Perspectives on Computer Science Education)

Abstract

Active learning strategies and methodologies place the students at the core of the learning process. The objective is to engage students in their own learning through significant activities that involve active participation. These activities are designed to promote collaboration, reflection, and practical application of the knowledge acquired to develop cognitive, social, and emotional competences. These methodologies are of particular interest in STEM disciplines and vocational education, where practice is a key element in the assimilation of theoretical concepts. In this line, a case study is presented where active methodologies have been applied to two groups of Vocational Education and Training in the area of Computer Science to improve interest and commitment. The present study focuses on two groups of first-year students enrolled in the Web Application Design course, one in the Programming subject and the other in the Markup Language subject. Both groups are heterogeneous, composed of young adults with significantly different backgrounds, skills, and motivation. The teaching–learning process is based on active methodologies, such as Project-Based Learning, Design Thinking, Flipped Classroom, or gamification, which are adapted for different subjects in the field of Computer Science. These methodologies facilitate the experimental design and testing of diverse solutions for programming problems, thereby enhancing students’ motivation and interest, while promoting creativity and reflection. The results show an improvement in the interest and commitment of the students in both groups. Despite the fact that less than 50% of students successfully passed in the initial examination, more than 75% students passed after the second-chance examination. The findings have consistently suggested that the implementation of active methodologies leads to significant enhancements in the proficiency, development, motivation, and self-learning capabilities of students, and that these methodologies make students more aware of their learning process.

1. Introduction

Lifelong education in Information and Communication Technologies (ICT) and in different science and technology areas is key for training and forming individuals for their incorporation into the labour market, social relations, and sustainability (Staniškis & Katiliūtė, 2016; UNESCO, 2017). Education and formation in science, technology, engineering, and mathematics (STEM) require new teaching–learning methodologies and new ways of thinking, such as active methodologies and computational thinking (CT) (McLaughlan, 2007). This is essential to ensure the acquisition of fundamental skills with reliability by individuals. In this regard, the Computer Science Teachers Association (CSTA) updated the Standards in Computer Science for compulsory education based on the concepts and abilities of CT.
Following this trend, methodologies that transform the teaching–learning process placing students at the centre of the learning process are gaining more and more interest and relevance. In these methodologies, commonly referred to as active methodologies, students are the main actors of the learning process, while the teacher plays a companion role. The efficacy of these methodologies has been demonstrated in a number of studies, which have shown that students can gain competences, learning outcomes, and skills, especially in STEM subjects, where practical application of concepts is essential for a complete formation (Díaz-Lauzurica & Moreno-Salinas, 2023).
It is widely accepted that these methodologies are particularly well suited to students who possess self-regulating profiles, possess a robust background knowledge and cognitive strategies, demonstrate effective time management and the ability to avoid distractions, exhibit good behaviour and motivation, and demonstrate a commitment to effort. However, some students may lack some of these characteristics, presenting disruptive profiles that condition the learning process, the classroom climate, and even promote absenteeism. Furthermore, the complexity and difficulty of STEM subjects can lead to a rapid decline in motivation and interest, exacerbating the aforementioned consequences (Chondrogiannis et al., 2021).
These latter profiles are frequently found in basic vocational education and training (VET), and particularly in technology areas. This is the most prevalent choice for students who are uncertain about their interests, possibly due to the publicity received in the media about job opportunities. In addition, a significant proportion of these students have had a negative experience in compulsory secondary education (CSE), which has led to them starting their VET studies with a negative mindset, a disruptive attitude, and making it more difficult to create a positive classroom climate (Cerda-Navarro et al., 2019; Cerdà-Navarro et al., 2022). A positive classroom climate is of paramount importance, as it fosters enhanced student–teacher interactions and behaviour, promotes the learning process, prevents conflicts, and reduces absenteeism and rates of dropout. Furthermore, the correlation between family involvement and student motivation is also crucial to improve the positive climate in the classroom (Boonk et al., 2022). These latter facts, combined with the complexity of some subjects, can be perceived by students as an obstacle that cannot be overcome.
Hence, the development of methodologies, content, activities, and relationships to acquire the required knowledge and skills for a lifelong education, regardless of the student profile, is of crucial importance. As demonstrated in previous studies by the authors (Díaz-Lauzurica & Moreno-Salinas, 2019, 2023), the use of practical and experimental methodologies that integrate robotics and programming has been shown to be highly effective in enhancing motivation levels and engaging students who exhibit disruptive behaviours and a high degree of apathy.
In order to restore students’ interest and motivation, this work proposes the use of active methodologies, which place students at the centre of the teaching–learning process and make them aware of their own learning. These methodologies involve a learning based on practical activities, which has demonstrated positive results in previous works (Krüger, 2019; Woraphiphat & Roopsuwankun, 2023; Zhao & Ko, 2018). In addition, they allow the enhancement of very important skills and abilities for scientific and professional reasoning, such as computational thinking, which can be applied to multiple disciplines and education levels (Lv et al., 2023; Su & Yang, 2023; Yadav et al., 2017).
Therefore, in this work, an eminently practical and experimental intervention is carried out in Computer Science subjects of VET. Students can work directly on the theoretical concepts in projects that allow them to assimilate more easily, as well as to see the usefulness of the different theoretical concepts related to programming, enhancing motivation and interest (Anwar et al., 2019).
The rest of this paper is organised as follows. In Section 2, the theoretical foundation and justification of the present proposal are introduced, and the research hypotheses are formulated. In Section 3, the groups and context are presented, the methods and projects are explained, and the instruments and evaluation are described. The results obtained are detailed and discussed in Section 4 and in Section 5, respectively. Finally, the conclusions and future works are described in Section 6.

2. Theoretical Foundation and Justification

The use of effective strategies to stimulate and maintain students’ interest is key for a successful teaching–learning process, which in turn can improve the students’ performance and better prepare them for the labour market. There exists a wide variety of pedagogical methods and tools that can be specifically applied in Computer Science subjects to improve motivation in the VET context. For example, it is possible to find approaches using educational software and visual programming environments (Dwyer et al., 2015; Papadakis et al., 2017; Papadakis & Orfanakis, 2017a; Tabet et al., 2016), hardware-software approaches (Papadakis & Orfanakis, 2017b) and robotics (Arís & Orcos, 2019).
Among the tools that help to promote the involvement of students who lack prior knowledge in programming are Scratch, Code.org, Alice, and Greenfoot. Similarly, applications such as Blockly Games and App Inventor use block programming, through which the novice programmer tackles challenges in a recreational way, while acquiring the skills of computational thinking. The advantages of this type of programming are described in different studies such as (Chen et al., 2019; de Julián Posada & García, 2018; Weintrop & Wilensky, 2017; Xu et al., 2019; Yildiz Durak, 2020), which highlight the increase in motivation, performance, and students’ ability to solve new challenges. However, some students still do not perceive this type of programming as truly authentic (Weintrop & Wilensky, 2016).
Regarding the pedagogical methods, the use of rewards and recognition is frequently employed. It is based on the principle of positive reinforcement, encouraging students’ effort and good academic performance (Bandura, 1977). The setting of clear and achievable goals is another important alternative. Goal-setting theory of Locke and Latham (1990) suggests that setting challenging but achievable goals can significantly increase students’ motivation and performance.
In addition, teachers can provide constructive and personalised feedback as, according to Hattie and Timperley (2007), this helps students understand their strengths and areas for improvement, which can increase their motivation and academic performance.
In the VET environment, where interaction between students and teachers is crucial, fostering a supportive and trusting classroom climate can be key to maintain student motivation (Ames, 1992). By promoting peer collaboration and mutual support, teachers can create an environment in which students feel valued and motivated to actively participate in their learning. Similarly, promoting autonomy and self-regulation provides choices and opportunities for students to make decisions about their learning (Deci & Ryan, 2000).
One way to include these strategies and tools is to use didactic approaches where students take an active role in their own learning process, known as active learning methodologies. These methodologies have their roots in the constructivist approach that emerged from the work of leading psychologists and educators such as Vygotsky, Bruner, Piaget, and Dewey. They stand out as tools for increasing student motivation by promoting active participation, collaboration, reflection, and experiential learning. Such educational practices offer a dynamic and stimulating approach that fosters engagement and enthusiasm for learning in students.
There are numerous active methodologies that promote the characteristics mentioned above and that have been used in VET. The following stand out among these methodologies:
  • Flipped classroom (FP) is a pedagogical approach that has been employed frequently to enhance the student interest and motivation levels and that has been applied successfully in VET education (Guan et al., 2015; Villalba et al., 2018). The main idea is to invert the traditional order of teaching: what used to happen inside the classroom now takes place outside it, and vice versa. In other words, theoretical or procedural explanations are provided to students in digital format for an autonomous study outside the classroom, and practical activities, exercises, and case studies that would traditionally have taken place outside the classroom are then carried out during classroom time (Lage et al., 2000). However, the efficacy of FP depends on two key elements: significant commitment, and the capacity for self-regulation. These features are necessary because, as the course progresses, students may experience a diminution in their level of interest and motivation. Moreover, this decline may be particularly pronounced when students encounter learning difficulties, exhibit disruptive behaviour, or experience a negative classroom environment.
  • Gamification is also a common method of promoting motivation and interest. It involves the application of game-like elements to the learning environment to encourage greater student participation and engagement. These activities may include a wide variety of alternatives, such as the use of new technologies for blended learning (Kholifah et al., 2020), inclusion of elements of gamification (Jayalath & Esichaikul, 2022), or even the use of educational games (Lihui Sun & Hu, 2023) and virtual reality (Angraini et al., 2023; Bacca et al., 2015; Bacca Acosta et al., 2019). In short, there are three main approaches to gamification. These are the inclusion of game elements in teaching; the use of serious games for learning; and gamified project-based learning, in which a game is designed and built. Gamification has shown positive results when applied to VET, see Samah et al. (2022). For a more detailed review of the application of gamification in VET, please refer to Huang et al. (2023); Samah et al. (2024).
  • Project-Based Learning (PBL) stands out among active methodologies (Blumenfeld et al., 1991), which is based on teamwork to plan, create, and evaluate a project that responds to the needs posed in a given situation. It is well-suited to STEM education (Mills & Treagust, 2003), and although it may be complex to implement, it fits well with vocational education profiles (Chiang & Lee, 2016; Jalinus et al., 2017). Moreover, it has a strong impact in the improvement in the classroom climate and the personal development, a very important factor since basic VET levels generally exhibit a high proportion of students with disruptive profiles and a prior history of academic failure (Martín de Soto Domínguez, 2021). For a deeper review on PBL, the reader is referred to Megayanti et al. (2020); Thomas (2000).
  • Design Thinking (DT) and Cooperative Learning (CL) are closely related to PBL and are other important exponents of active learning methodologies. DT involves the analysis of concepts or issues in order to introduce changes or enhancements, or even the generation and construction of solutions, with an emphasis on innovation and creativity (Calavia et al., 2023; Cross, 2023; Guaman-Quintanilla et al., 2023). It has also been applied at different educational levels, increasing students motivation, and promoting cooperation, teamwork, and creative thinking (Latorre-Cosculluela et al., 2020). For a more in-depth examination of DT in various educational settings, levels, and areas, the reader is referred to Panke (2019). Similarly, in a CL situation, the group of learners works together to achieve their individual and collective goals. For the group as a whole to succeed, it is crucial that each team member achieves their goals. This requires the contribution of knowledge and effort from all team members (Johnson & Johnson, 1987).
The importance of active methodologies can be noted in VET in order to increase the interest and commitment, and ultimately lead to the acquisition of knowledge and skills. The above implies an active learning of the students through their own experience, with explicit knowledge construction, which is well-suited to programming sessions (Blumenfeld et al., 1991; Brown & Campione, 1996).
It is important to remark that the teaching–learning of Object-Oriented Programming (OOP) requires abstraction skills, as well as the understanding of its underlying principles (e.g., encapsulation, inheritance, and polymorphism). In López et al. (2024), which carried out a study with 65 software engineering degree students, it was concluded that 72% of the students either do not understand the concepts or do not know how to apply them, 50% of whom belong to the group of students who end up not really understanding these concepts. This study also proposes project-based and game-based learning; breaking down problems into simpler sub-problems and using flowcharts or other tools to represent the logic. Recent OOP applications include the integration of adaptive e-learning and gamification through the https://ngodingseru.com/ (accessed on 10 April 2025) platform (Maryono et al., 2025), with the aim of improving programming problem-solving skills in vocational secondary education students.
However, there is a lack of research showing the applicability and results of these methodologies and approaches in Computer Science subjects in VET courses. Moreover, no evidence has been found of any other work that applies gamification and PBL to OOP, using graph theory.
Then, the foundations of the present proposal are based on the Project-Based Learning-related methodologies and constructivism, which make students aware of their learning process, and enable them to solve real-life problems and situations. This constructivist approach is based on cognitive, behavioural, and social theories of various authors. Among the different contributions to constructivism, the Piaget’s contribution stands out, together with the socio-constructivist theory of Vygotsky (Polman, 2010). Both serve as the basis for this research, in which students work autonomously and the teacher acts as a guide. Other cognitive theories considered include those of Ausubel (Ausubel, 2012), and Papert (Papert, 1999), which are focused on the significant learning guided by a motivated effort to obtain a result. The Theory of Learning by Discovery of Bruner (Bruner, 2009) was taken into account for the planning of activities. In addition, the flow state theory of Csikszentmihalyi (Csikszentmihalyi, 2014) was considered when planning the projects to maintain the motivation. Moreover, Tokuhama-Espinosa (2014) highlights the role of the teacher as a facilitator of the learning process, providing timely feedback to facilitate the continuous development of the learner. Finally, the promotion of innovation and creativity in the proposed challenges according to learning styles was based on the work of Ken Robinson. He stressed the importance of learning from risks and mistakes, and explained that creativity can also be learned and that creative education should be accessible to all students, in order to enhance their individual capacities (Robinson, 2017).
Based on these ideas, two programming projects have been implemented to support the teaching of Computer Science subjects in vocational education and training. The first project involves simulating of the localisation and tracking of a robot in a given area. The second project is a gamified activity in which the students should program a “police and thieves” game and play with both roles.
The following research hypotheses are formulated:
  • The implementation of active learning methodologies in introductory Computer Science courses in VET increases student commitment and reduces absenteeism rates.
  • There is a significant relationship between the use of active learning methodologies and student engagement and involvement in activities and content, and academic performance in early-stage Computer Science courses within VET.
Then, the contributions of this paper are three-fold. Firstly, a methodology for teaching computer science is developed through the design and development of projects for vocational education and training. Secondly, the application of the methodology to groups of students with different backgrounds and initial motivations is demonstrated, along with an analysis of advantages and disadvantages. Thirdly, students are made aware of their own learning and engaged with methodologies that place them at the core of the learning process.

3. Methods

As mentioned above, VET students can benefit more from a practical learning approach rather than a classical one. This is particularly relevant for students who have previously failed from other studies where classical approaches were used.
The analysis of the results obtained with the present proposal is mainly based on the qualitative research conducted with two groups of VET students, both from the first year of Web Application Design (WAD), one in the subject of Markup Language (ML), and the other in the subject of Programming (PR). The protocol adopted for the qualitative research design can be viewed as a combination of the case study approaches outlined in Yazan (2015):
  • The case study description is consistent with the proposal, depicting the particular situations, the context, the instruments used, the data collection and analysis, and the validation.
  • The description of the characteristics of the groups, which manifests the objective reality of the individuals.
The groups and their context are described next. Then, the methods and the projects are explained. Finally, the evaluation and the instruments used for data collection and analysis are described.

3.1. Groups

The study involved two groups of first-year students from the Web Application Design (WAD) programme. Each group worked on a different subject: Programming (WAD1PR) and Markup Language (WAD1ML). Although both groups shared the same instructor and academic calendar, their profiles and class dynamics differed considerably.

3.1.1. First Year of WAD, Subject Programming (WAD1PR)

The group is composed of 17 young adults, from high school, middle school, and higher education, one of whom is a woman. The age range is from 18 to 29 years old.
In general, they are mature students, who foster a positive classroom atmosphere and support each other. They accept criticism well, are polite and abide by the rules. In terms of performance, some actions were taken in order to avoid the excessive use of technologies such as generative AIs. One student dropped out at the beginning of the course, and six students missed the continuous assessment due to regular absenteeism. The rest had consistent attendance and punctuality. Two students demonstrated initial knowledge of structured programming, while the rest started the subject without programming experience. Table 1 summarises the characteristics of the Programming group.

3.1.2. First Year of WAD, Subject Markup Language (WAD1ML)

The group is composed of 20 young adults, which come from high school, middle school, and higher education, six of whom are women. The age range is from 18 to 28 years old.
The classroom climate was initially poor. The students found it difficult to accept proposals for improvement, or to abide by the rules, and they were more concerned with marks than with performance or learning, perhaps due to family pressures, and they were stressed by exams.
Regarding the attendance, two students dropped out and three students missed continuous assessment due to regular absenteeism. The rest of the students attended consistently and were asked to work on the project. The group analysed comprised these 15 students, who started the subject without experience in markup languages or programming. However, three of these students presented a very disruptive profile and refused to work on the project. Table 2 summarises the characteristics of the Markup Language group.

3.2. Methods and Projects

Inductive methods and qualitative research (Perez & Quintanal, 2012) are employed, which are centred on the teaching–learning process rather than on the results. Specifically, the action-research approach is used. In this sense, in each session continuous implementation of decisions and actions was applied to improve the experience. This was done in combination with continuous planning, action, observation, and replanning of the contents imparted. Regarding the approach, the teacher approach of the action-research was selected as the research focuses on the teacher’s experience by the understanding of the context, systematisation, analysis, and study of reality (Bhattacharya, 2017).
The practical experience is based on the initial design of a competence-based teaching unit. In order for the students to acquire the different competences, general aspects are described in the teaching unit such as the reasons that motivated the design of activities given the different learning styles, the planning of the sessions from the simple to complex concepts, the active role of the students in their learning, collaborative work and collaborative projects to solve some of the challenges, support resources to improve the teaching of the programming lessons, the treatment of the didactic error, conception of evaluation, etc.
The method used focuses on learning by doing and is centred around project-based learning, incorporating various modifications and alterations to promote student interest and motivation. In this way, gamification and DT concepts and strategies are incorporated. Regarding DT, students are asked to design solutions, build prototypes, and test the solutions, while discussing the different alternatives and the suitability of each. There are no restrictions on the design of the solution, or the tools or methods to create it; each student can develop and experiment freely. Additionally, gamification concepts and strategies are incorporated, such as competing solutions, and designing a game-based project where the correct functioning of the game is the core of the final evaluation. These concepts and tools make the proposal very close to what is known as gamified project-based learning.
The application of the method starts with the problem or project presentation, whose characteristics, requirements, and functionalities should be clearly highlighted from the outset. Additional activities should also be made available for content that presents greater difficulty, to ensure that students acquire the necessary skills and knowledge. Finally, the students should make a public presentation of their solution to the class, for working on and developing communication skills. This also allows them to evaluate the other solutions presented, thus providing new ideas and approaches to improve their own work.
The steps in the teaching process were similar to those described in previous works of the authors (Díaz-Lauzurica & Moreno-Salinas, 2019, 2023). The theoretical contents were initially introduced, and guided examples of increasing complexity were conducted by the teacher to explain the concepts to be learned. The more complex concepts, those related to the project, were introduced systematically until the entire project was presented. Different solutions were also presented in class to show their respective advantages and disadvantages, encouraging students to discuss the feasibility and utility of each solution. A planning time was allocated for each project assignment to encourage students to think about how to solve the problem and conceive it in advance. Finally, all assessment criteria were given in advance, either in the form of rubrics or explicitly stated in the assignment instructions.

3.2.1. Project for Programming Group

The students had about one month to complete the project, which required understanding of graph theory. By the time they started the project, they already had knowledge of object-oriented programming (inheritance, polymorphism, design of classes reflecting the relationship between them, communication between classes); recursion; different Java collections (Collections); different sorting and searching algorithms; arrays; minimum and maximum searches; the use of language interfaces such as Comparable and the creation of their own interfaces; reading/writing from/to various types of files; and access to databases. However, at the beginning of the project the students had no knowledge of graph theory. Flipped classroom was used for teaching graph theory, the students reviewed the theory at home, and applied it in class by working on the project.
The suggested scenario for the project was: “Catch me if you can: A thief is being pursued. It is known from where the search is started. You have the coordinates of some of the places where the thief was but his/her track was lost. The aim is to locate the thief at all times, either to catch him/her at the best possible moment or to position police officers at points where the thief might pass through, anticipating possible movements. The strategies used will serve as a lesson for future police officers training at the academy. If the thief sees a police officer, he/she will take an alternative route if possible”.
An undirected weighted graph with the nodes and distances between them was given to the students. Before starting the thief strategy, the police officers should be placed on the shortest path from the starting point to the target point, according to Dijkstra’s algorithm. The thief starts from the starting point at a certain speed, which is reduced every time he/she encounters a police officer or an obstacle. The thief is considered caught when his/her speed reaches 0. If there is no route other than the one used by the police, the thief will have to pass a police officer, resulting in a loss of points, reflected in a speed decrease. Obstacles that can be encountered on the roads include impassable bridges and traffic jams. Therefore, depending on the road conditions, the presence of police officers and the speed at which the thief can run away, the thief must assess which roads to take. All speeds and speed modifications can be configured by the user at the beginning.
To ensure that each solution was different and, therefore, novel in its design, each student started from different conditions. The following requirements were specified for each student, and were different for each one:
  • Obstacles (points) through which the thief cannot pass. These must be respected.
  • Different routes and starting points with different conditions (thief’s speed; whether or not the speed is being reduced; roads with/without access; traffic jams; etc.).
  • The police officers know some of the places that the thief has passed through.
  • The time taken to reach certain points (depending on different constraints).
  • Constraints on the thief’s movements.
The solutions should show:
  • The shortest path between origin and destination according to Dijkstra.
  • The complete route of the thief (all the points he/she has passed through), complying with the time of arrival at the end point.
  • The coordinates of the route saved in a CSV file.
  • The police strategy followed, which can be either to capture the thief or surround it.
Explained and referenced information on Dijkstra’s algorithm and alternatives for the project orientation were made available to the students.

3.2.2. Project for Markup Language Group

The implementation of this project for the WAD1ML group took a month. The suggested scenario is as follows: “In a shop, several robots demonstrate the functionalities available to users. The robots can move to different pre-set positions within a pre-determined area of the shop. The aim is to control the robots’ movement according to these established coordinates, ensuring they do not leave the designated area. Finally, users will select the most complete robot, taking into account their previous selection of the best robot candidates. Simulation of the sale of the winning robot is also requested”.
Based on the shortcomings identified in an initial version of this project from the previous year, as well as in Díaz-Lauzurica and Moreno-Salinas (2023), priority was given to XSLT (eXtensible Stylesheet Language Transformation) over JavaScript (JS). They were also requested to apply what they had learnt in class such as XML (Extensible Markup Language), XSD (XML Schema Definition), XSLT, and HTML (HyperText Markup Language) to a greater extent. They also needed to pass 80% of the daily follow-ups carried out in the classroom. If the absence from the classroom was unjustified, the follow-up of that day was considered failed. During these follow-ups, they had to explain what they were doing on their solutions, and at the end of the project they had to answer specific questions. This enabled their gradual progress to be measured more effectively and prevented them from producing complete solutions out of the blue.
The design of the project contemplates two options:
  • The possibility of incorporating hardware based on Ultra-Wide Band (UWB) sensors. The collected data can be stored and incorporated into the structure of the XML that the students have to design to compute the robot position using geometric procedures. The use of hardware depends on the financial resources and time available to introduce it as part of the solution. The Ultra-Wide Band module DWM1001 was used for localisation in the classroom to carry out a localisation experiment (https://www.qorvo.com/products/p/DWM1001-DEV, accessed on 10 April 2025).
  • The other option is to assume that the distance measurements are available and that the project starts with the XML file structure itself. In this case, it is assumed that the sensor measurements are given in advance. This means that the internal calculation of sensor positions is no longer necessary. The measurements are in a file, which is read to know the registered data and compute the robot position.
Successful distance measurements were obtained from the sensors, enabling the solutions to show movements using real data obtained in class or, at least, from files containing information stored from the real sensors. However, the sensors failed on several occasions, so they could not be used consistently. For this reason, the ML project solutions were developed by reading the coordinates from an XML file containing the recorded positions marked by the sensors, to avoid time-consuming hardware errors. However, the procedure to incorporate the hardware was explained and demonstrated in class.

3.3. Evaluation

The students were informed in advance about the evaluation criteria so that they could check and test their solutions before submitting them, and to ensure their quality. They were also encouraged to test and experiment with different solutions and designs, and to openly discuss advantages and disadvantages of the solutions. Therefore, most of the time the students were working on the projects, with clear time constraints, enabling them to schedule their work properly.
In order to make an effective assessment of student performance and the quality of the educational activity, the evaluation was designed taking into consideration different aspects:
  • Daily and continuous evaluation: Students were evaluated daily to draw conclusions about their performance as close as possible to what happened in the classroom. This was based on evidence and aimed to minimise bias. To this end, the most significant issues of the day were noted in a diary. In addition, each challenge solution was delivered via the educational platform after receiving feedback in the classroom, so that students could identify their mistakes and track their progress. The grade obtained for each day was made known to them via the educational platform. This made it possible to monitor progress closely, avoiding disproportionate progress from one day to another in the project preparation and execution.
  • Error-based: Students should view errors as an opportunity to learn, rather than as a cause for frustration. Effective time management of tasks was also considered.
  • Research as a background: The knowledge received in class had to be expanded through the execution of the project and the search for information.
  • Project-based evaluation: In order for a project to be positively assessed, 80 percent of the daily follow-ups had to be passed and the learner had to demonstrate enough knowledge during the follow-ups. To increase motivation, the topics covered in the projects are based on issues in which the students are interested and they can even propose modifications.
In order to successfully complete the course, both exams and projects had to be passed. This prevented students from avoiding to do the project. Most of the grading was done using rubrics.

3.4. Data Collection and Analysis Procedures

The following instruments were used for data collection:
  • Questionnaire: An initial questionnaire was conducted to find out the initial knowledge of the students of each subject. The initial questionnaire was developed based on similar previously developed and validated questionnaires, and also validated by a committee of experts composed of teachers to ensure clarity, appropriateness, and alignment with the study objectives.
  • Diary: Observation was used as instrument to measure the student progress. With the aim of describing what was happening day by day inside and outside the classroom, the observation was carried out as described in Selltiz et al. (1959). The observations were carried out daily in a structured way. Events were carefully classified and categorised in the diary, with date, time, goals, and competences to be achieved in each session, which helped to ensure data quality. Direct observations were registered in detail, to allow replication by other researchers. Data recorded for each activity included the activity itself, date, time, competences involved, student’s behaviour and development, resources used, and any decision or change made to the activity during the lesson. All observations were contrasted by teachers and external researchers.
  • Exams: Carried out by trimester and at the end of the course.
  • Rubrics: To receive feedback for the different assignments. This also enabled students to check the quality of their work before submitting it.
  • MS Teams as communication tool: In addition to contacting students in specific situations, the challenges carried out were collected daily via the platform. Feedback was provided either verbally or via the platform, and for the final project evaluation, a rubric was used. This made it possible to evaluate the follow-ups according to the objectives set for each day.
  • Interviews: After each exam or evaluation, the students presented the problems they had encountered to start a discussion or debate. Semi-structured and unstructured interviews were conducted with students and the school counsellor to find out about unobservable facts such as meanings, motives, points of view, opinions, insinuations, assessments, and emotions (Díaz-Bravo et al., 2013). They were also supervised by an expert on research topics.
  • Sensors: used to collect location data. The data obtained could be used by the students for testing and practice, but due to some failures, their use was discarded.
  • A descriptive non-experimental approach was used for the quantitative analysis.
Data analysis was mainly based on qualitative methods. The diary and daily observations were two of the most important instruments for collecting data. These instruments were designed and operated to ensure validity and reliability (Selltiz et al., 1959), and data were carefully analysed, with coherence and rigour (Silver & Lewins, 2014; Weitzman & Miles, 1995), as described in Yazan (2015). The data were then organised into categories and skills to draw conclusions about the educational intervention. The main aspects taken into account were:
  • Ideation and design: Different solutions were proposed and their appropriateness and effectiveness were considered for evaluation. Additionally, the level of student involvement in the sessions was considered to determine whether each project stage had been completed correctly.
  • Behaviour and class climate: These were two critical factors since they affect motivation and results. Individual behaviour and collaboration with other students, such as discussing possible solutions or helping each other, were considered in the overall evaluation of the proposal.
  • Evaluation grades: Exam grades and project presentation demonstrate student performance and communication skills. A statistical analysis is carried out to compare the results of previous courses, taking into account the evaluation grades.
To ensure the quality of the statistical study, the type of sample, the statistical independence and the distribution of the data are taken also into consideration. Samples are considered to be random, as students are considered to enrol on the subjects freely, without any particular prior selection, eliminating any possibility of bias. The observations of the grades are independent of each other and are made at different points in time. This ensures the necessary statistical independence between the observations. In order to eliminate the effects of extraneous variables, both subjects had the same teacher, trying to adopt the same climate and motivation. The sampling was incidental.
In addition, the samples are statistically analysed to determine whether they follow a normal distribution. If the data follow a normal distribution, probabilities can be calculated using parametric tests. Otherwise, non-parametric tests are used. Different tests are applied depending on the analysis (Hollander et al., 2013; Rizzo, 2019):
  • Shapiro test to determine whether they follow a normal distribution. If non-normality is indicated, one of the following tests is applied: The Mann–Whitney U test, which does not assume normality of the samples and uses parameters of central tendency such as the median, which is less sensitive to extreme values than the mean. Alternatively, the Kolmogorov–Smirnov test is used to see whether the samples come from similar distributions.
  • Kruskal–Wallis to compare the scores of different groups, which does not assume that the samples are normally distributed.
The data analysis is described in Section 4, and it was carried out with R statistical programming language.
The rigour of the triangulation methods and the data analysis process is ensured by multiple factors (Mertens, 2010; Sampieri, 2014; Savin-Baden & Major, 2013):
  • Dependency: Contrasting data gathered about activities, students, and results. Data were also analysed by different researchers to reach coherence in their interpretation.
  • Credibility: To ensure a complete understanding of the participants’ experiences, specially with the problem statement. The long stays in the classroom by the same teacher allowed time to think of different alternatives and evaluate them. Moreover, the same experience was applied to different students with different characteristics, collecting quantitative data from qualitative data; and considering the specific characteristics of the students for the evaluation.
  • Confirmation: In order to erase any possible bias of the researcher. For example, solving different exercises using the same method, or solving a given exercise using different methods.
  • Transference and replicability: To apply or transfer the results to other contexts.

4. Results

The research was carried out on the two groups described in the previous section, without control group. Despite the small number of students, the accumulation of experiences enables a larger volume of data to be collected and compared, allowing more meaningful conclusions to be drawn.
The different challenges posed to the students had to be solved within a pre-determined time frame, typically in a session of 110 min. Monitoring before and after the completion of the activities revealed the skills shown in Table 3.
The qualitative and quantitative analyses carried out on both groups are described below. Subsequently, the results of each of the groups are analysed, and finally comparisons between these groups, as well as with additional groups from other years, are made.

4.1. Qualitative Analysis

The class diary, initial questionaries, and semi-structured interviews were the tools and instruments used for the qualitative analysis.
The observation grid and daily diary were designed following the guidelines by Selltiz et al. (1959), and structured to capture relevant behavioural, motivational, and performance-related indicators. From the beginning of the research, the structure of this diary was presented to a panel of three researchers from the IT field to ensure the validity and reliability of the collected data. Observations were conducted systematically, and consistency was ensured through regular review and cross-checking by two independent observers.
The questionnaire used to assess students’ initial knowledge and motivation was adapted from previously validated instruments in similar educational contexts. This questionnaire was included in the documentation of the quality system approved and implemented at the educational institution, validated by a committee of experts composed of teachers to ensure clarity, appropriateness, and alignment with the study objectives. Although no internal consistency coefficient such as Cronbach’s alpha was calculated, the questionnaire was tested in a pilot group and refined based on student feedback to ensure clarity and coherence.
Semi-structured interviews were validated through expert review and tested for clarity before implementation. The interviews were aimed at finding out about the students’ experience in the different aspects evaluated, mainly after the first exam and project evaluations. They were carried out with the consent of the students who usually attended classes and consisted of questions to be answered in the range of 1 to 5, with 1 being totally disagree and 5 being totally agree. In some questions they had to rate and develop their answers. As the students had different learning styles and paces, triangulation of their answers was ensured.
The triangulation is based on the different sources and the results were interpreted following the thematic analysis proposed by Braun and Clarke (2006), supervised and contrasted by another teacher. The themes emerged were:
  • Stress management in each challenge: More than 85% of the students in both groups agreed that they were very stressed at the beginning, that they found the project very difficult, even more so with the follow-ups.
  • The skills acquired in programming: They all agreed that they learned other ways of doing the same thing and that it helped them to learn other things from what they did in class. They all agreed that the project was one of the most useful course activities to learn programming.
  • Effectiveness of feedback: More than 70% of the students said they found it useful.
  • Level of motivation: All the students agreed that they liked the project.
  • Things to improve: Around 50% of students said they would have liked to spend more time working on the graphical interface, although they acknowledged that this would not have left enough time to complete the entire project.
All instruments were aligned with the goals of the action-research framework and designed to enhance the credibility and replicability of the study.

4.2. Quantitative Analysis

The project rubric included three general items (formal aspects, contents, and presentation) with a specific weight in the project grade. The reliability of this instrument was guaranteed in two ways: (1) through the assessment of its applicability by several computer science departments of different institutions, (2) through its use over time with good results. The items analysed were as follows:
  • Formal aspects: presentation of slides, documentary structure, organisation, grammar and spelling, quality of information and format of documentation. Its weight in the final project grade was 10%.
  • Contents: difficulty, degree of resolution of the proposal, operation, graphic design, originality and internal documentation. Its weight in the final project grade was 80%.
  • Presentation: quality of the oral presentation, time spent, content, and accuracy of the answers to the questions posed. Its weight in the final project grade was 10%.
In addition to the evaluation of the project, the exam grades were considered for the quantitative analysis of the results obtained.

4.3. Programming Group

One of the project’s objectives was to apply the principles of object-oriented programming, with a particular focus on the design of classes, interfaces, and algorithms. Likewise, the use of collections studied in class, which implement the List and Map interfaces, as well as the use of arrays, were necessary.
Although the project solution is based on graph theory, the students had no knowledge of graph theory at the beginning of the project. An undirected and weighted graph was used, in which the students had to propose a strategy for hunting down the thief.
Some challenges should be solved in order to achieve the objectives proposed in the project:
  • Calculate the Dijkstra route.
  • Position initially the police officers.
  • Search for all possible routes.
  • Find the best route for the thief.
  • Relocate the police officers based on the thief’s last known location.
  • Display the results.
The development and evaluation of the project must consider the following assumptions: Threaded programming is not used. Graphical interface representation and design were not mandatory, as the main objective was to improve the student’s proficiency in the internal programming of the code. To simplify the algorithm, it is assumed that the graph is connected, so no additional checks are performed.
One example of graph that could be used for the game project is shown in Figure 1a, and all the possible routes from the starting point F to the final point G are computed in Figure 1b.
Several structures and algorithms, as well as combinations of these, can be used to implement Dijkstra’s algorithm. It depends on how the classes and data structures are organised. The solutions developed by the students included some of these structures:
  • A collection/list (Map or List) in which they first store all nodes and their minimum distance to the destination. They then select which node to analyse next.
  • Different arrays for nodes, temporal distances, and final distances. In this case, each node includes a list of neighbours, and neighbours are checked for each node.
  • A list of all nodes, along with a list of edges and the initial and final nodes that compose it.
  • A queue where the nodes to be analysed are stored, among others.
Once the nodes composing the Dijkstra route are known, the police officers are allocated to these nodes in the order that they appear in a list, with no additional criteria applied. This is the simplest way and is generally used at the beginning of the simulation. Then, when a sighting of the thief is reported, the police officers must be rearranged, not necessarily in the nodes that compose the Dijkstra route, but in the nodes close to where the sighting has taken place. The strategy and logistics in this case were selected by the student.
Similarly to the development of Dijkstra’s algorithm, how the possible routes are searched depends on how the data are stored. For this purpose, recursive algorithms such as DFS (Depth First Search), BFS (Breadth First Search), or A* can be considered. The idea is to discard, for all possible routes from the origin to the destination node, those which are less convenient for the success of the thief due to their characteristics (constraints, number of police officers, etc.). It is therefore necessary to check all possible routes to the end, and then choose those that better meet the thief’s criteria. Additionally, the time taken to reach the end and the distance travelled by the thief must be known. As the order of the nodes on each route is important, a variant of the List or Map interfaces must be used, which maintains the order in which the nodes are introduced.
At this point, the route conditions, the path characteristics, and the thief’s health must be evaluated. This adds an element of dynamism to the project, as the route is not always evaluated in the same way. The priorities for selecting the best route are (from highest to lowest priority):
  • The one with the fewest Dijkstra nodes: This is based on the fact that, as Dijkstra is the shortest route, there is certainty that there will be police officers on it.
  • Search for the route with the shortest distance (after Dijkstra’s): This will ensure the fastest journey time.
  • Look for routes that have the fewest adverse conditions.
In other words, if possible, avoid the Dijsktra route and opt for the shortest and most comfortable alternative route instead.
Considering all possible routes between the origin and destination nodes, each route is analysed. The following should be obtained as a result at the end of the game: the complete route taken by the thief; the characteristics of the route, i.e., at which points the initial conditions changed; how far the thief travelled and how much time was spent; and in what position the police officers were distributed and what strategy was followed. Finally, the winner should be identified.
If the students would like to illustrate the process graphically, a simple turn-based system should be enabled, since they do not have the knowledge to implement threads. The design of the application should include the following phases:
  • Initial configuration.
  • Game.
  • Writing the results in a CSV file.
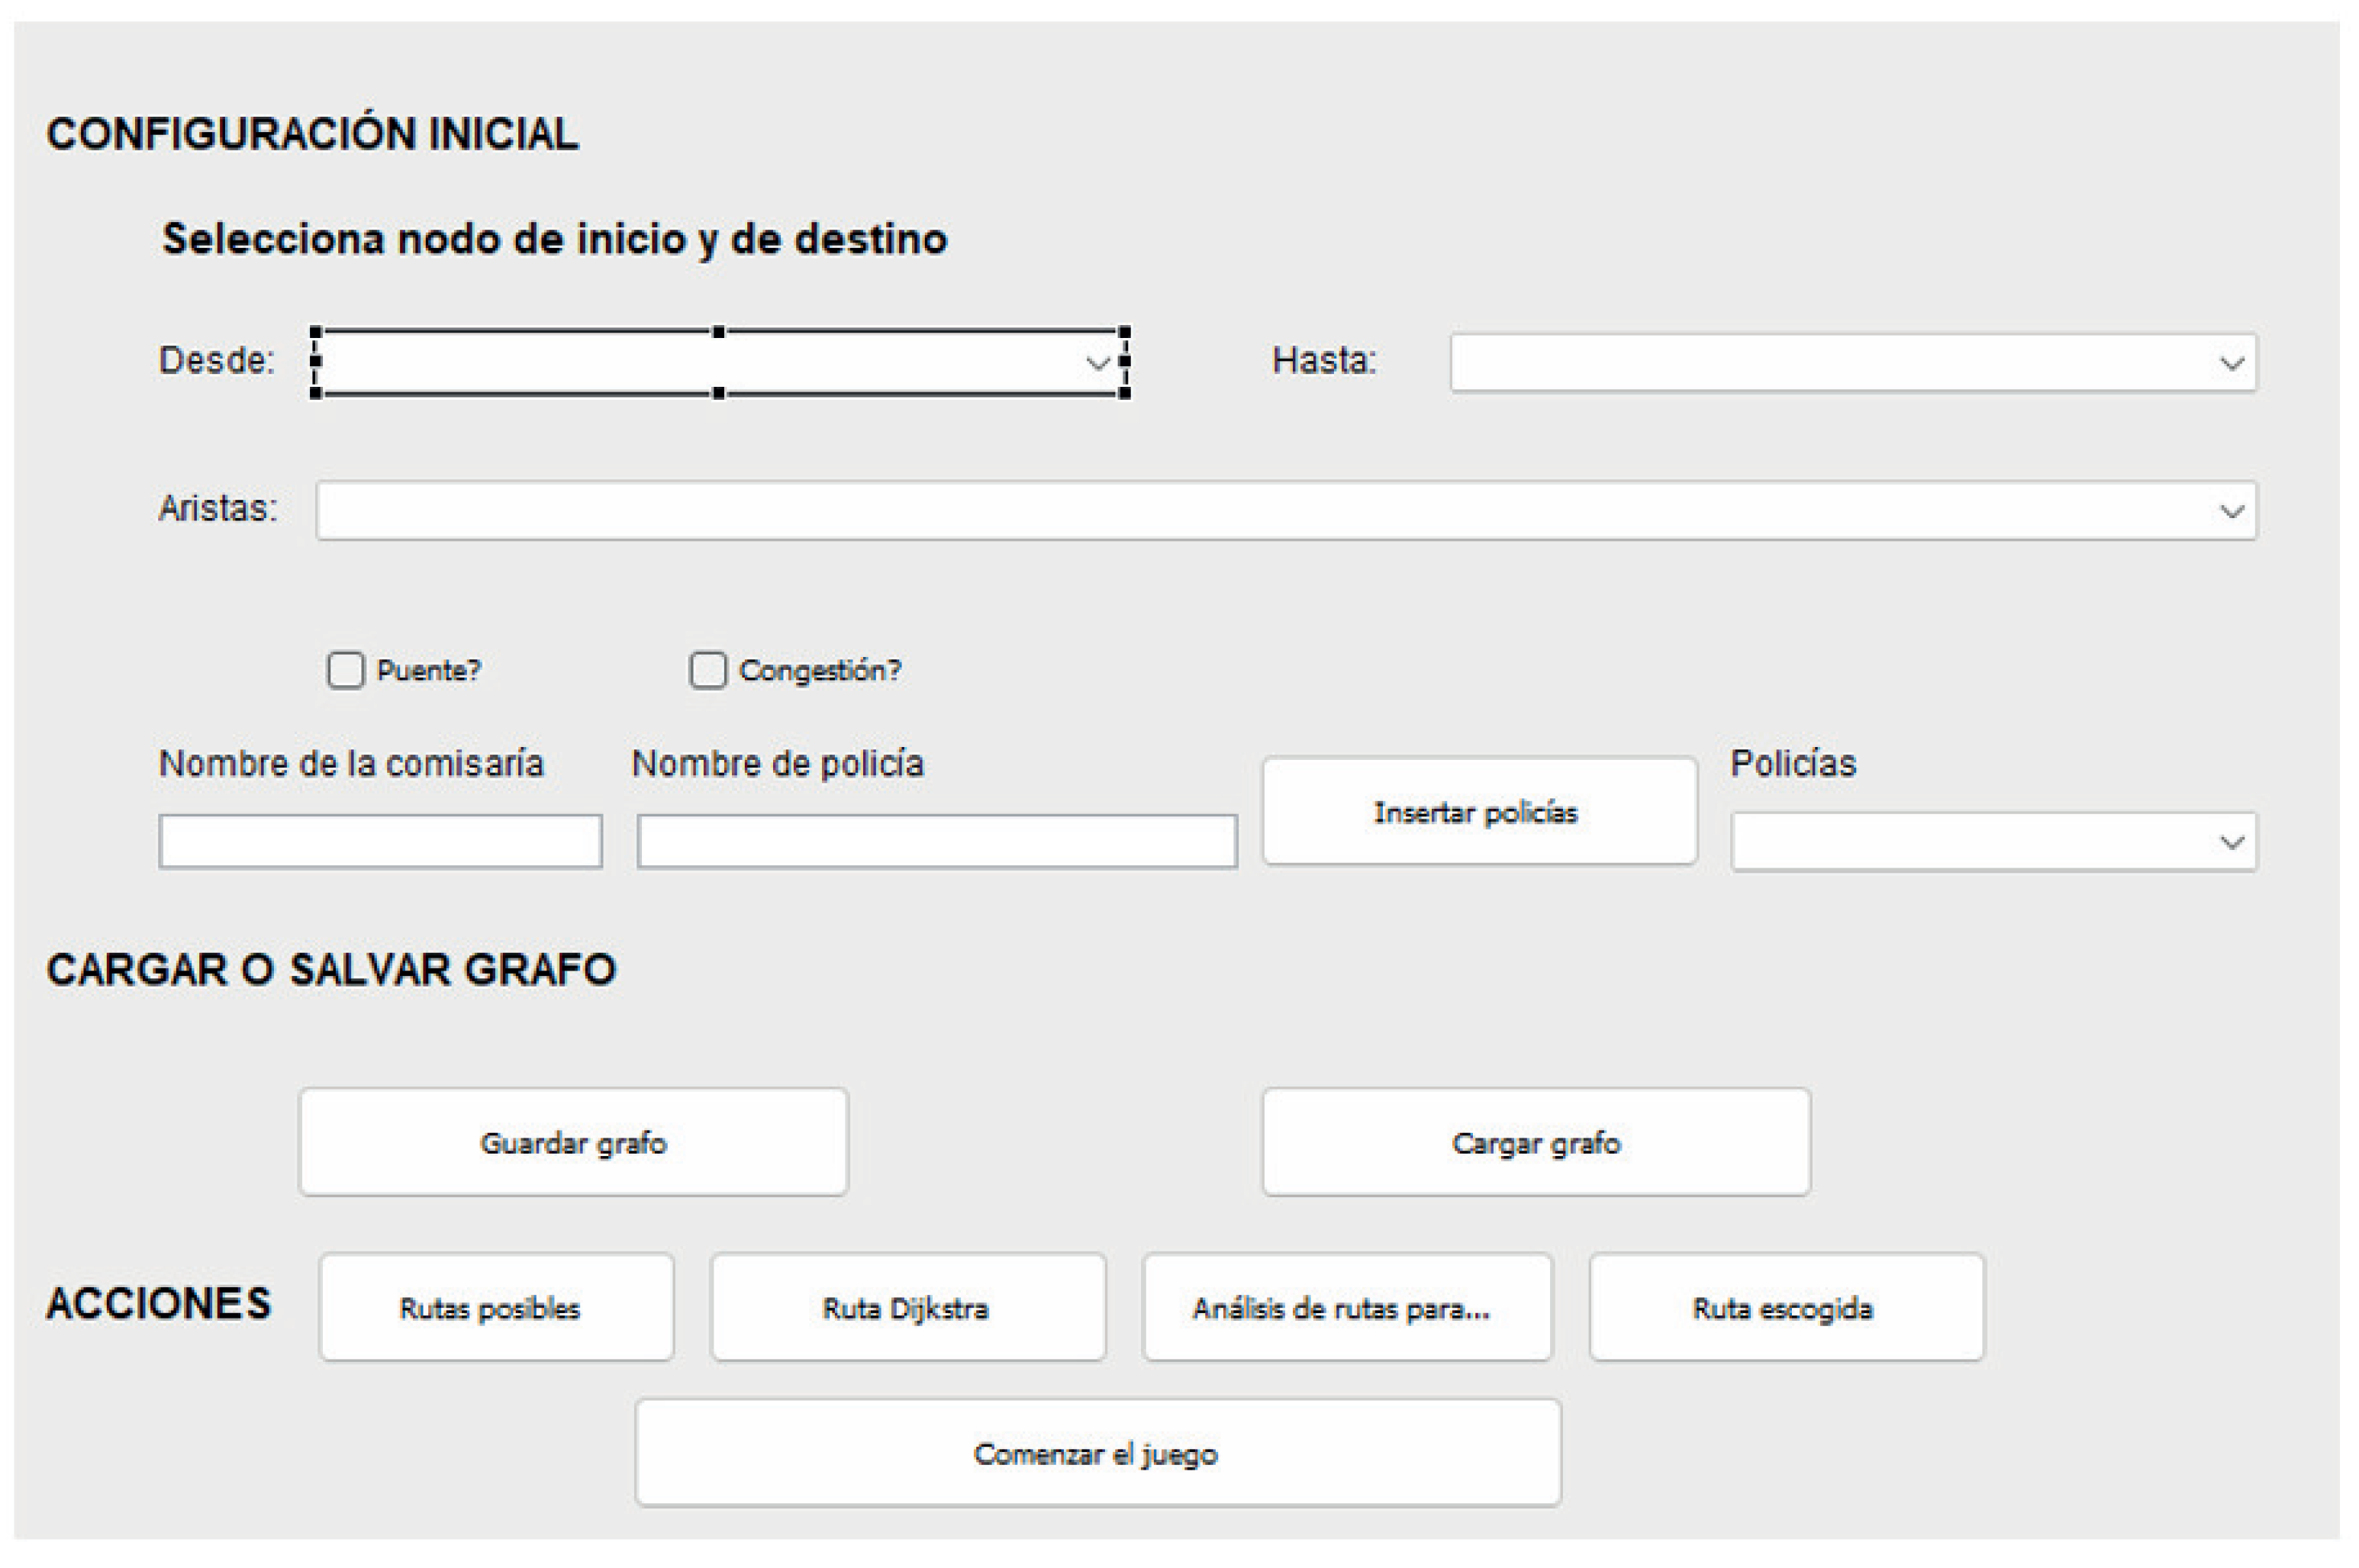
An example of graphical interface (which was not required) is shown in Figure 2, in which the graph and the different configurations may be introduced.
Another important decision concerns the movement of the actors, the criteria for defining turn duration, and how these criteria reflect changing conditions along the way. Several alternatives can be considered, which should also be included in the initial configuration for future courses. Although the final decision was left to the students, a possible initial solution could be to establish alternative turns between the thief and the police officers.
In terms of the project’s logic, it was clear that the concepts learnt in class had been internalised and could be adapted to a new scenario, fulfilling many of the requirements. They had to make many decisions, which required time, effort, and involvement. In Table 4, the rate of students that completed the different project stages is shown. It can be seen that the implementation of turns and the relocation of police officers posed the greatest challenges. These latter features made the difference in the ratings of the different projects.
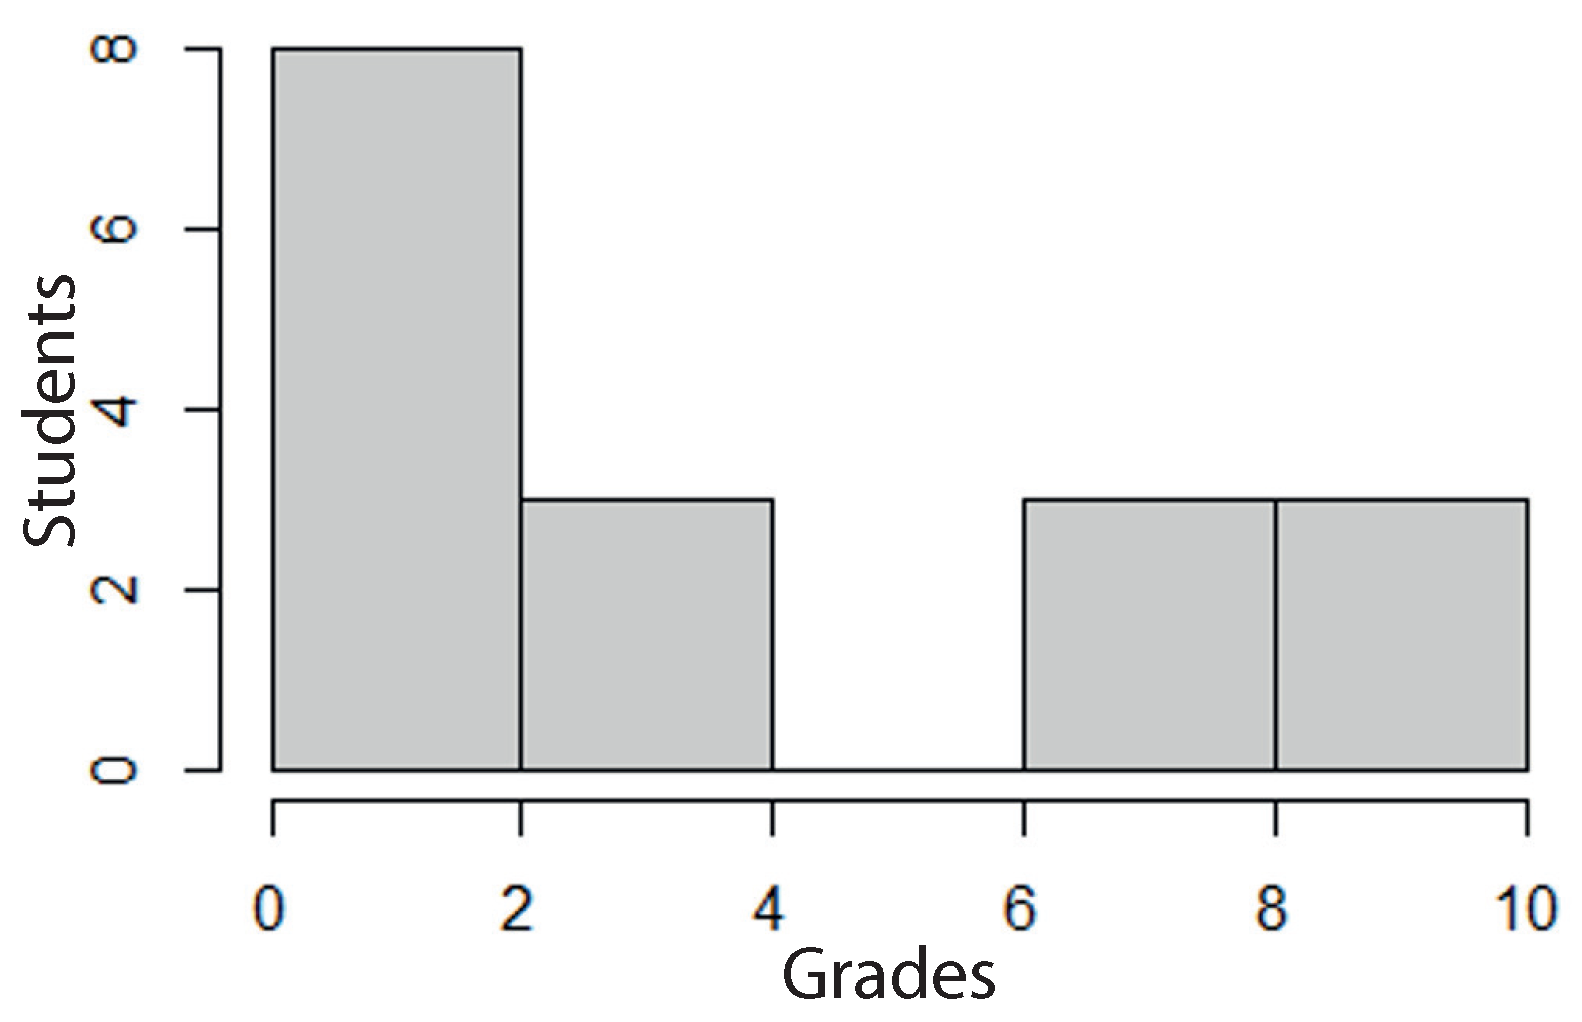
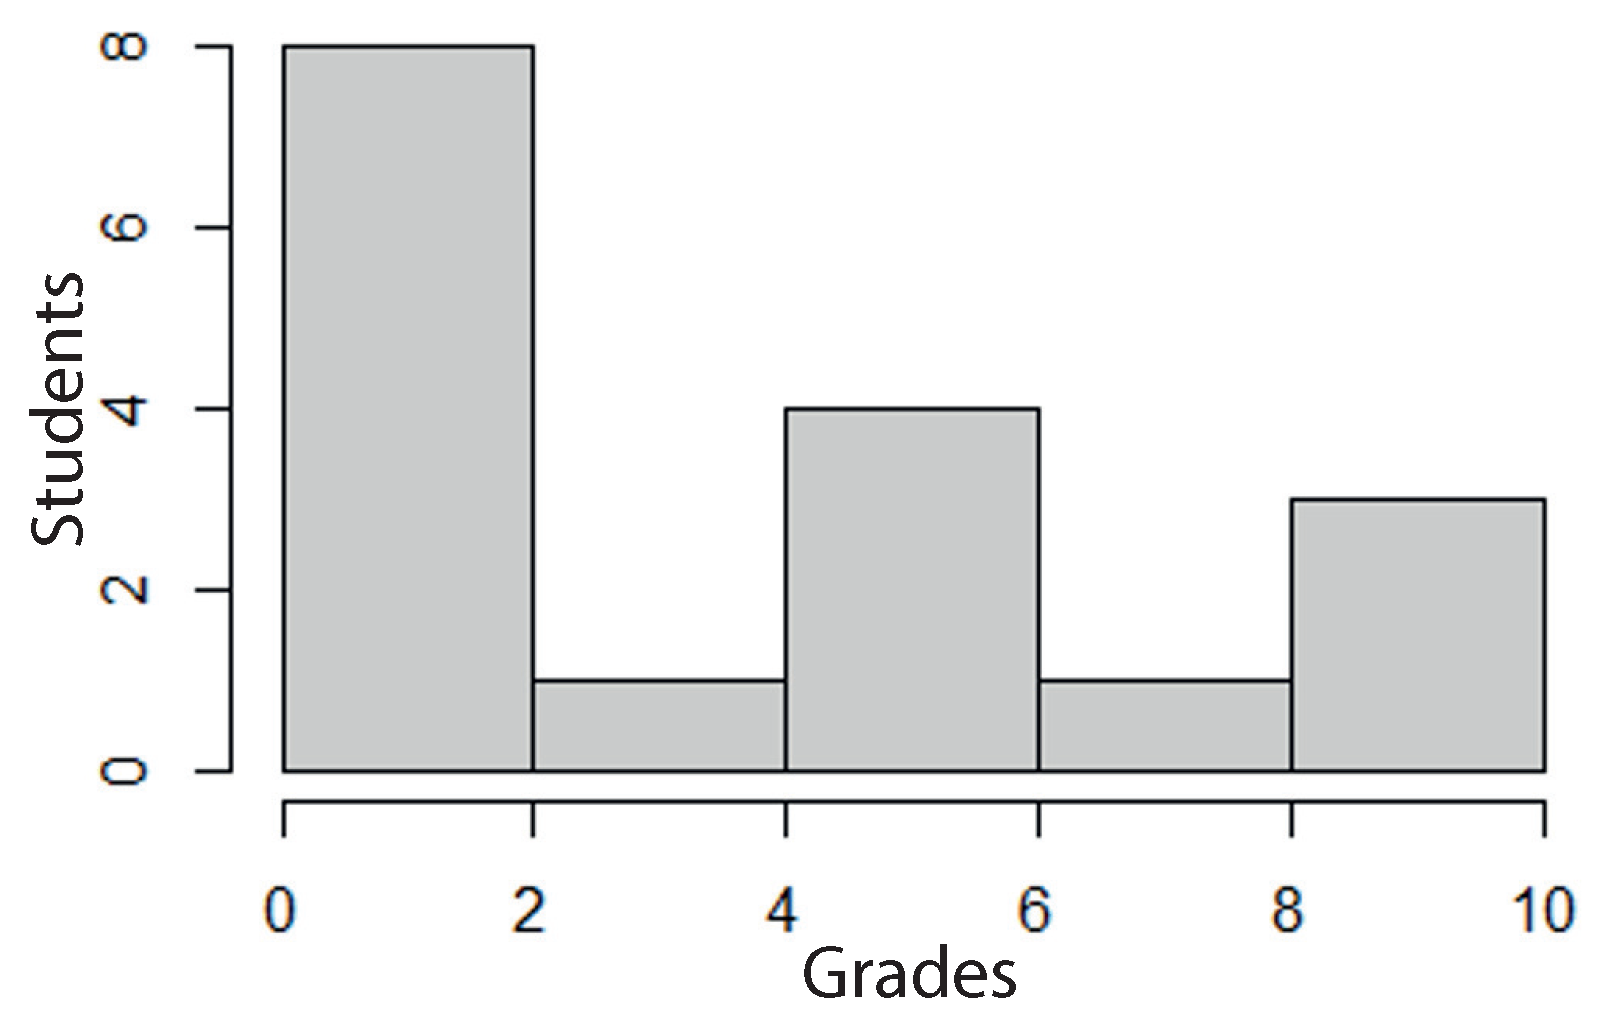
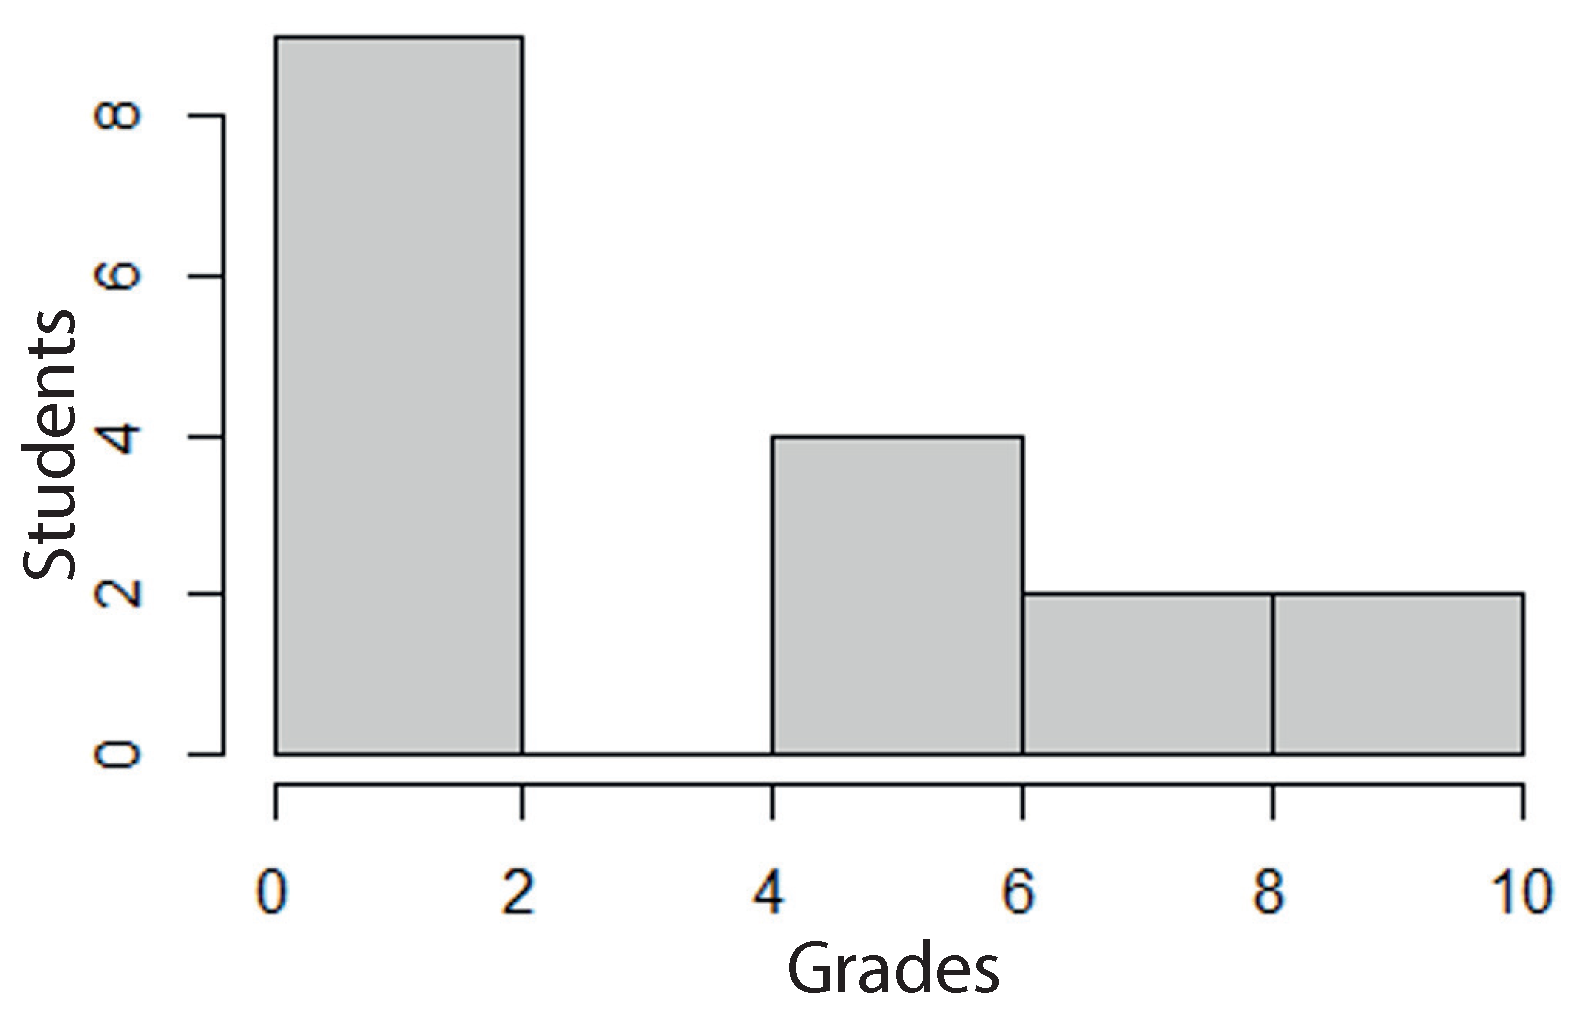
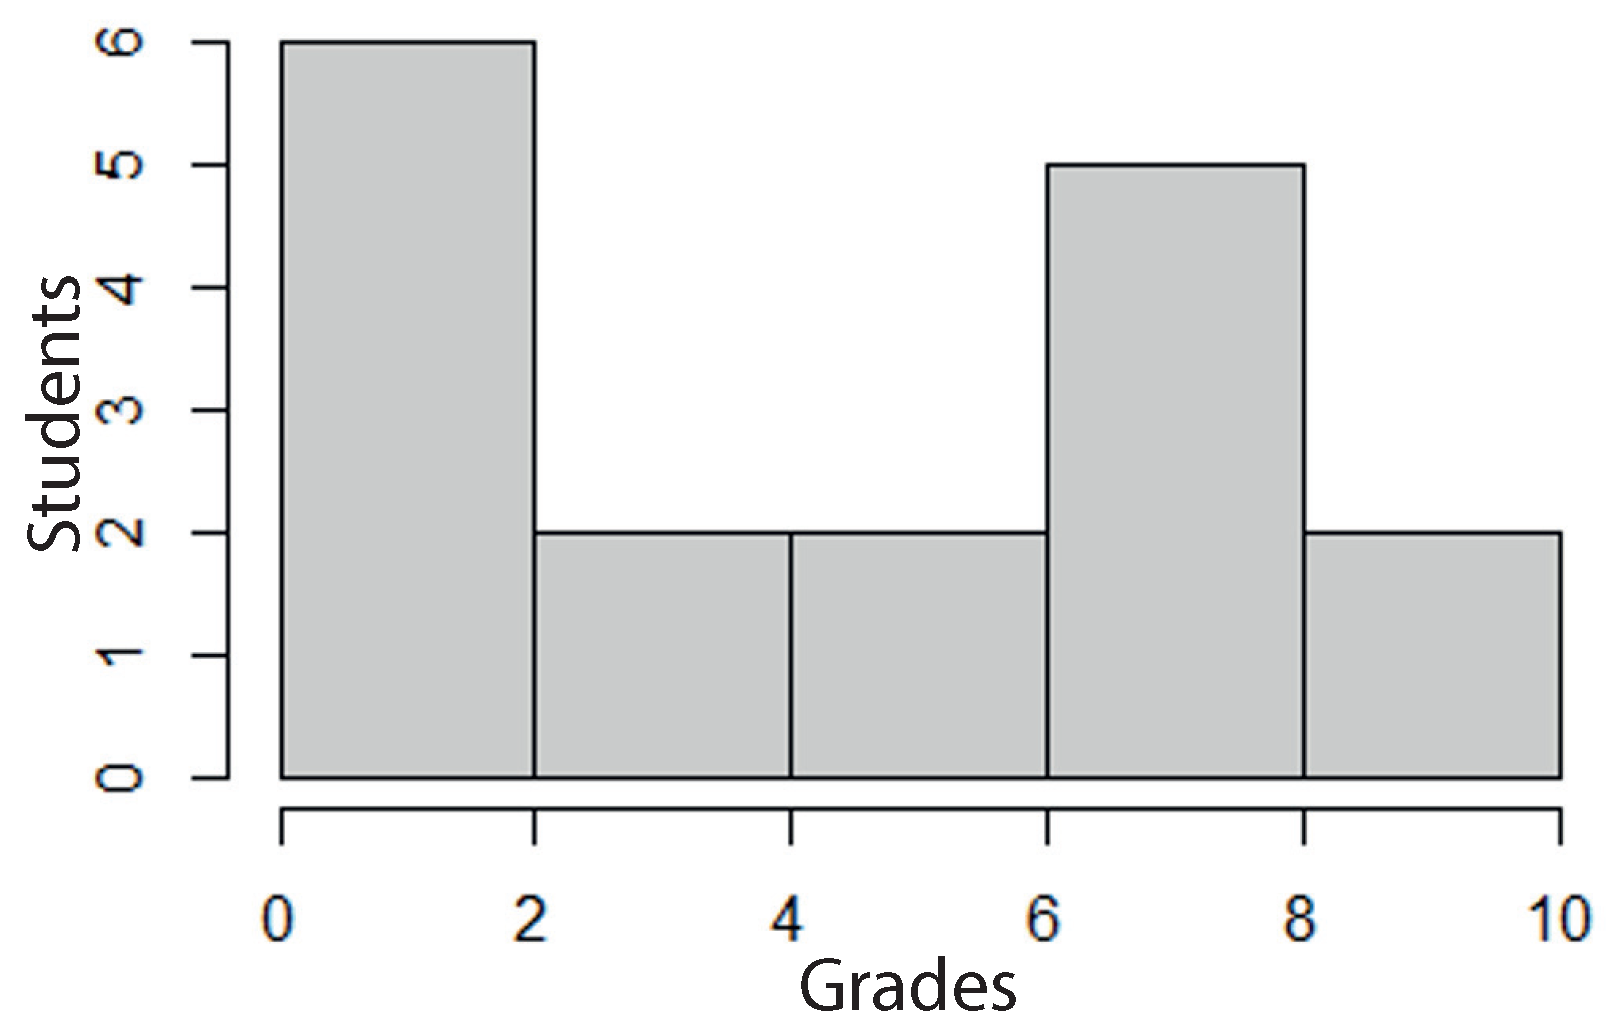
Regarding the grades, Figure 3 and Table 5 show the distribution of project grades for the Programming group. Most students scored between 4 and 7, with only a few achieving top marks. This skewed distribution, together with the rate of students that completed the different project stages in Table 4, show that mastering the more complex parts of the project remained a challenge. Figure 4 and Table 6 present the distribution of final exam grades for the Programming group. The scores are concentrated below the passing threshold, confirming that several students struggled to meet the evaluation criteria on their first attempt. The exam distribution is slightly more left-skewed than the project grades, highlighting the added difficulty associated with formal testing.
Notice that less than 50% of the students passed the project evaluation and exam. However, these results correspond to the first-chance exam and the total number of students of the subject, including those who dropped out or did not attend classes. It is important to remark that, after the project and exam evaluation, interviews were conducted so that the students could expose the problems encountered to face the second-chance examination with more confidence. This supported the need for a second-chance evaluation, in which improved results were achieved, as shown in Table 7.
Therefore, regarding the students who regularly assisted and participated in the project (10 students), most of them (80%) passed both examinations in the second-chance exam and by presenting a new version of the project, in which they corrected their previous errors. In any case, the students showed high motivation and commitment throughout the execution of the project which, as mentioned in Section 3, took place during the last month of the course. These results are discussed in Section 5.

4.4. Markup Language Group

Before starting the project, the students had already acquired knowledge of HTML, CSS (Cascading Style Sheets) and JS; XML file validation using DTD and XSD; and their presentation with XSLT.
In terms of JS and CSS, they initially worked with exercises on the interface for positioning elements on the screen and handling events. In this way, they acquired the basis for referencing, creating, and modifying page elements, using loops and conditions, and working with strings and arrays. They also worked with other aspects such as the font formatting, background, text used, their positioning, and events to make the page more dynamic.
The study of the different programming structures was complex and required more effort, especially the loops. Before designing and validating XML files, the database-related content taught in the same-named course had to be reviewed. These facts were common to both groups, and aligned with the results obtained in Díaz-Lauzurica and Moreno-Salinas (2023).
Both DTD and XSD were used to validate the project’s XML files, highlighting the correspondence between these schemas and the XML. Regarding DTD, the focus was on defining attributes and elements, referencing internal or external DTDs, key specification and integrity. Regarding XSD, emphasis was placed on defining elements with various attributes, validating elements composed of other elements, declaring attributes, ensuring referential integrity, comparing solutions and referencing the XSD document from within and outside the XML. Similarly, the students worked on XSLT structures, which were used to vote for robots and choose the winner.
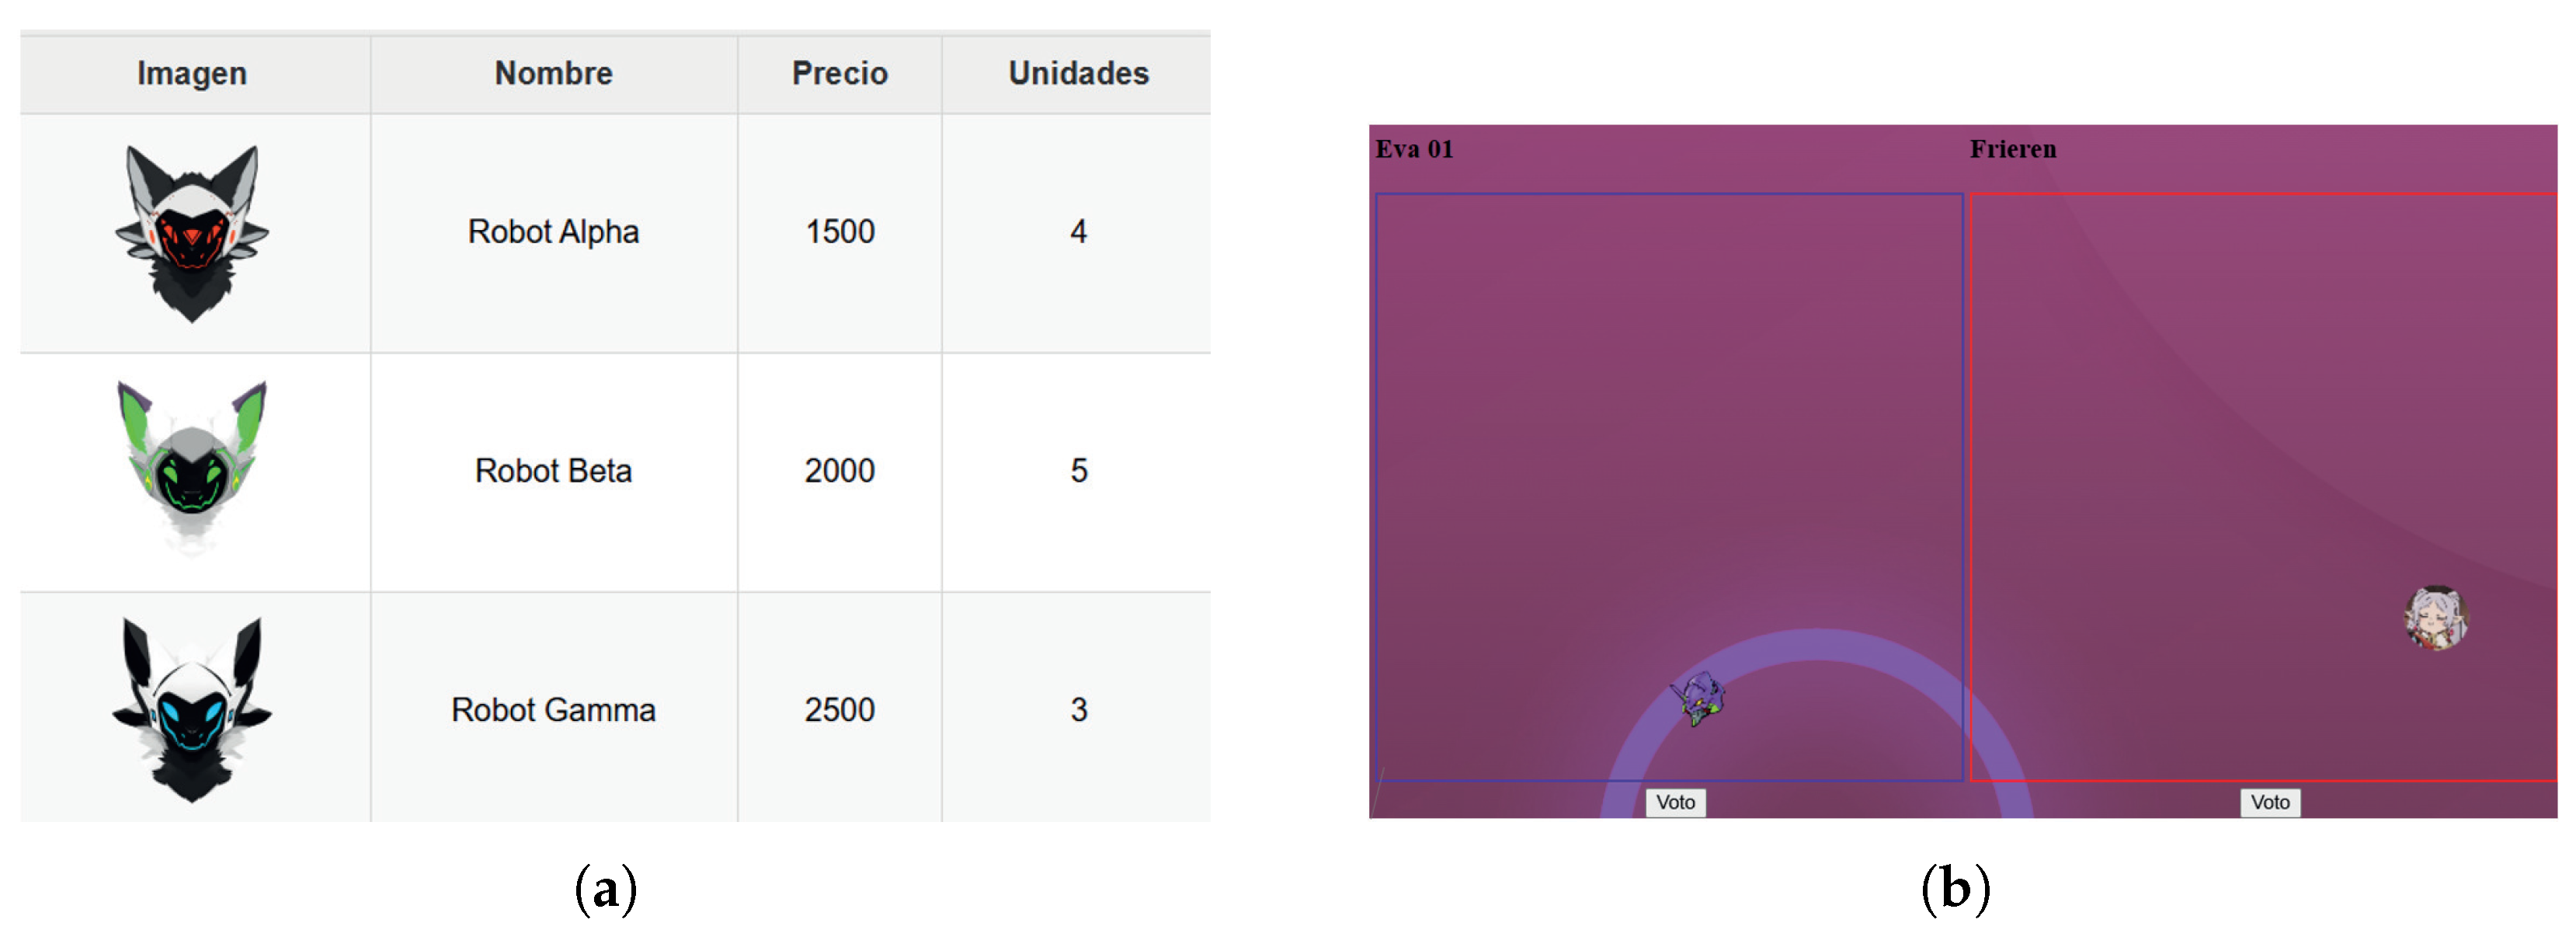
Some of the solutions proposed are presented in Figure 5.
Most of the works met the requirements and the students showed a high level of commitment, except the three students that missed the continuous assessment and the other three students that refused to participate in the project, mentioned in the group description.
Regarding the the project and exam grades, they are shown in Figure 6 and Figure 7, respectively. As shown in Figure 6 and Table 8, the distribution of project grades for the Markup Language group is slightly more balanced than in the Programming group. While high grades are still limited, there is a more even spread of scores from 5 to 9. This reflects the less abstract nature of the content, which allowed students to focus more on implementation and design. Figure 7 and Table 9 display the final exam grades for the Markup Language group. Compared to the Programming group (Figure 3), a higher proportion of students scored above the passing grade in the first attempt. Still, the spread indicates varied levels of preparation, which were later addressed during the second-chance evaluation.
Similarly to the previous group and project, less than 50% of the students passed the project evaluation and exam. This rate is considering the initial number of students, including those which dropped out or did not attend class. In addition, this low pass rate may be caused due to the mandatory nature of the project and the diary work. It is important to remark that these results also correspond to the first-chance exam and project evaluation. Again, after the project and exam evaluations, interviews were carried out to give students the opportunity to discuss any problem they had encountered. The details of the results obtained are shown in Table 10.
Despite the previous value of 50% in the first evaluation attempt, the students were involved and motivated during the course, except the three students whose attitude during the whole course was consistently negative and who showed no interest or intention of working. After second-chance evaluation, almost all of the students passed the project and the exam, without taking into account the three students mentioned above. Considering the students that regularly assisted to class, the 75% passed the subject. These results are also discussed in the subsequent section, Section 5.

4.5. Comparison, Additional Groups, and Statistical Analysis

Despite the small number of students involved in the analysis, data from different sources have been accumulated in order to make comparisons: (a) the results of projects and final exams for different subjects (Markup Language and Programming) in the same year; (b) the results of a project of the same type in the same subject (Markup Language) in two different years; (c) the final marks for the subject (Markup Language) in the first-chance exam in different years; and (d) the final marks for the same subject (Markup Language) in the same year, but with a different approach, such as a distance learning (ML-DL) group.
The results of these additional sources for the ML subject are listed in Table 11.

4.5.1. Comparison Between Markup Language and Programming

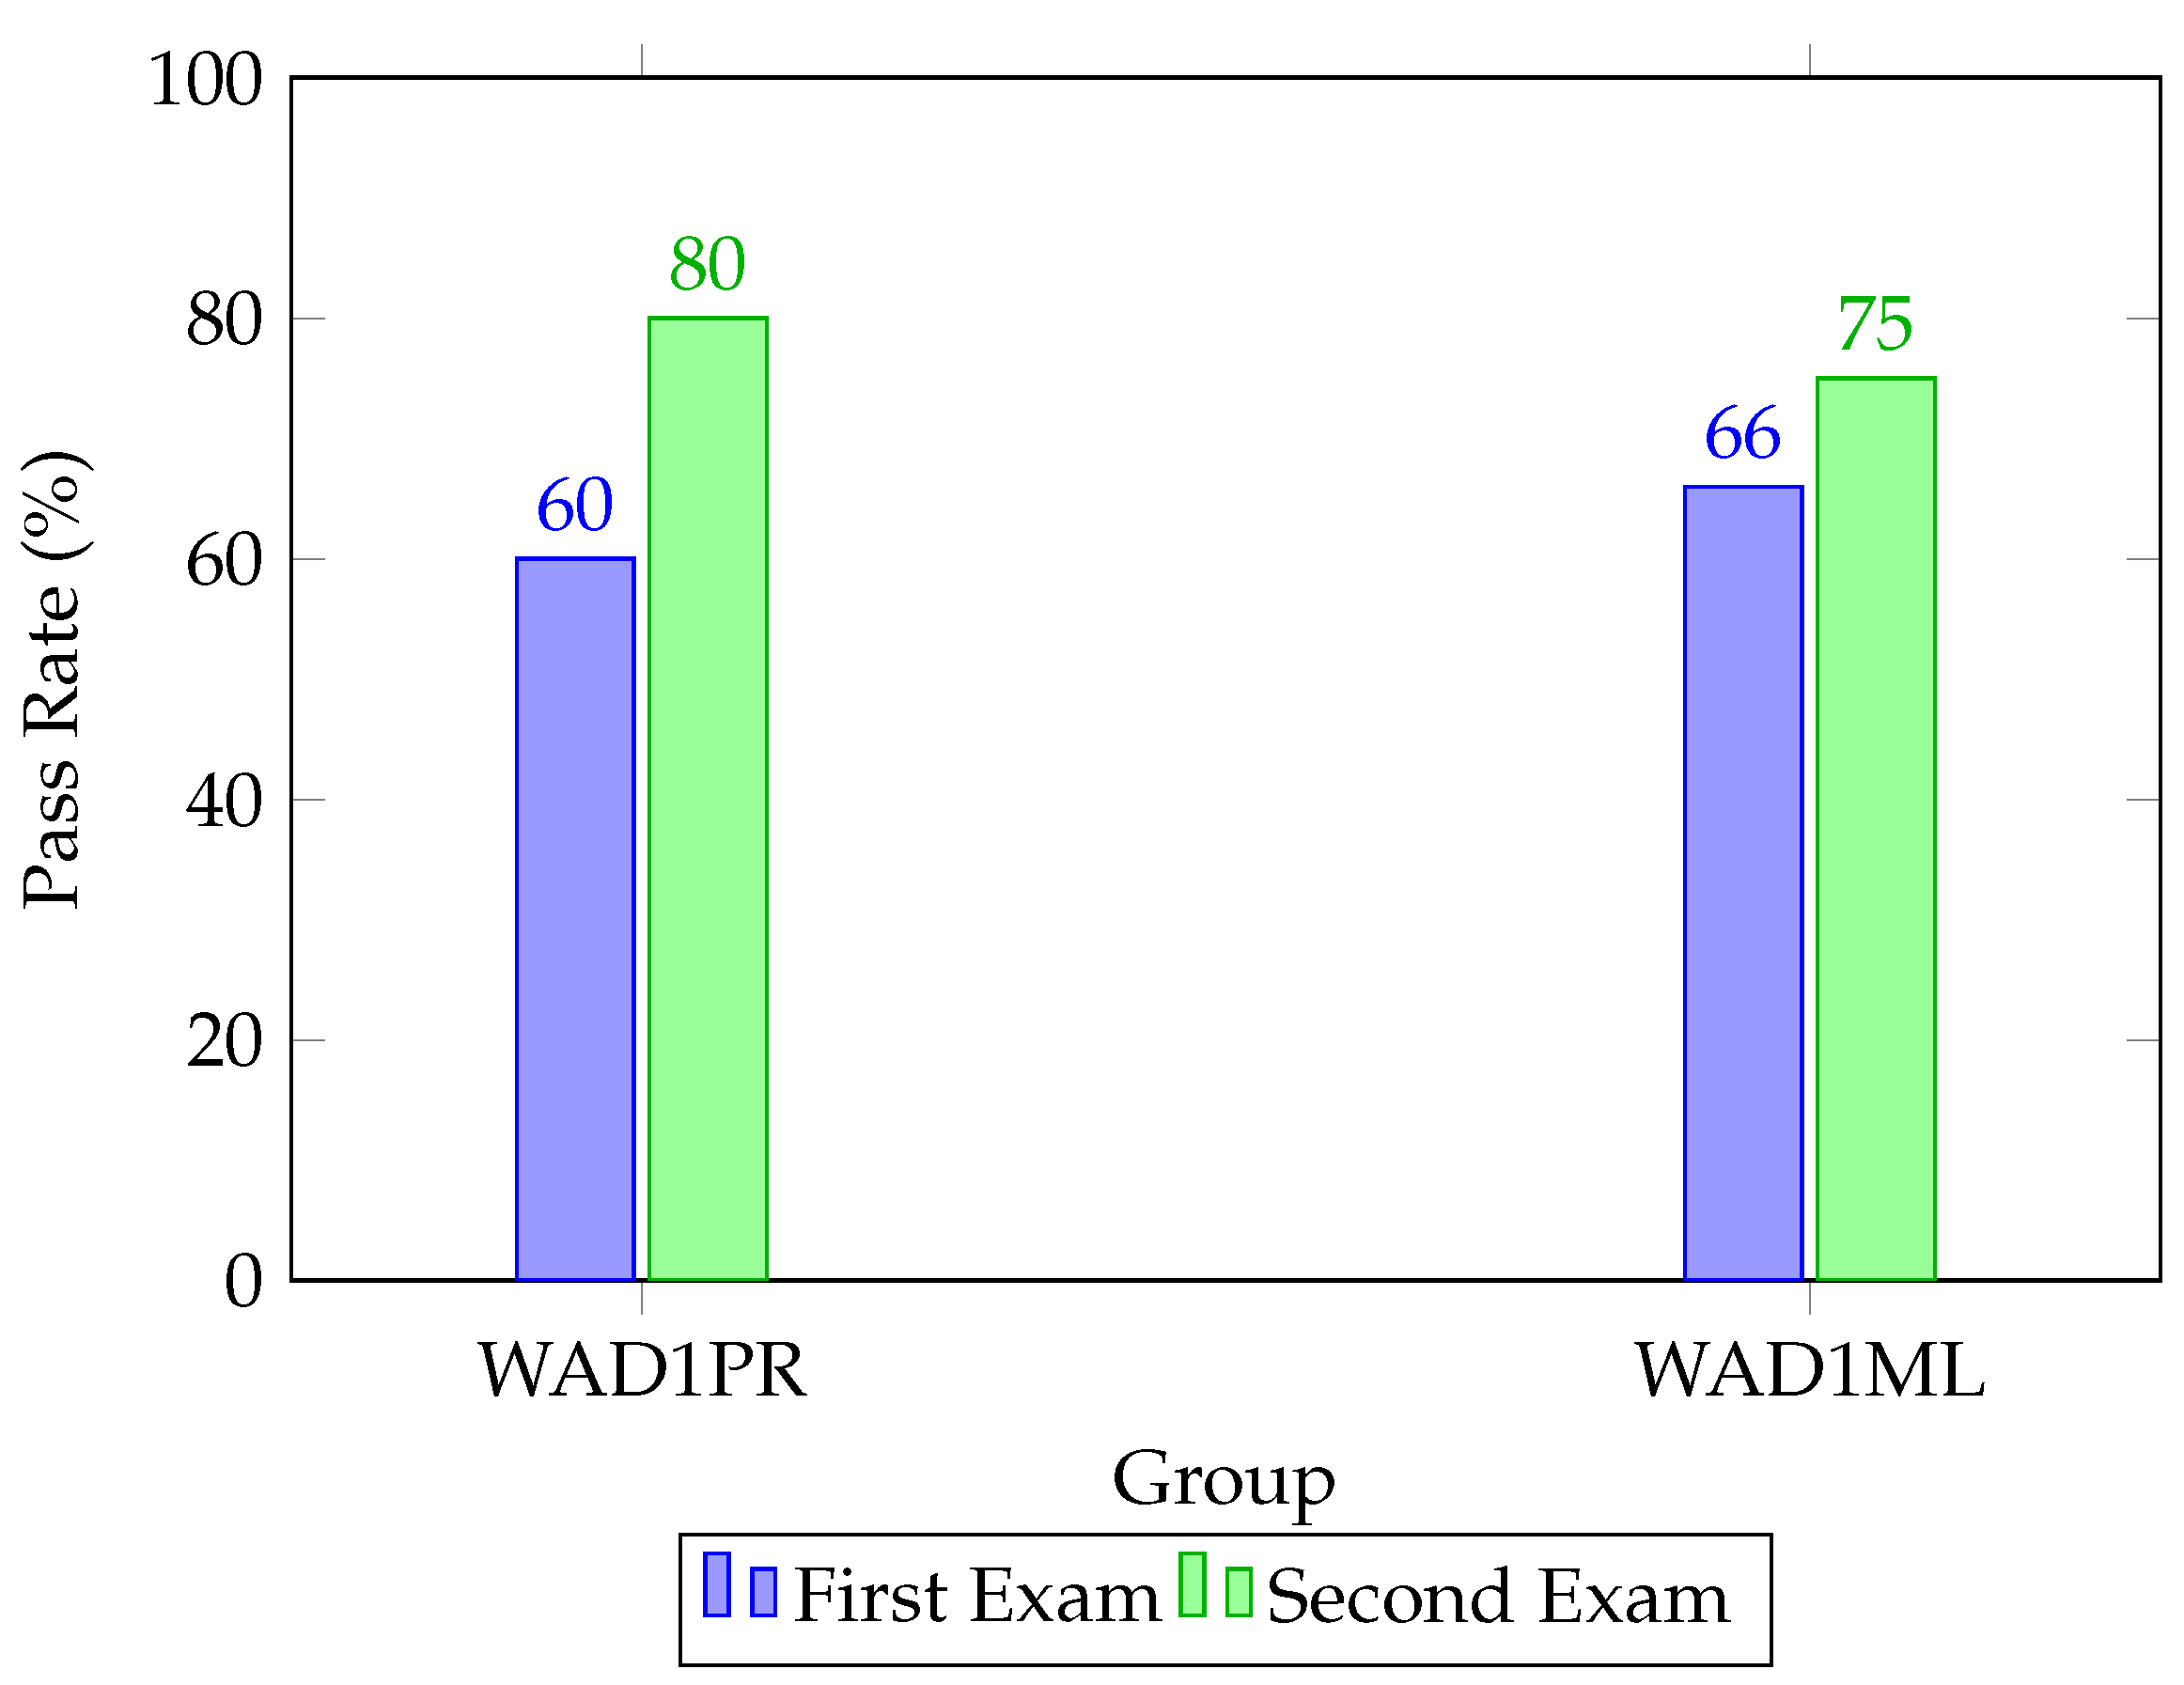
Figure 8 and Table 12 illustrate the improvement in student pass rates between the first and second-chance evaluations. In both groups, a positive increase is observed, with a 20% improvement in the Programming group and a 9% improvement in the Markup Language group. This supports the effectiveness of the feedback and the active methodology in promoting student engagement and performance.
After applying the Shapiro–Wilk normality test to the results of Section 4.3 and Section 4.4, it was found that the data for the project grades of the two groups did not follow a normal distribution. The Mann–Whitney U test was then applied, which does not assume normality of the samples and uses parameters of central tendency such as the median, being less sensitive to extreme values. This provided a p-value of 0.2, confirming that there is no significant difference between the data and that the results are similar in both groups. Finally, the Kolmogorov–Smirnov test indicates that the two datasets have the same distribution. These results are summarised in Table 13.
Regarding the final exam grades, the Shapiro–Wilk normality tests reached similar conclusions to those previously obtained. However, the Mann–Whitney U test indicates that the datasets differ significantly, confirming that, generally, students perform better in the Markup Language subject. Finally, the Kolmogorov–Smirnov test indicates that the two datasets have the same distribution. These results are also summarised in Table 13.

4.5.2. Comparison Between Markup Language Groups of 2023 and 2024

Regarding the 2023 ML group, the grades for the project and first-chance exam are shown in Figure 9 and Table 14.
After analysing the 2024 ML group (described in Section 3.1) and the 2023 ML group, where a similar project was carried out, it is determined that the project grades are similar for both courses. The Shapiro–Wilk normality test shows that the project grades of the 2023 ML group do not follow a normal distribution and the Mann–Whitney U test indicates that there is no significant difference in the data. Finally, the Kolmogorov–Smirnov test confirmed that the datasets follow the same distribution. However, there are significant differences between the two datasets for the final grades and in general the 2023 group has a higher average score than the 2024 group. The summary of the statistical analysis is shown in Table 15.

4.5.3. Comparison of All Non-Distance Groups of Markup Language

Comparing the final marks of all non-distance groups (first-chance examination), the Kruskal–Wallis test shows no significant differences. In this sense, all students perceive the ML subject similarly and there are no significant differences between the groups. As mentioned previously, from a statistical point of view, the additional groups performed better. This may be because, in previous years, completing the project was not a mandatory part of the grading criteria, whereas it was in the case studied. In previous years, students who did not complete the project were still able to pass. This was rectified in the group analysed in this work and the marks reflected this fact. In addition, the diary evaluation was mandatory to pass the course. The results of the statistical analysis are shown in Table 16.

4.5.4. Additional Distance Learning Markup Language Group

It is interesting to analyse the additional distance learning group of ML in order to highlight the methodological differences and results obtained by applying a different pedagogical approach with a different student profile to the same subject. Of the 75 students enrolled in distance learning, only 24 took the exam. Most students opt for this type of study in order to reconcile work and family life. Their academic backgrounds were diverse: some worked in IT and needed the vocational training qualification to consolidate their positions or take part in a merit-based competition, while others were starting from scratch or wanted to resume studies they had left halfway through. They were generally adults over 30 years of age. These distance learning courses are characterised by the fact that the content is provided on the platform and cannot be changed by the teacher in charge. Some of these contents are obsolete and difficult to follow by the students, especially for those who start without previous knowledge. According to the students, there is an abrupt jump between the beginning and the end of the same subject.
This teaching format requires great dedication and responsibility from students. Consequently, despite the teachers being available to solve any problem that may arise, the number of students’ queries and the engagement of the students diminishes throughout the course, resulting in a higher dropout rate.
They had one on-site exam and one compulsory assignment per term. However, the positive results of their homework were not reflected in their exam results, despite the fact that the exam was very similar to the homework they had done. Consequently, their activity and involvement waned throughout the course.

5. Discussion

The profile of students in vocational education and training can be very varied. It is common to find disruptive profiles that lack motivation, which can have a negative impact on the classroom climate (Cerdà-Navarro et al., 2022).
In general, the students in both courses showed a positive attitude and predisposition towards the proposed projects and methodologies. They demonstrated considerable interest and autonomy, similarly as indicated in Latorre-Cosculluela et al. (2020) and despite the complexity of some of the contents (Chondrogiannis et al., 2021), they participated actively, and the absenteeism was very low.
Considering the total number of students, less than 50% of them passed the project evaluation and exam in both subjects. It is important to note that some of the students dropped out at the beginning of the course, while others did not attend classes regularly. This may also be due to the mandatory nature of the project and the diary work required. However, as previously mentioned in Section 4, these results correspond to the first-chance exam and project evaluations. To understand and address this issue, interviews were conducted after the project and exam evaluations, during which the students were able to discuss the problems they had encountered. After these interviews, in which the stated problems were explained and solved, the majority of students who had worked on the projects passed both the project and the exam in the second-chance evaluation (more than 75% in both subjects).
ML’s generally better marks are due to the fact that a large part of the module covers the teaching of HTML and CSS (including some JavaScript without becoming the core), which allows more focus on interfaces and design, and less on programming logic. Additionally, several extracurricular activities coincided with the ML hours, and the subject had fewer weekly hours, meaning that it was not possible to delve deeper into the content as it was done in Programming or ML in previous years. This could explain the moderate success of the final grades in the first ML evaluation. However, as stated in Section 4, most of the students passed the project and exam in the second-chance evaluation, and these results are consistent with those reported in previous studies (Díaz-Lauzurica & Moreno-Salinas, 2023).
The differences in project grades for the groups analysed in this work, as shown in Section 4, suggest that the level of complexity of the two projects is perceived to be similar, as there is no significant difference in the data. Regarding the final grades for ML and Programming in the first-chance evaluation, these results were to be expected, due to the different complexity of the content, as previously mentioned. Object-oriented programming is less intuitive for students than HTML, for example. Many concepts had to be repeated throughout the course and, yet some students still had difficulties at the end of the course and needed further support, similarly to López et al. (2024). This is why the ML subject is usually considered to be more accessible than the Programming subject by students.
The inferences that emerged from the interviews and the final questionnaire were as follows:
  • Difficulty of the challenges: They stated that, when they started, they thought the challenges were unattainable. Later on, however, they felt much more capable.
  • Motivation by playing: They all agreed that the game encouraged them to persevere. They commented that they continued to discuss the challenges even during breaks and at home.
  • Feasibility of follow-ups: They agreed that the daily follow-ups were useful for providing them with quick feedback, which they considered positive. However, they also found it partly stressful.
  • Recommendations received: They commented that they would have liked to learn more about Java’s visual side.
Therefore, now we can analyse the research hypotheses:
  • The implementation of active learning methodologies in introductory Computer Science courses in VET increases student commitment and reduces absenteeism rates. Both groups showed great interest in and motivation for carrying out the activities, and appreciated their practical orientation. In addition, doing projects consisting of games has shown to be a great alternative to motivate students to engage with the subject, work independently outside of class hours, and collaborate with classmates to develop and discuss solutions. These methodologies therefore make it possible to foster students’ interest, improve the classroom climate, and motivate students, in line with the findings in the literature (Anwar et al., 2019; Samah et al., 2022). It can also be concluded that it may decrease the dropout rate, which is relatively common in basic vocational education and training, and was a particular problem in previous years when students felt unable to keep up with the class. By adapting active methodologies to VET, students feel they can develop the project and move forward with their classmates, sharing ideas and solutions, without feeling displaced or disconnected from the class.
  • There is a significant relationship between the use of active learning methodologies and student engagement and involvement in activities and content, and academic performance in early-stage Computer Science courses within VET. Student participation in activities and project development improved notably, with the vast majority showing a high level of interest and engagement in class. This significantly improved the classroom atmosphere, with fewer interruptions and distractions, allowing for higher-quality individual and collaborative study. It also enabled more in-depth study of the content, promoting innovation and creativity (Calavia et al., 2023; Cross, 2023; Guaman-Quintanilla et al., 2023). However, this was not initially reflected in the grades, with only 50% of students passing the first examination. This could be due to the complexity of the content and the project in the case of the Programming subject, where the students’ improvement was more noticeable, or due to the continuous assessment introduced on the Markup Language course this year, which had not been applied in previous years. In any case, the students’ good assimilation and application of the concepts is worth highlighting, as is the fact that more than 75% of students who attended class regularly passed the second-chance exam and project evaluation positively. However, although gamified PBL can effectively enhance learning outcomes, the evaluation should be re-designed beyond traditional educational tests as indicated in Huang et al. (2023).
Therefore, it is possible to state that active methodologies place students at the core of the teaching–learning process, encouraging them to play a more active role in developing the subject and becoming the main protagonists of their own learning. This suggests that they assimilate concepts more effectively. They demonstrate greater interest and motivation when they observe the practical application of concepts, as indicated in Krüger (2019); Woraphiphat and Roopsuwankun (2023); Zhao and Ko (2018). This approach reduces absenteeism and dropout rates while improving the classroom climate, which is a critical factor as stated in Martín de Soto Domínguez (2021). However, a redesign of the evaluation process may be necessary, as suggested in Huang et al. (2023). It can therefore be concluded that active methodologies are highly effective in basic vocational education and training, mitigating common issues in these courses.
Regarding the additional distance learning group of ML mentioned in Section 4.5, it is interesting to analyse it in order to highlight the methodological differences and results obtained by applying a different pedagogical approach to the same subject with a different student profile.
This latter group is a clear example of the lack of motivation that VET students can display. Apart from the added complexity of distance learning, rigid, traditional teaching materials may cause students to lose interest more quickly than in on-site learning. Therefore, materials and activities that motivate students are needed, not only to help them succeed in their studies, but also to prevent them from dropping out. For future courses, it would be interesting to try applying the same methodology to distance learning as to the other groups. As mentioned, this could not be done in the year of study due to the impossibility of modifying the materials and methods of the distance group.
Although general conclusions have been drawn, given the different complexity of the subjects and the size of the projects, the results of each group are analysed individually.

5.1. Programming Group

It is important to note that the contents and concepts covered in this group were considerably more complex than those in the ML group. In addition, the project required greater dedication and effort. The application of multiple concepts and developments was required for a correct functioning of the game. Furthermore, while information and reusable code from different sources were available for developing the algorithms, the game required a logic that was not fully conceived in the sources they consulted. This meant that they had to adapt their finding to suit specific conditions.
Except for two students with some prior knowledge in coding, they had not programmed before and none of them had knowledge on object-oriented programming. This is why the results obtained in the projects are of great importance, because the amount of knowledge to be acquired, as well as its complexity, was very significant.
It is also very important to remark that the project generated a significant amount of interest, with students dedicating time to it outside of class and in their free time, highlighting on multiple occasions their satisfaction with the practical orientation used in general, and the development of the game in particular. This also encouraged group and collaborative work, with students sharing their solutions with their peers and demonstrating their progress, discussing the most promising options. All this meant that, although the grades in this group were not very high, it was considered a resounding success as almost the entire class showed great interest and motivation in completing the task, with a very favourable classroom climate for both individual and group work. This coincides with the conclusions of Samah et al. (2024), where it is stated that gamification and game-based learning can improve academic performance, engagement, and motivation in vocational education and training students, although it is remarked that more studies are needed to determine which gamification strategies are better suited for VET students.
Regarding the specific knowledge and competences acquired by this group, the main results were as follows:
  • Classes and relationships: In general, the attributes and relationships between classes were well conceived, although, as expected, it took time to understand the casuistry. The concepts of class, object, inheritance, instantiation, polymorphism, enumeration, and collections were understood. Despite the fact that similar exercises had been carried out in the past, there was particular hesitation regarding the approach to be taken for establishing relationships between nodes and their neighbours. While a higher number of classes employed in the solution may not necessarily indicate efficiency and effectiveness, in this case it was a good indicator of the level of understanding. The number of classes and interfaces varied from project to project, depending on their complexity. There were projects with approximately 10 classes, which correctly and discretely solved most of the requested requirements. Another project involved 26 classes/interfaces, while the one with the largest number comprised 43 classes.
  • Recursion and interfaces: Their primary concern was to achieve sufficiency in the use of recursion, especially in the reading of XML files and the different algorithms. The use of interfaces, both in the programming language and in the design of their own solutions, was a bit different and did not catch their attention. Moreover, the latter alternative of using their own solution was not the most popular option among the students.
  • Flexibility: Parametrisation was an important factor due to the dynamics of the application. It allowed the application to retain flexibility and the possibility to adapt it to new conditions. In the solutions that presented menus, the different configuration options were requested by concatenating several loops, so the goal of making good use of control structures was achieved. It should be noted that creating the menu was very time-consuming, so some students opted to enter the data directly into the program, which was accepted as a solution. Likewise, the classes and methods for accessing files, loading node map data from files or reading from CSV, as well as writing to them, were used correctly.
  • Logic: At the logic level, Dijkstra was used as a project requirement to locate police officers, while DFS was used in general for the thief. To facilitate communication between classes, the Mediator design pattern was implemented. Two main solutions were put forward. The first option was to relocate police officers based on the last known location of the thief, and the second one advocated a random or Dijkstra-based allocation. The shift change between thief and police officers was the most difficult part, in some cases not even taking place.

5.2. Markup Language Group

Regarding ML students, the initial classroom climate was not good, with a negative attitude as indicated in Section 3.1. This environment made it more complex to implement active methodologies, where students are at the centre of the teaching–learning process (Cerda-Navarro et al., 2019). However, once the project started and they understood its practical approach, the students demonstrated satisfactory performance across all the topics analysed (HTML, JS and CSS), although all of them perceived HTML as more accessible to learn. In the case of CSS, a clear distinction was made between students who expressed a preference for design and those who expressed a preference for programming. The majority of ML students approached JavaScript learning as a challenge.
In general, the response from the ML students that participated in the project was satisfactory. They kept up the level of work and showed interest in the project, maintaining motivation throughout its execution. This constituted an important change with respect to their initial attitude. In any case, several problems inherent to the concepts taught were detected such as lack of abstraction in the solutions, problems in understanding how the loops work, lack of testing to ensure the correct functioning of all elements, lack of testing in different browsers, or lack of proactivity in the search for information in additional sources.
In any case, the findings demonstrated that the students attained adequate comprehension and proficiency in these concepts, which laid the foundation for the subsequent implementation of the localisation algorithm and the project.
The students did not make full use of the transformation of elements to HTML using XSLT. Instead, there was a greater reliance on JS, so the objective of using XML file transformations, one of the fundamental contents of the subject, was not completely achieved. However, the final mark for the project was not sanctioned, as the obligatory use of XSLT was not fully specified in the requirements.
With regard to the challenges encountered during the validation of XML files, these included the identification of the appropriate validated representation, the comprehension of XML definitions to facilitate validation, adherence to the stipulated requirements in the project statement, the absence of functional testing, and the validation of requirements. However, despite the complexity of the subject, the students showed great commitment and motivation in completing the project and in carrying out exercises to consolidate knowledge.

5.3. Limitations and Recommendations

Some of the results and conclusions obtained may differ due to the heterogeneity of the groups, and they cannot be fully compared. However, it allows us to draw conclusions about the applicability of the active methodologies for programming learning.
The positive results obtained motivated the institution to continue with the methodology proposed in subsequent academic years. However, this proposal was applied during a month. For its application over extended periods of time, it would be convenient to include additional tools to keep the interest and motivation, and make the proposal more dynamic, such as using simulation environments, interactive programming tools, App Inventor, Scratch, etc. These tools could also be combined.
In the proposal presented, project-based learning and related methodologies are considered for the teaching–learning process in single independent subjects. For a more extensive project applied to several subjects or for a longer period of time, the use and combination of different methods such as flipped classroom, gamification, etc., might also make the sessions more attractive and could be better adapted to different learning styles. Therefore, the wide range of methodologies and approaches available for computer science in VET education is a very active and vibrant field that requires the greatest effort from our side.
In addition, the total number of students involved in the research constitutes a limitation and general conclusions cannot be stated; for this reason, this work should be considered a case study. In this sense, the aim is not a generalisation of the found outcomes, but to give insight into active methodologies in VET that can raise motivation and interest. The results obtained are limited to the groups studied, but the conclusions derived can serve as a guide for teachers that have to deal with similar situations. This goal is based on the intrinsic characteristics of the qualitative research and the incidental sampling of the participants, so that the outcomes and results may be transferred or applied to other contexts. This transference in qualitative research is not a generalisation but the application of the essence of the findings to other contexts, and provides a general idea and some guidelines for the problem studied and its application (Grinnell & Unrau, 2005).

6. Conclusions

The use of active methodologies is gaining more and more presence at all educational levels thanks to the prominence given to the students, placing them at the centre of the teaching–learning process, and focusing on the practical and applied work of theoretical concepts. A prime example of these methodologies is project-based learning, with all its variants and adaptations.
In this study, a novel approach to increasing student motivation in Vocational Education and Training (VET) through the structured application of active methodologies is presented. Specifically, Project-Based Learning (PBL), Design Thinking (DT), which can be considered a variant of PBL, and gamification have been put into practice with two different groups of basic vocational education and training levels. While the prior literature has broadly endorsed active learning methodologies, this work specifically contributes by applying active methodologies in the context of two vocational education modules and empirically evaluating its motivational impact, academic performance, and classroom climate.
The key contributions of this work are threefold. First, it offers a practical framework for implementing active methodologies in VET, including the selection and structuring of a project aligned with curricular objectives. Second, it incorporates a comparative analysis of different groups and subjects in VET initial courses, supported by both quantitative and qualitative data. Third, the results support the hypotheses of the present and previous works on active methodologies and suggest that active methodologies not only enhance student engagement, but also improve academic performance, classroom climate, and absenteeism, outcomes not always established in existing research within vocational education contexts.
These findings add empirical weight to the call for more dynamic, student-centred teaching methodologies in VET and provide educators with a replicable strategy for fostering motivation and performance, making the teaching–learning process more effective.
As future work, the findings and outcomes presented in this work should be confirmed with a larger sampling and different groups and subjects. In this way, the conclusions obtained from the analysed case study could be generalised and general conclusions could be drawn regarding the use of active learning methodologies in Computer Science subjects in VET.
In addition, a software to reproduce the solutions of the students in the programming project, as well as to automatically evaluate them, will be presented. Moreover, a global project is being developed that will allow the interconnection of different subjects so that students can work throughout a whole academic year, and see the relationships between the different concepts covered in each subject.

Author Contributions

Conceptualisation, B.D.-L. and D.M.-S.; methodology, B.D.-L. and D.M.-S.; software, B.D.-L.; validation, B.D.-L. and D.M.-S.; formal analysis, B.D.-L. and D.M.-S.; investigation, B.D.-L.; resources, B.D.-L.; writing—original draft preparation, B.D.-L. and D.M.-S.; writing—review and editing, B.D.-L. and D.M.-S.; visualisation, B.D.-L. and D.M.-S.; supervision, D.M.-S.; project administration, D.M.-S.; funding acquisition, D.M.-S. All authors have read and agreed to the published version of the manuscript.

Funding

This work was supported in part under project PID2023-146540OB-C41, funded MCIN/AEI/10.13039/501100011033. Part of this work was also supported by Innovation Group “IEData” GID2016-6.

Institutional Review Board Statement

Not applicable.

Informed Consent Statement

The authors declare that no human experimentation has been carried out in this work. The results of the present research have been the result of the normal performance of the profession of the first author, a vocational education teacher. This work performance followed the protocols and regulations of the educational centre where the results were obtained. The participants involved in the analysis of the work were all adults and they gave their informed consent to the anonymous use of their academic results. No personal data were stored.

Data Availability Statement

The data presented in this study are available on request from the corresponding author.

Conflicts of Interest

The authors declare no conflicts of interest. The funders had no role in the design of the study; in the collection, analyses, or interpretation of data; in the writing of the manuscript; or in the decision to publish the results.

Abbreviations

The following abbreviations are used in this manuscript and are listed in alphabetical order:
BFSBreadth First Search
CLCollaborative Learning
CSECompulsory Secondary Education
CSSCascading Style Sheets
CSTAComputer Science Teachers Association
CSVComma-Separated Values
CTComputational Thinking
DFSDepth First Search
DTDesign Thinking
DTDDocument Type Definition
FPFlipped Classroom
HTMLHyperText Markup Language
ICTInformation and Communication Technologies
JSJavaScript
MLMarkup Language subject
ML-DLMarkup Language subject in Distance Learning Education
OOPObject-Oriented Programming
PBLProject-Based Learning
PRProgramming subject
STEMScience, Technology, Engineering, and Mathematics
UWBUltra-Wide Band
VETVocational Education and Training
WADWeb Application Design
WAD1MLFirst year of WAD, subject Markup Language
WAD1PRFirst year of WAD, subject Programming
XMLExtensible Markup Language
XSDXML Schema Definition
XSLTeXtensible Stylesheet Language Transformation

References

  1. Ames, C. (1992). Classrooms: Goals, structures, and student motivation. Journal of Educational Psychology, 84(3), 261. [Google Scholar] [CrossRef]
  2. Angraini, L. M., Yolanda, F., & Muhammad, I. (2023). Augmented reality: The improvement of computational thinking based on students’ initial mathematical ability. International Journal of Instruction, 16(3), 1033–1054. [Google Scholar] [CrossRef]
  3. Anwar, S., Bascou, N. A., Menekse, M., & Kardgar, A. (2019). A systematic review of studies on educational robotics. Journal of Pre-College Engineering Education Research (J-PEER), 9(2), 2. [Google Scholar] [CrossRef]
  4. Arís, N., & Orcos, L. (2019). Educational robotics in the stage of secondary education: Empirical study on motivation and STEM skills. Education Sciences, 9(2), 73. [Google Scholar] [CrossRef]
  5. Ausubel, D. P. (2012). The acquisition and retention of knowledge: A cognitive view. Springer Science & Business Media. [Google Scholar]
  6. Bacca, J., Baldiris, S., Fabregat, R., Kinshuk, & Graf, S. (2015). Mobile augmented reality in vocational education and training. Procedia Computer Science, 75, 49–58. [Google Scholar] [CrossRef]
  7. Bacca Acosta, J. L., Baldiris Navarro, S. M., Fabregat Gesa, R., & Kinshuk, K. (2019). Framework for designing motivational augmented reality applications in vocational education and training. Australasian Journal of Educational Technology, 35(3). [Google Scholar] [CrossRef]
  8. Bandura, A. (1977). Self-efficacy: Toward a unifying theory of behavioral change. Psychological Review, 84(2), 191. [Google Scholar] [CrossRef]
  9. Bhattacharya, K. (2017). Fundamentals of qualitative research: A practical guide. Routledge. [Google Scholar]
  10. Blumenfeld, P. C., Soloway, E., Marx, R. W., Krajcik, J. S., Guzdial, M., & Palincsar, A. (1991). Motivating project-based learning: Sustaining the doing, supporting the learning. Educational Psychologist, 26(3–4), 369–398. [Google Scholar] [CrossRef]
  11. Boonk, L. M., Gijselaers, H. J. M., Ritzen, H., & Brand-Gruwel, S. (2022). Student-perceived parental involvement as a predictor for academic motivation in vocational education and training (VET). Journal of Vocational Education & Training, 74(2), 187–209. [Google Scholar] [CrossRef]
  12. Braun, V., & Clarke, V. (2006). Using thematic analysis in psychology. Qualitative Research in Psychology, 3(2), 77–101. [Google Scholar] [CrossRef]
  13. Brown, A. L., & Campione, J. C. (1996). Psychological theory and the design of innovative learning environments: On procedures, principles, and systems. Lawrence Erlbaum Associates, Inc. [Google Scholar]
  14. Bruner, J. S. (2009). The process of education. Harvard University Press. [Google Scholar]
  15. Calavia, M. B., Blanco, T., Casas, R., & Dieste, B. (2023). Making design thinking for education sustainable: Training preservice teachers to address practice challenges. Thinking Skills and Creativity, 47, 101199. [Google Scholar] [CrossRef]
  16. Cerda-Navarro, A., Salva-Mut, F., & Comas Forgas, R. (2019). A typology of students in intermediate vocational education and training programmes based on student engagement factors, sociodemographic characteristics and intentions of dropping out. European Journal of Education, 54(4), 635–650. [Google Scholar] [CrossRef]
  17. Cerdà-Navarro, A., Quintana-Murci, E., & Salvà-Mut, F. (2022). Reasons for dropping out of intermediate vocational education and training in Spain: The influence of sociodemographic characteristics and academic background. Journal of Vocational Education & Training, 76(3), 1–25. [Google Scholar] [CrossRef]
  18. Chen, C., Haduong, P., Brennan, K., Sonnert, G., & Sadler, P. (2019). The effects of first programming language on college students’ computing attitude and achievement: A comparison of graphical and textual languages. Computer Science Education, 29(1), 23–48. [Google Scholar] [CrossRef]
  19. Chiang, C.-L., & Lee, H. (2016). The effect of project-based learning on learning motivation and problem-solving ability of vocational high school students. International Journal of Information and Education Technology, 6, 709–712. [Google Scholar] [CrossRef]
  20. Chondrogiannis, E., Symeonaki, E., Papachristos, D., Loukatos, D., & Arvanitis, K. G. (2021). Computational thinking and STEM in agriculture vocational training: A case study in a Greek vocational education institution. European Journal of Investigation in Health, Psychology and Education, 11(1), 230–250. [Google Scholar] [CrossRef]
  21. Cross, N. (2023). Design thinking: Understanding how designers think and work. Bloomsbury Publishing. [Google Scholar]
  22. Csikszentmihalyi, M. (2014). Flow and the foundations of positive psychology (Vol. 10). Springer. [Google Scholar]
  23. Deci, E. L., & Ryan, R. M. (2000). The “what” and “why” of goal pursuits: Human needs and the self-determination of behavior. Psychological Inquiry, 11(4), 227–268. [Google Scholar] [CrossRef]
  24. de Julián Posada, E. C., & García, M. S. Á. (2018). Análisis del uso de plataformas de aprendizaje virtual en el proceso de aprendizaje de programación en c (analysis of the use of virtual learning platforms in the c programming learning process). Pistas Educativas, 40(130), 2123–2137. [Google Scholar]
  25. Díaz-Bravo, L., Torruco-García, U., Martínez-Hernández, M., & Varela-Ruiz, M. (2013). La entrevista, recurso flexible y dinámico. Investigación en educación médica, 2(7), 162–167. [Google Scholar] [CrossRef]
  26. Díaz-Lauzurica, B., & Moreno-Salinas, D. (2019). Computational thinking and robotics: A teaching experience in compulsory secondary education with students with high degree of apathy and demotivation. Sustainability, 11(18), 5109. [Google Scholar] [CrossRef]
  27. Díaz-Lauzurica, B., & Moreno-Salinas, D. (2023). Applying design thinking to enhance programming education in vocational and compulsory secondary schools. Applied Sciences, 13(23), 12792. [Google Scholar] [CrossRef]
  28. Dwyer, H., Hill, C., Hansen, A., Iveland, A., Franklin, D., & Harlow, D. (2015, July 9–13). Fourth grade students reading block-based programs: Predictions, visual cues, and affordances. Eleventh Annual International Conference on International Computing Education Research, Omaha, NE, USA. [Google Scholar] [CrossRef]
  29. Grinnell, R. M., Jr., & Unrau, Y. (2005). Social work research and evaluation: Quantitative and qualitative approaches. Cengage Learning. [Google Scholar]
  30. Guaman-Quintanilla, S., Everaert, P., Chiluiza, K., & Valcke, M. (2023). Impact of design thinking in higher education: A multi-actor perspective on problem solving and creativity. International Journal of Technology and Design Education, 33, 217–240. [Google Scholar] [CrossRef]
  31. Guan, L., Yuan, N., Xie, Y., Feng, J., Sun, B., & Li, L. (2015, July 22–24). A study on the application of flipped classroom teaching in higher vocational education. 2015 10th International Conference on Computer Science & Education (ICCSE), Cambridge, UK. [Google Scholar] [CrossRef]
  32. Hattie, J., & Timperley, H. (2007). The power of feedback. Review of Educational Research, 77(1), 81–112. [Google Scholar] [CrossRef]
  33. Hollander, M., Wolfe, D. A., & Chicken, E. (2013). Nonparametric statistical methods. John Wiley & Sons. [Google Scholar]
  34. Huang, W., Li, X., & Shang, J. (2023). Gamified project-based learning: A systematic review of the research landscape. Sustainability, 15(2), 940. [Google Scholar] [CrossRef]
  35. Jalinus, N., Nabawi, R. A., & Mardin, A. (2017). The seven steps of project based learning model to enhance productive competences of vocational students. In Proceedings of the international conference on technology and vocational teachers (ICTVT 2017) (pp. 251–256). Atlantis Press. [Google Scholar] [CrossRef]
  36. Jayalath, J., & Esichaikul, V. (2022). Gamification to enhance motivation and engagement in blended eLearning for technical and vocational education and training. Technology, Knowledge and Learning, 27, 91–118. [Google Scholar] [CrossRef]
  37. Johnson, D. W., & Johnson, R. T. (1987). Learning together and alone: Cooperative, competitive, and individualistic learning. Prentice-Hall, Inc. [Google Scholar]
  38. Kholifah, N., Sudira, P., Rachmadtullah, R., Nurtanto, M., & Suyitno, S. (2020). The effectiveness of using blended learning models against vocational education student learning motivation. International Journal of Advanced Trends in Computer Science and Engineering, 9(5), 7964–7968. [Google Scholar] [CrossRef]
  39. Krüger, M. (2019). Design thinking for German vocational schools? Discovering of an innovative approach by testing in teacher education. Open Education Studies, 1(1), 209–219. [Google Scholar] [CrossRef]
  40. Lage, M. J., Platt, G. J., & Treglia, M. (2000). Inverting the classroom: A gateway to creating an inclusive learning environment. The Journal of Economic Education, 31(1), 30–43. [Google Scholar] [CrossRef]
  41. Latorre-Cosculluela, C., Vázquez-Toledo, S., Rodríguez-Martínez, A., & Liesa-Orús, M. (2020). Design Thinking: Creatividad y pensamiento crítico en la universidad. Revista Electrónica de Investigación Educativa, 22. [Google Scholar] [CrossRef]
  42. Lihui Sun, Z. G., & Hu, L. (2023). Educational games promote the development of students’ computational thinking: A meta-analytic review. Interactive Learning Environments, 31(6), 3476–3490. [Google Scholar] [CrossRef]
  43. Locke, E. A., & Latham, G. P. (1990). A theory of goal setting & task performance. Prentice-Hall, Inc. [Google Scholar]
  44. López, H. L. L., Rodríguez, L. G. Q., Mora, E. A. H., & Valenzuela, A. C. C. (2024). Paradigma de la programacion orientada a objetos (POO). Revista Digital de Tecnologías Informáticas y Sistemas, 8(1), 147–153. [Google Scholar] [CrossRef]
  45. Lv, L., Zhong, B., & Liu, X. (2023). A literature review on the empirical studies of the integration of mathematics and computational thinking. Education and Information Technologies, 28(7), 8171–8193. [Google Scholar] [CrossRef]
  46. Martín de Soto Domínguez, J. (2021). Formación profesional Básica: La etapa educativa al servicio de la equidad. Padres y Maestros/Journal of Parents and Teachers, 385, 26–31. [Google Scholar] [CrossRef]
  47. Maryono, D., Sajidan, Akhyar, M., Sarwanto, Wicaksono, B. T., & Prakisya, N. P. T. (2025). NgodingSeru.com: An adaptive e-learning system with gamification to enhance programming problem-solving skills for vocational high school students. Discover Education, 4(1), 1–16. [Google Scholar] [CrossRef]
  48. McLaughlan, R. G. (2007). Instructional strategies to educate for sustainability in technology assessment. International Journal of Engineering Education, 23(2), 201–208. [Google Scholar]
  49. Megayanti, T., Busono, T., & Maknun, J. (2020). Project-based learning efficacy in vocational education: Literature review. In Proceedings of iop conference series: Materials science and engineering (Vol. 830(4)). IOP Publishing Ltd. [Google Scholar] [CrossRef]
  50. Mertens, D. (2010). Research and evaluation in education and psychology: Integrating diversity with quantitative, qualitative, and mixed methods. SAGE Publications. [Google Scholar]
  51. Mills, J. E., & Treagust, D. F. Engineering education: Is problem-based or project-based learning the answer? Australasian Journal of Engineering Education, 3, 2–16.
  52. Panke, S. (2019). Design thinking in education: Perspectives, opportunities and challenges. Open Education Studies, 1(1), 281–306. [Google Scholar] [CrossRef]
  53. Papadakis, S., Kalogiannakis, M., Orfanakis, V., & Zaranis, N. (2017). The appropriateness of scratch and app inventor as educational environments for teaching introductory programming in primary and secondary education. International Journal of Web-Based Learning and Teaching Technologies (IJWLTT), 12(4), 58–77. [Google Scholar] [CrossRef]
  54. Papadakis, S., & Orfanakis, V. (2017a). Comparing novice programing environments for use in secondary education: App Inventor for Android vs. Alice. International Journal of Technology Enhanced Learning, 10(1–2), 44–72. [Google Scholar] [CrossRef]
  55. Papadakis, S., & Orfanakis, V. (2017b). The combined use of lego mindstorms NXT and app inventor for teaching novice programmers. In D. Alimisis, M. Moro, & E. Menegatti (Eds.), Educational robotics in the makers era (pp. 193–204). Springer International Publishing. [Google Scholar]
  56. Papert, S. (1999). Eight big ideas behind the constructionist learning lab. In Constructive technology as the key to entering the community of learners (pp. 4–5). National Educational Computing Conference (NECC). [Google Scholar]
  57. Perez, A., Ramon, G., & Quintanal, J. (2012). Research methods and designs in education. Universidad Nacional de Educación a Distancia (UNED). [Google Scholar]
  58. Polman, J. L. (2010). The zone of proximal identity development in apprenticeship1 learning La zona de desarrollo próximo de la identidad en entornos de aprendizaje de oficios. Revista de Educación, 353, 129–155. [Google Scholar]
  59. Rizzo, M. L. (2019). Statistical computing with R. Chapman and Hall/CRC. [Google Scholar]
  60. Robinson, K. (2017). What is school culture? In What’s missing: Best practices for teaching students with disabilities (p. 1). Bloomsbury Publishing. [Google Scholar]
  61. Samah, L. A., Ismail, A., & Hasan, M. K. (2022). The effectiveness of gamification for students’ engagement in technical and vocational education and training. International Journal of Advanced Computer Science and Applications, 13(9). [Google Scholar] [CrossRef]
  62. Samah, L. A., Ismail, A., & Hasan, M. K. (2024). Gamification and game based learning for vocational education and training: A systematic literature review. Education and information technologies, 29, 1279–1317. [Google Scholar] [CrossRef]
  63. Sampieri, H. (2014). Methodology of the research. McGrawHill. [Google Scholar]
  64. Savin-Baden, M., & Major, C. (2013). Qualitative research: The essential guide to theory and practice. Routledge. [Google Scholar]
  65. Selltiz, C., Jahoda, M., Deutsch, M., & Cook, S. (1959). Research methods in social relations. Holt, Rinehart and Winston. [Google Scholar]
  66. Silver, C., & Lewins, A. (2014). Using software in qualitative research: A step-by-step guide (2nd ed.). SAGE Publications. [Google Scholar] [CrossRef]
  67. Staniškis, J. K., & Katiliūtė, E. (2016). Complex evaluation of sustainability in engineering education: Case & analysis. Journal of Cleaner Production, 120, 13–20. [Google Scholar] [CrossRef]
  68. Su, J., & Yang, W. (2023). A systematic review of integrating computational thinking in early childhood education. Computers and Education Open, 4, 100122. [Google Scholar] [CrossRef]
  69. Tabet, N., Gedawy, H., Alshikhabobakr, H., & Razak, S. (2016). From Alice to Python. Introducing text-based programming in middle schools. In Proceedings of the 2016 acm conference on innovation and technology in computer science education (pp. 124–129). Association for Computing Machinery. [Google Scholar] [CrossRef]
  70. Thomas, J. (2000). A review of research on project-based learning. The Autodesk; San Rafael. [Google Scholar]
  71. Tokuhama-Espinosa, T. (2014). Making classrooms better: 50 practical applications of mind, brain, and education science. WW Norton & Company. [Google Scholar]
  72. UNESCO. (2017). Using icts and blended learning in transforming technical and vocational education and training. C. Latchem. Available online: https://unesdoc.unesco.org/ark:/48223/pf0000247495 (accessed on 10 April 2025).
  73. Villalba, M. T., Castilla, G., & Redondo, S. (2018). Factors with influence on the adoption of the flipped classroom model in technical and vocational education. Journal of Information Technology Education: Research, 17, 441–469. [Google Scholar] [CrossRef]
  74. Weintrop, D., & Wilensky, U. (2016, April 8–12). Bringing blocks-based programming into high school computer science classrooms. Annual Meeting of the American Educational Research Association (AERA), Washington, DC, USA. [Google Scholar]
  75. Weintrop, D., & Wilensky, U. (2017). Comparing block-based and text-based programming in high school computer science classrooms. ACM Transactions on Computing Education (TOCE), 18(1). [Google Scholar] [CrossRef]
  76. Weitzman, E., & Miles, M. (1995). Computer programs for qualitative data analysis. SAGE Publications. [Google Scholar]
  77. Woraphiphat, I., & Roopsuwankun, P. (2023). The impact of online design thinking-based learning on entrepreneurial intention: The case of vocational college. Journal of Innovation and Entrepreneurship, 12(10), 2192–5372. [Google Scholar] [CrossRef]
  78. Xu, Z., Ritzhaupt, A. D., Tian, F., & Umapathy, K. (2019). Block-based versus text-based programming environments on novice student learning outcomes: A meta-analysis study. Computer Science Education, 29(2–3), 177–204. [Google Scholar] [CrossRef]
  79. Yadav, A., Good, J., Voogt, J., & Fisser, P. (2017). Computational thinking as an emerging competence domain. In M. Mulder (Ed.), Competence-based vocational and professional education: Bridging the worlds of work and education (pp. 1051–1067). Springer International Publishing. [Google Scholar] [CrossRef]
  80. Yazan, B. (2015). Three approaches to case study methods in education: Yin, Merriam, and Stake. The Qualitative Report, 20(2), 134–152. [Google Scholar] [CrossRef]
  81. Yildiz Durak, H. (2020). The effects of using different tools in programming teaching of secondary school students on engagement, computational thinking and reflective thinking skills for problem solving. Technology, Knowledge and Learning, 25(1), 179–195. [Google Scholar] [CrossRef]
  82. Zhao, Y., & Ko, Y.-O.-J. (2018). Design thinking as an innovative pedagogy and innovation as a learning process in leading vocational education change in China: Lessons from two cases. In Proceedings of the 31st international congress of school effectiveness and school improvement (icsei): Deepening school change for scaling: Principles, pathways and partnerships. Nanyang Technological University. [Google Scholar]
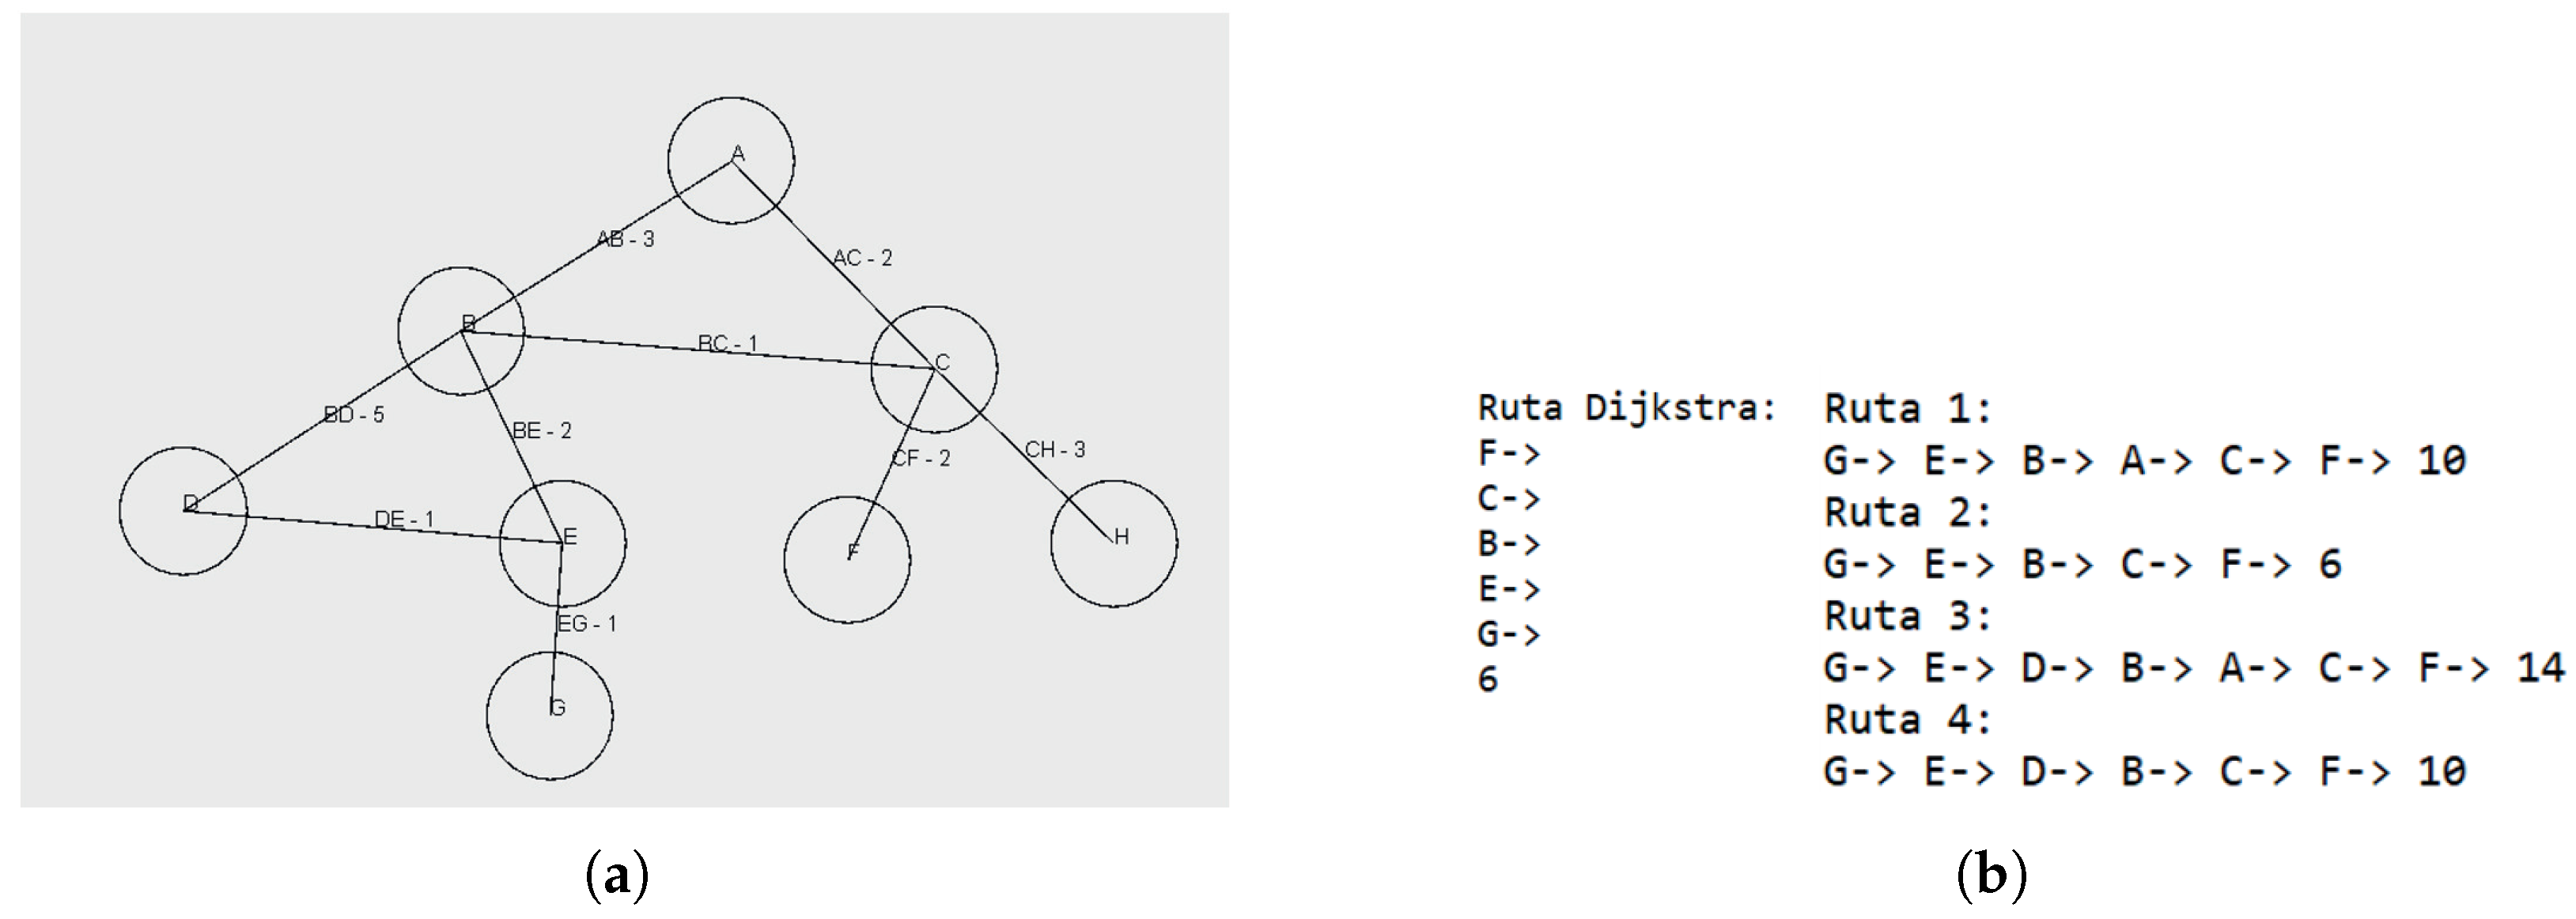
Figure 1. Execution of the project-game: (a) Example of one possible graph, the thief should go from node G to node F. (b) Computation of the Dijkstra solution and all possible routes from G to F.
Education 15 01017 g001
Figure 2. Example of a possible user interface for the game.
Education 15 01017 g002
Figure 3. Distribution of grades obtained by the students in the project of the PR group.
Education 15 01017 g003
Figure 4. Distribution of grades obtained by the students at the end of the course of the PR group.
Education 15 01017 g004
Figure 5. Examples of projects: (a) Example of the list of robots in the shop. (b) Comparison of skills between robots.
Education 15 01017 g005
Figure 6. Distribution of grades obtained by the students in the project of the ML group.
Education 15 01017 g006
Figure 7. Distribution of grades obtained by the students at the end of the course of the ML group.
Education 15 01017 g007
Figure 8. Comparison of student pass rates in first and second-chance exams for both groups.
Education 15 01017 g008
Figure 9. Grades for ML 2023 group in (a) project and (b) final exam (first-chance).
Education 15 01017 g009
Table 1. Characteristics of the Programming group (WAD1PR).
VariableDescription
GroupFirst year of Web Application Design (subject: Programming)
Total students enrolled17
Age range18–29 years
Gender distribution1 woman
Educational backgroundHigh school, middle school, higher education
Cultural/Economic contextDiverse: some foreign nationals, medium/low-income families, varied culture
Previous programming experience2 students had basic knowledge; rest had none
Attendance1 dropout early; 6 regular absentees
Class climatePositive; students mature, collaborative, respectful
Additional notesActions taken to limit excessive use of AI tools
Table 2. Characteristics of the Markup Language group (WAD1ML).
VariableDescription
GroupFirst year of Web Application Design (subject: Markup Language)
Total students enrolled20
Age range18–28 years
Gender distribution6 women
Educational backgroundHigh school, CSE, vocational training, some university (finished/unfinished)
Cultural/Economic contextMedium–high income; some with university degrees
Previous programming experienceNo prior experience in markup languages or programming
Attendance2 dropouts; 3 regular absentees
Class climateInitially poor; rule-breaking, stress, low interest in learning
Disruptive profiles3 students refused to engage in the project
Table 3. Skills monitored during the project activities.
SkillInstrumentsFeatures
Problem understanding and analysisFlow charts, pseudocode, etc.The student understands the problem and recognises the input and output parameters as well as the internal processing of each subproblem. Interprets the logic correctly to transfer it to code easily.
Problem analysisClass diagram and designDesigns classes with the correct attributes and methods. Identifies the interaction between classes correctly.
ImplementationCodeCorrectly determines variable types. Identifies the most suitable algorithm and the need for parametrisation. Deduces the causes of errors (syntactic and logical).
Table 4. Rate of students that completed the different project stages.
Project StagesDijkstraPossible Thief’s RoutesObstacle Analysis and Final RoutePolice Officers StrategyTurns
Rate of completion (%)10090804020
Table 5. Project grades details of the PR group.
Min.MedianMeanStd. Dev.Max.
0.0004.0003.6412.899.800
Table 6. Exam grades details of the PR group.
Min.MedianMeanStd. Dev.Max.
0.0003.0003.3743.459.830
Table 7. Students information about examination.
Initial Number of StudentsDropout at the Beginning of the CourseNo Evaluation by Regular AbsenteeismProject PassedFirst ExaminationSecond ExaminationPass Rate
17166/10 (60%)6/10 (60%)2/4 (50%)8/10 (80%)
Table 8. Project grades details of the ML group.
Min.MedianMeanStd. Dev.Max.
0.0002.0003.3473.659.500
Table 9. Exam grades details of the ML group.
Min.MedianMeanStd. Dev.Max.
0.00004.22944.15703.279.7350
Table 10. Students information about examination.
Initial Number of StudentsDropout at the Beginning of the CourseNo Evaluation by Regular AbsenteeismProject PassedFirst ExaminationSecond ExaminationPass Rate
20268/12 (66%)8/12 (66%)1/4 (25%)9/12 (75%)
Table 11. Examination results in the subject/course for ML groups of previous years.
Subject/CourseStudentsPassedExamination Pass Rate
ML 2023 Project16850.0
ML 2023 Final16850.0
ML 2022 Final151182.5
ML-DL 2024 Final24833.3
Table 12. Students performance in first and second-chance examination.
GroupStudents AssessedPassed—First ExamPassed—Second ExamImprovement (%)
WAD1PR106 (60%)8 (80%)+20%
WAD1ML128 (66%)9 (75%)+9%
Table 13. Statistical tests applied for comparison of Markup Language and Programming groups.
TestVariable/Groups Comparedp-ValueInterpretation
Shapiro–WilkWAD1PR Project Grades0.0024474Data not normally distributed
Shapiro–WilkWAD1ML Project Grades0.002134Data not normally distributed
Mann–Whitney UWAD1PR vs. WAD1ML Project Grades0.2No significant difference in project performance
Kolmogorov–SmirnovWAD1PR vs. WAD1ML Project Grades0.866Distributions are similar
Shapiro–WilkWAD1PR Exam Grades0.01326Data not normally distributed
Shapiro–WilkWAD1ML Exam Grades0.08829Data normally distributed
Mann–Whitney UWAD1PR vs. WAD1ML Exam Grades0.004932Significant difference in exam performance
Kolmogorov–SmirnovWAD1PR vs. WAD1ML Exam Grades0.7262Distributions are similar
Table 14. Project and exam grades details of the 2023 LM group.
GradesMin.MedianMeanStd. Dev.Max.
ML 2023 Project0.0005.0005.1253.2610.000
ML 2023 Exam2.6006.0056.4592.039.222
Table 15. Statistical tests applied for comparison of Markup Language groups of 2023 and 2024.
TestVariable/Groups Comparedp-ValueInterpretation
Shapiro–WilkWAD1ML Project Grades0.002134Data not normally distributed
Shapiro–WilkML Project Grades 20230.1881Data not normally distributed
Mann–Whitney UWAD1ML vs. ML2023 Final Project Grades0.1831No significant difference in project performance
Kolmogorov–SmirnovWAD1ML vs. ML2023 Final Project Grades0.1184Distributions are similar
Shapiro–WilkWAD1ML Exam Grades0.08829Data normally distributed
Shapiro–WilkML Project Exam 20230.471Data normally distributed
T StudentWAD1ML vs. ML2023 Final Exam Grades0.01283Significant difference in exam performance, better performance ML2023
Table 16. Statistical tests applied for comparison of non-distance groups of Markup Language.
TestVariable/Groups Comparedp-ValueInterpretation
Kruskal–WallisML Final Grades across years (2022–2024)0.3181No significant difference between cohorts
Disclaimer/Publisher’s Note: The statements, opinions and data contained in all publications are solely those of the individual author(s) and contributor(s) and not of MDPI and/or the editor(s). MDPI and/or the editor(s) disclaim responsibility for any injury to people or property resulting from any ideas, methods, instructions or products referred to in the content.