1. Introduction
Critical data literacy (CDL) has emerged as a crucial component in data science education across disciplines, requiring collaborative approaches that enhance learners’ skills beyond quantitative reasoning to include a comprehensive understanding of data workflows and tools (
Louie, 2022;
NASEM, 2018,
2022). Post-secondary students need advanced support mechanisms to engage effectively with complex data science practices, requiring frameworks and tools that assess proficiency across diverse data types and methodologies (
Pimental et al., 2022).
Recent scholarship advocates for nuanced data science instruction that engages students with data variability complexities and contextual impacts (
Lee et al., 2021;
Rosenberg & Jones, 2022). While introducing complexity is valuable, instructional design must address challenges including messy data handling and integrating existing student knowledge through effective scaffolding (
NASEM, 2022;
Rosenberg & Jones, 2022;
Yoon et al., 2019). Additionally, addressing equity and representation issues is vital for ensuring diversity within the data science community (
NASEM, 2022;
Pimental et al., 2022;
Rosenberg & Jones, 2022).
This study explores CDL at the post-secondary level, addressing priorities outlined by the National Academies of Science, Engineering, and Medicine (
NASEM, 2018,
2022). We examine a progression of data practices throughout a summer-long data science program, contributing to discourse on effective pedagogical strategies that empower students in an increasingly data-driven world. To this end, our research question is: How do data science practices taught in classroom settings differ from those enacted in real-world social justice projects?
2. Literature Review
2.1. Undergraduate Data Science Education
Data science education research primarily focuses on higher education, exploring statistical reasoning (
Reinhart et al., 2022), teaching tools (
Burckhardt et al., 2021;
Donoghue et al., 2021;
McCoy & Shih, 2016;
Vance, 2021), and computational thinking (
Rich et al., 2020). Recent approaches have also integrated practical experiences. For example,
Burckhardt et al. (
2021) used integrated statistics environments where students collaborated on exploratory data analysis, while
Donoghue et al. (
2021) implemented inquiry-based learning, addressing data wrangling, exploration, privacy, and analysis using Python version 3.11. These studies highlight the importance of hands-on learning experiences that mirror professional practice.
2.2. Critical Data Literacy
Data literacy encompasses understanding data production processes, crafting relevant inquiries, selecting appropriate analyses, and drawing contextual inferences (
Lee et al., 2021;
Stornaiuolo, 2020). CDL extends this foundation by emphasizing data’s societal impact and ethical considerations (
Louie, 2022;
Stornaiuolo, 2020), including safeguarding individual dignity and privacy (
Baumer et al., 2022;
NASEM, 2018) while addressing unequal power dynamics that influence data purpose and application. Following
Freire’s (
1970) educational approach, CDL empowers marginalized individuals to critically examine circumstances and pursue societal transformation. Real-world projects focused on social justice goals, such as community air quality improvement (
Reigh et al., 2022), can heighten student engagement despite implementation challenges (
Jiang et al., 2022;
Lee et al., 2021).
Louie (
2022) identified desired CDL outcomes, including fostering critical societal perspectives and confident data authorship; this process of developing sociopolitical viewpoints requires the thoughtful navigation of complex discussions.
2.3. Data Science Practices Within Small Groups
Data science practices involve systematic methodologies for extracting meaningful insights from data (
Rosenberg et al., 2020;
Sager, 2024). Essential components include data tools (
Eadie et al., 2019), problem understanding (
Pimental et al., 2022), ethics (
Baumer et al., 2022), exploration (
Ben-Zvi & Ben-Arush, 2014), wrangling (
Gundlach & Ward, 2021), and storytelling (
Wilkerson & Laina, 2018). Since data science work typically requires interdisciplinary teamwork across diverse stakeholders (
Donoghue et al., 2021), collaborative skills should be integrated into education through team-based projects (
Vance, 2021). These mentored group projects provide creative freedom for problem-solving and skill application, mirroring real-world scenarios where storytelling and ethical considerations are crucial (
Baumer et al., 2022;
Wilkerson & Polman, 2020). Students grouped by diverse backgrounds and skills gain valuable opportunities to exchange expertise and practice collaboration (
Asamoah et al., 2015;
Donoghue et al., 2021;
Vance, 2021).
3. Theoretical Framework
This study is grounded in situated learning theory, which conceptualizes learning as a social and contextual phenomenon where knowledge emerges through participation in communities of practice rather than individual cognitive processes (
Greeno, 2006;
Lave & Wenger, 1991;
Sawyer & Greeno, 2009;
Wilkerson & Polman, 2020).
Lave and Wenger’s (
1991) framework posits that learners move from legitimate peripheral participation toward fuller membership through authentic activities, while
Sawyer and Greeno (
2009) emphasize how learning emerges through collaborative discourse, negotiation of meaning, and shared problem-solving within socially complex group work.
Drawing from sociocultural learning theory, this framework recognizes that learning is mediated by cultural tools, technologies, and social structures (
Sawyer & Greeno, 2009). In data science contexts, students learn through programming languages, visualization tools, and analytical frameworks, which serve as mediating artifacts for participation in collaborative analysis, peer code review, and collective interpretation (
Jiang et al., 2022;
Lee et al., 2021;
Wilkerson & Polman, 2020). Rather than teaching abstract techniques, situated learning advocates for embedding instruction within authentic problems that mirror professional practice and connect to students’ lived experiences and cultural backgrounds (
Greeno, 2006;
Jiang et al., 2022;
Lave & Wenger, 1991;
Lee et al., 2021;
Reigh et al., 2022).
This critical perspective recognizes that data science is embedded within power systems that can reproduce or challenge existing inequalities, emphasizing the importance of fostering equity and democratic participation (
Jiang et al., 2022;
Lee et al., 2021;
Wilkerson & Polman, 2020).
Wilkerson and Polman (
2020) highlight data science education’s status as a discourse of power, necessitating approaches that build upon students’ existing strengths and funds of knowledge.
This theoretical framework guides our examination of how students and instructors develop into a functioning community of practice, how individual students move from peripheral to central participation, and how collaborative work contributes to understanding within the summer program’s specific context (
Greeno, 2006;
Jiang et al., 2022;
Lave & Wenger, 1991;
Sawyer & Greeno, 2009). This approach necessitates research methods capturing social, contextual, and temporal dimensions of learning, moving beyond simple knowledge acquisition measures to examine the complex ways students develop expertise and identity as data science practitioners.
4. Research Design
This manuscript uses a descriptive case study (
Yin, 2014) to investigate a group of undergraduate students as they take a data science course, then how three of these students apply their learning within a food justice project. The descriptive case study approach is used to provide a detailed, in-depth description of a phenomenon within its real-life context, in this case, the course-based data science project and food justice project (
Sager et al., 2025;
Yin, 2014).
4.1. Participants
Nine undergraduate students were accepted into a summer data science Research Experiences for Undergraduates (REU) program at a medium-sized private university located in a large city in the southwest U.S. All nine participants were rising juniors and represented various institutions (see
Table 1 for participant names, demographics, and which social justice project they worked on).
4.2. Research Experience for Undergraduates’ Context
4.2.1. Program Structure and Learning Pathway
The REU program followed a two-phase structure designed to scaffold students’ learning from foundational data science skills to applied social justice research. Phase 1 (11 days) focused on intensive data science instruction through coursework and individual projects. Phase 2 (6 weeks) transitioned students into collaborative, community-partnered research projects where they applied their newly acquired skills to address real-world social justice issues (
Sager et al., 2025).
This progression from individual skill-building to collaborative application aligns with constructivist learning principles, where students first develop foundational competencies before engaging in more complex, socially situated problem-solving. The structure intentionally mirrors professional data science workflows while embedding critical social consciousness through community partnership.
4.2.2. Data Science Course (Phase 1)
All nine participants enrolled in an 11-day introductory data science course with a sequence of data science topics and skills supported throughout the course. The participants learned about a variety of data science topics through both instruction and hands-on individual project work within the introductory course:
Days 1–3: Introduction to data science concepts, Python programming basics, and project topic selection
Days 4–6: Data manipulation, analysis techniques, and intermediate project presentations
Days 7–9: Data visualization methods and storytelling techniques
Day 10: Introduction to artificial intelligence concepts
Day 11: Final project presentations and peer feedback
Students’ culminating individual projects required them to select a topic of personal interest, formulate a research question, locate relevant datasets, and perform comprehensive analysis including data collection, processing, cleaning, analysis, visualization, and interpretation. Each student managed their own GitHub repository and presented a 3–5 min analysis summary.
4.2.3. Food Justice Project (Phase 2)
Following the intensive course, students were divided into three research groups, each partnered with faculty advisors to work on social justice research projects: housing injustices (law lab), food justice (education lab), and liminal cities identification (economics lab). This study focused specifically on the food justice group, which comprised three undergraduate students and a learning sciences lab, comprised of a doctoral candidate, post-doctoral researcher, and professor of learning sciences.
The three students assigned to food justice (Matthew, Justin, and Donald) collaborated with a local urban farm to apply data science practices in visualizing food justice issues. The project emphasized using cutting-edge data visualization software to create compelling representations of complex food systems data. Students participated in bi-weekly research team meetings and weekly community engagement sessions with urban farm members to understand contextual factors that quantitative data alone could not capture.
4.3. Data Collection
Data collection occurred across both phases of the REU program using video recording as the primary method to capture verbal exchanges, collaborative problem-solving, and social dynamics of learning.
Phase 1—Data Science Course: All instructional sessions during the 11-day intensive course were video recorded, yielding 11 recordings totaling approximately 20 h. These documented students’ initial encounters with data science concepts, peer interactions, and instructor feedback.
Phase 2—Food Justice Project: Two types of interactions were recorded for the three food justice students (Matthew, Justin, and Donald). Monday research team meetings were conducted via Zoom (8 sessions, ~1 h each), providing reflective spaces for discussing readings, processing urban farm experiences, and planning data visualizations. Wednesday urban farm visits were recorded in person (9 sessions, ~1 h each), documenting student engagement with community partners and real-time problem-solving as they navigated tensions between quantitative analysis and qualitative understandings of food justice issues.
The video data provided access to collaborative knowledge construction through dialogue and shared activity, aligning with our sociocultural theoretical framework and enabling an analysis of how understanding emerged through social interaction in both academic and community contexts.
4.4. Analytical Framework
Our analysis drew on sociocultural learning theory, specifically mediated action concepts and situated learning theory (
Greeno, 2006;
Lave & Wenger, 1991;
Sawyer & Greeno, 2009). This framework examined how students develop data science expertise through collaborative engagement with instructors, peers, and community partners using mediational tools, emphasizing three principles: (1) learning through participation in authentic activities within communities of practice (
Lave & Wenger, 1991), (2) cultural tools mediating thinking and learning (
Greeno, 2006), and (3) knowledge transfer as practice transformation across contexts rather than simple skill application (
Sawyer & Greeno, 2009).
Mediational Tools’ Analysis: We analyzed how students appropriated data science tools (Python libraries, visualization software, GitHub version 3.8) and conceptual tools (statistical methods, ethical frameworks, storytelling techniques;
Eadie et al., 2019;
Greeno, 2006;
Sawyer & Greeno, 2009;
Watson et al., 2021). We examined instances where students moved from guided tool use to independent appropriation and adapted tools for new purposes, such as modifying visualizations for community-specific communication needs (
Gundlach & Ward, 2021;
Lave & Wenger, 1991;
Pimental et al., 2022;
Wilkerson & Laina, 2018).
Social Interaction Patterns: We examined dialogue patterns focusing on three types of collaborative meaning-making: (a) instructor–student scaffolding through zones of proximal development (
Lave & Wenger, 1991), (b) peer collaboration with complementary expertise (
Vance, 2021), and (c) community partner–student exchanges introducing contextual knowledge (
Jordan & Henderson, 1995;
Wilkerson & Polman, 2020). We identified discourse moves facilitating learning and moments of legitimate peripheral participation (
Lave & Wenger, 1991).
4.5. Data Analysis
Our multi-phase video analysis captured collaborative and developmental learning within our sociocultural framework. All recordings were transcribed verbatim with attention to verbal and non-verbal interactions contributing to collaborative meaning-making (
Jordan & Henderson, 1995).
Phase 1: Practice Identification: An inductive analysis of course videos identified six key data science practices appearing consistently throughout both phases, emerging from actual student engagement rather than predetermined categories.
Phase 2: Codebook Development: We developed a comprehensive codebook (
Table 2) refined through multiple rounds of independent coding until achieving acceptable inter-rater reliability (Cohen’s kappa > 0.80).
Phase 3: Systematic Analysis: We systematically analyzed all recordings, focusing on interactive dialogue rather than one-way instruction. Each conversational turn addressing identified practices received a single code, with new codes assigned when topics shifted (
Creswell & Guetterman, 2019;
Jordan & Henderson, 1995).
Phase 4: Comparative Analysis: Frequency analysis compared practice discussion across formal instruction (Phase 1) and community application (Phase 2) contexts to identify transfer patterns and adaptation needs (
Sawyer & Greeno, 2009).
Phase 5: Qualitative Pattern Analysis: We examined temporal patterns, contextual adaptations, collaborative dynamics, and critical moments where students encountered tensions between academic and community-centered approaches.
Analytical Memos and Triangulation
Throughout the analysis process, research team members maintained detailed analytical memos documenting emerging patterns, theoretical connections, and methodological decisions. These memos served as an audit trail and facilitated triangulation of findings across multiple analysts. We also conducted member checking with participating students to validate our interpretations of key interactions and ensure our analysis accurately represented their experiences. Dialogue was coded when either instructors or students discussed one of the identified practices. A single code was assigned per conversational turn addressing a specific practice, with new codes assigned when topics shifted.
Example 1—Data Wrangling: When a student asked, “How do I merge these two datasets that have different column names?” and the instructor responded with technical guidance, this exchange received one code for “data wrangling”.
Example 2—Data Storytelling: During final presentations, when students explained, “We chose this visualization because it shows community members how food access varies by neighborhood income”, this was coded as “data storytelling”.
Example 3—Data Ethics: When students explained to community partners, “We want to make sure this data doesn’t reinforce stereotypes about low-income communities”, this received a “data ethics” code.
This multi-phase analytical approach enabled us to capture both the breadth of practice engagement across contexts and the depth of how individual practices evolved through social interaction and authentic application.
5. Findings and Discussion
This section examines how data science practices manifested across classroom-based and project-based learning contexts within the REU program. Drawing from our qualitative analysis of approximately 20 h of video recordings, we focus on three practices that revealed the most significant differences between contexts: data ethics, data wrangling, and data storytelling. These practices demonstrated distinct pedagogical patterns that illuminate how authentic, community-engaged projects can deepen students’ understanding of data science as both technical skill and social practice.
Our analysis revealed that while students engaged with these practices in both contexts, the quality and depth of engagement differed markedly. The classroom context provided foundational technical skills but often lacked real-world application, while the food justice project enabled students to develop a more sophisticated understanding of data science’s social dimensions and ethical implications.
5.1. Overview of Data Science Practice Frequencies
Before examining the three focal practices in detail, we provide a brief overview of all six practices identified in our analysis (
Table 3). These counts demonstrate that students engaged with key data science practices in both contexts, but with varying frequencies across contexts and across practices.
These frequencies reveal initial patterns: practices like “understanding the problem” and “data storytelling” were more prominent in the project context, while technical practices like “data exploration” and “data wrangling” appeared more frequently in the course. However, as our detailed analysis below demonstrates, frequency alone does not capture the qualitative differences in how these practices developed.
5.2. Data Ethics
Data ethics emerged as perhaps the most revealing practice for understanding differences between contexts. In the classroom, ethics remained largely theoretical and abstract, while the food justice project required students to navigate concrete ethical dilemmas in real time.
5.2.1. Classroom Context: Algorithmic Bias as Academic Exercise
In the data science course, ethical discussions centered on Hannah
Fry’s (
2018)
Hello World, particularly the chapter on algorithmic bias in criminal justice. The following exchange illustrates the theoretical nature of these discussions:
Kayla: “She [the author] explores the flaws of the [justice] system… and how with the human judge, there were inconsistencies, but with the algorithm, there’s a lot of bias and potential for error, so she essentially explains how complicated algorithms can be in relation to justice, and advocates that… neither the human system nor the algorithm system can be completely ignored or written off”.
Sadie: “They go over the algorithms, and they did a study which found they are more likely to harshly punish African American people than White people. That’s kind of the issue with these algorithms and why people are not jumping on using this, even though there are a lot of inconsistencies with human judges”.
Instructor: “Would you rather have your sentence decided by an algorithm or a judge?”
George: “I would have to say a judge, because one of the anecdotes in there, this guy, his sentence was decided by a questionnaire he took before the trial or something like that. That’s just weird that his answers to a random question decided how they scaled his risk to recommit a crime”.
This exchange demonstrates a sophisticated understanding of algorithmic bias as an abstract concept. Students could articulate the trade-offs between human and algorithmic decision-making and recognized the complexities of bias in both systems. However, their engagement remained hypothetical—they were analyzing someone else’s research about distant systems rather than confronting ethical dilemmas in their own work.
5.2.2. Project Context: Navigating Representation and Community Impact
In the food justice project, ethical considerations emerged organically from the students’ research process. Rather than discussing abstract scenarios, they grappled with how their data analysis might affect the real partner communities. This exchange between Donald and the postdoctoral mentor illustrates this shift:
Donald: “What I’m interested in is our ability to find what an urban farm can do for a community. What we mean by do for a community… like it’s hard to quantify community togetherness, but if that’s what we are trying to figure out through like talking to people to find food deserts, and if any urban farms have been implemented there, and if there are any datasets around those. But I’m interested where urban farms are currently and the before and aftereffects, and if someone has looked at that before”.
Mentor: “There will be a lot of ethical things to think through about, like there is data that is easy to get, data that we can create, and there’s data that can’t be quantified, and what happens when you tell a story from picking from a few of these categories? We always have to pick, we can’t just show everything, obviously. But that’s the nuance of data science and the ethical piece that often gets lost”.
This conversation reveals a fundamentally different approach to ethics. Instead of debating abstract scenarios, students confronted the ethical implications of their own analytical choices. They wrestled with questions of representation: How do you quantify “community togetherness”? What stories get told when you emphasize certain data over others? How might labeling an area as a “food desert” affect residents’ perceptions of their own community?
The mentor’s observation about “data that can’t be quantified” pushed students to consider the limitations of their tools and the potential consequences of their framing choices. This represents a more sophisticated understanding of data ethics—not as a set of rules to follow, but as an ongoing process of reflexive decision-making about power, representation, and impact.
5.2.3. Discussion: Data Ethics as Apprenticeship vs. Academic Exercise
The contrast between contexts reveals important pedagogical insights about how students develop ethical reasoning in data science. The classroom discussions, while intellectually rigorous, remained detached from students’ immediate experiences. They could analyze bias in criminal justice algorithms but did not necessarily transfer that critical lens to their own analytical work.
The project context, by contrast, made ethics personally relevant and practically urgent. Students could not simply discuss ethical principles in abstract terms—they had to apply them to their own research decisions. This created what we might call “ethical apprenticeship”, where students learned to navigate ethical dilemmas through guided practice rather than theoretical study alone.
This finding aligns with situated learning theory, which suggests that knowledge develops most effectively when embedded within authentic practice contexts (
Lave & Wenger, 1991). The food justice project provided “authentic activity”—work that mirrors the complexity and ambiguity of professional practice (
Avila et al., 2025). These results support calls for more humanistic approaches to data science education that emphasize critical thinking about power, representation, and social impact alongside technical skill development (
Lee et al., 2021;
Louie, 2022), particularly through community-engaged projects that require students to navigate ethical dimensions in real time (
Avila et al., 2025;
Reigh et al., 2022).
5.3. Data Wrangling
Data wrangling—the process of cleaning, transforming, and preparing data for analysis—revealed another significant difference between contexts. While both environments required technical skills, the project context embedded these skills within meaningful social and spatial contexts.
5.3.1. Classroom Context: Scaffolded Technical Development
In the data science course, data wrangling followed a carefully structured progression. The instructor provided formative assessments that guided students through standardized cleaning and transformation processes. Students demonstrated technical proficiency across core skills: identifying and correcting errors, managing missing values, removing duplicates, and writing scripts to automate processes.
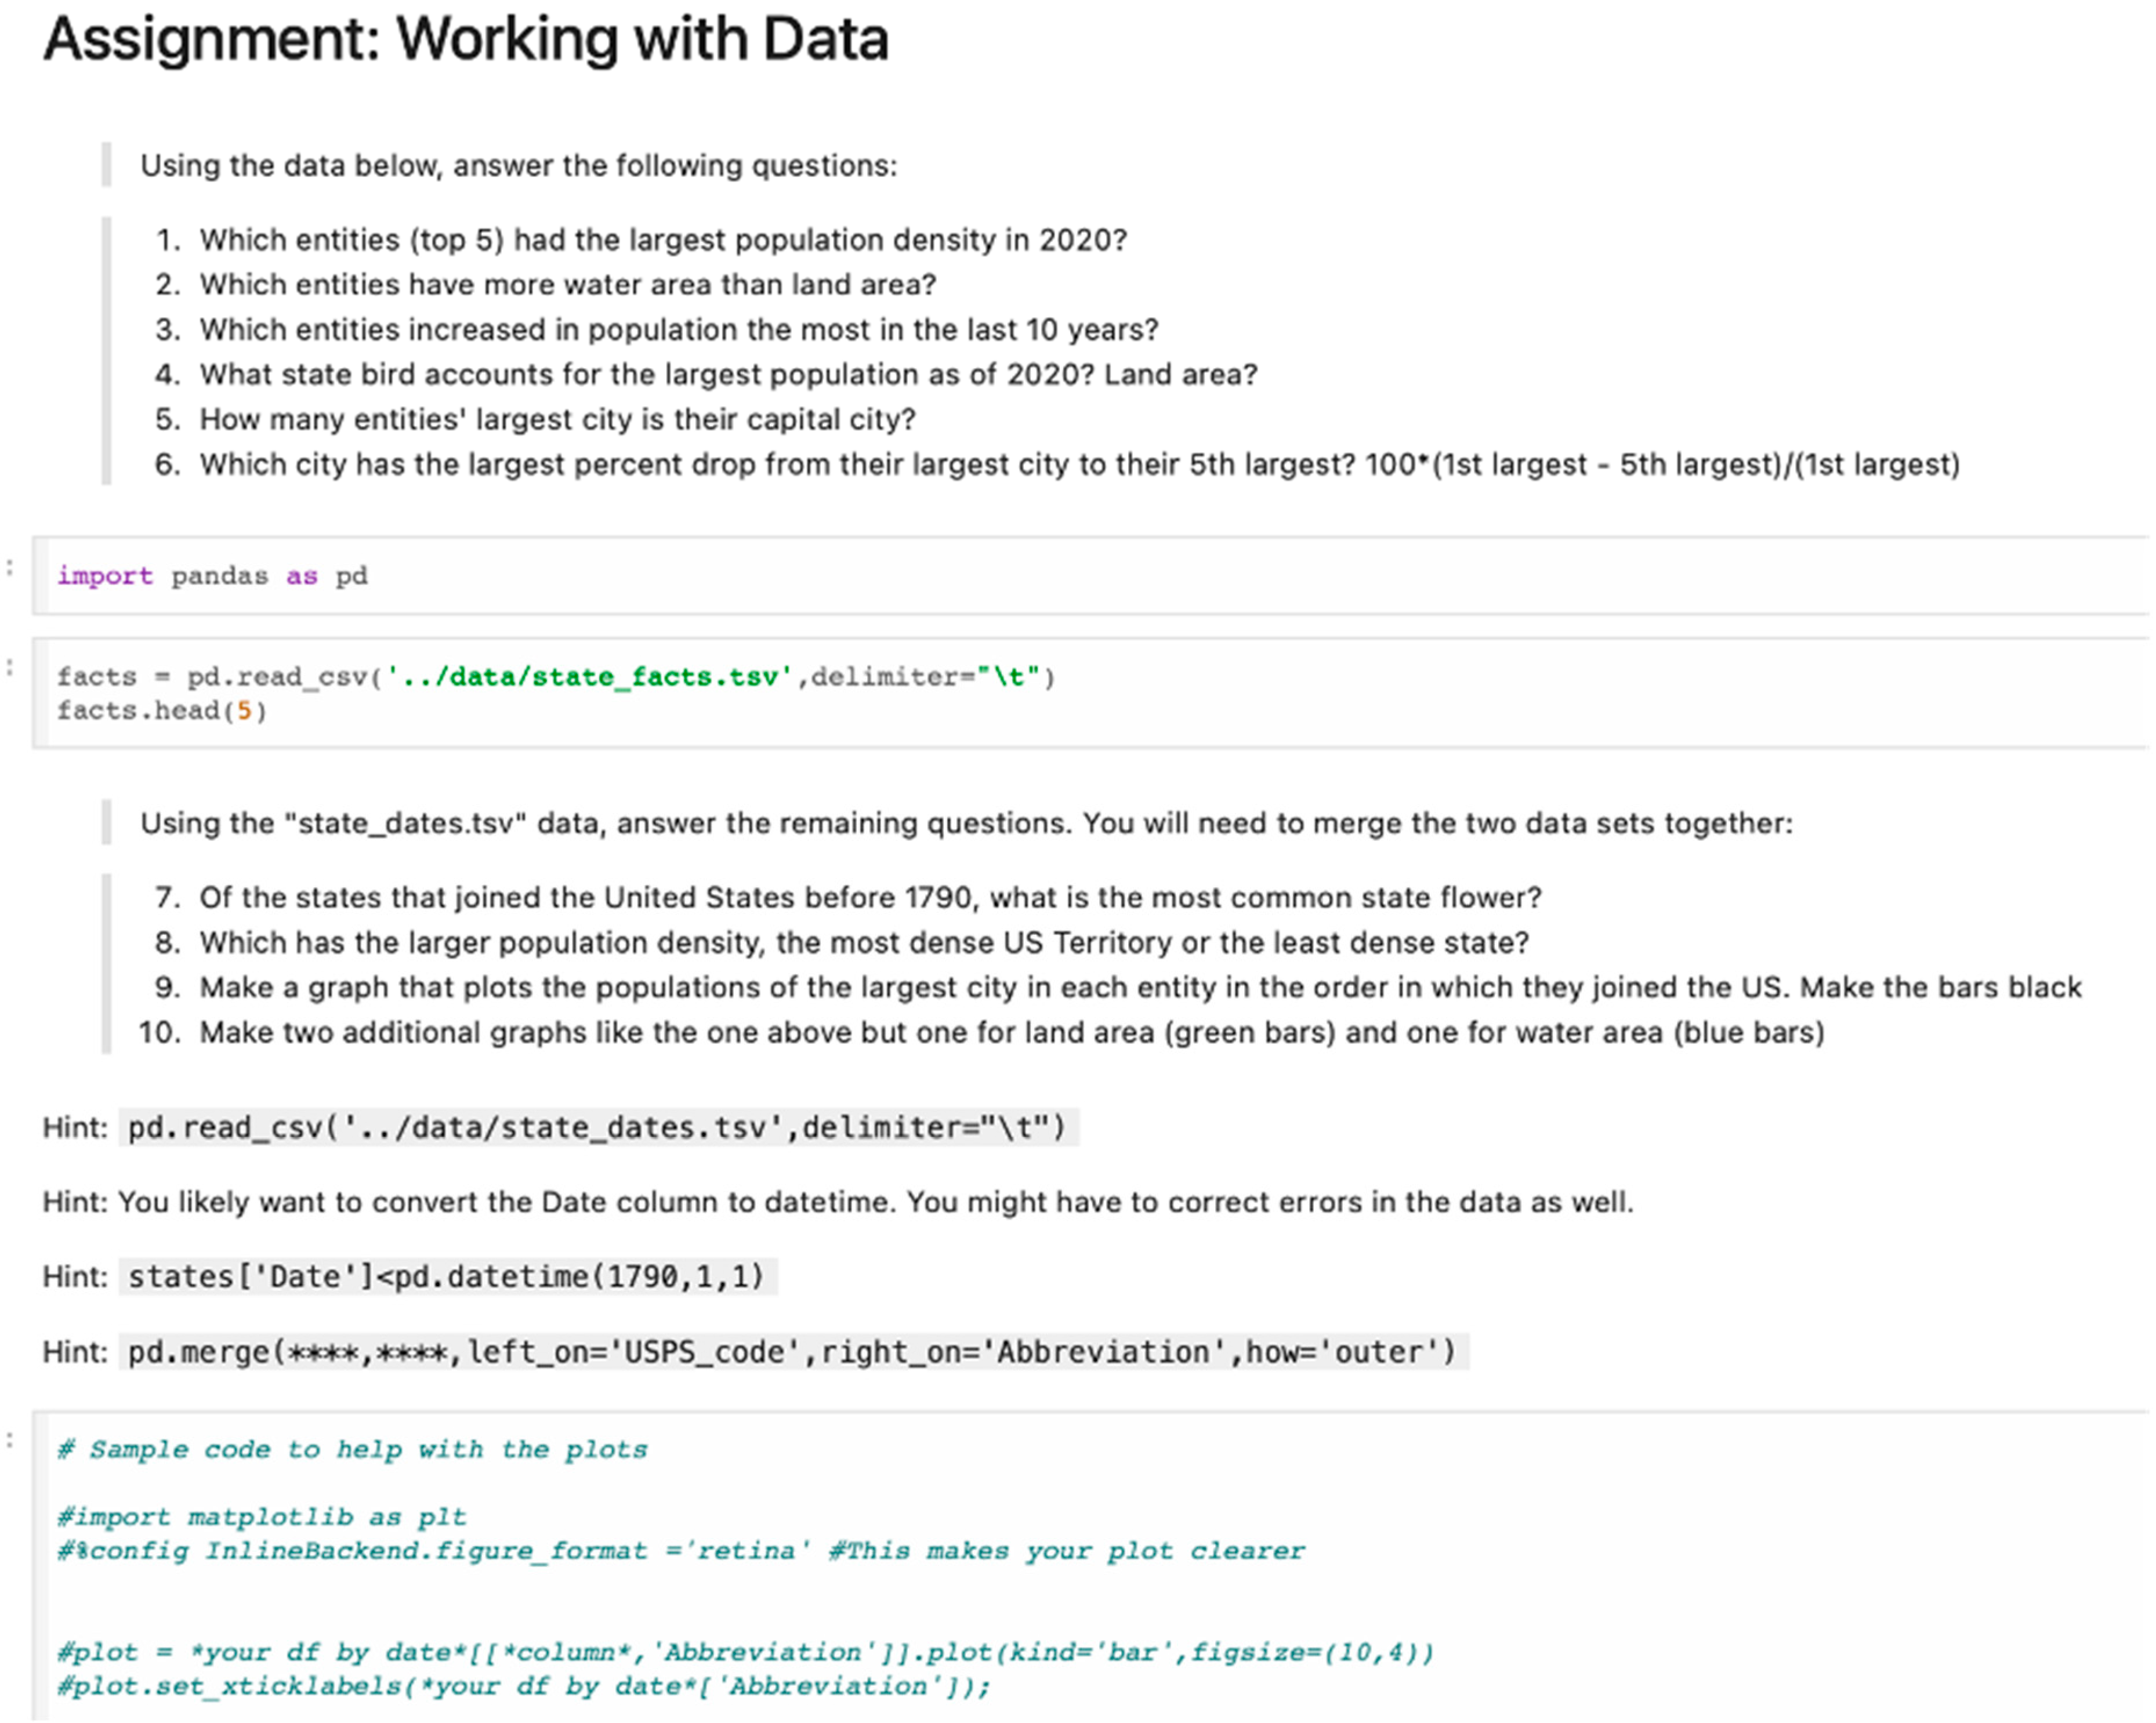
The data wrangling assignment demonstrated careful pedagogical structuring, moving students through increasingly complex data manipulation tasks from basic pandas operations in Python to multi-dataset merging and visualization (see
Figure 1). The instructor provided specific technical guidance through hints (such as merge syntax and datetime conversion) that supported students without completing the work for them, reflecting step-by-step skill building with individual check-ins (e.g., the asterisks represent a scaffold to help the students successfully complete the merge syntax, without providing which columns should be merged). This scaffolding proved effective for developing technical competence—students successfully completed assigned tasks and demonstrated proficiency in essential data manipulation techniques such as data cleaning, transformation, and script writing. However, their work remained largely divorced from meaningful context. Students could clean datasets effectively but often lacked understanding of why particular cleaning decisions mattered for analysis or interpretation.
5.3.2. Project Context: Complex Decision-Making with Social Implications
In the food justice project, data wrangling became an exercise in complex decision-making with clear social implications. Rather than following prescribed steps, students had to make judgment calls about how to represent communities and spatial relationships. This exchange between Matthew and Robin illustrates this complexity:
Matthew: “So these ones are just seeing which [census] tracts were like the entire Dallas Metroplex and this one is also a little more scattered… Something I did notice on a similar graph to this one, is that we just filtered the tracts that were below the state of Texas’ [median income]. There weren’t that many tracts in Dallas that were below [the county’s median]”.
Robin: “What was the median income?”
Matthew: “Yeah, so the median for this graph was around $70k, which is pretty high. For the median for the state of Texas was closer to $30k”.
Robin: “As odd as that sounds, that actually makes sense. In that aspect, I really feel we should run with Texas, and the reason being is Dallas alone has a lot of rich neighborhoods”.
This exchange reveals data wrangling as interpretive work requiring deep contextual knowledge. The students were not simply applying technical procedures—they were making analytical decisions about how to define “low income” in ways that would accurately represent local conditions. Their choice between state and county median income thresholds was not merely technical; it was interpretive, with implications for how they would characterize food access inequities.
The conversation also demonstrates how data wrangling in authentic contexts requires spatial and social literacy. Students had to understand local geography (“Dallas alone has a lot of rich neighborhoods”) and consider how their analytical choices might misrepresent or accurately capture community realities.
5.3.3. Discussion: Technical Proficiency vs. Analytical Judgment
The comparison between contexts reveals a crucial distinction between technical proficiency and analytical judgment in data wrangling. The classroom context successfully developed students’ technical skills—they could execute cleaning and transformation procedures effectively. However, these skills remained largely procedural, disconnected from the interpretive dimensions of data preparation.
The project context, by contrast, revealed data wrangling as fundamentally interpretive work. Students had to understand not just how to clean and transform data but why particular choices mattered for representing social realities. This shift from procedural to interpretive understanding represents a significant development in data science thinking.
This finding resonates with concepts of reflection-in-action, where professionals develop expertise by thinking critically about their practice while engaged in it (
Sawyer & Greeno, 2009). The project context required students to reflect on their analytical choices in real time, considering how technical decisions would affect their representation of community conditions. This supports research suggesting that data science learning should integrate contextual knowledge from the beginning rather than treating technical skills and social awareness as separate components (
Bargagliotti et al., 2020;
Lee et al., 2021). The results demonstrate that authentic contexts are essential for developing the analytical judgment that distinguishes expert from novice data science practice (
Greeno, 2006).
5.4. Data Storytelling
Data storytelling—the practice of using visualizations and narrative to communicate analytical insights—showed perhaps the most dramatic differences between contexts. The classroom context emphasized technical visualization skills, while the project context developed students’ ability to craft persuasive narratives for specific audiences.
5.4.1. Classroom Context: Technical Visualization Without Narrative Context
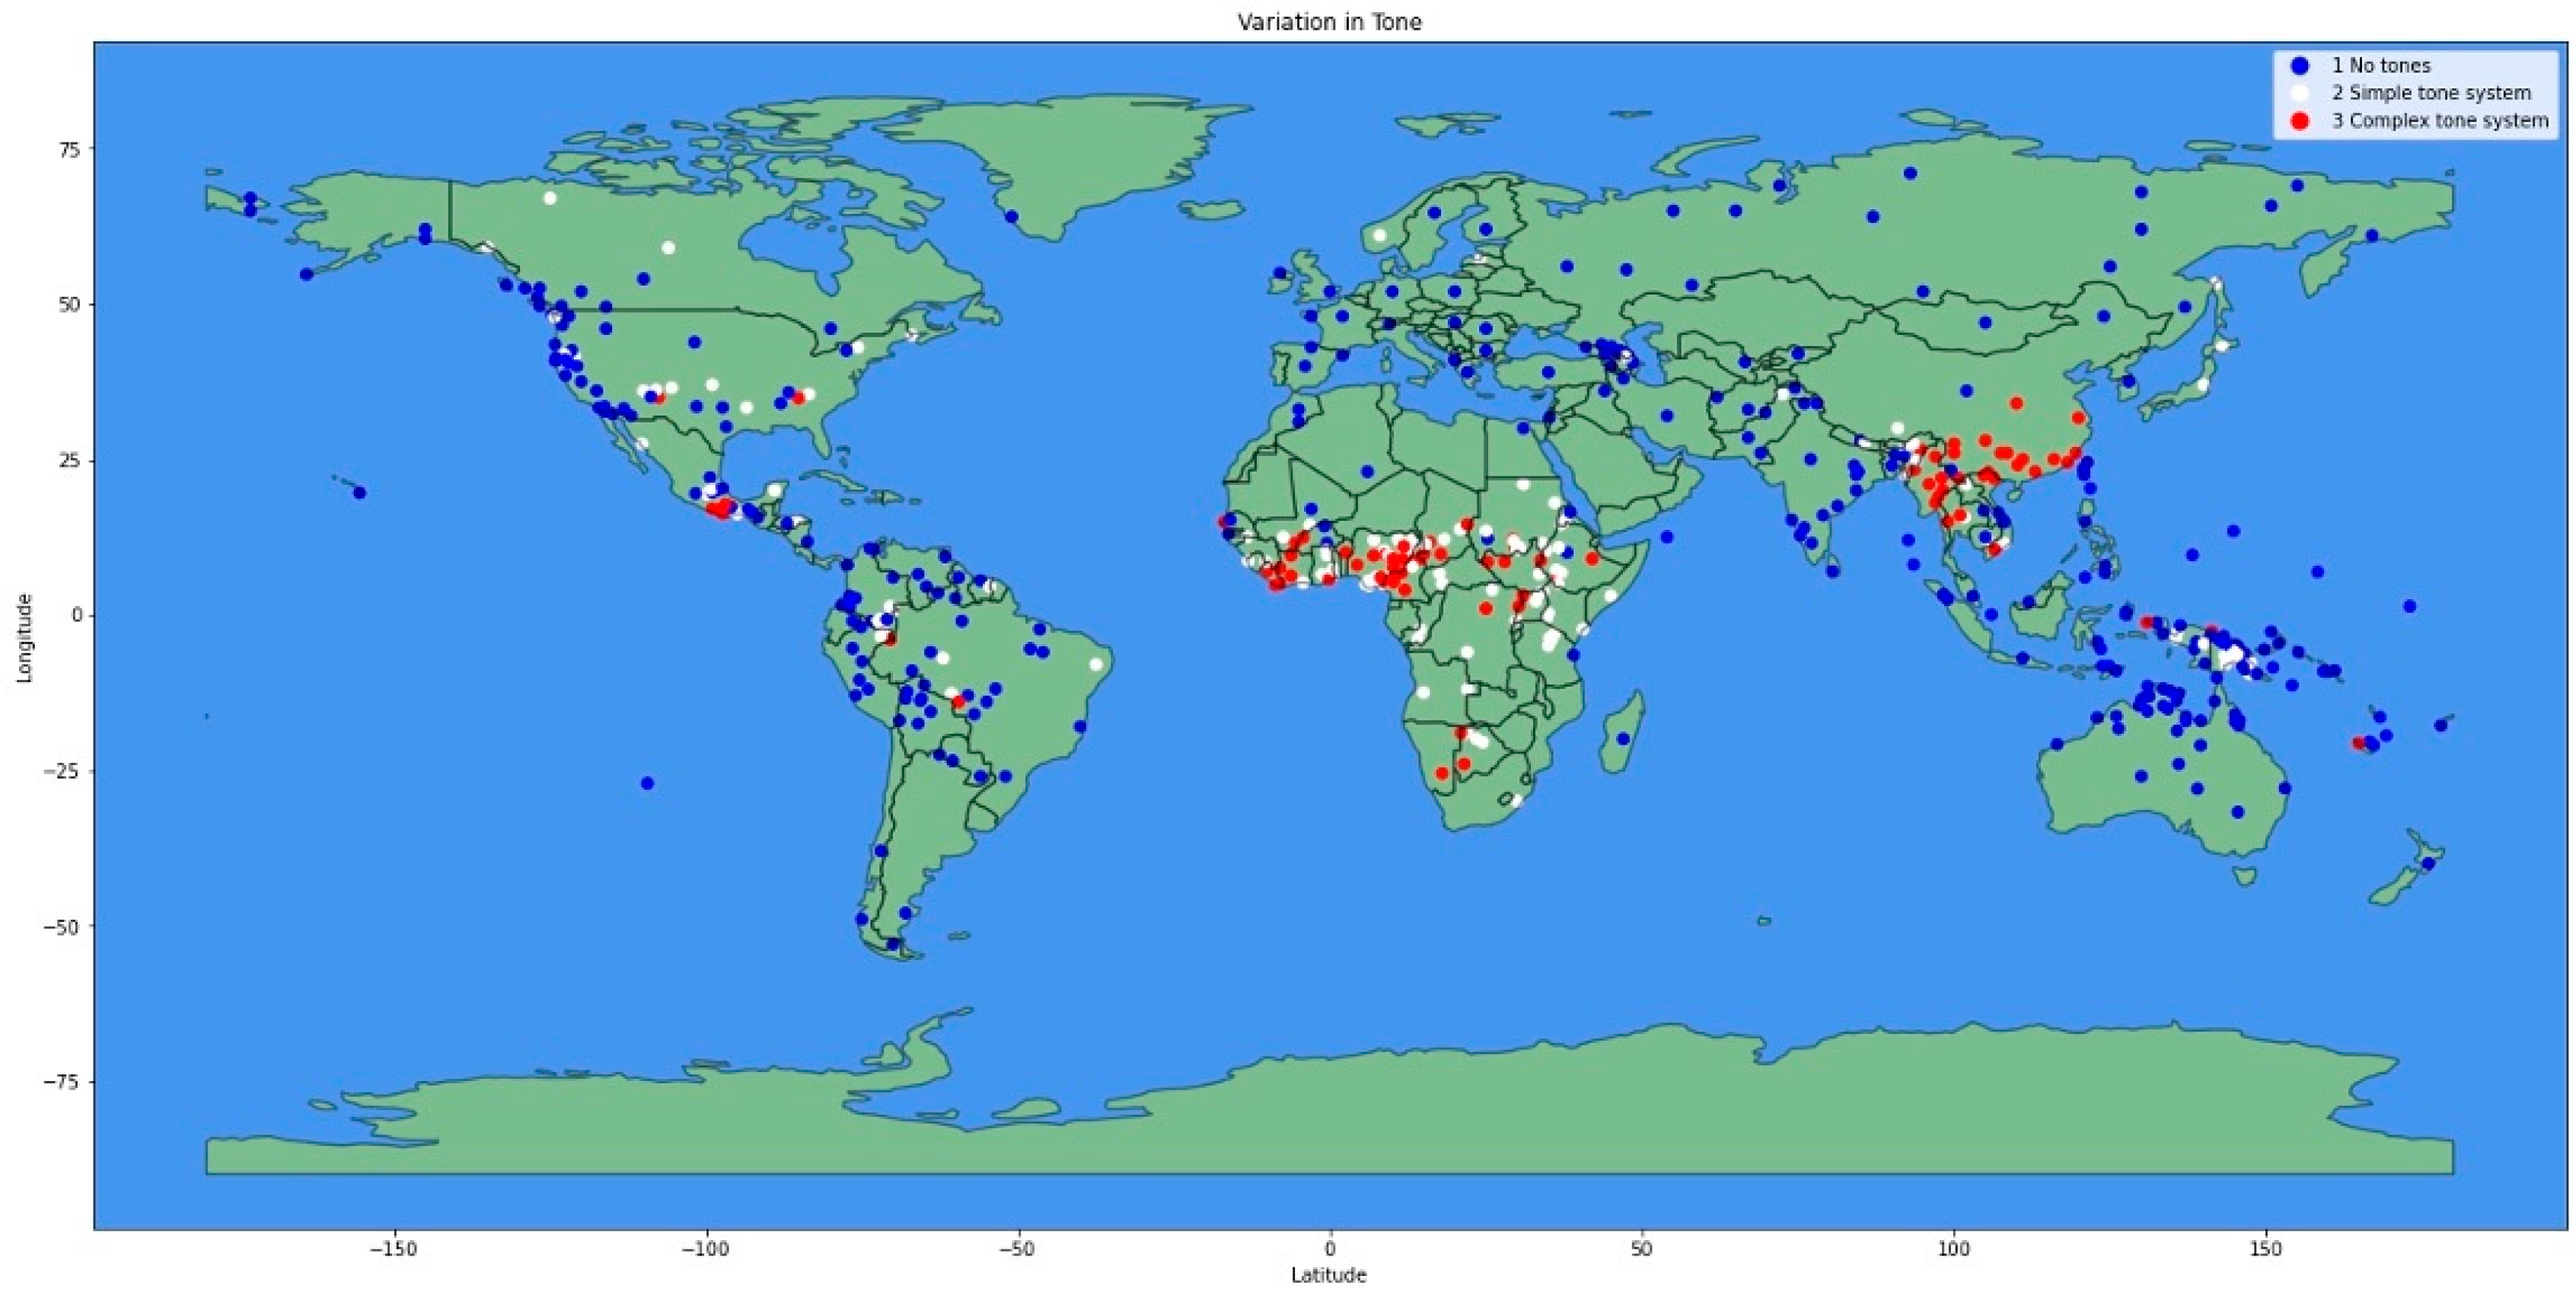
In the data science course, data storytelling focused primarily on technical visualization skills. Justin’s linguistic analysis project exemplifies this approach. Working with the World Atlas of Language Structures database, he created sophisticated geographic visualizations of linguistic features across global languages (see
Figure 2). His technical execution was impressive—he successfully cleaned data, created GeoDataFrames, merged datasets, and produced publication-quality maps showing tonal variation by region.
However, Justin’s analysis lacked meaningful narrative context. While he could describe his technical procedures in detail, he provided no explanation of why this analysis mattered or what insights it might offer about language, culture, or society. His conclusion merely noted that “linguistic variation is a rich research area that mirrors the diversity of human cultures”, without connecting his specific findings to broader questions or implications. This pattern—technical proficiency without narrative purpose—characterized much of the classroom-based data storytelling. Students could create visualizations effectively but struggled to embed them within compelling stories about why their analysis mattered.
5.4.2. Project Context: Audience-Centered Narrative Construction
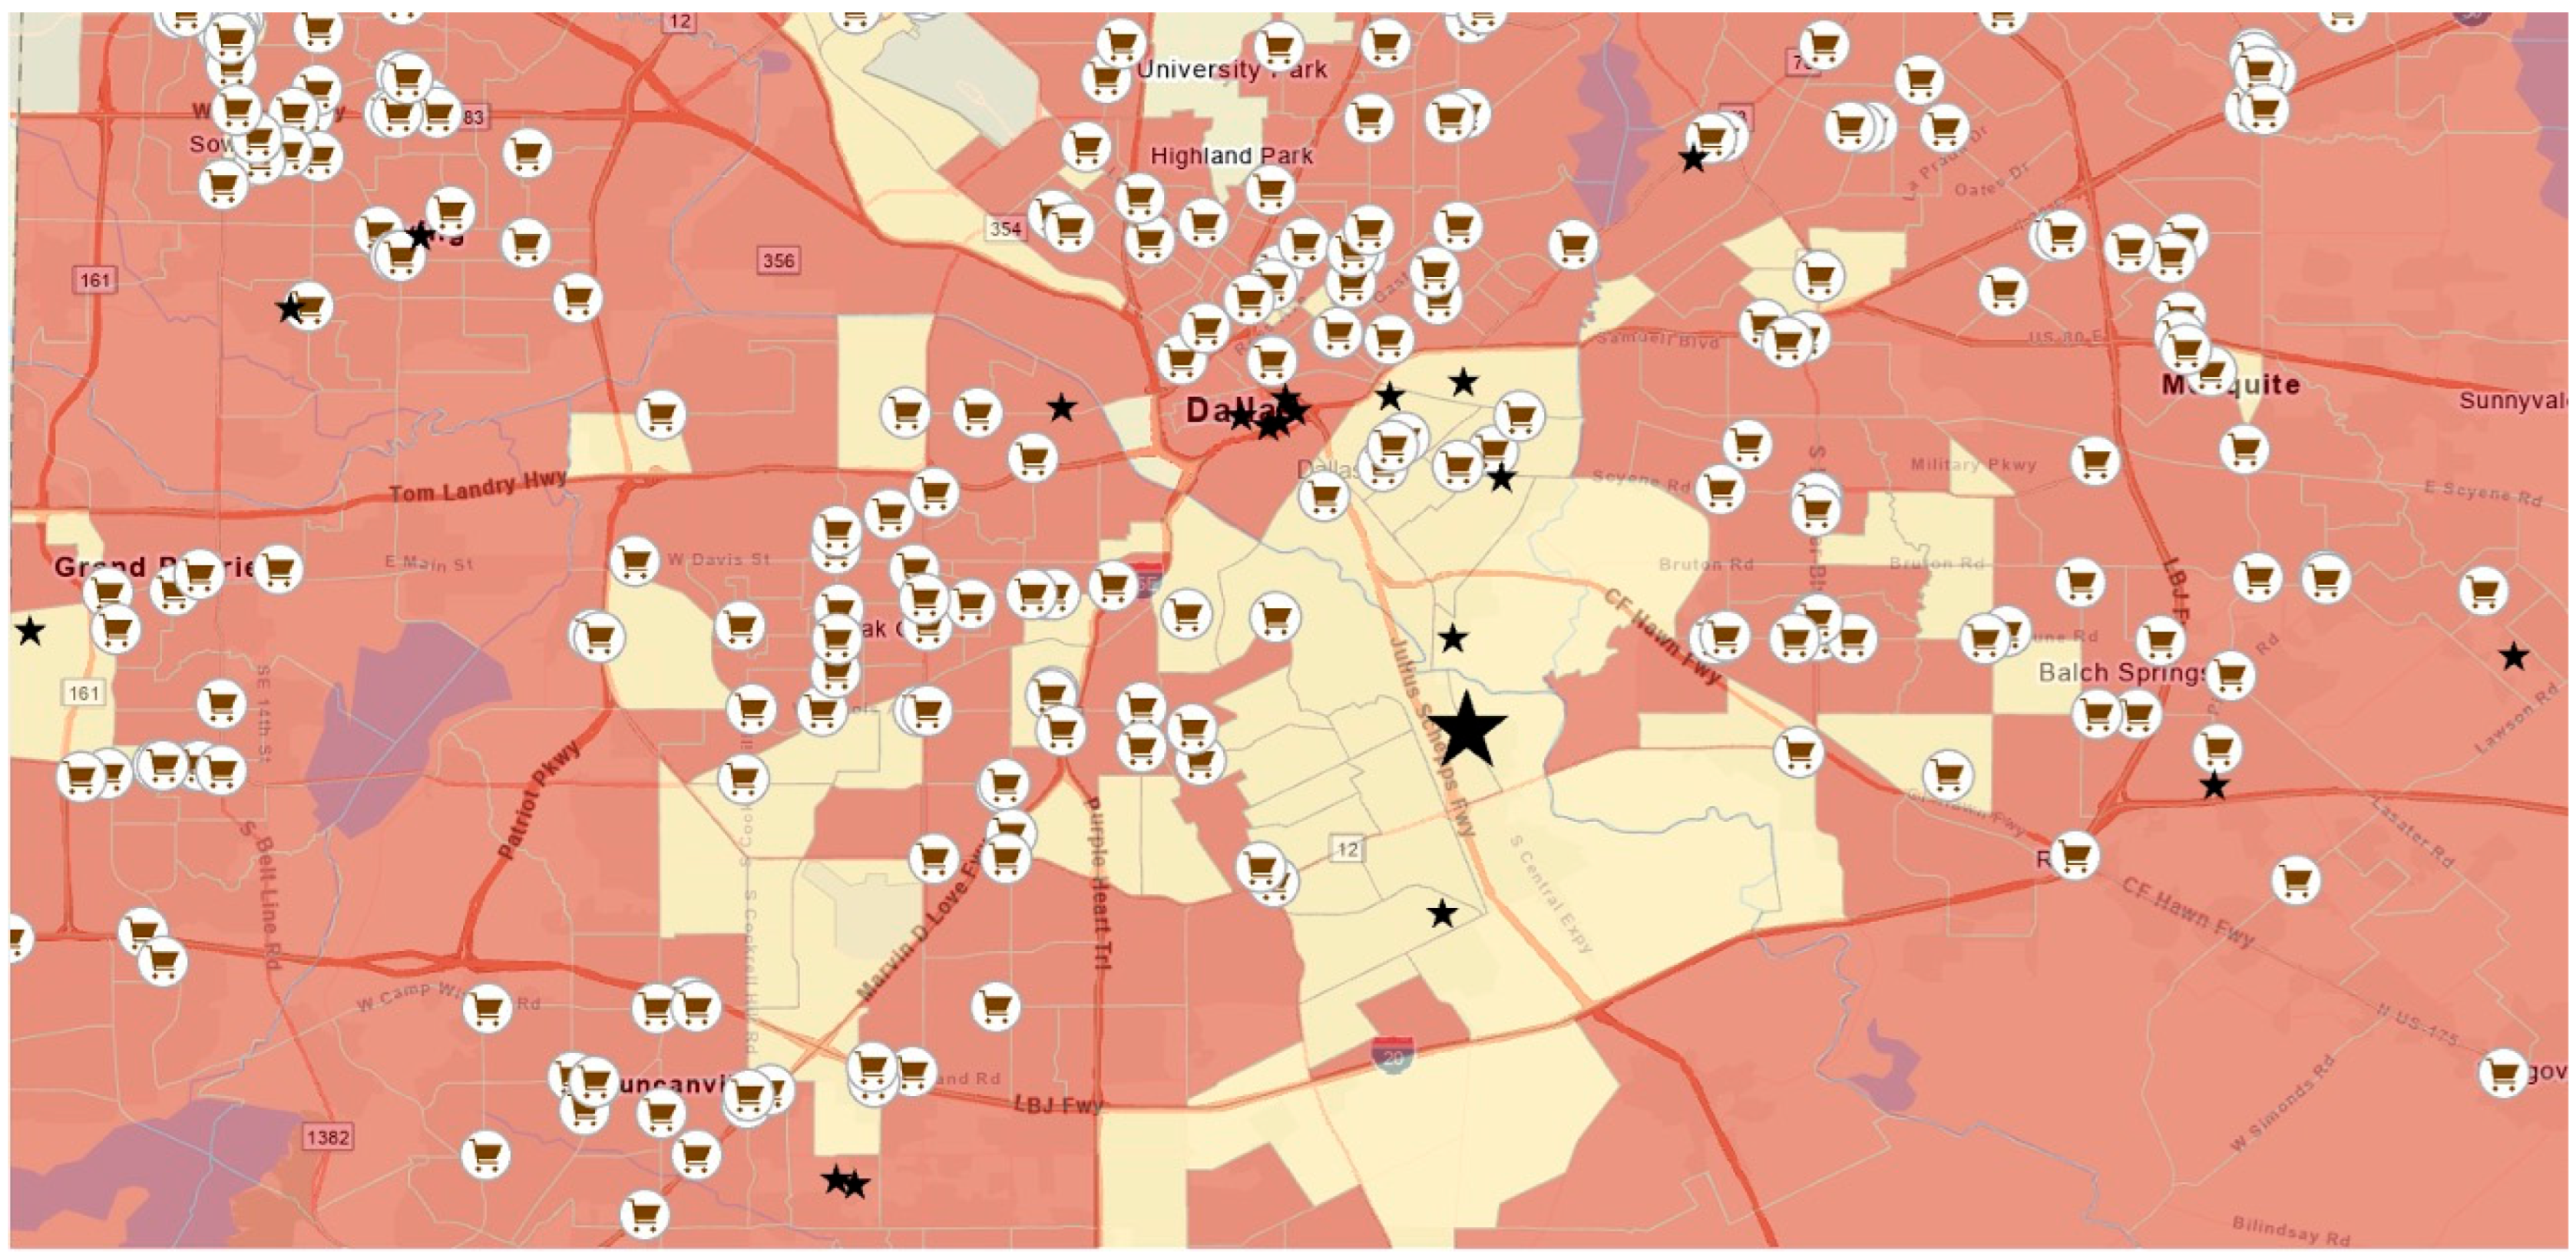
The food justice project required students to craft their data story for a specific audience—the farm director and community members—with clear stakes and implications. Their presentation to the farm director demonstrated sophisticated audience awareness and narrative construction (see
Figure 3 for the student’s produced visualization):
Justin: “So, all of these dots are all SNAP-eligible grocery stores in the area. It looks like there’s a lot of grocery stores and they can serve the needs of everyone. But then we went through the data. And we found that a lot of these grocery stores are actually convenience stores, liquor stores, 99 cent stores. After getting rid of a lot of those stores that don’t sell fresh produce, we were left with just these. You can see… there’s just an immense gap here between grocery stores”.
This excerpt reveals sophisticated rhetorical awareness. Justin began by acknowledging the surface-level appearance (“It looks like there’s a lot of grocery stores”) before revealing the deeper reality (“we found that a lot of these grocery stores are actually convenience stores”). This narrative structure—apparent abundance masking actual scarcity—creates a compelling story arc that helps the audience understand both the analytical process and its implications.
Matthew continued this narrative by layering additional evidence:
Matthew: “Essentially, we wanted to graph income and mobility in Dallas County to zone in on the South Dallas community… We found that area is the lowest income area in Dallas County. And then then we wanted to look at mobility, so the percentage of households with vehicle access, we noticed that there is like a lighter area here. That’s pretty much the same spot. And so, that’s a big problem. And, you have lower income, and then you have lower access to vehicles, then with those being two of the biggest variables with food access it would say getting to food would be a difficulty”.
Matthew’s explanation demonstrates how effective data storytelling builds cumulative evidence toward a clear conclusion. He did not simply present isolated visualizations—he constructed a logical argument showing how multiple factors (income, vehicle access, grocery store proximity) converge to create food access challenges.
The impact of this narrative approach was evident in the farm director’s response: “I’m blown away. I knew it was bad, but not this bad”. This reaction suggests that the students had successfully translated their technical analysis into a compelling story that expanded the audience’s understanding of local conditions.
5.4.3. Discussion: Technical Skills vs. Communicative Purpose
The contrast between contexts reveals data storytelling as involving both technical and rhetorical dimensions. The classroom context successfully developed students’ technical visualization skills but provided limited opportunities to develop communicative purpose or audience awareness.
The project context, by contrast, required students to understand data storytelling as persuasive communication. They had to consider not just what their data showed, but how to present them in ways that would resonate with specific audiences and support particular arguments or actions. This shift from technical demonstration to persuasive communication represents a crucial development in data science practice.
This transformation reflects the rhetorical nature of scientific communication—the understanding that scientific knowledge is not simply transmitted but constructed through communicative acts that must be tailored to specific audiences and purposes (
Stornaiuolo, 2020). The findings align with calls for data science education that emphasizes communication skills alongside technical competencies (
Donoghue et al., 2021;
NASEM, 2018) and demonstrate that authentic audiences and community partnerships are pedagogically essential for developing sophisticated data science thinking (
Reigh et al., 2022;
Rosenberg et al., 2020). The presence of real stakeholders creates the complexity necessary for students to understand data analysis as both technical and social work.
5.5. Synthesis: Integrated Themes Across Data Science Practices
Our analysis of these three practices reveals several cross-cutting themes with important implications for understanding how students develop data science expertise across different learning contexts. Rather than treating these as separate findings, we synthesize the key insights that emerged across data ethics, data wrangling, and data storytelling.
5.5.1. From Procedural to Interpretive Understanding
Across all three practices, we observed a fundamental shift from procedural to interpretive understanding when students moved from classroom to project contexts. In the classroom, students could execute technical procedures effectively but often lacked any understanding of why particular choices mattered for analysis or interpretation. The project context required them to understand their technical work as interpretive and consequential—whether choosing income thresholds for defining food access, navigating ethical implications of community representation, or crafting narratives for specific audiences.
This pattern aligns with research on expertise development suggesting that novices begin with rule-following behavior but develop expertise through engagement with complex, authentic problems requiring judgment and interpretation (
Greeno, 2006;
Sawyer & Greeno, 2009). The project context provided the complexity necessary for students to develop interpretive capabilities that distinguish expert from novice practice.
5.5.2. Technical and Social Dimensions as Integrated Practice
Perhaps most significantly, our analysis demonstrates that technical and social dimensions of data science are not separate domains but deeply intertwined aspects of practice. Students in the project context could not make purely technical decisions—every analytical choice had social implications requiring consideration. This integration was evident across all three practices: ethical reasoning emerged from technical choices, data wrangling required social and spatial literacy, and storytelling demanded an understanding of audience and community impact.
This integration of technical and social dimensions challenges common approaches to data science education that treat technical skills and social awareness as separate components (
Bargagliotti et al., 2020;
Lee et al., 2021;
Louie, 2022). Our findings suggest that students develop more sophisticated understanding when they encounter technical and social dimensions as integrated aspects of authentic practice rather than separate curricular elements, supporting calls for more humanistic approaches to data science education (
Lee et al., 2021;
Louie, 2022;
Stornaiuolo, 2020).
5.5.3. The Transformative Role of Authentic Audiences and Community Engagement
The presence of authentic audiences (community members, farm directors, and other stakeholders) fundamentally transformed how students approached data science practices. Rather than completing assignments for instructor evaluation, they had to communicate with people who had genuine investment in their findings (
Avila et al., 2025). This shift created natural motivation for more sophisticated ethical reasoning, analytical judgment, and communicative purpose across all three focal practices.
6. Limitations
This study provides valuable insights into how undergraduate students engage with data science in the context of a social justice project. However, several limitations should be acknowledged. First, while the small sample size of nine participants limits broad generalizability, it enabled a deep, nuanced analysis of individual student experiences that larger studies might miss. While the study offers in-depth insights into this specific group of undergraduate students, these detailed findings provide a foundation for understanding similar contexts and can inform future comparative studies across diverse populations. Additionally, the intensive 11-day format, while brief, provided a concentrated learning experience that allowed for the detailed observation of students’ real-time engagement and immediate responses to data science concepts. This focused timeframe offers insights into initial engagement patterns and immediate learning processes, establishing a baseline for understanding how students first encounter and respond to data science concepts.
In addition, students’ prior knowledge and skills in data science were not assessed at the beginning of the program. While baseline data would strengthen causal attributions, the study was designed to capture authentic learning processes as they naturally unfold, providing insights into how students engage with new concepts without the potential bias of pre-assessment priming. This approach, while limiting quantitative progress measures, allows for the observation of organic learning processes and reveals how students with diverse backgrounds naturally engage with data science concepts.
Finally, the case study design provides rich, contextual insights that, while specific to this setting, offer detailed understanding that can inform similar programs and contribute to the broader literature on data science education in social justice contexts. The unique context of the study—conducted at a medium-sized private university in a large southwestern U.S. city—may not reflect the experiences of students in other educational settings or geographic locations. Despite these limitations, the study offers meaningful contributions to understanding how data science education can be integrated with social justice initiatives, highlighting the potential for further research in this area.
7. Missed Opportunities and Recommendations for Course Design
In data science education, meaningful partnerships with communities are pivotal for enriching student learning experiences. These collaborations provide authentic contexts that enhance students’ grasp of complex problems and enable them to interpret data with greater depth (
Avila et al., 2025;
Lee et al., 2021). By engaging with community stakeholders, students confront real-world data scenarios and refine their ability to communicate findings effectively to diverse audiences. This approach bridges the gap between theoretical knowledge and practical application, preparing students to tackle real-world data science challenges (
Greeno, 2006;
NASEM, 2018,
2022).
To enrich students’ educational experiences and better prepare them for impactful careers, course designs should be enhanced to include community partnerships and social justice elements (
Avila et al., 2025;
Lee et al., 2021;
NASEM, 2018,
2022). This holistic approach not only improves technical proficiency but also cultivates critical thinking and ethical decision-making skills (
Greeno, 2006;
Lee et al., 2021). Future research should focus on expanding the integration of these instructional strategies into K-12 and informal learning environments, supported by ongoing dialogue to address emerging challenges and opportunities in the field (
NASEM, 2018,
2022;
Wilkerson & Polman, 2020). To address this gap, educators should integrate community partnerships into coursework, leveraging the existing literature and best practices that highlight the advantages of such collaborations (
NASEM, 2018,
2022). This integration not only imparts technical skills but also fosters students’ abilities to analyze data within meaningful contexts (
Lee et al., 2021).
Additionally, incorporating case studies and discussions that focus on the societal implications of data science can help students appreciate the broader context of their work and understand how data-driven decisions affect communities (
Avila et al., 2025;
NASEM, 2022). Analyzing grocery store accessibility and socio-economic factors in a local community, for instance, demonstrates how detailed case studies can offer students a richer understanding of data’s real-world relevance (
Wilkerson & Polman, 2020). Emphasizing data science for social justice is also crucial; integrating projects that explore the human dimensions of data can boost students’ engagement and awareness of the ethical and social implications of their work (
Greeno, 2006;
Lee et al., 2021). The food justice project shows how focusing on social justice topics has the potential to inspire students to use data science for positive community impact (
Bargagliotti et al., 2020;
NASEM, 2018). Finally, developing and incorporating instructional sequences that cover primary data science practices ensures that students acquire comprehensive skills in data exploration, wrangling, and storytelling, preparing them for a variety of analytical challenges (
NASEM, 2018,
2022;
Yoon et al., 2019).
Author Contributions
Conceptualization, M.T.S.; methodology, M.T.S.; formal analysis, M.T.S. and J.R.W.; writing—original draft preparation, M.T.S.; writing—review and editing, M.T.S., J.R.W. and A.J.P. All authors have read and agreed to the published version of the manuscript.
Funding
This material is based upon work supported by the National Science Foundation (Award Number SBE 2150505). Any opinions, findings, and conclusions or recommendations expressed in this material are those of the author(s) and do not necessarily reflect the views of the National Science Foundation.
Institutional Review Board Statement
The study was conducted in accordance with the Institutional Review Board of Southern Methodist University (23-136 and approved on 7 July 2023).
Informed Consent Statement
Informed consent was obtained from all subjects involved in the study.
Data Availability Statement
The datasets generated during and/or analyzed during the current study are not publicly available to protect the participants’ identities but are available from the corresponding authors on reasonable request.
Conflicts of Interest
The authors declare no conflicts of interest.
References
- Asamoah, D., Doran, D., & Schiller, S. Z. (2015). Teaching the foundations of data science: An interdisciplinary approach. arXiv, arXiv:1512.04456. [Google Scholar]
- Avila, A., Ayiah, M., Stavely, J., Sager, M. T., Sherard, M. K., & Petrosino, A. J. (2025). Mapping food justice: Urban farms and the quest for equitable food access. SMU Journal of Undergraduate Research, 9(1), 1–8. [Google Scholar]
- Bargagliotti, A., Binder, W., Blakesley, L., Eusufzai, Z., Fitzpatrick, B., Ford, M., Huchting, K., Larson, S., Miric, N., Rovetti, R., Seal, K., & Zachariah, T. (2020). Undergraduate learning outcomes for achieving data acumen. Journal of Statistics Education, 28(2), 197–211. [Google Scholar] [CrossRef]
- Baumer, B. S., Garcia, R. L., Kim, A. Y., Kinnaird, K. M., & Ott, M. Q. (2022). Integrating data science ethics into an undergraduate major: A case study. Journal of Statistics and Data Science Education, 30(1), 15–28. [Google Scholar] [CrossRef]
- Ben-Zvi, D., & Ben-Arush, T. (2014). EDA instrumented learning with TinkerPlots. In T. Wassong, D. Frischemeier, P. R. Fischer, R. Hochmuth, & P. Bender (Eds.), Using tools for learning mathematics and statistics (pp. 193–208). Springer Spektrum. [Google Scholar]
- Burckhardt, P., Nugent, R., & Genovese, C. R. (2021). Teaching statistical concepts and modern data analysis with a computing-integrated learning environment. Journal of Statistics and Data Science Education, 29(1), 61–73. [Google Scholar]
- Creswell, J. W., & Guetterman, T. C. (2019). Educational research: Planning, conducting, and evaluating quantitative and qualitative research (6th ed.). Pearson. [Google Scholar]
- Donoghue, T., Voytek, B., & Ellis, S. E. (2021). Teaching creative and practical data science at scale. Journal of Statistics and Data Science Education, 29(1), 27–39. [Google Scholar] [CrossRef]
- Eadie, G., Huppenkothen, D., Springford, A., & McCormick, T. (2019). Introducing Bayesian analysis with M&M’s®: An active-learning exercise for undergraduates. Journal of Statistics Education, 27(2), 60–67. [Google Scholar] [CrossRef]
- Freire, P. (1970). Pedagogy of the oppressed. Continuum International. [Google Scholar]
- Fry, H. (2018). Hello world: How to be human in the age of the machine. Doubleday. [Google Scholar]
- Greeno, J. (2006). Learning in activity. In R. Sawyer (Ed.), The Cambridge handbook of the learning sciences (pp. 79–96). Cambridge University Press. [Google Scholar]
- Gundlach, E., & Ward, M. D. (2021). The data mine: Enabling data science across the curriculum. Journal of Statistics and Data Science Education, 29(1), 74–82. [Google Scholar] [CrossRef]
- Jiang, S., Lee, V. R., & Rosenberg, J. M. (2022). Data science education across the disciplines: Underexamined opportunities for K–12 innovation. British Journal of Educational Technology, 53(5), 1073–1079. [Google Scholar] [CrossRef]
- Jordan, B., & Henderson, A. (1995). Interaction analysis: Foundations and practice. Journal of the Learning Sciences, 4(1), 39–103. [Google Scholar] [CrossRef]
- Lave, J., & Wenger, E. (1991). Situated learning: Legitimate peripheral participation. University of Cambridge Press. [Google Scholar]
- Lee, V. R., Wilkerson, M. H., & Lanouette, K. (2021). A call for a humanistic stance toward K–12 data science education. Educational Researcher, 50(9), 664–672. [Google Scholar] [CrossRef]
- Louie, J. (2022). Critical data literacy: Creating a more just world with data. National Academies of Sciences, Engineering, and Medicine. [Google Scholar]
- McCoy, C., & Shih, P. C. (2016). Teachers as producers of data analytics: A case study of a teacher-focused educational data science program. Journal of Learning Analytics, 3(3), 193–214. [Google Scholar] [CrossRef]
- National Academies of Sciences, Engineering, and Medicine (NASEM). (2018). Data science for undergraduates: Opportunities and options. National Academies Press. [Google Scholar]
- National Academies of Sciences, Engineering, and Medicine (NASEM). (2022). Foundations of data science for students in grades K–12. National Academies Press. [Google Scholar]
- Pimental, D. R., Horton, N. J., & Wilkerson, M. H. (2022). Tools to support data analysis and data science in K–12 education. In Foundations of data science for students in Grades K–12: A workshop. National Academies of Sciences, Engineering, and Medicine. [Google Scholar]
- Reigh, E., Escudé, M., Bakal, M., Rivero, E., Wei, X., Roberto, C., Hernández, D., Yada, A., Gutiérrez, K., & Wilkerson, M. H. (2022). Mapping racespace: Data stories as a tool for environmental and spatial justice. Occasional Paper Series, (48), 79–95. [Google Scholar] [CrossRef]
- Reinhart, A., Evans, C., Luby, A., Orellana, J., Meyer, M., Wieczorek, J., Elliott, P., Burckhardt, P., & Nugent, R. (2022). Think-aloud interviews: A tool for exploring student statistical reasoning. Journal of Statistics and Data Science Education, 30(2), 100–113. [Google Scholar] [CrossRef]
- Rich, P., Larsen, R. A., & Mason, S. L. (2020). Measuring teacher beliefs about coding and computational thinking. Journal of Research on Technology in Education, 3, 296–316. [Google Scholar] [CrossRef]
- Rosenberg, J. M., & Jones, R. S. (2022). K–12 data science learning. In Foundations of data science for students in grades K–12: A workshop. National Academies of Sciences, Engineering, and Medicine. [Google Scholar]
- Rosenberg, J. M., Lawson, M. A., Anderson, D. J., & Rutherford, T. (2020). Making data science count in and for education. In E. Romero-Hall (Ed.), Research methods in learning design & technology (pp. 94–110). Routledge. [Google Scholar]
- Sager, M. T. (2024). “It’s hard to quantify community togetherness”: Exploring the evolution of data science practices and uncovering critical tensions [Doctoral dissertation, Southern Methodist University]. Teaching and Learning Theses and Dissertations. [Google Scholar]
- Sager, M. T., Wieselmann, J. R., & Petrosino, A. J. (2025, June 10–13). Comparing data science practices between the classroom and real-world projects. 19th International Conference of the Learning Sciences—ICLS 2025, Helsinki, Finland. [Google Scholar] [CrossRef]
- Sawyer, R. K., & Greeno, J. G. (2009). Situativity and learning. In M. Aydede, & P. Robbins (Eds.), The Cambridge handbook of situated cognition (pp. 347–367). Cambridge University Press. [Google Scholar]
- Stornaiuolo, A. (2020). Authoring data stories in a media makerspace: Adolescents developing critical data literacies. Journal of the Learning Sciences, 29(1), 81–103. [Google Scholar] [CrossRef]
- Vance, E. A. (2021). Using team-based learning to teach data science. Journal of Statistics and Data Science Education, 29(3), 277–296. [Google Scholar] [CrossRef]
- Watson, A., Das, S. K., & Ray, S. (2021, October 6–9). DaskDB: Scalable data science with unified data analytics and in situ query processing. 2021 IEEE 8th International Conference on Data Science and Advanced Analytics (DSAA) (pp. 1–10), Porto, Portugal. [Google Scholar] [CrossRef]
- Wilkerson, M. H., & Laina, V. (2018). Middle school students’ reasoning about data and context through storytelling with repurposed local data. ZDM: The International Journal on Mathematics Education, 50(7), 1223–1235. [Google Scholar] [CrossRef]
- Wilkerson, M. H., & Polman, J. L. (2020). Situating data science: Exploring how relationships to data shape learning. Journal of the Learning Sciences, 29(1), 1–10. [Google Scholar] [CrossRef]
- Yin, R. (2014). Case study research: Design and methods (5th ed.). Sage Publications, Inc. [Google Scholar]
- Yoon, S., Miller, K., Shim, J., Wendel, D., Schoenfeld, I., Anderson, E., & Reider, D. (2019, June 17–21). From Face-to-Face to Online: Considerations for a Social Capital Design to Scale Science Teacher Access to High-Quality PD. In K. Lund, G. P. Niccolai, E. Lavoué, C. Hmelo-Silver, G. Gweon, & M. Baker (Eds.), A wide lens: Combining Embodied, enactive, extended, and embedded learning in collaborative settings, 13th international conference on computer supported collaborative learning (CSCL) 2019, Lyon, France (Vol. 2, pp. 849–850). International Society of the Learning Sciences. [Google Scholar]
| Disclaimer/Publisher’s Note: The statements, opinions and data contained in all publications are solely those of the individual author(s) and contributor(s) and not of MDPI and/or the editor(s). MDPI and/or the editor(s) disclaim responsibility for any injury to people or property resulting from any ideas, methods, instructions or products referred to in the content. |
© 2025 by the authors. Licensee MDPI, Basel, Switzerland. This article is an open access article distributed under the terms and conditions of the Creative Commons Attribution (CC BY) license (https://creativecommons.org/licenses/by/4.0/).


