1. Introduction
The rapid evolution of the educational landscape is credited to the substantial expansion of data and the widespread adoption of artificial intelligence methods and technologies in various forms. These resources are employed for data analysis across diverse fields. This process, known as educational analytics, refers to an emerging field that concentrates on developing techniques to explore unique and increasingly extensive datasets that originate from educational environments. These techniques are utilized to attain deeper insights into both students and the learning contexts they engage with. This field has recently garnered significant attention from government initiatives, particularly as the focus shifts toward remote education and the creation of numerous educational platforms. However, existing approaches often lack mechanisms to address the heterogeneity of student needs, a critical gap that formed the core of our research problem.
The COVID-19 pandemic accelerated the transition to online education, revealing systemic disparities in student engagement, performance, and responsiveness to standardized curricula
Romero and Ventura (
2020). This transition became necessary as it was not feasible to suspend educational activities for a minimum period of approximately one year. Simultaneously, preserving the lives of students presented a significant challenge for governments. Consequently, the only viable solution was to transition to online education. The importance of education is indisputable for everyone, driving widespread interest in formulating innovative approaches to tackle the challenges inherent in this sector, meet its needs, and elevate the educational process.
Owing to inherent differences between individuals, the educational system is confronted with diverse student cohorts, marked by disparities in performance, understanding, and optimal teaching techniques tailored to each person. What proves advantageous for one may not inherently hold the same benefit for all. To address this gap, we propose a methodology that combines unsupervised clustering and recommendation systems and leverages the KALBOARD360 platform
KALBOARD360 (
n.d.)—a benchmark dataset that captures academic, demographic, social, and behavioral characteristics
Amrieh et al. (
2015,
2016). The primary objective of this work was twofold: first, to uncover latent student subgroups through clustering, and second, to translate these groupings into actionable pedagogical strategies. We hypothesized that unsupervised clustering will reveal distinct engagement profiles that are strongly correlated with academic behaviors, and that personalized recommendations aligned with these profiles will enhance engagement metrics and learning outcomes.
This study was guided by two research questions:
How can unsupervised clustering techniques reveal meaningful student subgroups within heterogeneous educational datasets?
What role can cluster-driven recommendations play in improving engagement and academic outcomes?
Next, we will proceed to create a recommendation system with the aim of enhancing educational strategies, ameliorating issues stemming from implemented curricula, and effectively addressing the distinct needs of each group in accordance with their particular requirements. The remainder of this paper is structured as follows:
Section 2 reviews the literature on educational data mining (EDM) and clustering,
Section 3 details our methodology, and
Section 4 and
Section 5 present results and implications, followed by conclusions.
2. Literature Review
Published studies in the field of educational analytics have varied based on differences in objectives and methodologies adopted in research. We organized this review into three thematic categories: learning analytics and systematic reviews, clustering applications in education, and personalized learning and recommendation systems.
Learning analytics and systematic reviews: Systematic reviews in learning analytics serve as a foundational lens through which trends, challenges, and opportunities in the field are revealed. For instance,
Mangaroska and Giannakos (
2018) analyzed 74 studies to examine how learning analytics supports learning design, identifying key research trends and methodological gaps. Their review emphasized the potential of analytics-driven design to improve educational outcomes—a goal aligned with our intent to move from raw data to actionable strategies.
Yang et al. (
2021) advanced the methodological scope by applying a combination of unsupervised, supervised, and reinforcement learning techniques to develop adaptive student models. Their work is especially relevant to our study’s first research question, demonstrating how student behaviors can be translated into predictive models. Similarly,
da Silva et al. (
2022) adopted a systematic mapping approach to study intelligent services in distance education, which offers important insights into the application of learning analytics in large-scale, diverse learning environments.
Together, these studies underscore both the methodological breadth and the importance of aligning analytic approaches with pedagogical intentions—an alignment that our work pursued through its hybrid clustering–recommendation framework.
Clustering applications in education: Clustering techniques have been widely applied to categorize student behaviors, yet their pedagogical integration often remains underdeveloped.
Troussas et al. (
2020) employed a multi-module learning analytics system using K-means clustering to group students based on performance and engagement—a methodological foundation closely related to our own.
Khalil and Ebner (
2017) used clustering to identify behavioral patterns in MOOCs, revealing the diversity of learner engagement profiles in online environments. These insights directly informed our approach to subgroup identification.
Pasina et al. (
2019) focused on clustering students by learning styles to personalize e-learning, highlighting the adaptability of clustering to different educational attributes. Furthermore,
Navarro and Ger (
2018) compared various clustering algorithms (K-means, EM, hierarchical, DBSCAN), with a focus on silhouette scores to evaluate the clustering quality. Their validation methods directly influenced our decision to use both elbow and silhouette analyses in determining the optimal cluster structure.
The reviewed works reinforced the technical relevance of clustering methods while exposing a gap in translating these clusters into pedagogical decisions—which is precisely the gap we aimed to bridge in this study.
Personalization and self-regulated learning: Recent research in personalized learning emphasized student autonomy and the adaptation of learning pathways.
Lee et al. (
2019) conducted a systematic review of self-regulated learning (SRL) in MOOCs, where they synthesized evidence on strategies that enhance learner agency and motivation. Their findings validate the importance of supporting diverse learning behaviors through personalized mechanisms.
Diao et al. (
2022) proposed a recommendation framework based on identifying knowledge gaps and aligning student profiles with knowledge models—an approach that resonates strongly with the second research question of our study. These studies collectively highlight the growing emphasis on personalization in education but also suggest the need for more robust, data-driven models to operationalize it.
Across the three thematic areas, several key gaps emerge. Many studies treat clustering and recommendation independently, lack interpretability of clustering outcomes, or do not connect findings to pedagogical action. Our study addressed these limitations by proposing an integrated framework that achieves the following:
Uses K-means clustering with robust validation techniques (elbow and silhouette methods);
Interprets behavioral engagement profiles to define student needs;
Generates actionable, personalized recommendations using user-based collaborative filtering.
By embedding analysis within each thematic area, this review established a solid foundation for our methodology and affirmed the contribution of our work to both the theory and practice of educational analytics.
3. Methodology and Materials
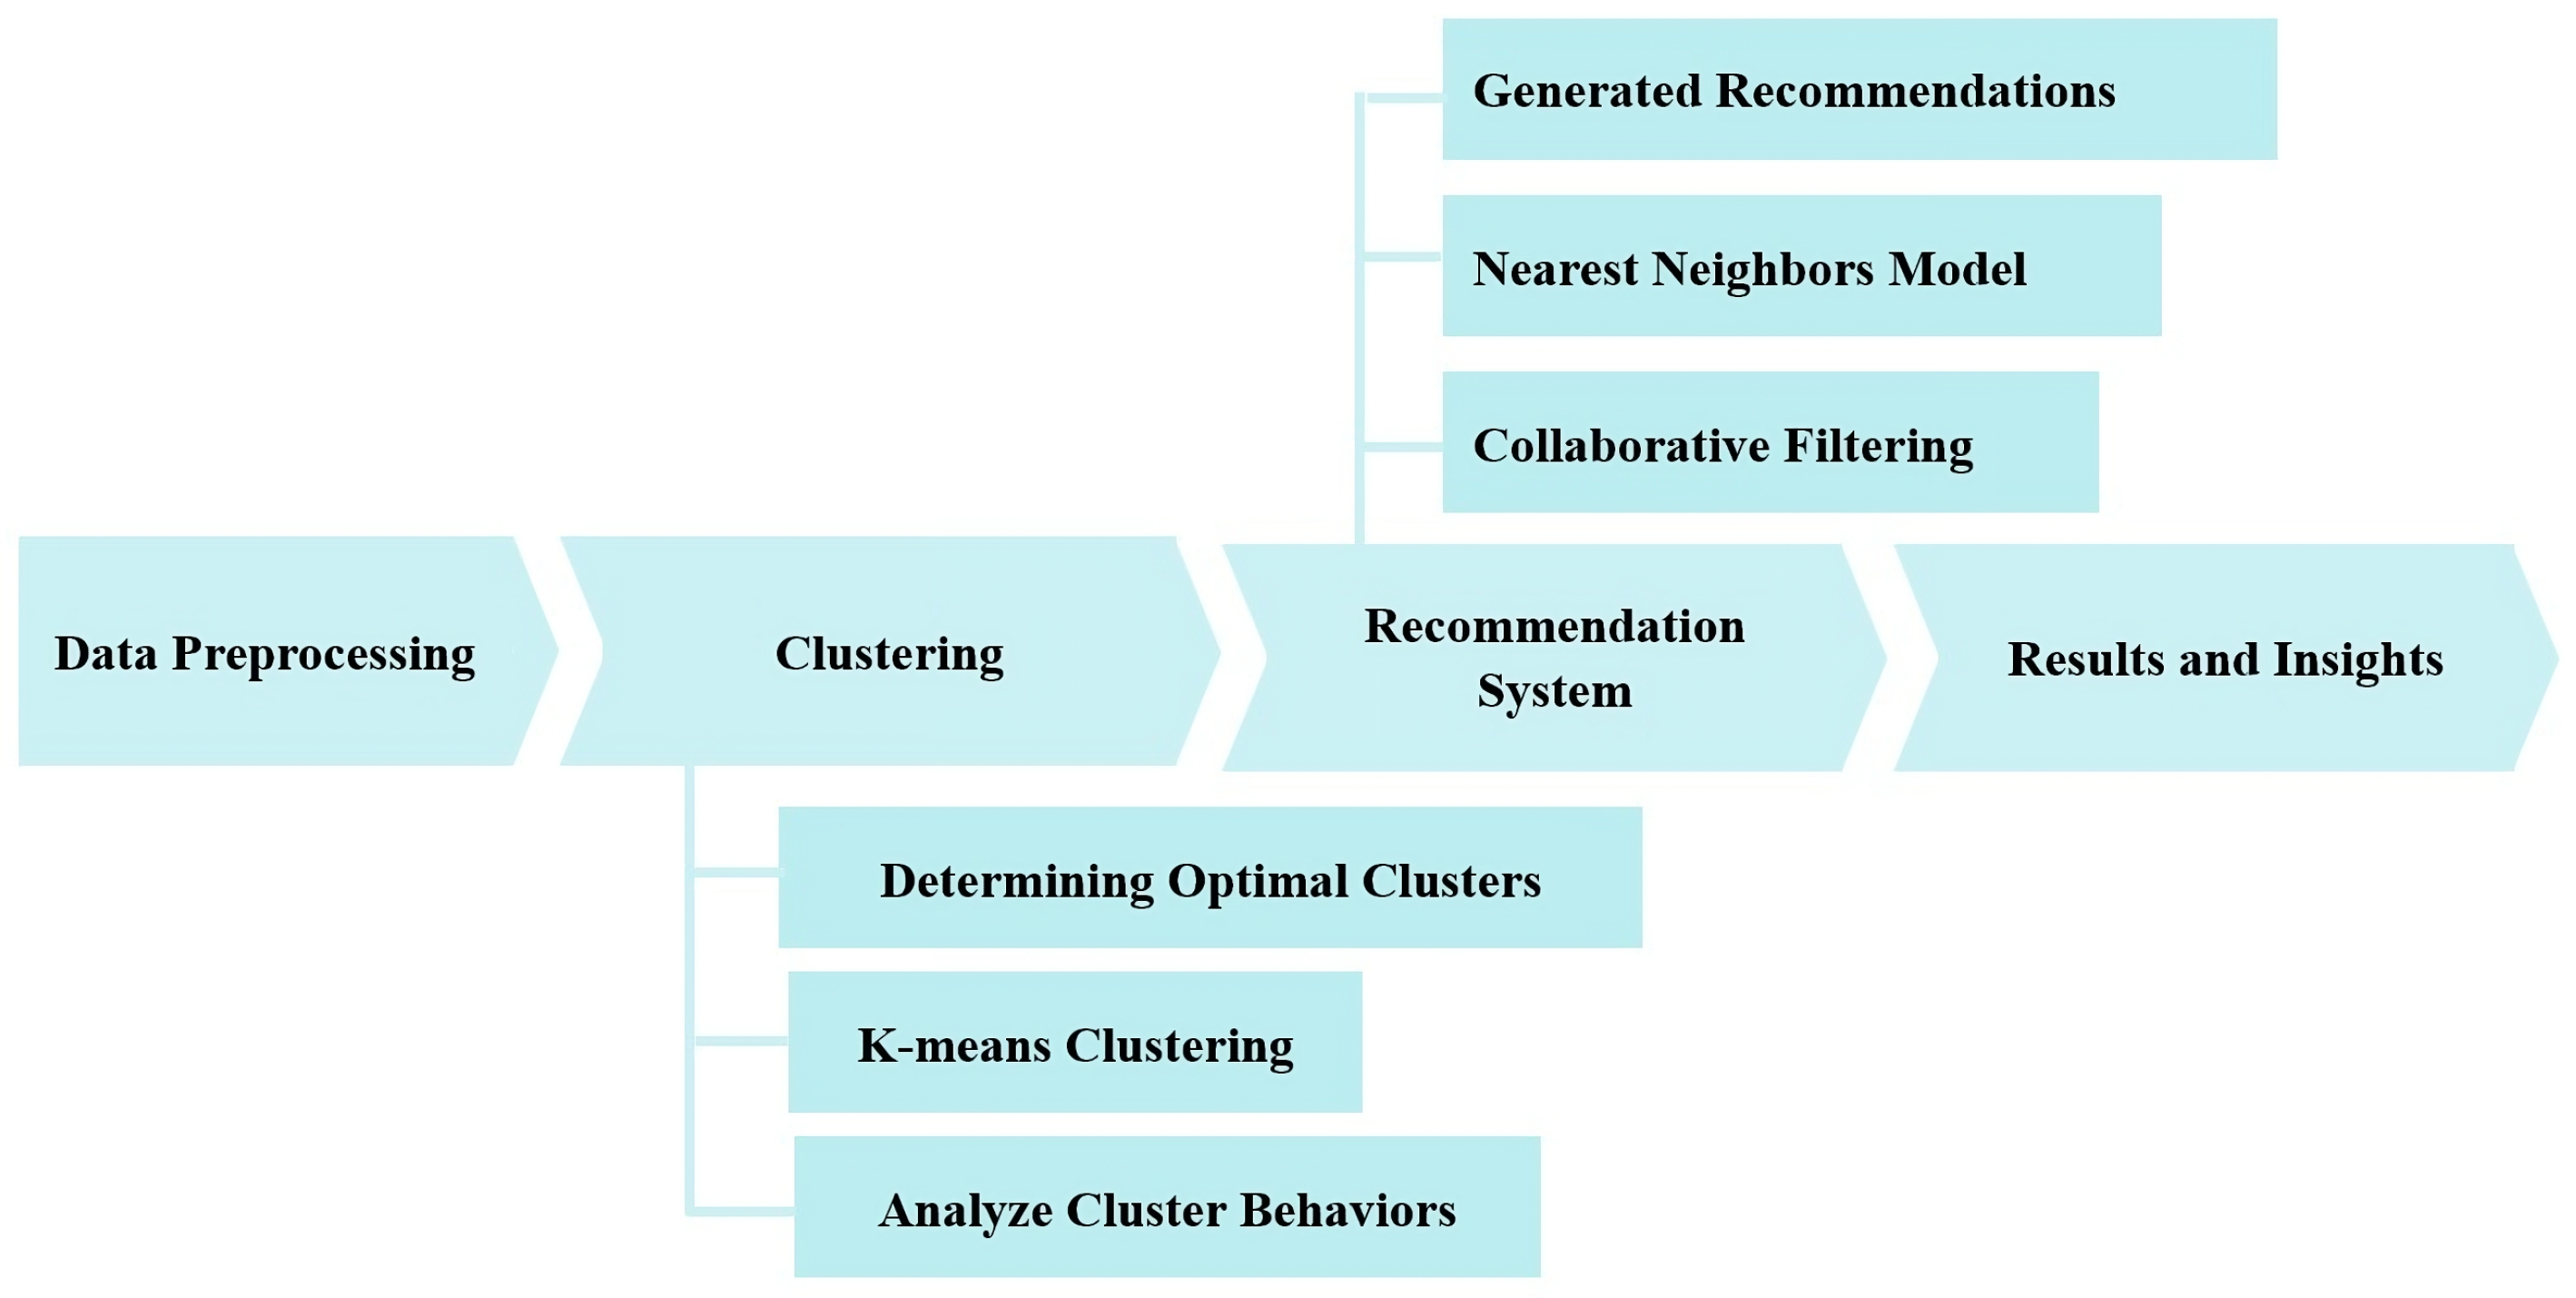
As illustrated in
Figure 1, this study was divided into multiple phases. We commenced with the data preprocessing to prepare the data for utilization in a subsequent phase, during which we applied a clustering algorithm to group students into distinct clusters based on specific features. In the next phase, we generated recommendations based on these clusters. Finally, we analyzed and discuss the results.
3.1. Data Preprocessing
The dataset originated from the KALBOARD360 learning management system (LMS), an educational platform designed to support online and blended learning environments. It provides a structured framework for monitoring student engagement, participation, and academic performance. The platform offers a variety of tools for both students and educators, enabling interactive learning experiences, assessment tracking, and personalized feedback mechanisms. KALBOARD360 is particularly useful for understanding student learning behaviors, as it records a comprehensive set of features that reflect different dimensions of student engagement. The dataset used in this study consists of 480 students and 16 features categorized into four groups:
Demographical features: Nationality, gender, place of birth (Jordan, Kuwait, Lebanon, Saudi Arabia, Iran, USA), and parent responsible for the student (father or mother).
Academic background features:
- –
Educational stage (primary, middle, high school);
- –
Grade level (G-01 to G-12);
- –
Section ID (classroom: A, B, C);
- –
Semester (first, second);
- –
Course topic (math, English, IT, Arabic, science, Quran);
- –
Student absence days (above 7, under 7).
Parent participation:
- –
Parent answering survey (yes/no);
- –
Parent school satisfaction (good, bad).
Behavioral features (engagement metrics): Raised hands, visited resources, announcements viewed, and discussion participation.
These features collectively capture academic, social, and behavioral dimensions critical for analyzing student engagement. The dataset is complete, with no missing values or outliers, requiring no imputation or cleaning.
During preprocessing, we prioritized the behavioral metrics (e.g., raised hands, resource visits) for clustering, as they directly reflect engagement patterns. Demographic and academic features were retained for the contextual interpretation of the clusters, while the parent participation data provided insights into external influences on student behavior. This selective focus aligned with our objective to link engagement behaviors to personalized recommendations.
3.2. Clustering: Methods and Behavioral Analysis
Our study comprised two main phases: clustering and recommendations. In the initial step, we used the K-means algorithm to cluster students based on their behaviors into distinct groups. Following this, an analysis of these groups was carried out.
3.2.1. Clustering
We applied the unsupervised learning task of clustering to the data, which involved the overarching objective of arranging observed data samples into distinct groups known as clusters. This was achieved by capitalizing on the underlying data structure, defining clusters based on notions of similarity or inherent features. The goal was to ensure that samples within the same cluster shared similarities, while those across different clusters exhibited dissimilarities
Chen et al. (
2020). Various clustering methods exist, including overlapping, partitioning, probabilistic, and hierarchical. In partitioning, data is organized so that each data point is assigned to a single cluster, also known as exclusive clustering
Dridi (
2021). It is worth noting that the exclusive clustering method was utilized in our study.
3.2.2. K-Means Clustering
From several clustering algorithms, we opted for the K-means algorithm due to its efficiency and accuracy in clustering large datasets
Abo-Elnaga and Nasr (
2022). K-means clustering constructs groups in which the members have high similarity, as measured by proximity to a common center point. Each cluster is represented and summarized by its centroid, which is calculated as the mean position of all data points assigned to that cluster. It is important to note that the algorithm can only handle numerical data, and its performance is sensitive to outliers present in the input dataset
Navarro and Ger (
2018). The K-means algorithm follows an iterative process to partition data points into k clusters.
3.2.3. K-Means Algorithm Lloyd (1982)
Initialize k cluster centroids randomly from the data points.
Assign each data point to the nearest cluster centroid based on the Euclidean distance between them. This forms k clusters.
For each cluster j, update the cluster centroid cj to be the mean of all the data points assigned to cluster j.
Repeat steps 2–3 until the algorithm converges:
Return the final k clusters and centroid positions.
The K-means algorithm is one of the most commonly used clustering techniques in the field of educational analytics
Le Quy et al. (
2023).
3.2.4. Determining Optimal Clusters
To ensure a robust methodology, the optimal number of clusters (k) was determined before implementing the K-means algorithm. We employed a dual approach: the silhouette method as the primary quantitative criterion, supplemented by the elbow method for preliminary guidance. This strategy balances computational efficiency with reliability, mitigating overfitting risks while prioritizing cluster interpretability.
Elbow Method
The elbow method visualizes the trade-off between cluster cohesion and complexity by plotting the within-cluster sum of squares (WSS) against the candidate
k values (Equation (
1)). The WSS is defined as
Saputra et al. (
2020)
where
k is the number of clusters,
denotes the
i-th cluster, and
is the centroid of
.
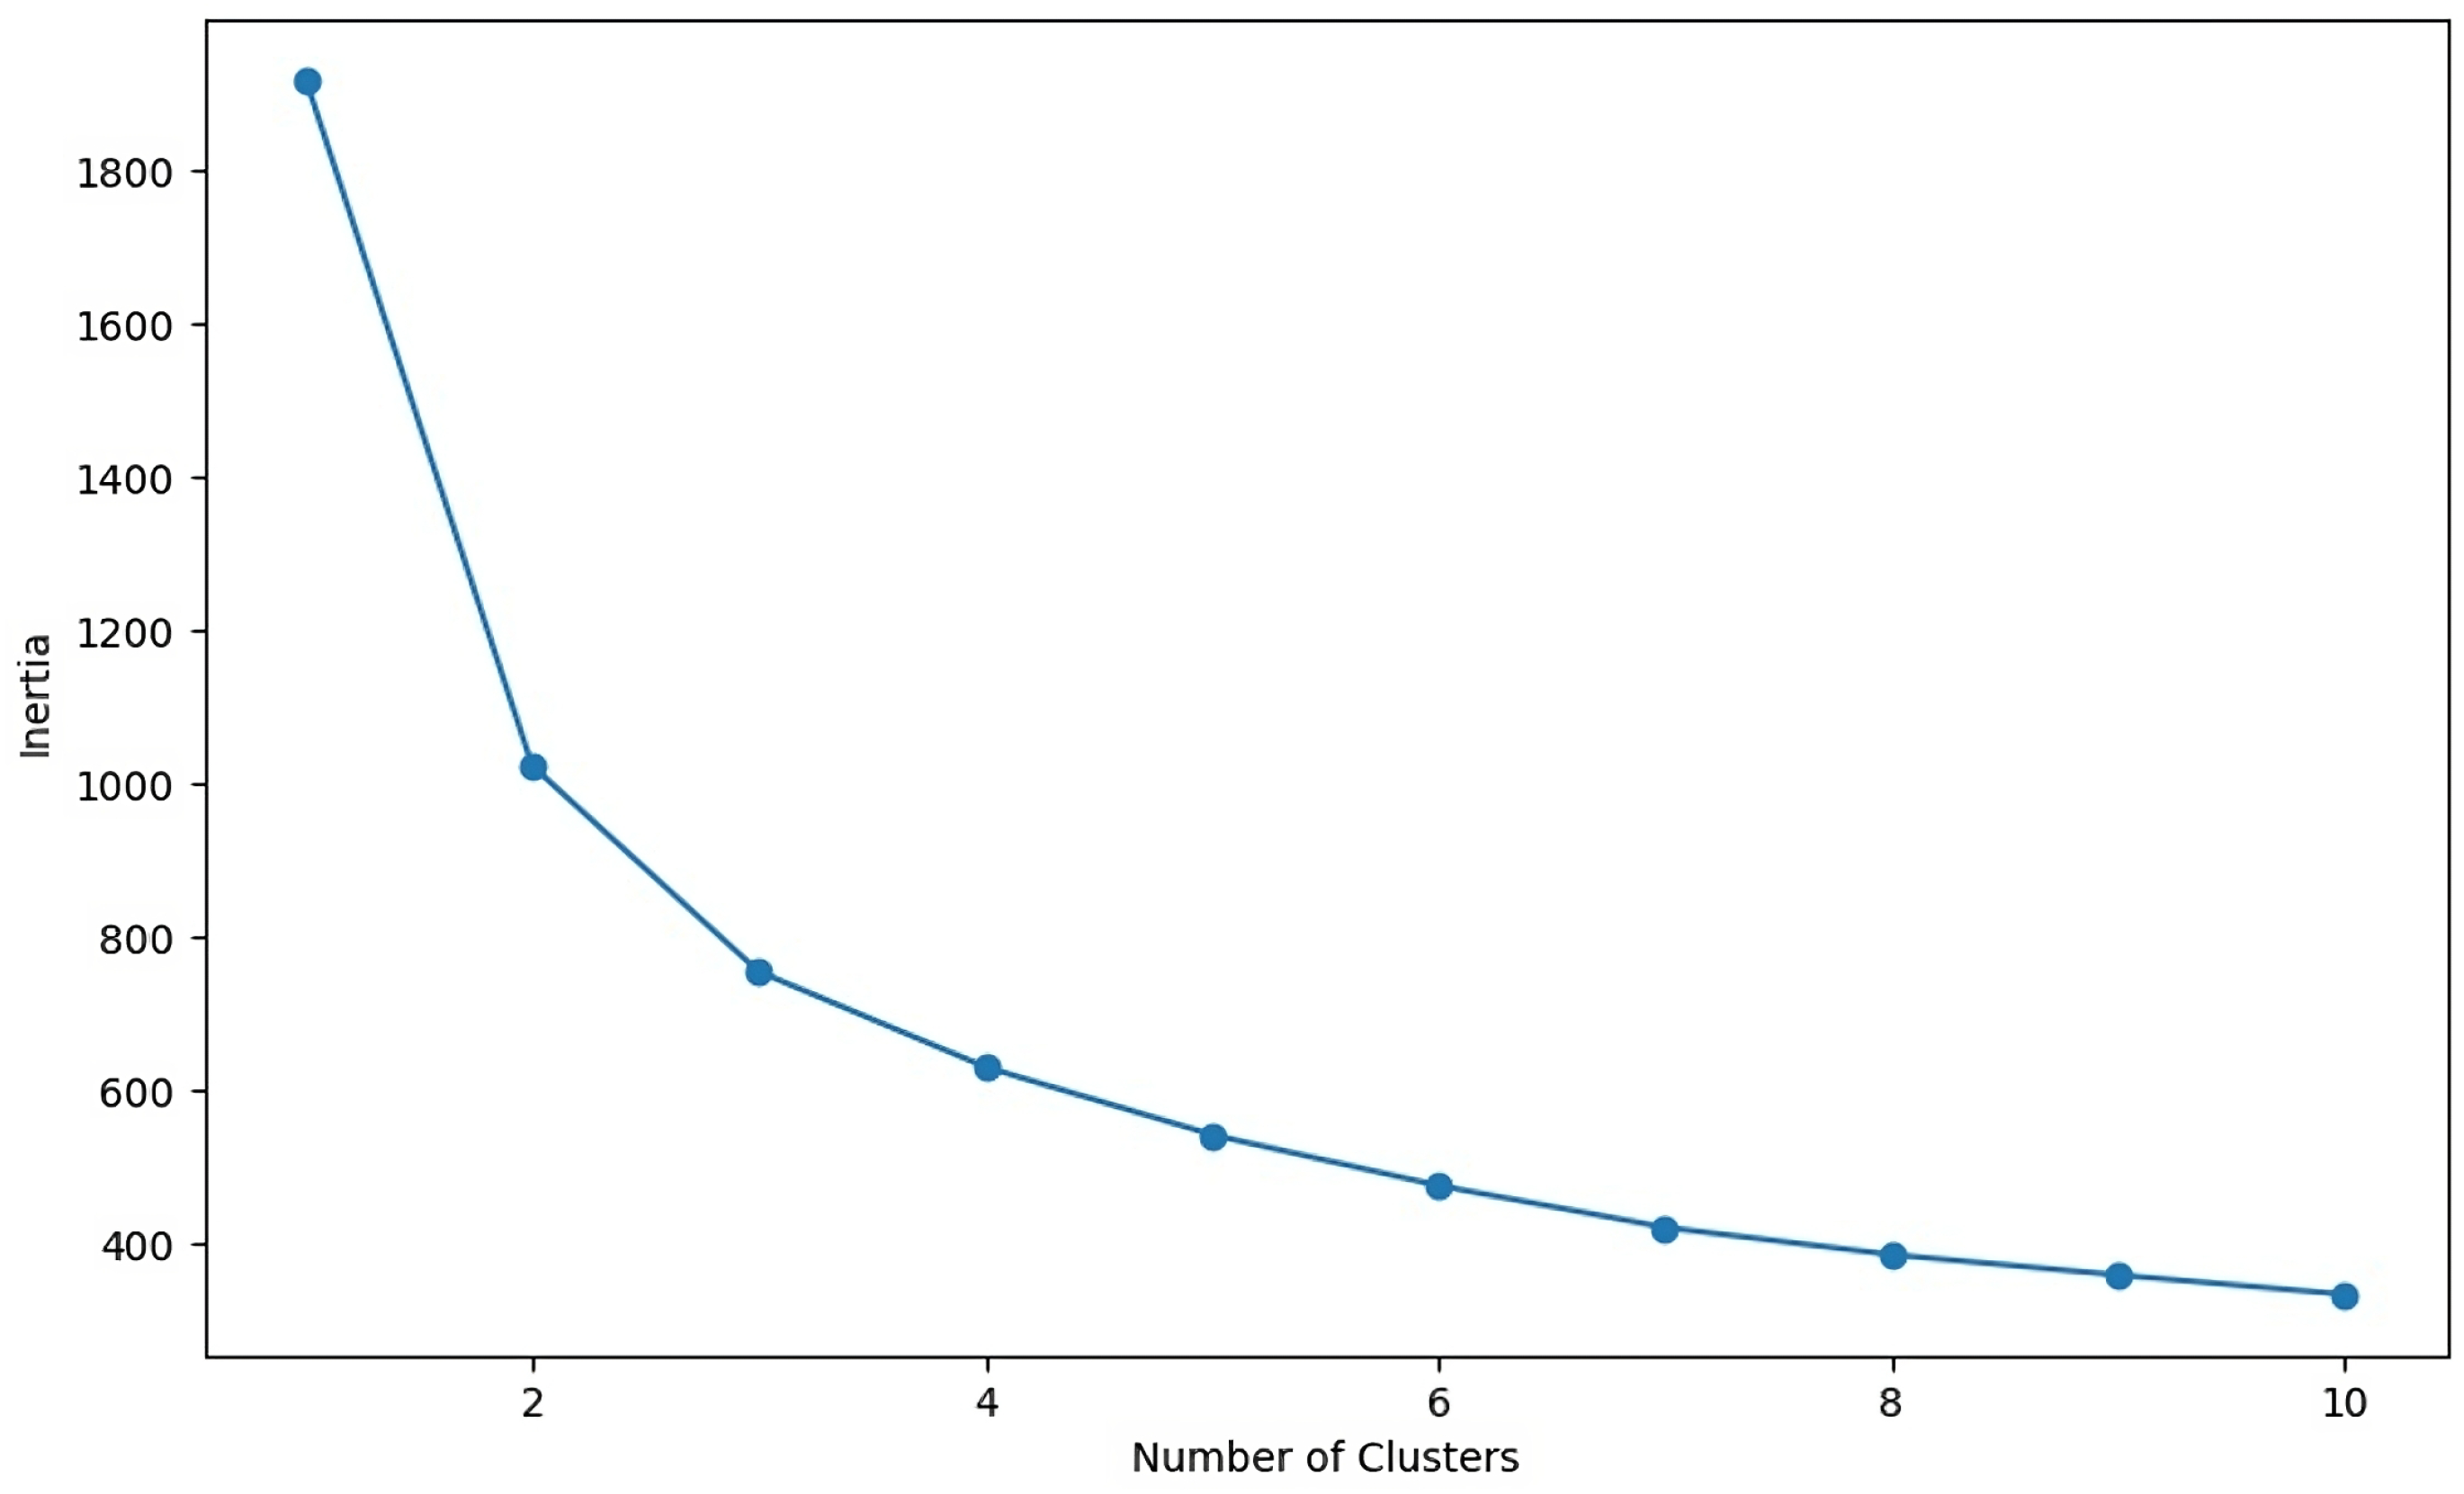
As shown in
Figure 2, the WSS curve exhibits a steep decline until
, beyond which improvements plateau. The inflection point (“elbow”) indicates a natural cutoff, suggesting an optimal cluster count. This heuristic approach was quantitatively validated using the silhouette method to ensure reliability. Additionally, we clarified that the elbow point corresponded to the inflection point where the second derivative of the WSS curve became negative, which confirmed the optimal choice of
k.
Silhouette Score Validation
The silhouette score quantifies the cluster quality by measuring how similar an object is to its own cluster compared with others. For an object
i, the score
is calculated as
Xu et al. (
2016):
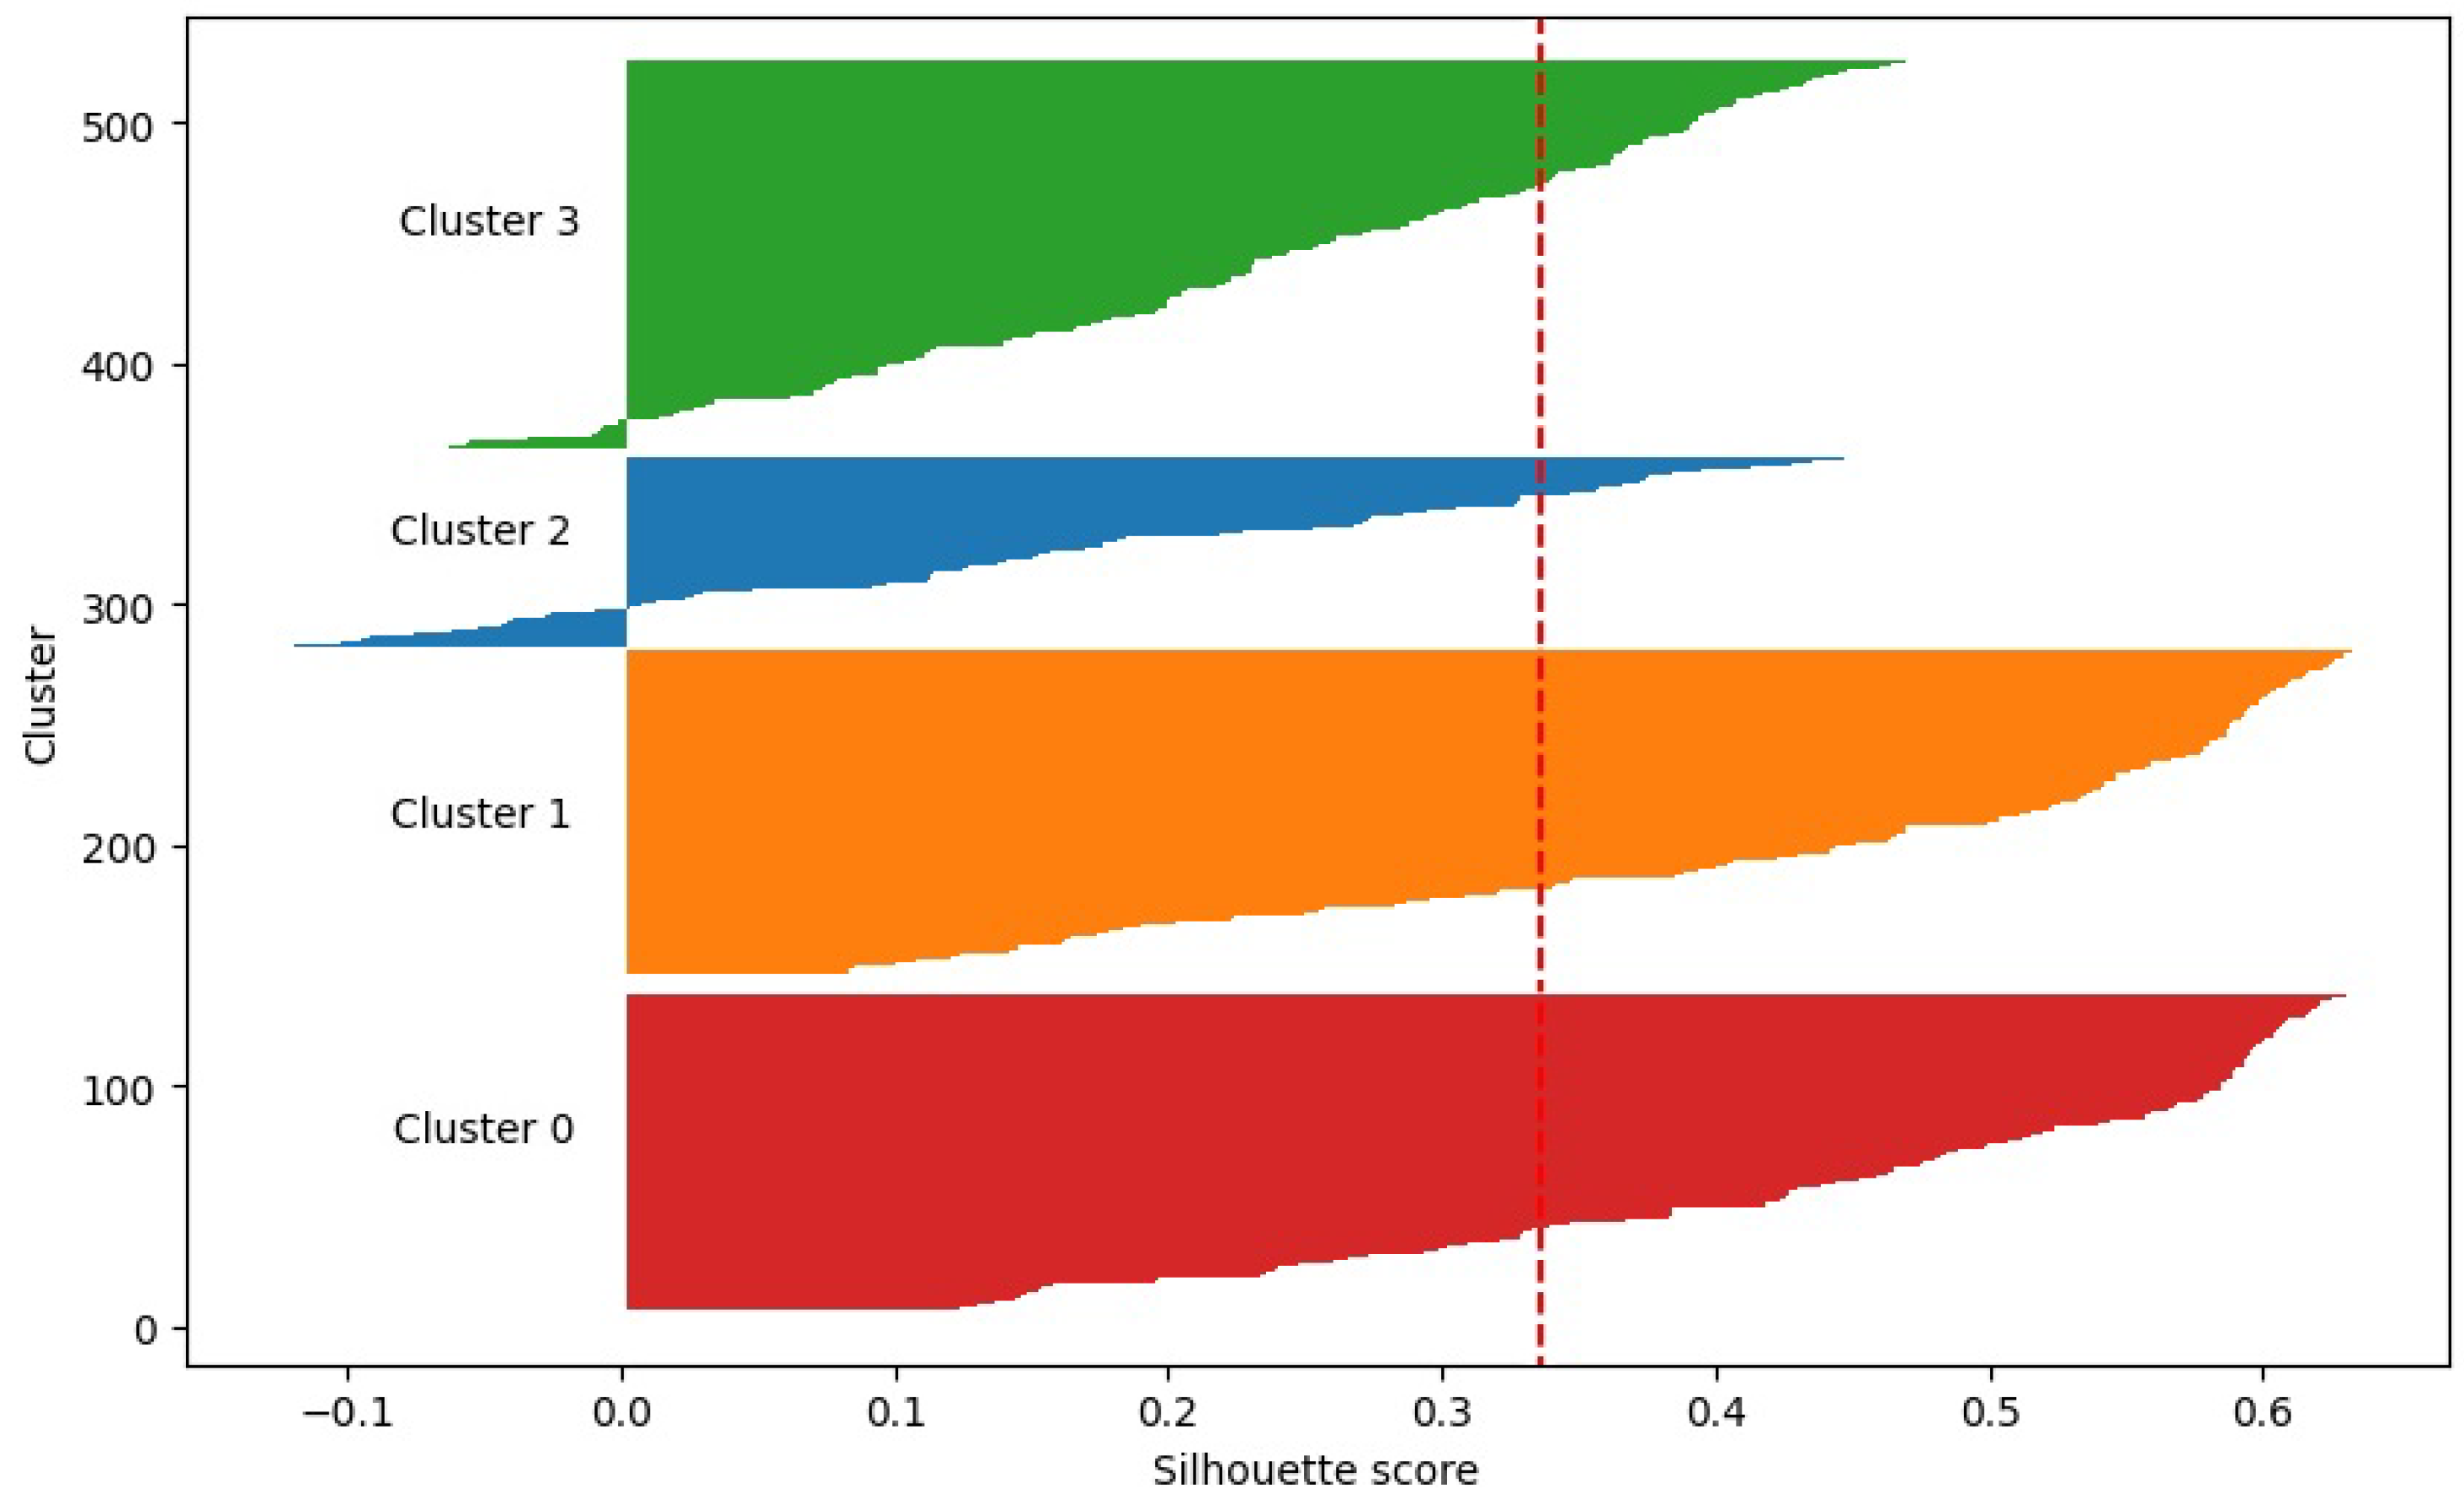
where
Figure 3 displays the silhouette scores for each cluster. Clusters 0 and 1 exhibited scores > 0.60, indicating strong separation and cohesion. Clusters 2 and 3 had lower scores (∼0.40), suggesting a moderate overlap but retaining pedagogical relevance.
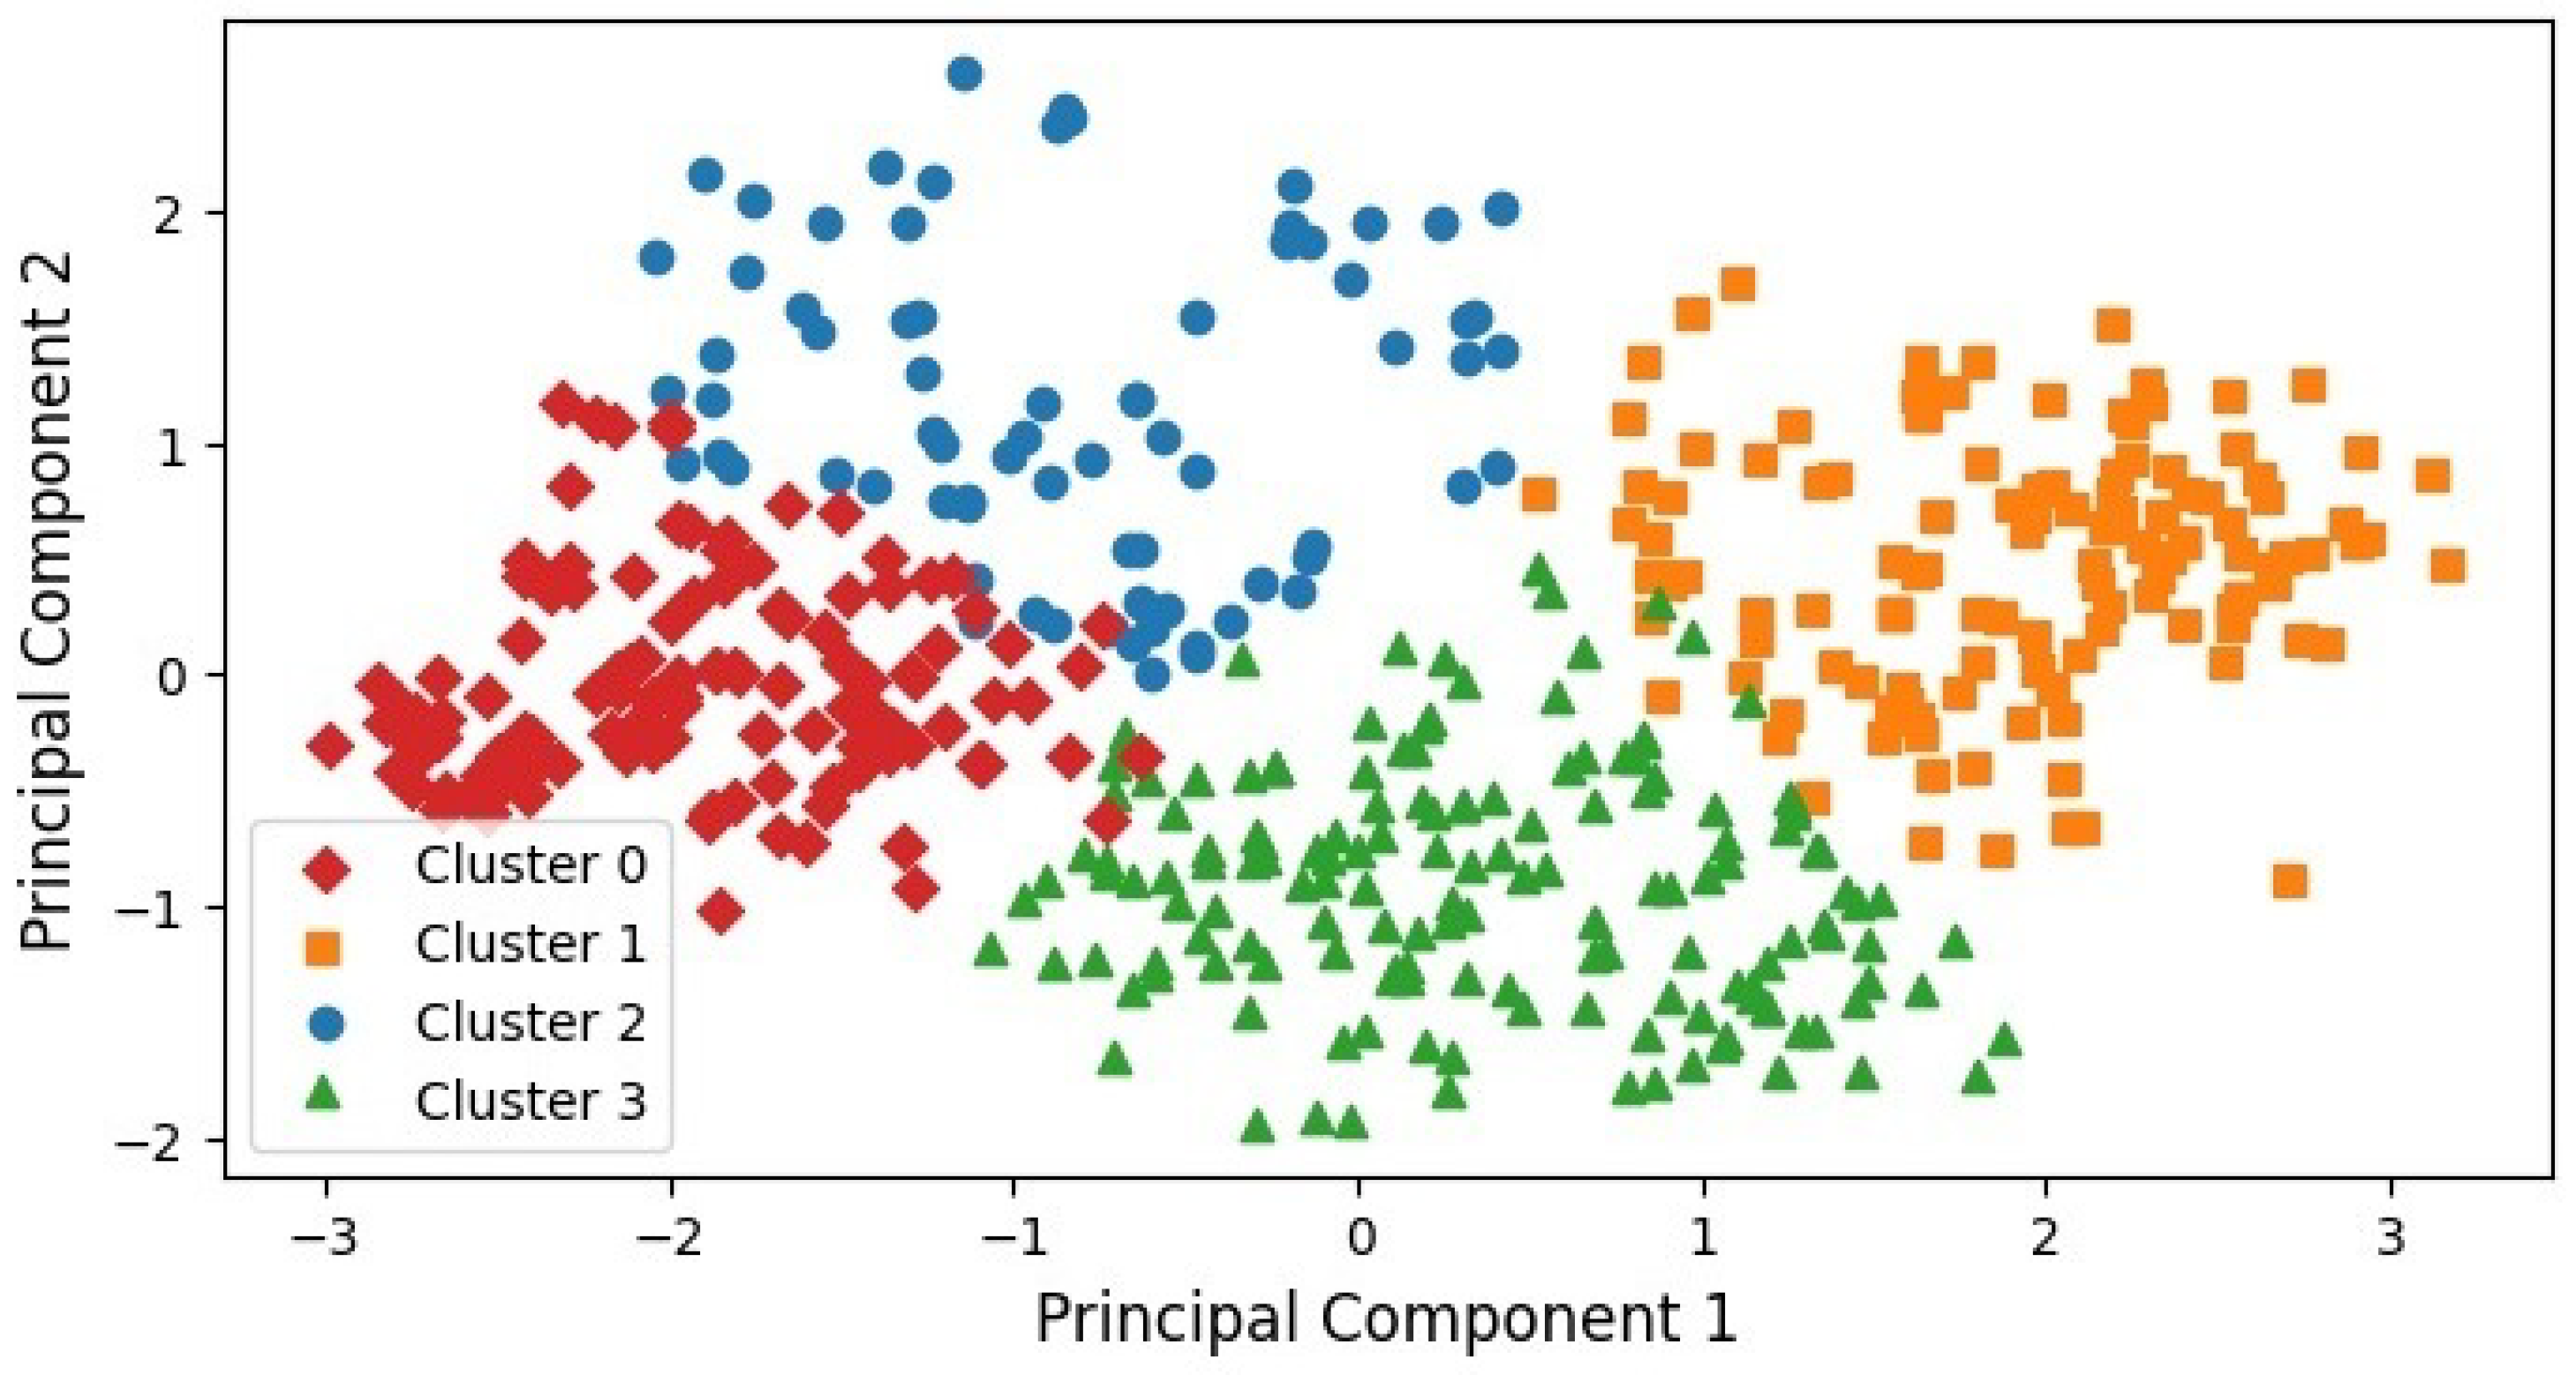
Figure 4 displays the student data points in a two-dimensional space obtained via Principal Component Analysis (PCA). PCA is a linear dimensionality reduction technique that transforms a set of correlated variables into a smaller set of uncorrelated variables called principal components, which capture most of the variance in the data
Jolliffe (
1990). In our study, PCA was applied with n_components = 2, which retained approximately 85% of the total variance. Each data point was then color-coded based on the cluster assigned by the K-means algorithm. Notably, the red, green, and orange clusters exhibited a higher level of density and compactness compared with the blue cluster, although some overlap was observed between the blue and green clusters, as well as between the red and orange clusters.
3.2.5. Analyze Cluster Behaviors
The box plots in
Figure 5 illustrate distinct engagement patterns across the four student clusters. Students in Cluster 0 exhibited moderate-to-low engagement levels across all metrics, including raised hands, resource visits, announcements viewed, and discussion participation. This suggests a need for targeted interventions to boost the overall involvement. In contrast, Cluster 1 students displayed consistently high engagement in all dimensions, indicating a self-driven learning behavior that may benefit from advanced challenges or leadership opportunities.
Cluster 2 students demonstrated moderate engagement in most areas but showed a pronounced interest in discussions, highlighting their preference for collaborative learning. This insight could guide instructors to prioritize group activities for this cohort. Conversely, Cluster 3 students exhibited strong engagement with course resources and moderate participation in raising questions, yet their limited interaction with announcements and discussions suggests a need for structured communication channels to enhance their connectivity with peers and course updates.
These behavioral profiles, as validated by the silhouette method, directly inform the personalized recommendations, ensuring alignment between the observed engagement patterns and tailored pedagogical strategies.
3.3. Recommendation System
Using these clusters, we constructed a recommendation system with the goal of enriching the educational process in alignment with the distinct needs of each cluster. Recommender systems analyze users’ item preferences and offer proactive suggestions for items that align with their interests. These recommendation models are typically categorized as content-based, collaborative filtering, and hybrid systems
Zhang et al. (
2019). These systems utilize the dependency principle between user-based and item-based activities to effectively choose the most suitable and pertinent item recommendations
Rahayu et al. (
2022). In this study, we employed the nearest neighbors technique, which belongs to the broader category of collaborative filtering methods. To evaluate the effectiveness and reliability of the recommendation system, we used two key numerical indicators: Hit Rate and Mean Similarity Score of Recommendations. The Hit Rate measures the proportion of correctly recommended strategies that align with actual adopted strategies, while the Mean Similarity Score assesses the overall relevance of the recommended strategies based on similarity metrics. These indicators will provide a quantitative assessment of the system’s performance and its impact on enhancing the educational process.
3.3.1. Collaborative Filtering
Collaborative filtering stands as a versatile predictive method utilized for content that is not readily and effectively characterized by descriptors, as is commonly found in movies and music. The approach involves constructing a database, often referred to as a user-item matrix, encapsulating user preferences for various items. This matrix is then leveraged to identify users who share similar interests and inclinations by evaluating the resemblances between their profiles, leading to the formation of clusters of users known as “neighborhoods.”
Within this framework, users are offered suggestions for items they have not previously rated based on the positive evaluations those items have received from users within their respective neighborhoods. The outcomes produced by collaborative filtering can manifest as either predictions or recommendations
Isinkaye et al. (
2015). There are two main types of collaborative filtering:
User-based collaborative filtering: In the context of user-based collaborative filtering, recommendations for the active user are produced by analyzing the ratings of other users with similar preferences, as identified through a similarity calculation. A group of akin users, often referred to as the “neighborhood,” is established for each user, and the ratings from this neighborhood are employed to estimate the active user’s likely ratings for items they have not yet encountered
Sarwar et al. (
2001).
Item-based collaborative filtering: Item-based collaborative filtering operates differently from user-based methods. Instead of finding users with similar preferences, it looks directly at the user’s own rated and purchased items. It matches these items to other similar items that tend to be purchased or rated together frequently. These similar item pairs are identified by analyzing large datasets to find items that customers often buy or rate at the same time. Once these connections are mapped out, the algorithm can take any of the user’s existing items and find the most similar items to recommend. Therefore, rather than relying on similar users, the recommendations come from items similar to what the user already likes
Linden et al. (
2003).
3.3.2. Nearest Neighbors Model
A significant category of algorithms used in one-class collaborative filtering involves the nearest neighbors techniques, commonly categorized as user-based and item-based approaches
Verstrepen and Goethals (
2014). The nearest neighbors technique involves identifying the closest neighbors of an active user. Similarity between users is established using various specific formulas. To accomplish this, the process requires employing similarity metrics between the active user and all other users, demanding considerable storage space and significant computational complexity, especially when dealing with large datasets
Houshmand Nanehkaran et al. (
2022). Among the many existing formulas for calculating the similarity between two items (i) and (j), we find the Adjusted Cosine Similarity, Cosine-based Similarity, and Correlation-based Similarity
Sarwar et al. (
2001).
Cosine-based Similarity: This similarity measure calculates the cosine of the angle between two item rating vectors. It measures the orientation, not magnitude, between the vectors. The cosine similarity score between two items (i) and (j) is calculated using
where
is the dot product of vectors
and
.
Correlation-based Similarity: This uses the Pearson correlation coefficient to measure the similarity between item rating vectors. It captures the extent to which the ratings of items (i) and (j) linearly correlate across co-rated users.
where
: the rating of user u for item i.
: the rating of user u for item j.
: the mean rating of the i-th item.
: the mean rating of the j-th item.
Adjusted Cosine Similarity: This adjusts the cosine similarity by subtracting the user’s average rating from each co-rated pair. This removes user rating scale differences before computing the similarity.
where
: the rating of user u for item i.
: the rating of user u for item j.
: the mean rating given by user u.
The summation is performed over all users who have rated both items i and j.
We employed a user-based nearest neighbors collaborative filtering approach, as it centers around identifying similar users (clusters) based on their preferences and suggesting strategies that have garnered positive feedback from similar clusters.
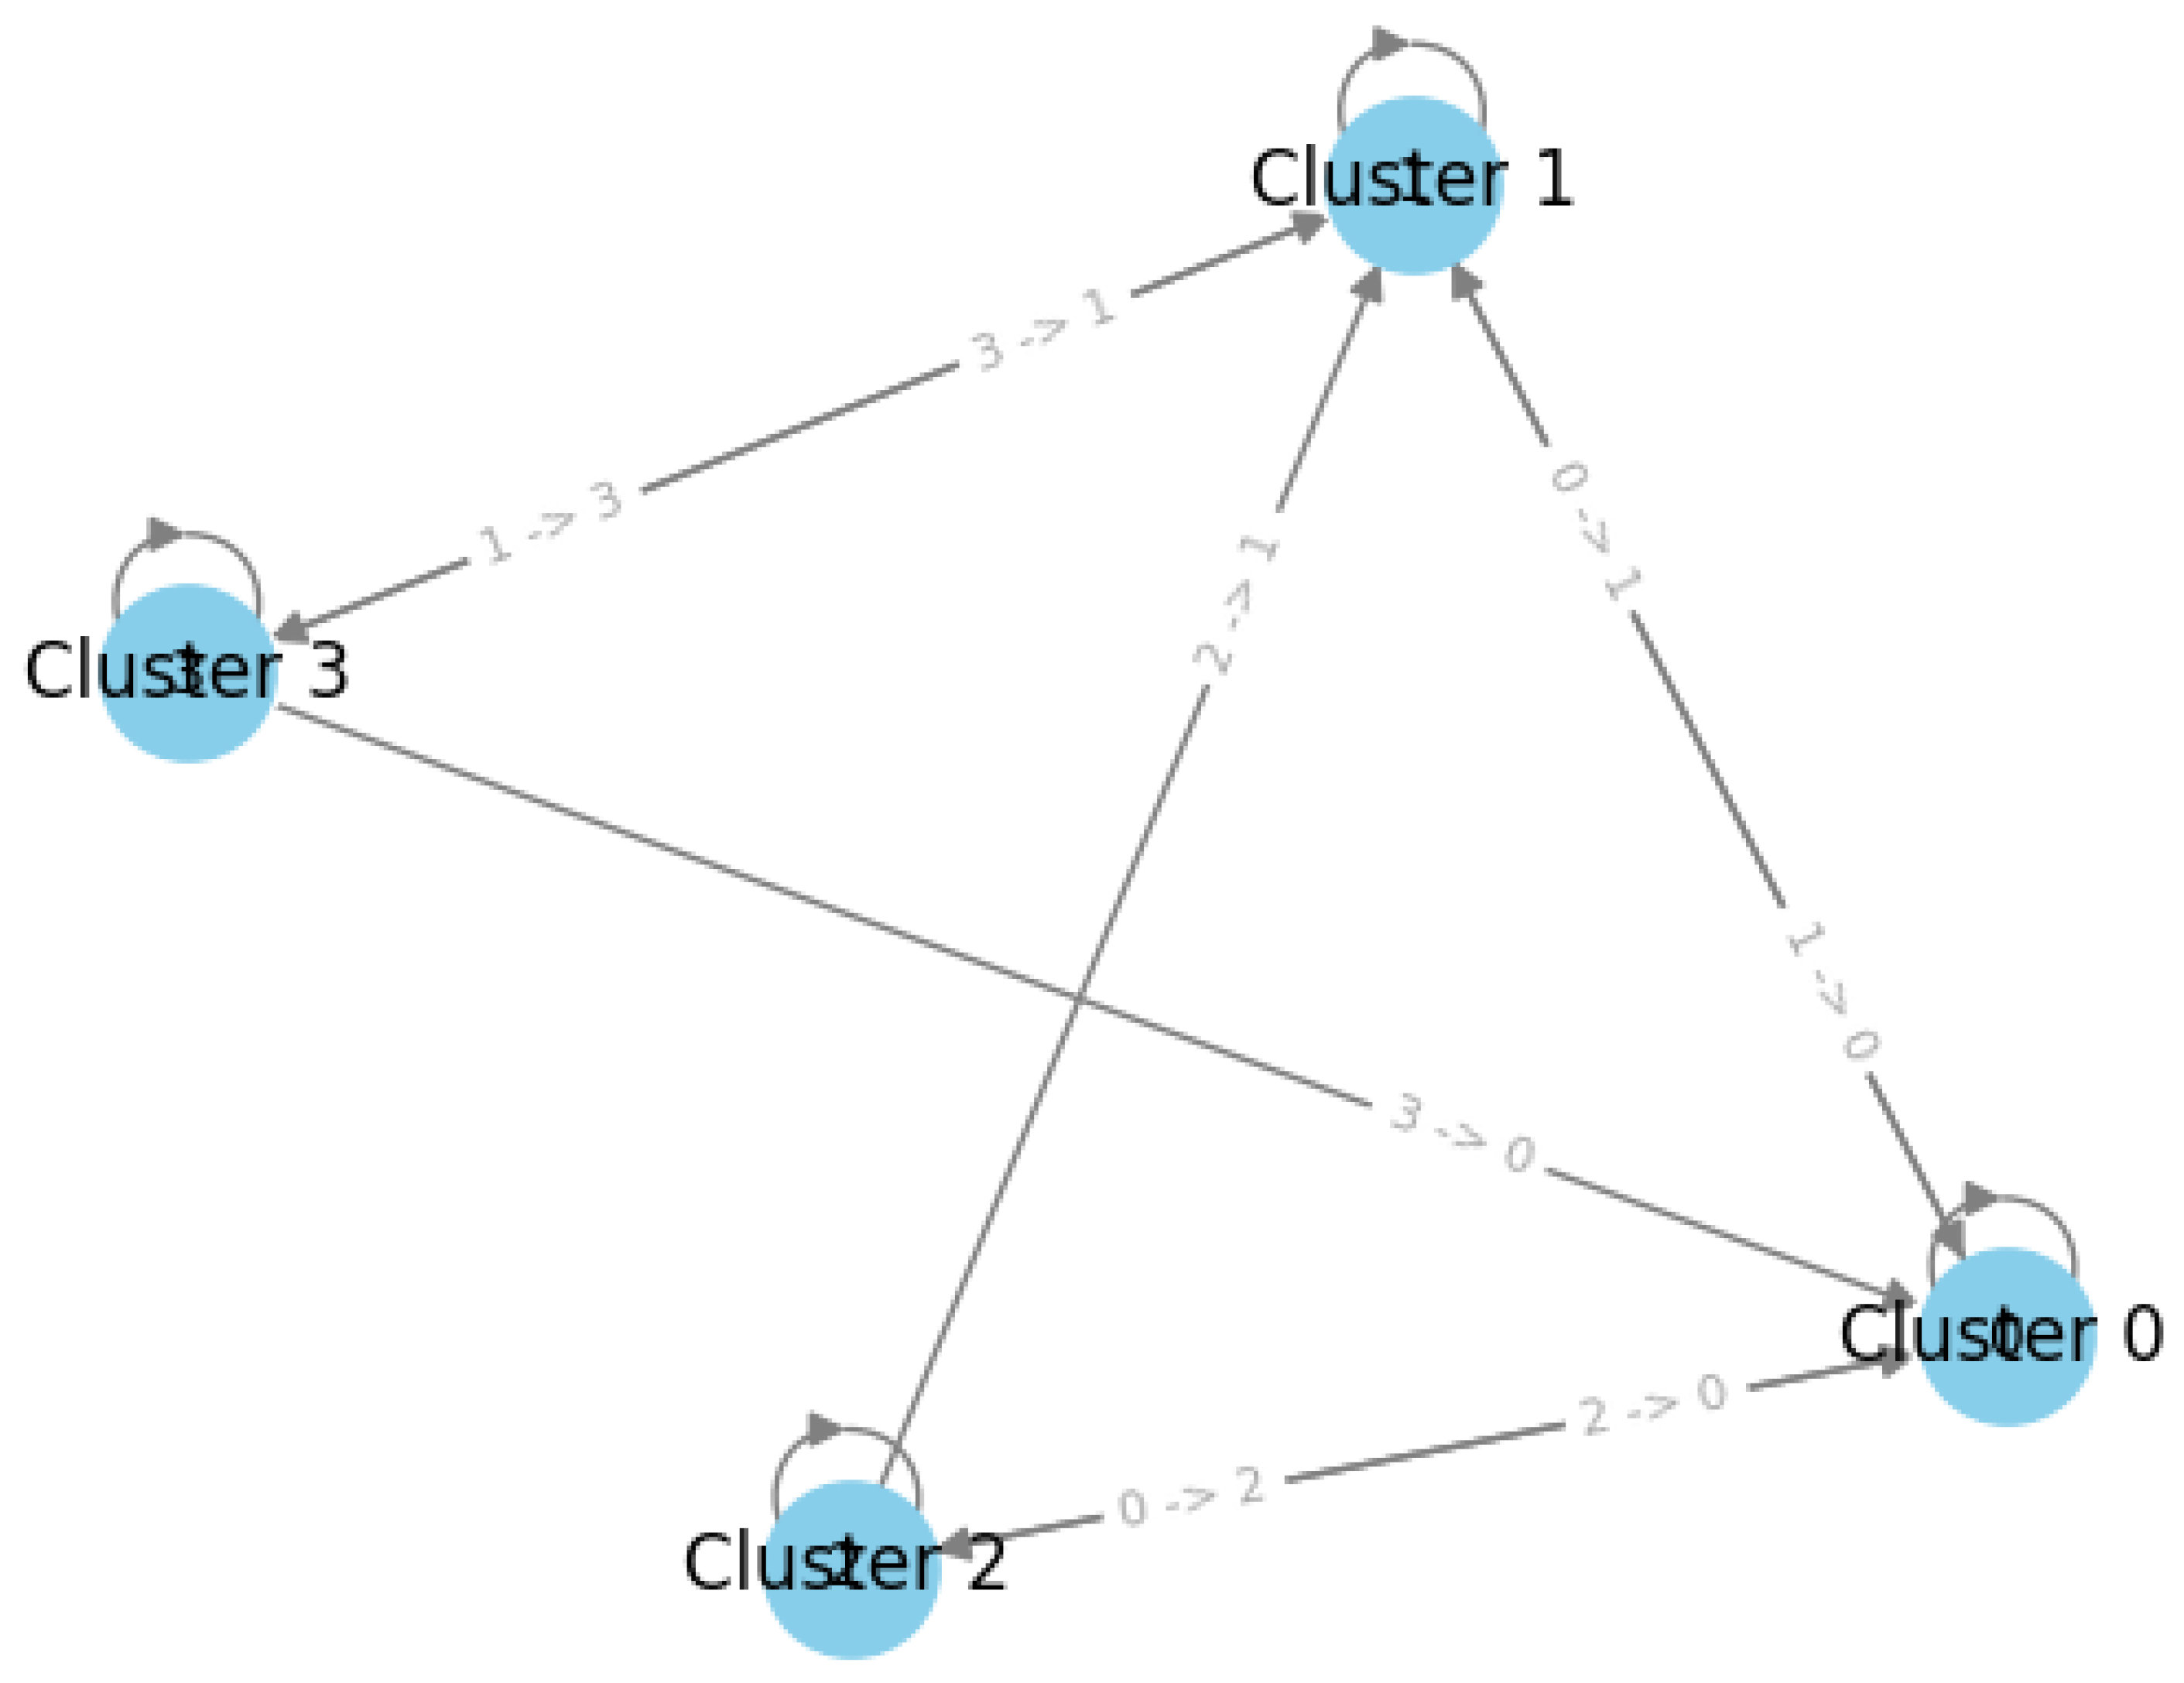
3.3.3. Generated Recommendations
After clustering students into four groups, as illustrated in
Figure 3, each cluster exhibited distinct behaviors but lacked certain enhancements to improve the academic performance. We implemented a recommendation system based on a user-based nearest neighbors collaborative filtering approach, and the results are depicted in
Figure 6.
The clusters exhibited a circular relationship in their recommended strategies: each cluster suggested a sequence of strategies that included itself and the other two clusters. This pattern underscored the interdependent nature between the clusters, which required the supplementation of each cluster with elements it may lack. This adaptation should be guided by the distinctive nature of each cluster and the unique characteristics of its student population. To assess the effectiveness of these recommendations, we employed two key evaluation metrics: the Hit Rate (0.65) and Mean Similarity Score of Recommendations (0.96). The Hit Rate indicates the proportion of correctly recommended strategies that align with actual adopted strategies, while the Mean Similarity Score reflects the overall relevance and consistency of the recommendations based on similarity metrics. These results validate the reliability and scientific adequacy of our recommendation system.
4. Results and Insights
Based on the analysis of the clusters, which identified distinct engagement patterns across student groups, and the outcomes of the recommendation system, the following educational strategies are proposed to enhance academic achievement:
Cluster 0: Balanced engagement boost—Targeting students with moderate-to-low engagement across all metrics (e.g., discussions, announcements), this strategy focuses on structured interventions, such as weekly interactive quizzes, mandatory resource exploration tasks, and incentivized discussion participation. These steps aim to address the uniformly low engagement profile identified in
Figure 5, fostering a more balanced and proactive learning approach.
Cluster 1: Elevated engagement mastery—For students exhibiting self-driven, high engagement in all dimensions, this strategy emphasizes advanced challenges like peer mentoring roles, interdisciplinary projects, and leadership in discussion forums. These initiatives align with their intrinsic motivation, as shown in
Figure 5, to deepen critical thinking and collaborative excellence.
Cluster 2: Discussion-driven engagement—Capitalizing on this group’s strong preference for discussions, the strategy integrates debate-based assignments and discussion-led resource exploration while introducing gamified announcement interactions to diversify engagement. This balances their collaborative strengths with broader participation.
Cluster 3: Resource-rich engagement—For students highly engaged with resources but less active in discussions/announcements, this strategy leverages their analytical strengths through resource-curation tasks and structured peer feedback sessions. To address communication gaps, automated announcement reminders and discussion prompts are proposed, enhancing the connectivity without disrupting their independent learning style.
These strategies, grounded in silhouette-validated cluster behaviors, ensure personalized alignment with observed engagement patterns, enabling instructors to tailor interventions effectively.
5. Discussion and Implications
This study advanced the integration of educational analytics and pedagogical practice by demonstrating how clustering and recommendation systems can address heterogeneous student needs. The identification of four distinct engagement profiles—validated via silhouette analysis—confirms the efficacy of unsupervised learning in categorizing students. Unlike previous studies that primarily focused on clustering or recommendations separately, our methodology integrates both approaches to enhance personalized learning experiences. The results indicate that the students exhibited varied engagement behaviors, with high-engagement (Cluster 1) and resource-focused (Cluster 3) cohorts underscoring the diversity of learning patterns. By comparing different clustering techniques, we validated that our approach provided more meaningful subgroup identification, allowing for targeted interventions.
These findings directly respond to our research questions, revealing that clustering not only uncovers meaningful subgroups but also enables tailored strategies, such as gamified announcements for discussion-driven learners (Cluster 2) or structured peer feedback for resource-engaged students (Cluster 3). Theoretically, this work extends prior studies, such as
Khalil and Ebner (
2017), by incorporating multidimensional behavioral metrics from the KALBOARD360 dataset, thereby offering a holistic view of engagement while providing statistical validation through multiple clustering evaluation methods.
Practically, the recommendations provide educators with actionable tools to address systemic challenges, such as equity gaps in online learning (Cluster 0) and scalable communication strategies for large cohorts. Furthermore, our study compared multiple recommendation techniques, illustrating that user-based nearest neighbor collaborative filtering optimally aligns with engagement-driven educational strategies. However, the study’s reliance on a single digital platform limits the generalizability to offline contexts, and the absence of purity analysis highlights a need for external validation. Future research should explore hybrid AI models for dynamic recommendations, extend the analysis to diverse educational datasets, and conduct longitudinal studies to validate the long-term efficacy.
These implications are visually supported by the engagement patterns in
Figure 5, which illustrate the behavioral disparities between clusters. Additionally, by extending the scope of educational data mining techniques, our study sets a foundation for further research in adaptive learning and AI-driven interventions.
6. Conclusions
This study underscores the value of combining unsupervised clustering and recommendation systems to address heterogeneity in student engagement within digital learning environments. By analyzing behavioral data from the KALBOARD360 platform, we identified four distinct student cohorts through K-means clustering, validated via silhouette scores (0.40–0.63). These clusters revealed critical disparities in engagement, ranging from self-driven learners (Cluster 1) to resource-focused but socially disengaged students (Cluster 3). The subsequent recommendation system translated these insights into actionable pedagogical strategies, such as incentivized discussions for disengaged cohorts (Cluster 0) and peer mentoring roles for high achievers (Cluster 1), ensuring an alignment between interventions and observed behavioral patterns.
The framework’s strength lies in its ability to bridge data-driven insights with practical pedagogy. However, its reliance on static, platform-specific data highlights opportunities for refinement. Future research should focus on expanding the model to include demographic and socioeconomic variables for richer student profiling, exploring hybrid recommendation approaches such as neural networks to enhance adaptability, and implementing longitudinal studies to empirically validate the long-term impact of proposed strategies. Additionally, dynamic frameworks that update clusters in real-time could better accommodate evolving student behaviors. By addressing these gaps, educators and institutions can leverage AI to cultivate equitable, personalized learning ecosystems that adapt to the diverse needs of modern learners.
This work serves as a blueprint for integrating machine learning into education, demonstrating how computational tools can empower educators to foster engagement, equity, and academic success in increasingly digital classrooms.


