


A Usability Analysis and Consequences of Testing Exploration of the Problem-Solving Measures–Computer-Adaptive Test


Abstract

1. Introduction
2. Literature Review
2.1. Educational Policies: An Overview
2.2. Computer-Adaptive Tests (CATs): The Transition from PSM to PSM-CAT
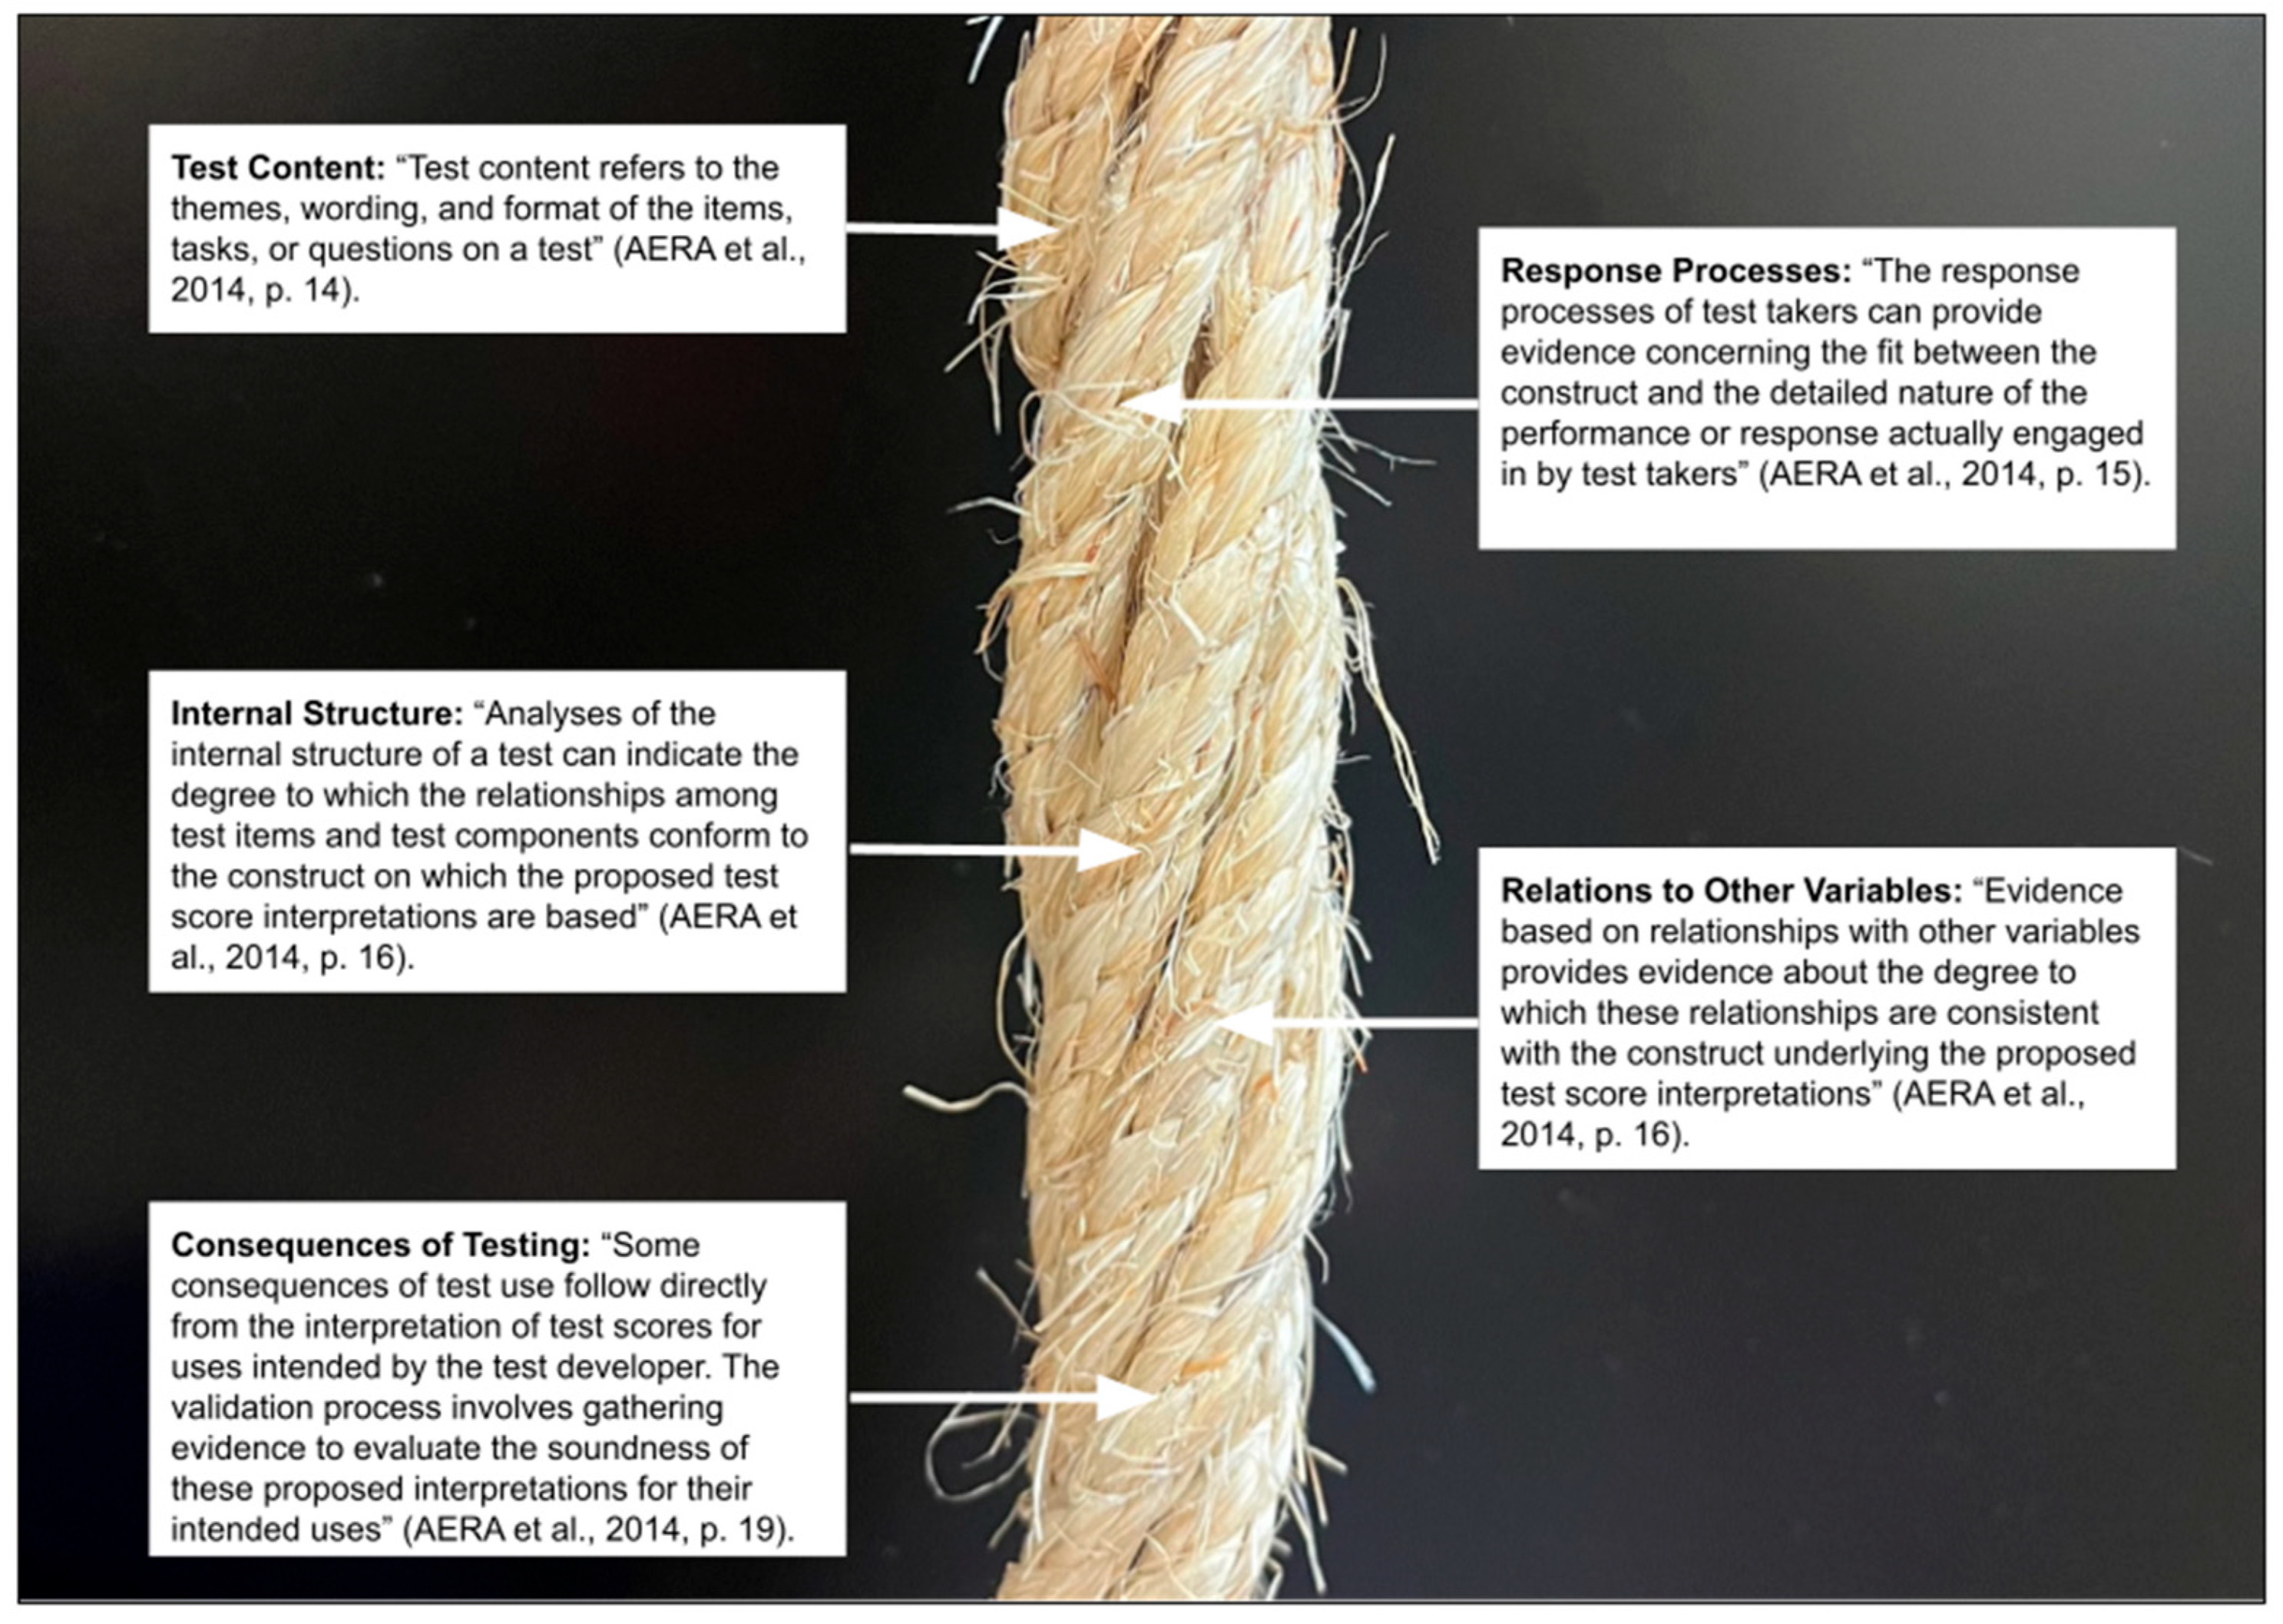
2.3. Validity
2.4. Consequences of Testing
2.5. Assessment Usability Features
3. Materials and Methods
3.1. The Present Survey
3.2. Research Design
3.3. Survey Methods
3.3.1. Participants
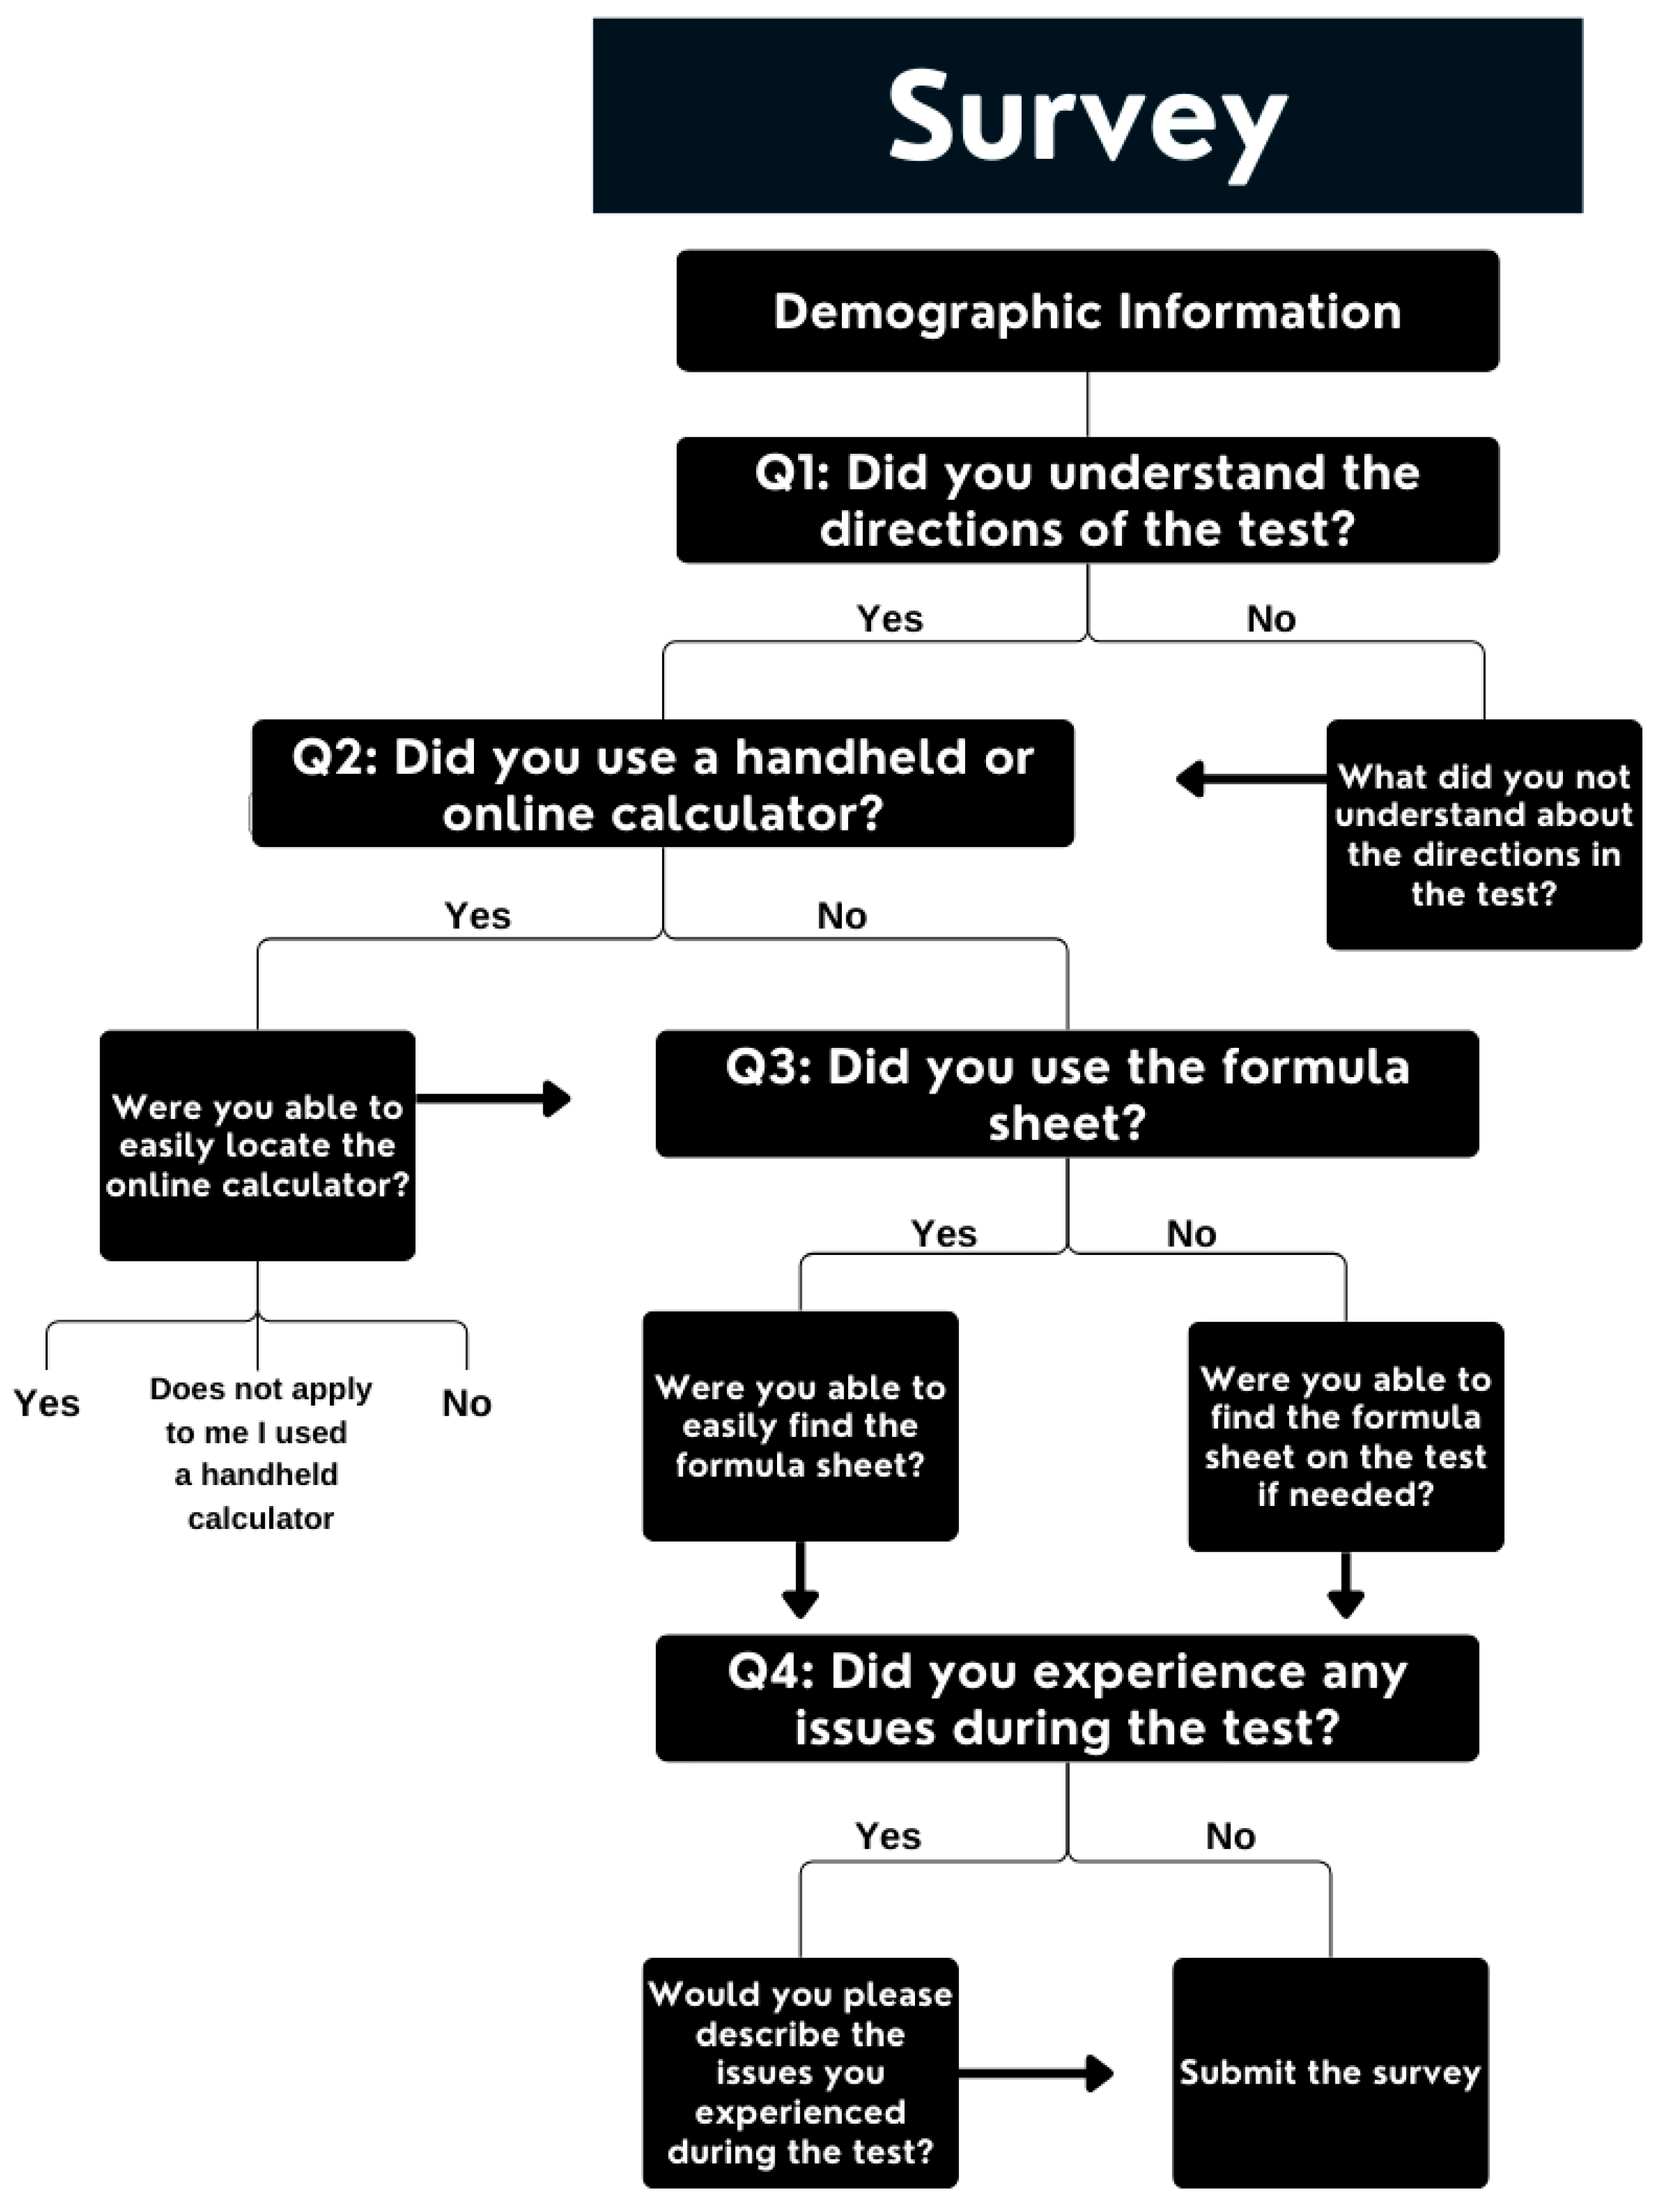
3.3.2. Instrument and Data Collection
3.3.3. Data Analysis
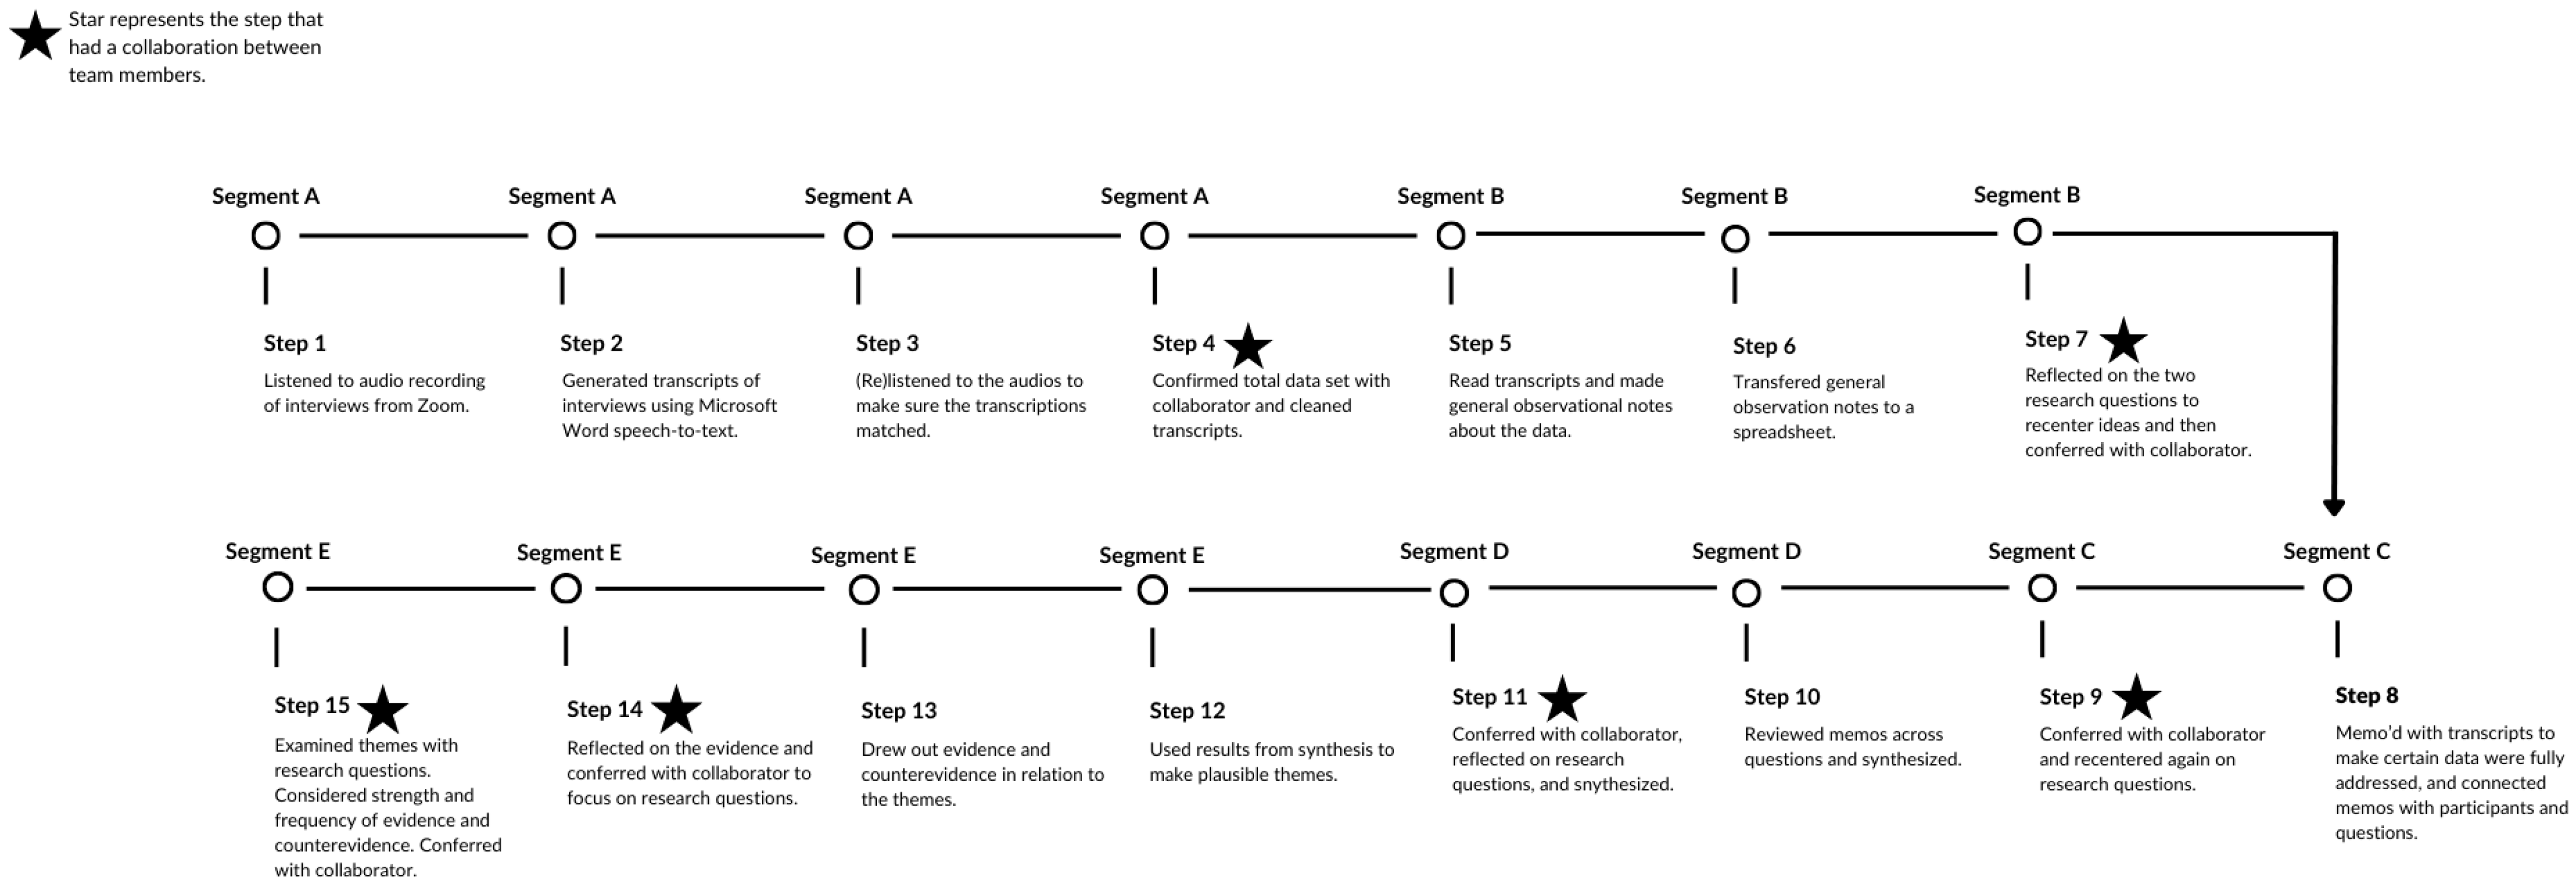
3.4. Interviews: Data Collection and Analysis
4. Results
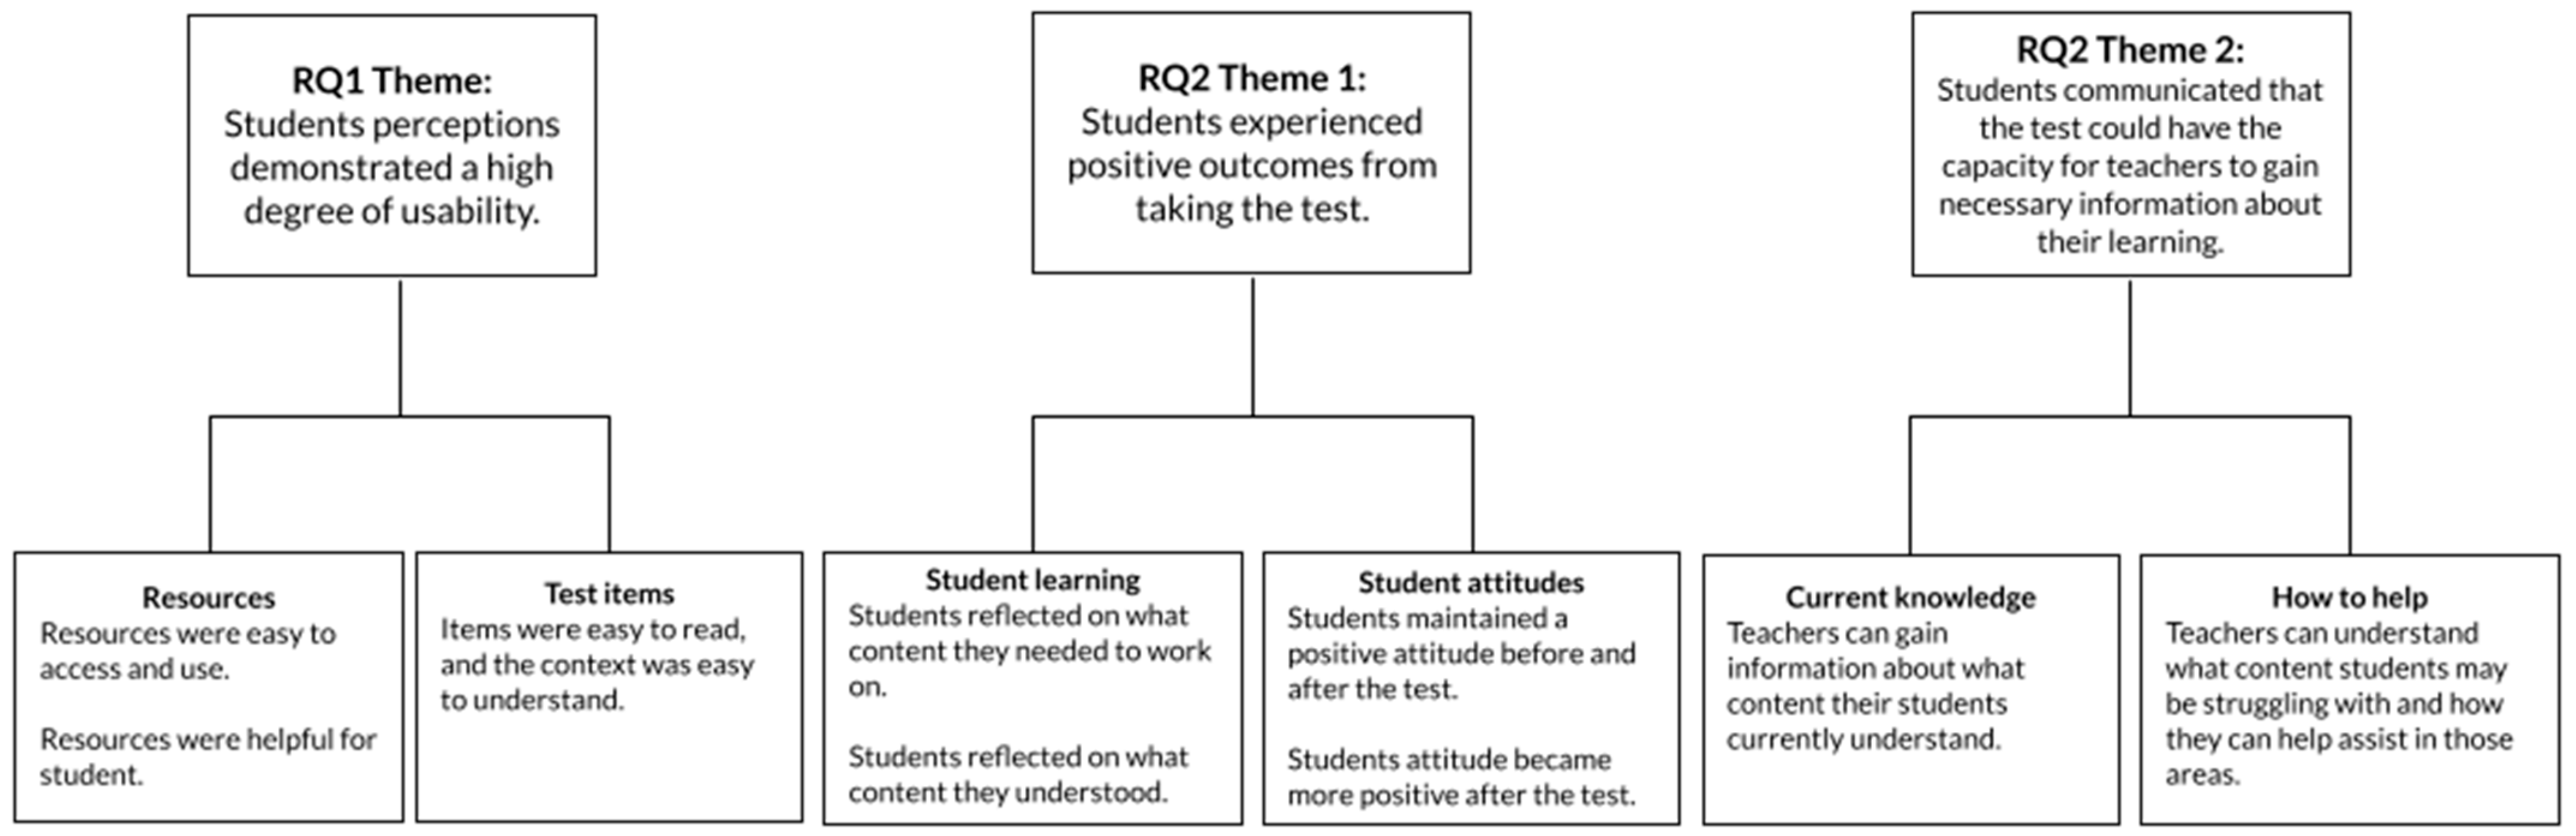
4.1. RQ1: Usability
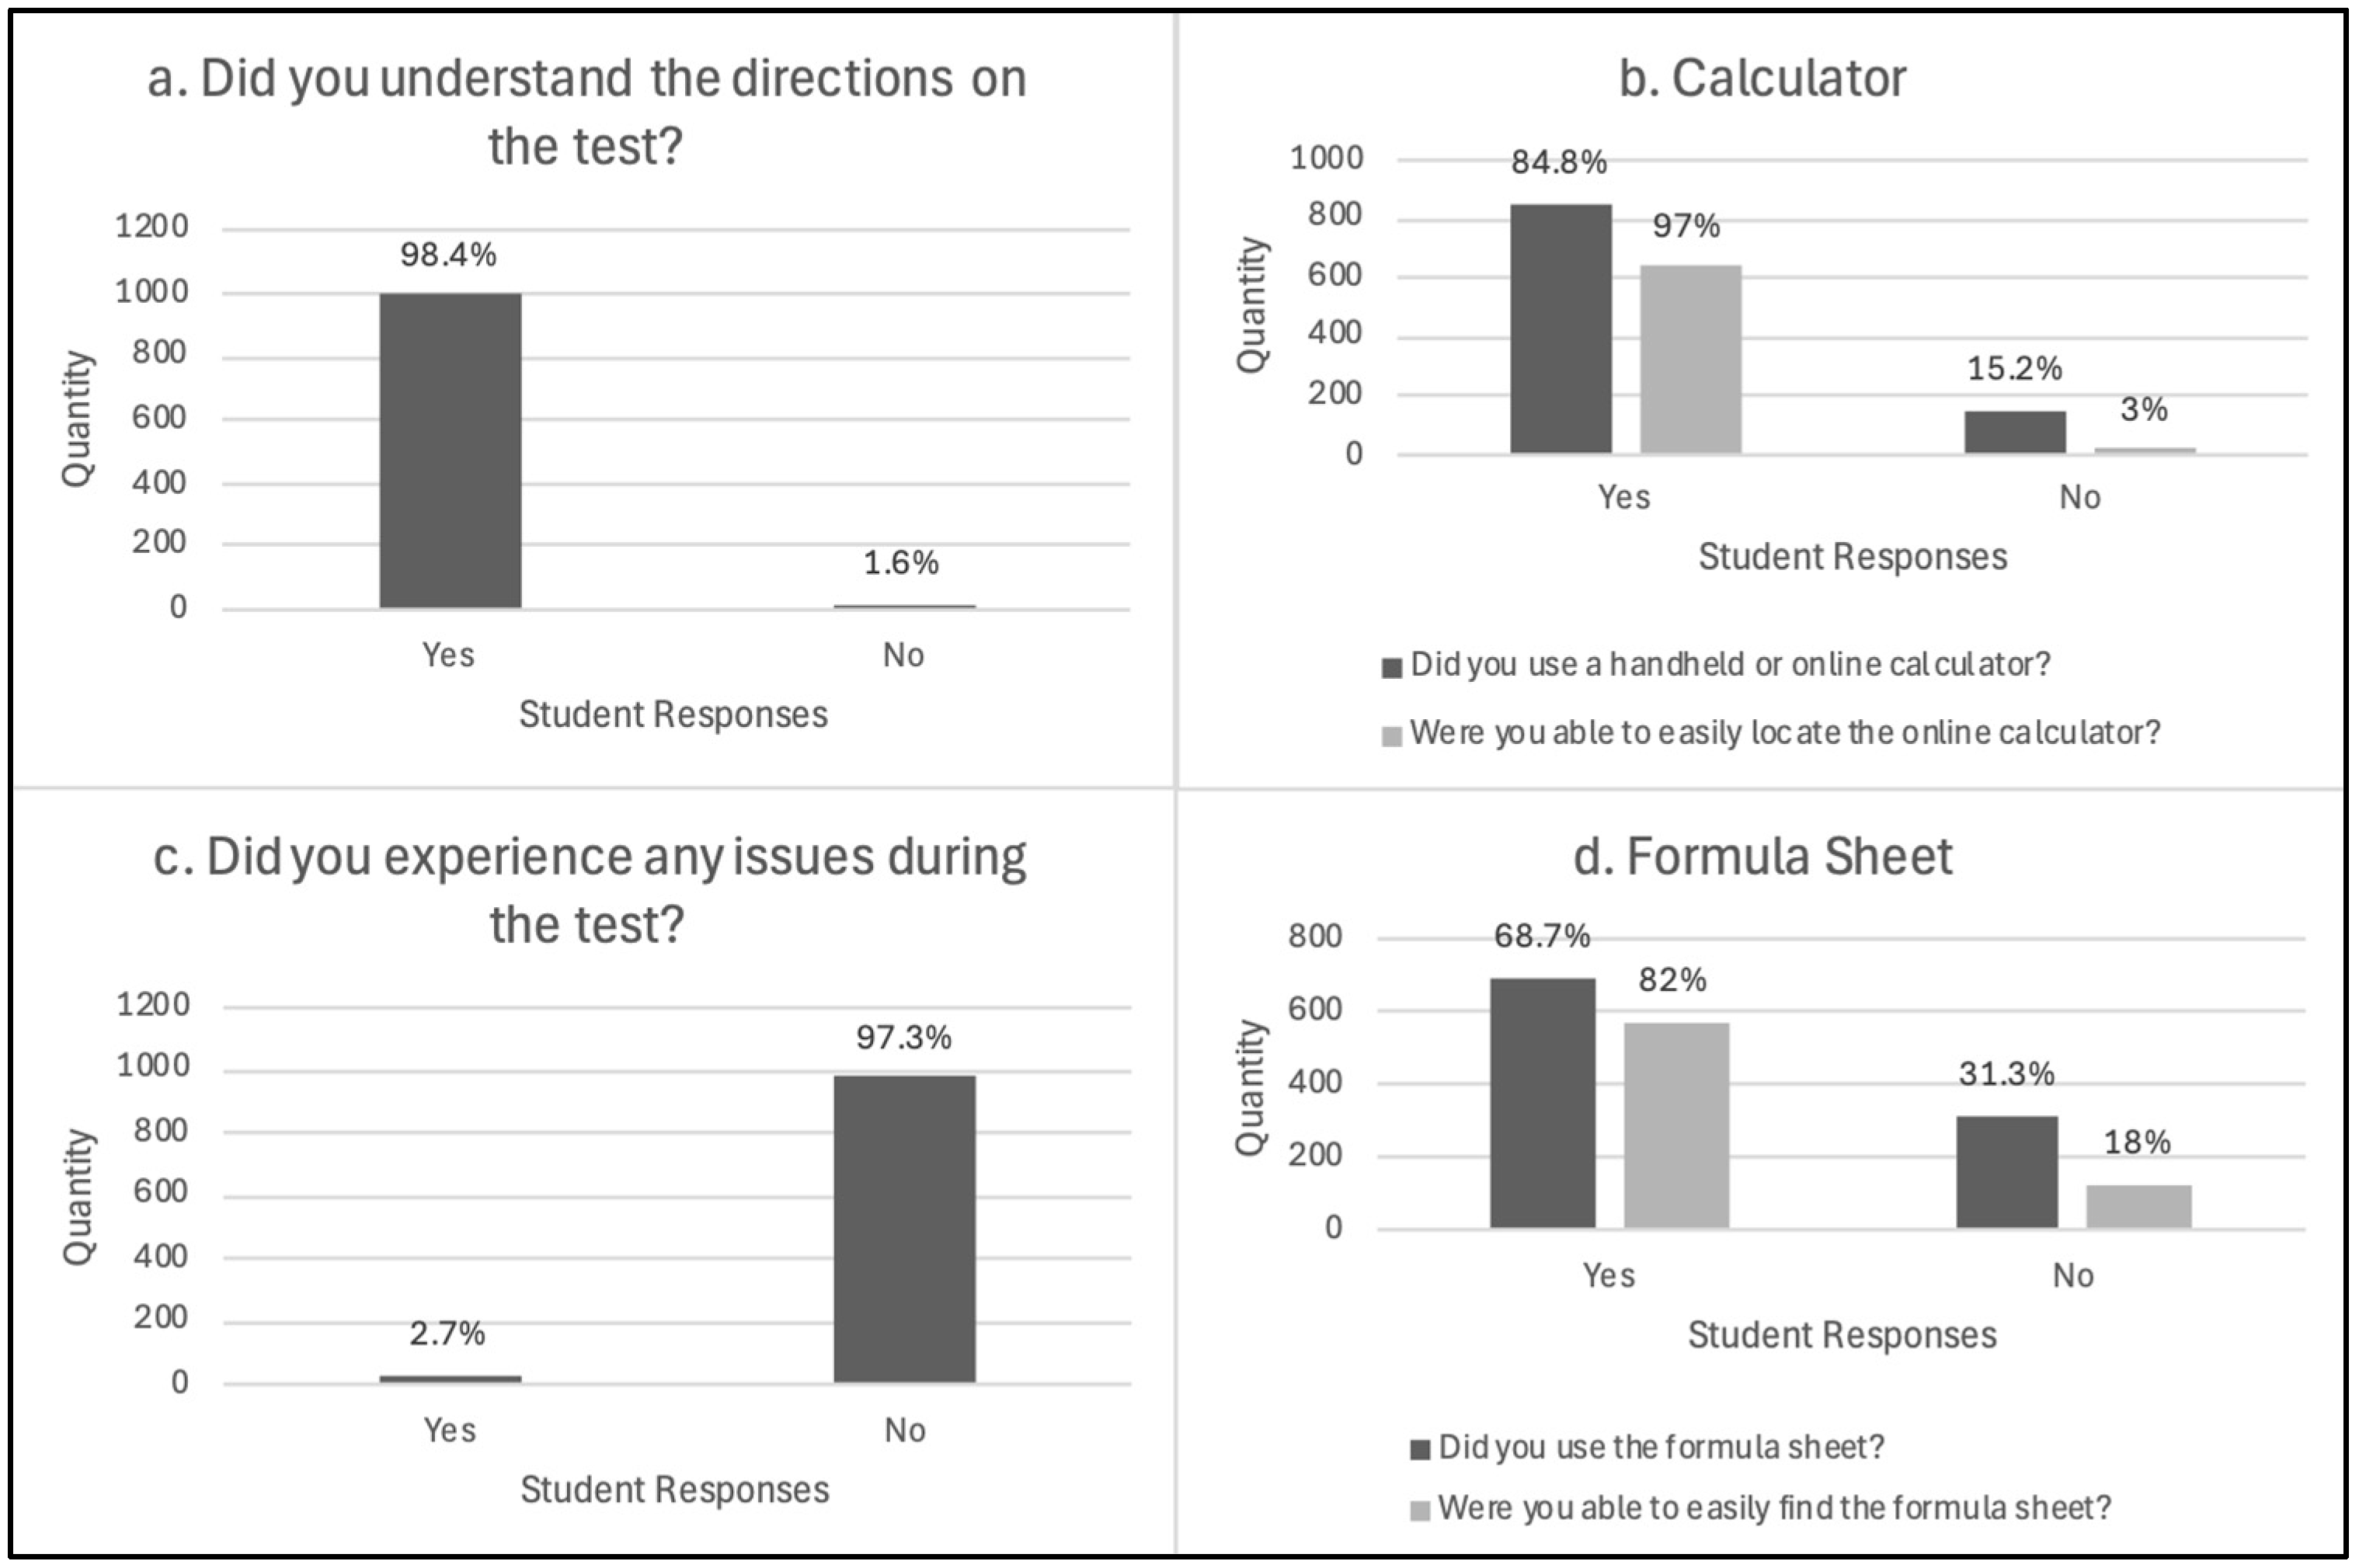
4.1.1. Resources
4.1.2. Test Items
4.2. RQ2: Test Consequences
4.2.1. Outcomes: Student Learning
4.2.2. Outcomes: Student Attitudes
4.2.3. Teachers Gain Knowledge: What Students Know
4.2.4. Teachers Gain Knowledge: How to Help Students
5. Discussion
5.1. Connecting to Consequences of Testing
5.2. Usability Studies in Education Research
5.3. Limitations and Future Directions
Author Contributions
Funding
Institutional Review Board Statement
Informed Consent Statement
Data Availability Statement
Conflicts of Interest
Abbreviations
| CAT | Computer-adaptive test |
| FGD | Focus group discussions |
| IRB | Institutional review board |
| MMR | Mixed methods research |
| USA | United States of America |
Appendix A

References
- American Educational Research Association (AERA), American Psychological Association (APA) & National Council on Measurement in Education (ECME). (2014). Standards for educational and psychological testing. American Educational Research Association. [Google Scholar]
- Black, P., & Wiliam, D. (2010). Inside the black box: Raising standards through classroom assessment. Phi Delta Kappan, 92(1), 81–90. [Google Scholar] [CrossRef]
- Bostic, J. (2023). Engaging hearts and minds in assessment research. School Science and Mathematics Journal, 123(6), 217–219. [Google Scholar] [CrossRef]
- Bostic, J., May, T., Matney, G., Koskey, K., Stone, G., & Folger, T. (2024, March 6–8). Computer adaptive mathematical problem-solving measure: A brief validation report. 51st Annual Meeting of the Research Council on Mathematics Learning (pp. 102–110), Columbia, SC, USA. [Google Scholar]
- Bostic, J., & Sondergeld, T. (2015). Measuring sixth-grade students’ problem solving: Validating an instrument addressing the mathematics Common Core. School Science and Mathematics Journal, 115, 281–291. [Google Scholar] [CrossRef]
- Bostic, J., & Sondergeld, T. (2018). Validating and vertically equating problem-solving measures. In D. Thompson, M. Burton, A. Cusi, & D. Wright (Eds.), Classroom assessment in mathematics: Perspectives from around the globe (pp. 139–155). Springer. [Google Scholar]
- Bostic, J., Sondergeld, T., Folger, T., & Kruse, L. (2017). PSM7 and PSM8: Validating two problem-solving measures. Journal of Applied Measurement, 18(2), 151–162. [Google Scholar]
- Bruder, R. (2021). Comparison of the Abitur examination in mathematics in Germany before and after reunification in 1990. ZDM Mathematics Education, 53, 1515–1527. [Google Scholar] [CrossRef]
- Carney, M., Bostic, J., Krupa, E., & Shih, J. (2022). Interpretation and use statements for instruments in mathematics education. Journal for Research in Mathematics Education, 53(4), 334–340. [Google Scholar] [CrossRef]
- Céspedes-González, Y., Otero Escobar, A. D., Ricárdez Jiménez, J. D., & Molero Castillo, G. (2023, November 6–10). Academic achievement in mathematics of higher-middle education students in veracruz: An approach based on computational intelligence. 11th International Conference in Software Engineering Research and Innovation (CONISOFT) (pp. 177–185), León, Mexico. [Google Scholar] [CrossRef]
- Common Core State Standards Initiative (CCSSI). (2010). Common core standards for mathematics. Available online: http://www.corestandards.org/Math/ (accessed on 5 September 2024).
- Creamer, E. G. (2017). An introduction to fully integrated mixed methods research. SAGE Publications. [Google Scholar]
- Creswell, J. W. (2014). Research design: Quantitative, qualitative, and mixed method approaches (4th ed.). SAGE Publications, Inc. [Google Scholar]
- Creswell, J. W., & Plano Clark, V. L. (2018). Designing and conducting mixed methods research (3rd ed.). SAGE. [Google Scholar]
- Davey, T. (2011). A guide to computer adaptive testing systems. Council of Chief State School Officers. [Google Scholar]
- Denecke, K., Vaaheesan, S., & Arulnathan, A. (2021). A mental health chatbot for regulating emotions (SERMO)—Concept and usability test. IEEE Transactions on Emerging Topics in Computing, 9(3), 1170–1182. [Google Scholar] [CrossRef]
- Estrada-Molina, O., Fuentes-Cancell, D. R., & Morales, A. A. (2022). The assessment of the usability of digital educational resources: An interdisciplinary analysis from two systematic reviews. Education and Information Technologies, 27, 4037–4063. [Google Scholar] [CrossRef]
- Fennell, F., Kobett, B., & Wray, J. (2023). The formative 5 in action, grades K-12. Updated and expanded from the formative 5: Everyday assessment techniques for every math classroom. Corwin. [Google Scholar]
- Heissel, J. A., Adam, E. K., Doleac, J. L., Figlio, D. N., & Meer, J. (2021). Testing, stress, and performance: How students respond physiologically to high-stakes testing. Education Finance and Policy, 16(2), 183–208. [Google Scholar] [CrossRef]
- Hino, K., & Ginshima, F. (2019). Incorporating national assessment into curriculum design and instruction: An approach in Japan. In C. P. Vistro-Yu, C. P. Vistro-Yu, T. L. Toh, & T. L. Toh (Eds.), School mathematics curricula (pp. 81–103). Springer Singapore Pte. Limited. [Google Scholar] [CrossRef]
- Hudson, J., Nguku, S. M., Sleiman, J., Karlen, W., Dumont, G. A., Petersen, C. L., Warriner, C. B., & Ansermino, J. M. (2012). Usability testing of a prototype phone oximeter with healthcare providers in high-and low-medical resource environments. Anaesthesia, 67(9), 957–967. [Google Scholar] [CrossRef]
- Ifeachor, A. P., Ramsey, D. C., Kania, D. S., & White, C. A. (2016). Survey of pharmacy schools to determine methods of preparation and promotion of postgraduate residency training. Currents in Pharmacy Teaching and Learning, 8(1), 24–30. [Google Scholar] [CrossRef]
- Kane, M. (2006). Validation. In R. L. Brennan (Ed.), Educational measurement (4th ed., pp. 17–64). American Council on Education/Praeger. [Google Scholar]
- Kane, M. (2013). Validating the interpretations and uses of test scores. Journal of Educational Measurement, 50(1), 1–73. [Google Scholar] [CrossRef]
- Krupa, E., Bostic, J., Folger, T., & Burkett, K. (2024, November 7–10). Introducing a repository of quantitative measures used in mathematics education. 46th Annual Meeting of the North American Chapter of the International Group for the Psychology of Mathematics Education (pp. 55–64), Cleveland, OH, USA. [Google Scholar]
- Lane, S. (2014). Validity evidence based on testing consequences. Psicothema, 26(1), 127–135. [Google Scholar] [CrossRef]
- Lane, S. (2020). Test-based accountability systems: The importance of paying attention to consequences. ETS Research Report Series, 2020(1), 1–22. [Google Scholar] [CrossRef]
- Lane, S., & Stone, C. A. (2002). Strategies for examining the consequences of assessment and accountability programs. Educational Measurement: Issues and Practice, 21(1), 23–30. [Google Scholar] [CrossRef]
- Lawson, B., & Bostic, J. (2024). An investigation into two mathematics score reports: What do K-12 teachers and staff want? Mid-Western Educational Researcher, 36(1), 12. Available online: https://scholarworks.bgsu.edu/mwer/vol36/iss1/12 (accessed on 18 December 2024).
- Lee, E. (2020). Evaluating test consequences based on ESL students’ perceptions: An appraisal analysis. Columbia University Libraries and Applied Linguistics and TESOL at Teachers College, 20(1), 1–22. [Google Scholar] [CrossRef]
- Lesh, R., & Zawojewski, J. S. (2007). Problem solving and modeling. In F. Lester (Ed.), Second handbook of research on mathematics teaching and learning (pp. 763–804). Information Age Publishing. [Google Scholar]
- Maphalala, M. C., & Khumalo, N. (2018). Standardised testing in South Africa: The annual national assessments under the microscope. ResearchGate. Available online: https://www.researchgate.net/publication/321951815 (accessed on 12 May 2025).
- Martin, A. J., & Lazendic, G. (2018). Computer-adaptive testing: Implications for students’ achievement, motivation, engagement, and subjective test experience. Journal of Educational Psychology, 110(1), 27. [Google Scholar] [CrossRef]
- McGatha, M. B., & Bush, W. S. (2013). Classroom assessment in mathematics. In SAGE handbook of research on classroom assessment (pp. 448–460). SAGE. [Google Scholar]
- Messick, S. (1989). Validity. In R. L. Linn (Ed.), Educational measurement (3rd ed., pp. 13–103). Macmillan. [Google Scholar]
- Miles, M., Huberman, A. M., & Saldaña, J. (2014). Qualitative data analysis: A methods sourcebook (3rd ed.). Sage. [Google Scholar]
- Naveh, K. (2004). Matriculation in a new millennium: Analysis of a constructivist educational reform in Israeli high-schools [Doctoral dissertation, University of Leicester and ProQuest Dissertations Publishing]. Available online: https://www.proquest.com/docview/U190040 (accessed on 2 December 2024).
- O’Regan, S., Molloy, E., Watterson, L., & Nestel, D. (2020). ‘It is a different type of learning’. A survey-based study on how simulation educators see and construct observer roles. BMJ Simulation & Technology Enhanced Learning, 7(4), 230–238. [Google Scholar] [CrossRef] [PubMed] [PubMed Central]
- Saad, M., Zia, A., Raza, M., Kundi, M., & Haleem, M. (2022). A comprehensive analysis of healthcare websites usability features, testing techniques and issues. Institute of Electrical and Electronics Engineers, 10, 97701–97718. [Google Scholar] [CrossRef]
- Schoenfeld, A. (2011). How we think: A theory of goal-oriented decision making and its educational applications. Routledge. [Google Scholar]
- Schoenfeld, A. H. (2015). Summative and formative assessments in mathematics supporting the goals of the Common Core Standards. Theory Into Practice, 54(3), 183–194. [Google Scholar] [CrossRef]
- Sireci, S., & Benitez, I. (2023). Evidence for test validation: A guide for practitioners. Psicotherma, 35(3), 217–226. [Google Scholar] [CrossRef] [PubMed]
- Thielemans, L., Hashmi, A., Priscilla, D. D., Paw, M. K., Pimolsorntong, T., Ngerseng, T., Overmeire, B. V., Proux, S., Nosten, F., McGready, R., Carrara, V. I., & Bancone, G. (2018). Laboratory validation and field usability assessment of a point-of-care test for serum bilirubin levels in neonates in a tropical setting. Wellcome Open Research, 3, 110. [Google Scholar] [CrossRef]
- Uko, M. P., Eluwa, I., & Uko, P. J. (2024). Assessing the potentials of compurized adaptive testing to enhance mathematics and science student’t achievement in secondary schools. European Journal of Theoretical and Applied Sciences, 2(4), 85–100. [Google Scholar] [CrossRef] [PubMed]
- Verschaffel, L., De Corte, E., Lasure, S., Van Vaerenbergh, G., Bogaerts, H., & Ratinckx, E. (1999). Learning to solve mathematical application problems: A design experiment with fifth graders. Mathematical Thinking and Learning, 1, 195–229. [Google Scholar] [CrossRef]
- Wainer, H., & Lewis, C. (1990). Toward a psychometrics for testlets. Journal of Educational Measurement, 27(1), 1–14. [Google Scholar] [CrossRef]
- White House. (2025). Ending radical and wasteful government DEI programs and preferencing [Presidential executive order]. The White House. [Google Scholar]


| Demographic Type | Demographic Information | Participants in the Survey | Participants in the Interviews |
|---|---|---|---|
| Sex | Male | 467 (46%) | 60 (49.6%) |
| Female | 515 (51%) | 59 (48.7%) | |
| Prefer not to say | 28 (3%) | 2 (1.7%) | |
| Race/Ethnicity | White/Caucasian | 606 (60%) | 75 (62%) |
| Hispanic/Latino | 140 (13.8%) | 16 (13.2%) | |
| Asian/Pacific Islander/Hawaiian | 71 (7%) | 7 (5.8%) | |
| Black/African American | 54 (5.4%) | 4 (3.3%) | |
| Mixed/Biracial | 117 (11.6%) | 14 (11.6%) | |
| Other | 22 (2.2%) | 5 (4.1%) | |
| Grade Level | Sixth Grade | 264 (26.1%) | 25 (20.6%) |
| Seventh Grade | 351 (34.8%) | 52 (43%) | |
| Eighth Grade | 395 (39.1%) | 44 (36.4%) | |
| Location | Pacific | 282 (28%) | 44 (36.4%) |
| Mountain West | 477 (47.2%) | 38 (31.4%) | |
| Midwest | 251 (24.8%) | 39 (32.2%) |
Disclaimer/Publisher’s Note: The statements, opinions and data contained in all publications are solely those of the individual author(s) and contributor(s) and not of MDPI and/or the editor(s). MDPI and/or the editor(s) disclaim responsibility for any injury to people or property resulting from any ideas, methods, instructions or products referred to in the content. |
© 2025 by the authors. Licensee MDPI, Basel, Switzerland. This article is an open access article distributed under the terms and conditions of the Creative Commons Attribution (CC BY) license (https://creativecommons.org/licenses/by/4.0/).
Share and Cite
King, S.G.; Bostic, J.D.; May, T.A.; Stone, G.E. A Usability Analysis and Consequences of Testing Exploration of the Problem-Solving Measures–Computer-Adaptive Test. Educ. Sci. 2025, 15, 680. https://doi.org/10.3390/educsci15060680
King SG, Bostic JD, May TA, Stone GE. A Usability Analysis and Consequences of Testing Exploration of the Problem-Solving Measures–Computer-Adaptive Test. Education Sciences. 2025; 15(6):680. https://doi.org/10.3390/educsci15060680
Chicago/Turabian StyleKing, Sophie Grace, Jonathan David Bostic, Toni A. May, and Gregory E. Stone. 2025. "A Usability Analysis and Consequences of Testing Exploration of the Problem-Solving Measures–Computer-Adaptive Test" Education Sciences 15, no. 6: 680. https://doi.org/10.3390/educsci15060680
APA StyleKing, S. G., Bostic, J. D., May, T. A., & Stone, G. E. (2025). A Usability Analysis and Consequences of Testing Exploration of the Problem-Solving Measures–Computer-Adaptive Test. Education Sciences, 15(6), 680. https://doi.org/10.3390/educsci15060680