
Measuring Personalized Learning in the Smart Classroom Learning Environment: Development and Validation of an Instrument


Abstract
:1. Introduction
1.1. Personalized Learning in Smart Classrooms
1.2. Constructivism
1.3. Pedagogy–Space–Technology Framework
1.3.1. Pedagogy
1.3.2. Learning Spaces
1.3.3. Technology
1.4. Summary of Research Rationale
2. Method
2.1. Development Process of Smart Classroom Personalized Learning Scale (SCE-PL)
2.2. Sampling Frame and Participants
2.3. Data Collection
2.4. Data Preparation
2.5. Data Analysis
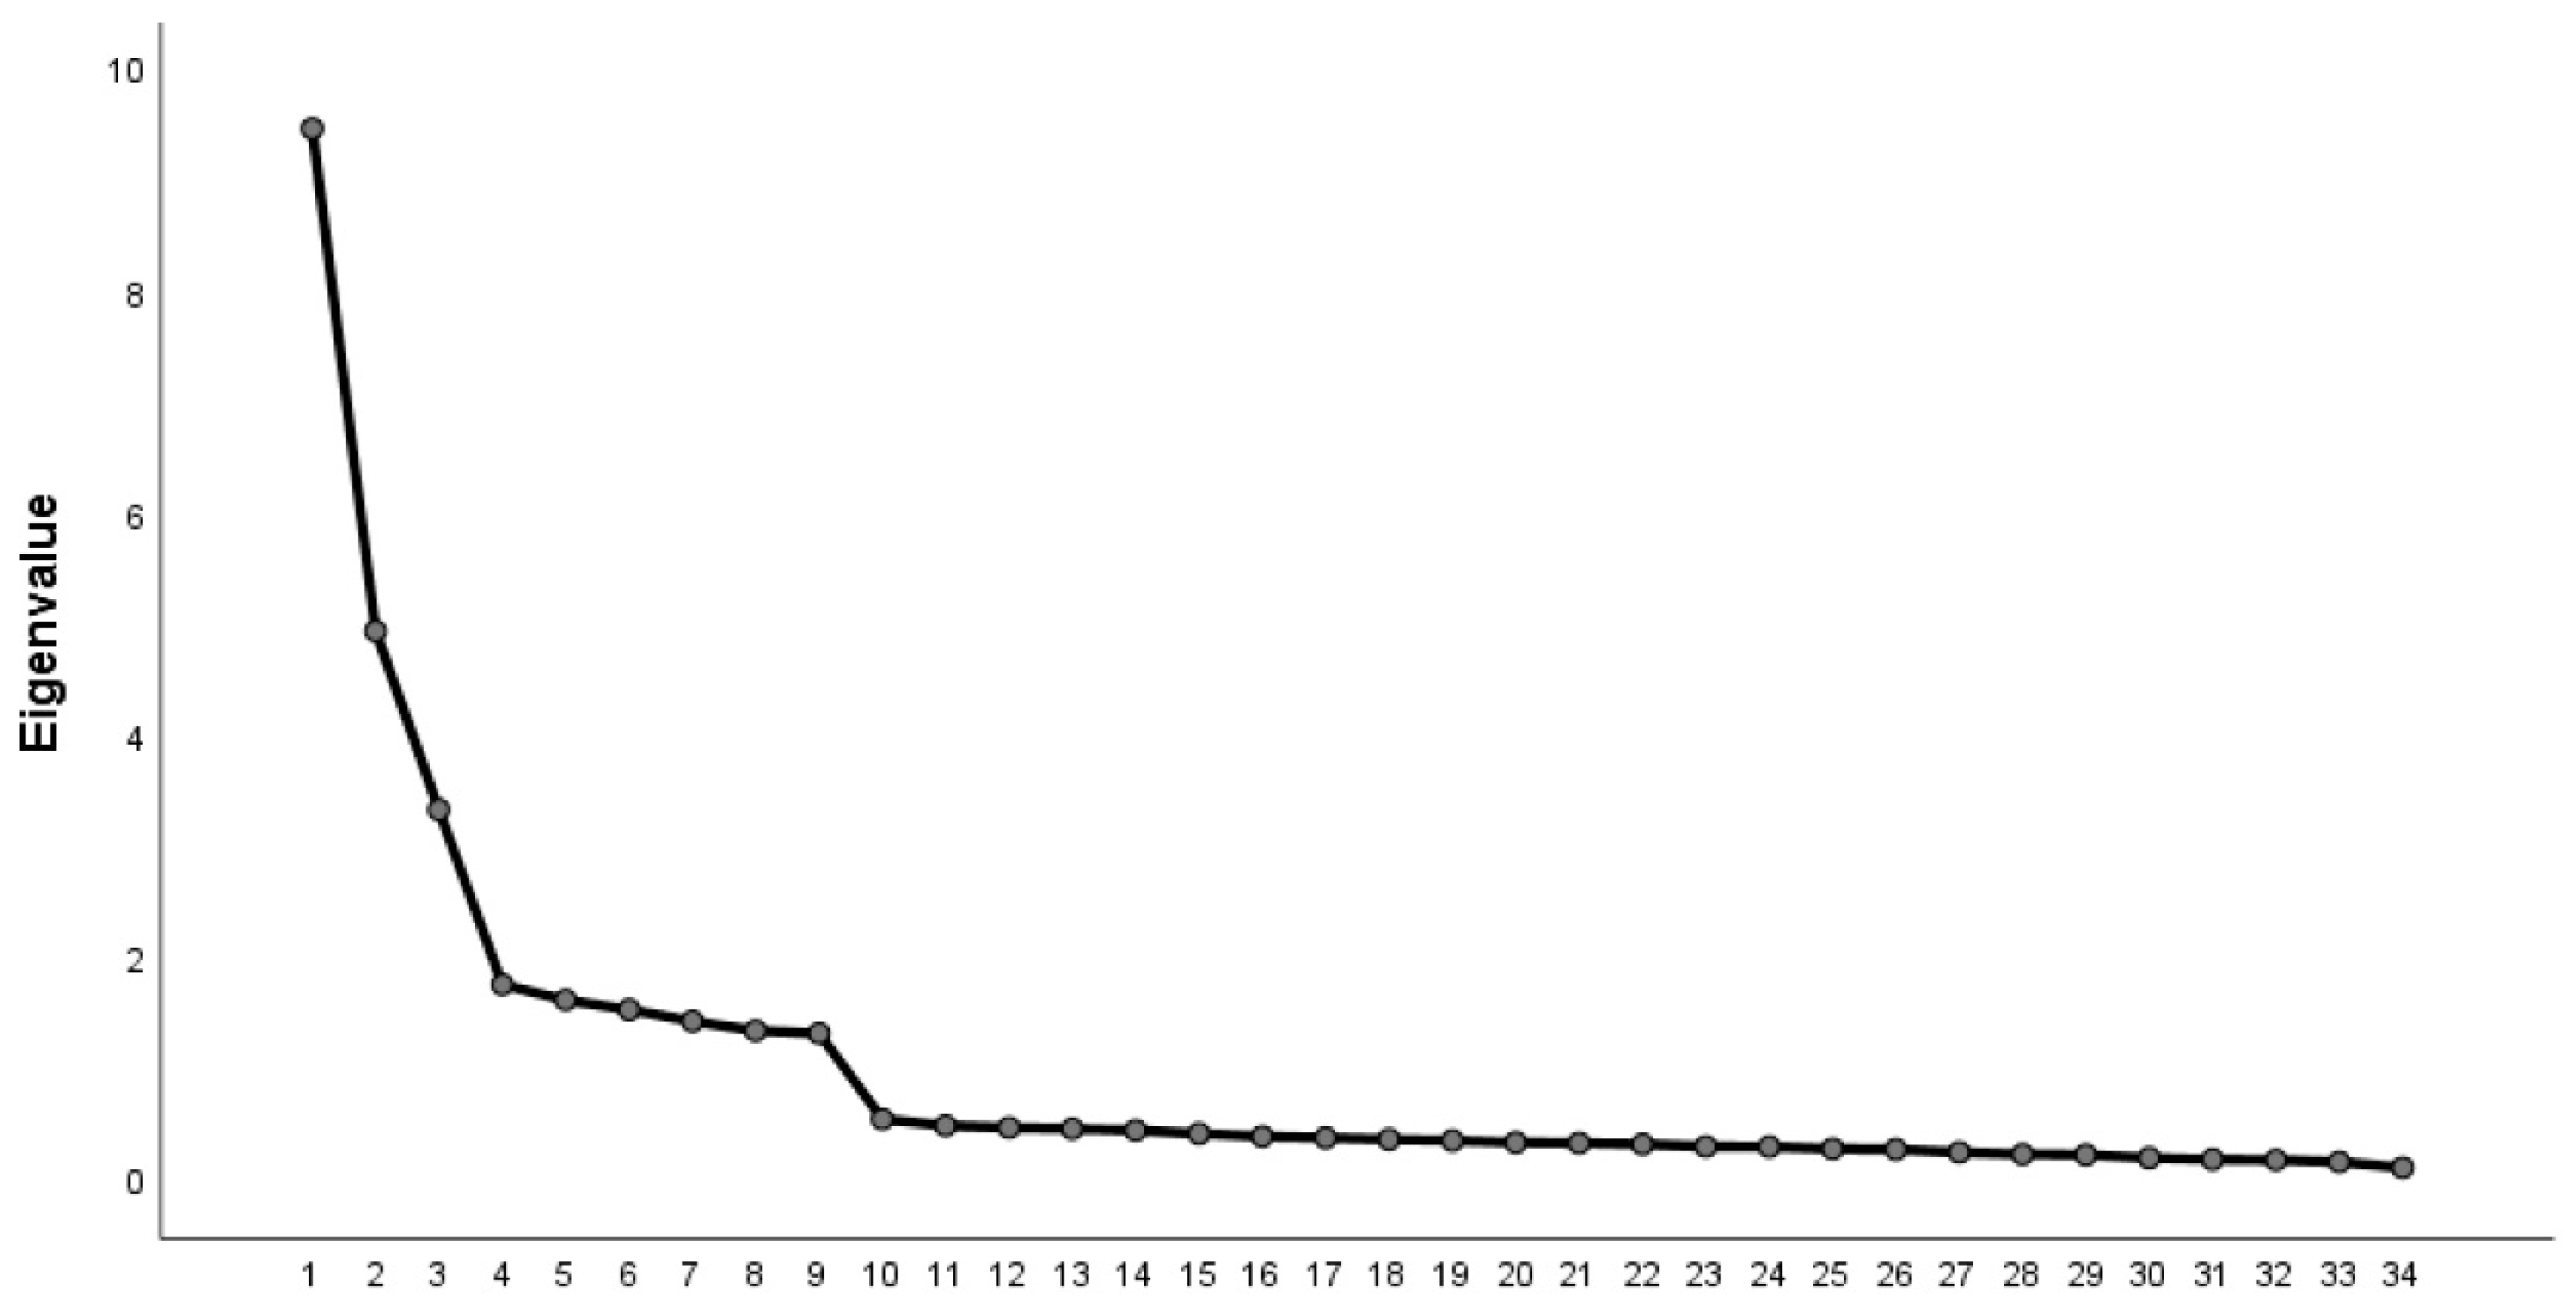
3. Results
4. Discussion
Author Contributions
Funding
Institutional Review Board Statement
Informed Consent Statement
Data Availability Statement
Conflicts of Interest
Abbreviations
| AERA | American Educational Research Association |
| APA | American Psychological Association |
| AR | Access to Resources |
| AVE | Average Variance Extracted |
| CFA | Confirmatory Factor Analysis |
| CR | Composite Reliability |
| CRG | Clear and Relevant Goals |
| DA | Device Access |
| EFA | Exploratory Factor Analysis |
| EQ | Environmental Quality |
| FMM | Flexible Instructional Methods and Materials |
| IDS | Intelligent Diagnosis and Services |
| KMO | Kaiser–Meyer–Olkin |
| LD | Layout and Display |
| MDPI | Multidisciplinary Digital Publishing Institute |
| PST | Pedagogy–Space–Technology |
| SC | Smart Classroom |
| SCE_PL | Smart Classroom Environment–Personalized Learning |
| SLV | Supporting Learner Variability |
| TEL | Technology-Enhanced Personalized Learning |
| TMC | Traditional Multimedia Classrooms |
| TPM | Timely Progress Monitoring |
Appendix A

| Items | 1 | 2 | 3 | 4 | 5 |
|---|---|---|---|---|---|
| 1. The teacher sets personalized learning goals for me based on my learning data. | |||||
| 2. I clearly understand the learning objectives of each smart classroom lesson. | |||||
| 3. The smart platform or smart devices (such as tablets, laptops, etc.) recommend suitable learning tasks to help me achieve the learning goals. | |||||
| 4. The teacher provides feedback on my progress toward achieving learning goals through the smart platform. | |||||
| 5. The smart classroom offers learning content and resources that I am interested in. | |||||
| 6. The teacher provides multiple learning content options through the smart platform, and I can choose the most suitable content based on my interests and needs. | |||||
| 7. The teacher uses smart tools (such as online resource libraries and learning path recommendation systems) to recommend diverse learning materials (such as videos, articles, exercises, etc.) for me. | |||||
| 8. I can participate in the course in different ways (such as online discussions, virtual experiments, group collaboration, etc.) through the smart platform or smart devices. | |||||
| 9. The teacher offers various ways to showcase learning outcomes (such as text, charts, videos, etc.) via the smart platform, allowing me to choose the most appropriate method. | |||||
| 10. The smart platform or smart devices provide abundant learning resources and materials, allowing me to flexibly choose the most suitable learning approach. | |||||
| 11. The teacher monitors my learning progress in real time through the smart platform and adjusts the teaching content and methods accordingly. | |||||
| 12. When I make mistakes in class, the teacher provides more accurate guidance based on the diagnostic feedback from the smart platform. | |||||
| 13. The teacher checks my learning progress in real time through the smart platform and provides timely feedback. | |||||
| 14. The teacher regularly checks my progress on completing learning tasks through the smart platform. | |||||
| 15. The teacher designs personalized learning tasks based on my learning data to help me better understand the course topics. | |||||
| 16. The teacher provides me with challenging tasks suited to my learning level through the smart platform. | |||||
| 17. The teacher uses smart tools (such as group functions) to help me collaborate with classmates to meet my personalized learning needs. | |||||
| 18. The teacher adjusts teaching strategies based on learning analysis reports from the smart platform to ensure that each student learns in the most suitable way. | |||||
| 19. The classroom has sufficient natural light, allowing me to see the blackboard and textbooks more clearly, which enhances my learning experience. | |||||
| 20. I can adjust the temperature of the smart classroom according to my needs, ensuring comfort without distractions. | |||||
| 21. I can adjust the brightness of the classroom lighting as needed, making the learning environment more comfortable. | |||||
| 22. The classroom’s sound system ensures that I can clearly hear the teacher’s explanations. | |||||
| 23. I find the seating in the classroom very comfortable, which helps me focus on learning. | |||||
| 24. The seating arrangement in the classroom is flexible, allowing me to move in and out easily and interact with others. | |||||
| 25. I can easily adjust the position of smart devices to participate in different types of learning activities. | |||||
| 26. The desk size is just right, providing enough space for textbooks, smart devices, and other materials. | |||||
| 27. The layout of the classroom’s central control system, interactive whiteboard, and smart projectors is well-organized, suitable for both teaching and learning. | |||||
| 28. I can easily use the smart devices provided by the school for learning. | |||||
| 29. The smart devices provided by the school are high-quality and capable of supporting a variety of learning tasks. | |||||
| 30. I can continue learning at home using the smart devices or smart platform provided by the school. | |||||
| 31. The school regularly updates and maintains the smart devices to ensure they are functioning properly. | |||||
| 32. I can easily access the learning resources recommended by the teacher (such as videos, articles, exercises, etc.) through the smart platform or smart devices. | |||||
| 33. I can access supplementary learning resources related to the course content through the smart platform or smart devices. | |||||
| 34. I can share learning resources with other classmates through the smart platform or smart devices. | |||||
| 35. The smart platform generates a personalized list of learning resources to help me complete learning tasks more effectively. | |||||
| 36. The smart platform or smart devices automatically analyze my learning weaknesses based on my learning data (such as quiz results, study time, etc.). | |||||
| 37. When I encounter learning difficulties, the smart platform or smart devices recommend suitable learning resources or solutions to assist me. | |||||
| 38. The smart platform or smart devices generate a personalized learning report to help me track my learning progress. | |||||
| 39. After completing learning tasks, the smart platform or smart devices provide detailed error analysis and improvement suggestions. |
References
- AERA. (2011). AERA code of ethics: American educational research association approved by the AERA council February 2011. Educational Researcher, 40(3), 145–156. [Google Scholar] [CrossRef]
- APA. (2017). Ethical principles of psychologists and code of conduct. American Psychological Association. Available online: https://www.apa.org/ethics/code/ethics-code-2017.pdf (accessed on 20 February 2025).
- Basham, J. D., Hall, T. E., Carter, R. A., & Stahl, W. M. (2016). An operationalized understanding of personalized learning. Journal of Special Education Technology, 31(3), 126–136. [Google Scholar] [CrossRef]
- Blumer, H. (1966). Sociological implications of the thought of George Herbert mead. American Journal of Sociology, 71, 535–544. [Google Scholar] [CrossRef]
- Bryant, A., & Charmaz, K. (2007). Grounded theory research: Methods and practices. In A. Bryant, & K. Charmaz (Eds.), The SAGE handbook of grouded theory (pp. 1–28). Sage. [Google Scholar]
- Bulger, M. (2016). Personalized learning: The conversations we’re not having. Data and Society, 22(1), 1–29. Available online: https://www.datasociety.net/pubs/ecl/PersonalizedLearning_primer_2016.pdf (accessed on 18 February 2025).
- Charmaz, K. (2006). Constructing grounded theory: A practical guide through qualitative analysis. Sage. [Google Scholar]
- Charmaz, K. (2021). The genesis, grounds, and growth of constructivist grounded theory. In J. M. Morse, B. J. Bowers, K. Charmaz, A. E. Clarke, J. Corbin, C. J. Porr, & P. N. Stern (Eds.), Developing grounded theory: The second generation revisited (2nd ed., pp. 153–187). Routledge. [Google Scholar] [CrossRef]
- Chatti, M. A., Agustiawan, M. R., Jarke, M., & Specht, M. (2010). Toward a personal learning environment framework. International Journal of Virtual and Personal Learning Environments (IJVPLE), 1(4), 66–85. [Google Scholar] [CrossRef]
- Chen, C.-M., Lee, H.-M., & Chen, Y.-H. (2005). Personalized e-learning system using item response theory. Computers & Education, 44(3), 237–255. [Google Scholar] [CrossRef]
- Chen, S. Y., Huang, P.-R., Shih, Y.-C., & Chang, L.-P. (2016). Investigation of multiple human factors in personalized learning. Interactive Learning Environments, 24(1), 119–141. [Google Scholar] [CrossRef]
- Chen, S. Y., & Macredie, R. (2010). Web-based interaction: A review of three important human factors. International Journal of Information Management, 30(5), 379–387. [Google Scholar] [CrossRef]
- Cheng, C. C., & Carolyn Yang, Y. T. (2023). Impact of smart classrooms combined with student-centered pedagogies on rural students’ learning outcomes: Pedagogy and duration as moderator variables. Computers and Education, 207, 104911. [Google Scholar] [CrossRef]
- Cheung, S. K. S., Kwok, L. F., Phusavat, K., & Yang, H. H. (2021). Shaping the future learning environments with smart elements: Challenges and opportunities. International Journal of Educational Technology in Higher Education, 18(1), 16. [Google Scholar] [CrossRef]
- Dai, D. Y., & Chen, F. (2013). Three paradigms of gifted education: In search of conceptual clarity in research and practice. Gifted Child Quarterly, 57(3), 151–168. [Google Scholar] [CrossRef]
- Dai, D. Y., Swanson, J. A., & Cheng, H. (2011). State of research on giftedness and gifted education: A survey of empirical studies published during 1998–2010 (April). Gifted Child Quarterly, 55(2), 126–138. [Google Scholar] [CrossRef]
- DeVellis, R. F. (1991). Scale development: Theory and applications. Sage Publications, Inc. [Google Scholar]
- Diefes-Dux, H. A. (2019). Student self-reported use of standards-based grading resources and feedback. European Journal of Engineering Education, 44(6), 838–849. [Google Scholar] [CrossRef]
- EDUCASE Learning Initiative. (2021). Learning space rating system. Available online: https://www.educause.edu/focus-areas-and-initiatives/teaching-and-learning-program/initiatives/learning-space-rating-system (accessed on 21 February 2025).
- Fake, H., & Dabbagh, N. (2020). Personalized learning within online workforce learning environments: Exploring implementations, obstacles, opportunities, and perspectives of workforce leaders. Technology, Knowledge and Learning, 25(4), 789–809. [Google Scholar] [CrossRef]
- Fan, J. (2024). Construction and application of English smart classroom teaching model integrating MOOC and flipped classroom. Applied Mathematics and Nonlinear Sciences, 9(1), 398–414. [Google Scholar] [CrossRef]
- Farkas, G. (2003). Cognitive skills and noncognitive traits and behaviors in stratification processes. Annual Review of Sociology, 29, 541–562. [Google Scholar] [CrossRef]
- Fraser, B. J. (1998). Classroom environment instruments: Development, validity and applications. Learning Environments Research, 1, 7–34. [Google Scholar] [CrossRef]
- Gambo, Y., & Shakir, M. Z. (2023). Evaluating students’ experiences in self-regulated smart learning environment. Education and Information Technologies, 28(1), 547–580. [Google Scholar] [CrossRef]
- Glaser, B. G., & Strauss, A. L. (1964). Awareness contexts and social interaction. American Sociological Review, 29(5), 669–679. [Google Scholar] [CrossRef]
- Göncz, L. (2017). Teacher personality: A review of psychological research and guidelines for a more comprehensive theory in educational psychology. Open Review of Educational Research, 4(1), 75–95. [Google Scholar] [CrossRef]
- Gruijters, S. L. K. (2019). Using principal component analysis to validate psychological scales: Bad statistical habits we should have broken yesterday II. The European Health Psychologist, 20(5), 544–549. [Google Scholar] [CrossRef]
- Hair, J. F., Black, W. C., Babin, B. J., Anderson, R. E., & Tatham, R. L. (2010). Multivariate data analysis (Vol. 5). Prentice-Hall. [Google Scholar]
- Hambleton, R. K. (2005). Issues, designs, and techinical guidelenes for adapting tests into multiple languages and cultures. In R. K. Hambleton, P. F. Merand, & C. D. Spielberger (Eds.), Adapting educational and psychological tests for cross-cultural assessment. Lawrence Erlbaum Associates Inc. Publishers. [Google Scholar]
- Härdle, W. K., & Simar, L. (2015). Applied multivariate statistical anaylsis (4th ed.). Springer. [Google Scholar] [CrossRef]
- Hinkin, T. R. (1995). A review of scale development practices in the study of organizations. Journal of Management, 21(5), 967–988. [Google Scholar] [CrossRef]
- Holmes, W., Anastopoulou, S., Schaumburg, H., & Mavrikis, E. (2018). Technology-enhanced personalised learning: Untangling the evidence. Robert Bosch Stiftung. [Google Scholar]
- Hu, Y., Huang, J., & Kong, F. (2022). College students’ learning perceptions and outcomes in different classroom environments: A community of inquiry perspective. Frontiers in Psychology, 13, 1047027. [Google Scholar] [CrossRef]
- Huber, S. A., & Seidel, T. (2018). Comparing teacher and student perspectives on the interplay of cognitive and motivational-affective student characteristics. PLoS ONE, 13(8), e0200609. [Google Scholar] [CrossRef]
- Huck, S. W., Cormier, W. H., & Bounds, W. G. (1974). Reading statistics and research. Harper & Row. [Google Scholar]
- Kaur, A., & Bhatia, M. (2022). Smart classroom: A review and research agenda. IEEE Transactions on Engineering Management, 71, 2430–2446. [Google Scholar] [CrossRef]
- Keefe, J. W., & Jenkins, J. M. (2008). Personalized instruction: The key to student achievement (2nd ed.). Rowman & Littlefield Education. [Google Scholar]
- Kell, H. J. (2018). Noncognitive proponents’ conflation of “cognitive skills” and “cognition” and its implications. Personality and Individual Differences, 134(2018), 25–32. [Google Scholar] [CrossRef]
- Ketscher, L., Stoeger, H., Vialle, W., & Ziegler, A. (2025). Same classroom, different reality: Secondary school students’ perceptions of STEM lessons—A pioneering study. Education Sciences, 15(4), 467. [Google Scholar] [CrossRef]
- Kloos, C. D., Alario-Hoyos, C., Muñoz-Merino, P. J., Ibáñez, M. B., Estévez-Ayres, I., & Fernández-Panadero, C. (2020). Educational technology in the age of natural interfaces and deep learning. IEEE Revista Iberoamericana de Tecnologias del Aprendizaje, 15(1), 26–33. [Google Scholar] [CrossRef]
- Koh, Y. Y. J., Schmidt, H. G., Low-Beer, N., & Rotgans, J. I. (2020). Team-based learning analytics: An empirical case study. Academic Medicine, 95(6), 872–878. [Google Scholar] [CrossRef]
- Kropotkin, P. (1924). Ethics: Origins and development (L. S. Friedland, & J. R. Piroshnikoff, Trans.). George G. Harrap and Co., Ltd. (Original work published 1922). Available online: https://theanarchistlibrary.org/library/petr-kropotkin-ethics-origin-and-development (accessed on 20 February 2025).
- Lemert, E. M. (1974). Beyond Mead: The societal reaction to deviance. Social Problems, 21(4), 457–468. [Google Scholar] [CrossRef]
- Lindsley, O. R. (1992). Precision teaching: Discoveries and effects. Journal of Applied Behavior Analysis, 25(1), 51–57. [Google Scholar] [CrossRef] [PubMed]
- Liu, C., & Wang, X. (2018, March 2–4). Application of smart education in college English flipped classroom. 8th International Conference on Social Network, Communication and Education (SNCE 2018), Shenyang, China. [Google Scholar]
- Liu, Z., Zhang, N., Peng, X., Liu, S., Yang, Z., Peng, J., Su, Z., & Chen, J. (2022). Exploring the relationship between social interaction, cognitive processing and learning achievements in a MOOC discussion forum. Journal of Educational Computing Research, 60(1), 132–169. [Google Scholar] [CrossRef]
- Lycurgus, T., Kilbourne, A., & Almirall, D. (2024). Approaches to statistical efficiency when comparing the embedded adaptive interventions in a SMART. Journal of Educational and Behavioral Statistics, 10769986241251419. [Google Scholar] [CrossRef]
- Ma, X., Xie, Y., Yang, X., Wang, H., Li, Z., & Lu, J. (2024). Teacher-student interaction modes in smart classroom based on lag sequential analysis. Education and Information Technologies, 29(12), 15087–15111. [Google Scholar] [CrossRef]
- Major, L., Francis, G. A., & Tsapali, M. (2021). The effectiveness of technology-supported personalised learning in low- and middle-income countries: A meta-analysis. British Journal of Educational Technology, 52(5), 1935–1964. [Google Scholar] [CrossRef]
- Malekigorji, M., & Hatahet, T. (2020). Classroom response system in a super-blended learning and teaching model: Individual or team-based learning? Pharmacy, 8(4), 197. [Google Scholar] [CrossRef]
- MDPI. (n.d.). Research and publication ethics. MDPI. Available online: https://www.mdpi.com/ethics (accessed on 22 February 2025).
- Mead, G. H. (1972). Mind, self, and society: From the standpoint of a social behaviorist. University of Chicago Press. (Original work published 1934). [Google Scholar]
- Merton, R. K. (1995). The Thomas theorem and the Matthew effect. Social Forces, 74(2), 379–422. [Google Scholar] [CrossRef]
- Morse, J. M., Bowers, B. J., Clarke, A. E., Charmaz, K., Corbin, J., & Porr, C. J. (2021). The challenges to and future(s) of grounded theory. In J. M. Morse, B. J. Bowers, K. Charmaz, A. E. Clarke, J. Corbin, C. J. Porr, & P. N. Stern (Eds.), Developing grounded theory: The second generation revisited (2nd ed., pp. 289–319). Routledge. [Google Scholar] [CrossRef]
- Mugruza-Vassallo, C. A. (2023). A “fractal” expander-compressor-supplier formative research method on array processing. Education and Information Technologies, 28(12), 16349–16372. [Google Scholar] [CrossRef]
- Niknam, M., & Thulasiraman, P. (2020). LPR: A bio-inspired intelligent learning path recommendation system based on meaningful learning theory. Education and Information Technologies, 25(5), 3797–3819. [Google Scholar] [CrossRef]
- Ouf, S., Abd Ellatif, M., Salama, S. E., & Helmy, Y. (2017). A proposed paradigm for smart learning environment based on semantic web. Computers in Human Behavior, 72, 796–818. [Google Scholar] [CrossRef]
- Pane, J. F., Steiner, E. D., Baird, M. D., & Hamilton, L. S. (2015). Promising evidence on personalized learning; RAND Corporation. Available online: https://eric.ed.gov/ED571009 (accessed on 22 February 2025).
- Patrick, S., Kennedy, K., & Powell, A. K. (2013). Mean what you say: Defining and integrating personalized, blended and competency education; International Association for K-12 Online Learning. Available online: http://files.eric.ed.gov/fulltext/ED561301.pdf (accessed on 22 February 2025).
- Polit, D. F., & Beck, C. T. (2006). The content validity index: Are you sure you know what’s being reported? Critique and recommendations. Research in Nursing & Health, 29(5), 489–497. [Google Scholar] [CrossRef]
- Price, J. K. (2015). Transforming learning for the smart learning environment: Lessons learned from the Intel education initiatives. Smart Learning Environments, 2(1), 16. [Google Scholar] [CrossRef]
- Radcliffe, D. (2009). A pedagogy-space-technology (PST) framework for designing and evaluating learning spaces. In D. Radcliffe, H. Wilson, D. Powell, & B. Tibbets (Eds.), Learning spaces in higher education—Positive outcomes by design. Proceedings of the Next Generation Learning Spaces 2008 Colloquium. University of Queensland. [Google Scholar]
- Redding, S. (2016). Competencies and personalized learning. In M. Murphy, S. Redding, & J. Twyman (Eds.), Handbook on personalized learning for states, districts, and schools (pp. 3–18). Centeril. [Google Scholar]
- Resnik, D. B. (1998). The ethics of science: An introduction. Routledge. [Google Scholar]
- Reushle, S. (2012). Designing and evaluating learning spaces: PaSsPorT and design-based research. In M. Keppell, K. Souter, & M. Riddle (Eds.), Physical and virtual learning spaces in higher education: Concepts for the modern learning environment (pp. 87–101). IGI Global. [Google Scholar] [CrossRef]
- Robson, C., & McCartan, K. (2016). Real world research: A resource for users of social research methods in applied setting (4th ed.). Wiley. [Google Scholar]
- Saini, M. K., & Goel, N. (2019). How smart are smart classrooms? A review of smart classroom technologies. ACM Computing Surveys, 52(6), 130. [Google Scholar] [CrossRef]
- Sampson, D. G., & Karagiannidis, C. (2002). Personalised learning: Educational, technological and standardisation perspective. Digital Education Review, 24–39. [Google Scholar]
- Santhosh, J., Dzsotjan, D., & Ishimaru, S. (2023). Multimodal assessment of interest levels in reading: Integrating eye-tracking and physiological sensing. IEEE Access, 11, 93994–94008. [Google Scholar] [CrossRef]
- Sharma, B. N., Nand, R., Naseem, M., Reddy, E., Narayan, S. S., & Reddy, K. (2018, December 4–7). Smart learning in the pacific: Design of new pedagogical tools. 2018 IEEE International Conference on Teaching, Assessment, and Learning for Engineering (TALE), Wollongong, NSW, Australia. [Google Scholar]
- Shaw, R., & Patra, B. K. (2022). Classifying students based on cognitive state in flipped learning pedagogy. Future Generation Computer Systems, 126(C), 305–317. [Google Scholar] [CrossRef]
- Sternberg, R. J. (2022). Giftedness as trait vs. state. Roeper Review, 44(3), 135–143. [Google Scholar] [CrossRef]
- Sungkur, R. K., & Maharaj, M. S. (2021). Design and implementation of a SMART learning environment for the upskilling of cybersecurity professionals in Mauritius. Education and Information Technologies, 26(3), 3175–3201. [Google Scholar] [CrossRef]
- Tabachnick, B. G., & Fidell, L. S. (2007). Using multivariate statistics (5th ed.). Allyn & Bacon/Pearson Education. [Google Scholar]
- Tapscott, D. (2009). Grown up digital: How the net generation is changing the world. McGraw Hill. [Google Scholar]
- (1996). The Nuremberg Code (1947). BMJ, 313(7070), 1448. [CrossRef]
- Thomas, W. I., & Thomas, D. S. (1928). The child in America: Behavior problems and programs. Knopf. [Google Scholar]
- Timothy, T., Seng Chee, T., Chwee Beng, L., Ching Sing, C., Joyce Hwee Ling, K., Wen Li, C., & Horn Mun, C. (2010). The self-directed learning with technology scale (SDLTS) for young students: An initial development and validation. Computers & Education, 55(4), 1764–1771. [Google Scholar] [CrossRef]
- Toivonen, T., Jormanainen, I., Montero, C. S., & Alessandrini, A. (2018). Innovative maker movement platform for K-12 education as a smart learning environment. In M. Chang, E. Popescu Kinshuk, N.-S. Chen, M. Jemni, R. Huang, & J. M. Spector (Eds.), Challenges and solutions in smart learning. Singapore. [Google Scholar]
- Troussas, C., Krouska, A., & Sgouropoulou, C. (2020). Collaboration and fuzzy-modeled personalization for mobile game-based learning in higher education. Computers & Education, 144, 103698. [Google Scholar] [CrossRef]
- U.S. Department of Education. (2010). Transforming American education: Learning powered by technology; Office of Educational Technology. Available online: https://files.eric.ed.gov/fulltext/ED512681.pdf (accessed on 23 December 2024).
- Van Schoors, R., Elen, J., Raes, A., & Depaepe, F. (2021). An overview of 25 years of research on digital personalised learning in primary and secondary education: A systematic review of conceptual and methodological trends. British Journal of Educational Technology, 52(5), 1798–1822. [Google Scholar] [CrossRef]
- Walkington, C., & Bernacki, M. L. (2020). Appraising research on personalized learning: Definitions, theoretical alignment, advancements, and future directions. Journal of Research on Technology in Education, 52(3), 235–252. [Google Scholar] [CrossRef]
- Wang, J., Xie, K., Liu, Q., Long, T., & Lu, G. (2023). Examining the effect of seat location on students’ real-time social interactions in a smart classroom using experience sampling method. Journal of Computers in Education, 10(2), 217–235. [Google Scholar] [CrossRef]
- Wirthwein, L., Bergold, S., Preckel, F., & Steinmayr, R. (2019). Personality and school functioning of intellectually gifted and nongifted adolescents: Self-perceptions and parents’ assessments. Learning and Individual Differences, 73, 16–29. [Google Scholar] [CrossRef]
- Xie, H., Chu, H.-C., Hwang, G.-J., & Wang, C.-C. (2019). Trends and development in technology-enhanced adaptive/personalized learning: A systematic review of journal publications from 2007 to 2017. Computers & Education, 140, 103599. [Google Scholar] [CrossRef]
- Yang, J., & Huang, R. (2015). Development and validation of a scale for evaluating technology-rich classroom environment. Journal of Computers in Education, 2(2), 145–162. [Google Scholar] [CrossRef]
- Yu, H., Wang, E., Lang, Q., & Wang, J. (2024). Intelligent retrieval and comprehension of entrepreneurship education resources based on semantic summarization of knowledge graphs. IEEE Transactions on Learning Technologies, 17, 1210–1221. [Google Scholar] [CrossRef]
- Yuan, X., Yu, L., & Wu, H. (2021). Awareness of sustainable development goals among students from a Chinese senior high school. Education Sciences, 11(9), 458. [Google Scholar] [CrossRef]
- Zhan, Z., Wu, Q., Lin, Z., & Cai, J. (2021). Smart classroom environments affect teacher-student interaction: Evidence from a behavioural sequence analysis. Australasian Journal of Educational Technology, 37(2), 96–109. [Google Scholar] [CrossRef]
- Zhang, L., Basham, J. D., & Carter, R. A. (2022). Measuring personalized learning through the Lens of UDL: Development and content validation of a student self-report instrument. Studies in Educational Evaluation, 72, 101121. [Google Scholar] [CrossRef]
- Zhang, L., Basham, J. D., & Yang, S. (2020a). Understanding the implementation of personalized learning: A research synthesis. Educational Research Review, 31, 100339. [Google Scholar] [CrossRef]
- Zhang, L., Yang, S., & Carter, R. A. (2020b). Personalized learning and ESSA: What we know and where we go. Journal of Research on Technology in Education, 52(3), 253–274. [Google Scholar] [CrossRef]
- Zhao, J., Zhang, L., & Yao, X. (2023). Developing and validating a scale for university teacher’s caring behavior in online teaching. Education Sciences, 13(3), 300. [Google Scholar] [CrossRef]
- Ziegler, A. (2005). The actiotope model of giftedness. In Conceptions of giftedness (2nd ed., pp. 411–436). Cambridge University Press. [Google Scholar] [CrossRef]
- Ziegler, A., & Bicakci, M. (2023). Labeling the gifted: An overview of four core challenges [Keynote address]. Gifted Students: Nomen est Omen [Nadaný žák: Nomen est Omen], Zlin, Czechia. [Google Scholar]
- Ziegler, A., & Stoeger, H. (2012). Shortcomings of the IQ-based construct of underachievement. Roeper Review, 34(2), 123–132. [Google Scholar] [CrossRef]
- Ziegler, A., & Stoeger, H. (2017). Systemic gifted education: A theoretical introduction. Gifted Child Quarterly, 61(3), 183–193. [Google Scholar] [CrossRef]
- Ziegler, A., Stoeger, H., & Vialle, W. (2012). Giftedness and gifted education: The need for a paradigm change. Gifted Child Quarterly, 56(4), 194–197. [Google Scholar] [CrossRef]

| Participant Demographics | Sample 1 n = 440 * | Sample 2 n = 584 * |
|---|---|---|
| Grade level | n (%) | n (%) |
| Seventh grade | 159 (36.14%) | 225 (38.53%) |
| Eighth grade | 135 (30.68%) | 173 (29.62%) |
| Ninth grade | 146 (33.18%) | 186 (31.85%) |
| Gender | ||
| Male | 253 (57.5%) | 281 (48.12%) |
| Female | 187 (42.5%) | 303 (51.88%) |
| KMO | Bartlett’s Test of Sphericity | ||
|---|---|---|---|
| χ2 | df | Sig. | |
| 0.889 | 10,258.843 | 561 | 0.000 |
| Items | Component | ||||||||
|---|---|---|---|---|---|---|---|---|---|
| 1 | 2 | 3 | 4 | 5 | 6 | 7 | 8 | 9 | |
| TPM3 | 0.845 | 0.013 | 0.079 | 0.145 | 0.173 | 0.048 | 0.065 | 0.159 | 0.054 |
| TPM2 | 0.839 | 0.034 | 0.103 | 0.236 | 0.215 | 0.007 | 0.019 | 0.172 | 0.027 |
| TPM4 | 0.819 | 0.064 | 0.028 | 0.221 | 0.124 | −0.008 | 0.008 | 0.122 | 0.025 |
| TPM1 | 0.808 | 0.005 | 0.042 | 0.206 | 0.218 | 0.039 | 0.002 | 0.149 | −0.010 |
| IDS3 | 0.028 | 0.892 | 0.054 | 0.033 | 0.075 | 0.057 | 0.161 | 0.060 | 0.167 |
| IDS2 | −0.009 | 0.861 | 0.099 | 0.079 | 0.049 | 0.066 | 0.194 | 0.045 | 0.162 |
| IDS1 | 0.066 | 0.853 | 0.109 | 0.058 | 0.061 | 0.064 | 0.174 | 0.014 | 0.167 |
| IDS4 | 0.034 | 0.814 | 0.088 | 0.087 | 0.067 | 0.070 | 0.212 | 0.005 | 0.160 |
| LD1 | 0.052 | 0.064 | 0.868 | 0.055 | 0.060 | 0.209 | 0.075 | 0.032 | 0.036 |
| LD5 | 0.074 | 0.097 | 0.855 | 0.059 | 0.134 | 0.264 | 0.100 | 0.095 | 0.067 |
| LD3 | 0.066 | 0.095 | 0.835 | 0.139 | 0.054 | 0.202 | 0.049 | 0.059 | 0.116 |
| LD4 | 0.070 | 0.116 | 0.831 | 0.136 | 0.081 | 0.281 | 0.136 | 0.098 | 0.078 |
| FMM5 | 0.257 | 0.041 | 0.100 | 0.848 | 0.166 | 0.058 | 0.007 | 0.153 | 0.036 |
| FMM2 | 0.182 | 0.092 | 0.102 | 0.824 | 0.154 | 0.072 | 0.034 | 0.176 | 0.072 |
| FMM1 | 0.204 | 0.150 | 0.122 | 0.794 | 0.246 | 0.117 | 0.025 | 0.180 | 0.066 |
| FMM3 | 0.300 | 0.010 | 0.096 | 0.696 | 0.217 | 0.122 | 0.109 | 0.184 | −0.011 |
| CRG5 | 0.123 | 0.022 | 0.093 | 0.111 | 0.839 | 0.027 | 0.016 | 0.107 | 0.123 |
| CRG4 | 0.130 | 0.097 | 0.068 | 0.198 | 0.790 | 0.053 | 0.106 | 0.141 | 0.015 |
| CRG2 | 0.268 | 0.105 | 0.058 | 0.192 | 0.790 | 0.126 | 0.019 | 0.161 | −0.021 |
| CRG1 | 0.304 | 0.052 | 0.108 | 0.235 | 0.774 | 0.057 | 0.062 | 0.207 | −0.004 |
| EQ4 | −0.018 | 0.137 | 0.210 | 0.025 | 0.059 | 0.825 | 0.067 | 0.036 | 0.048 |
| EQ2 | 0.017 | 0.017 | 0.153 | 0.116 | 0.083 | 0.822 | 0.037 | −0.008 | 0.040 |
| EQ3 | 0.044 | 0.045 | 0.226 | 0.034 | 0.014 | 0.820 | 0.083 | 0.096 | 0.062 |
| EQ1 | 0.047 | 0.047 | 0.263 | 0.117 | 0.063 | 0.806 | 0.097 | 0.025 | 0.016 |
| AR2 | 0.029 | 0.195 | 0.071 | 0.034 | 0.001 | 0.097 | 0.830 | 0.043 | 0.133 |
| AR1 | 0.066 | 0.160 | 0.083 | 0.067 | 0.116 | 0.017 | 0.819 | −0.019 | 0.140 |
| AR4 | −0.003 | 0.174 | 0.108 | 0.047 | 0.087 | 0.033 | 0.814 | −0.091 | 0.165 |
| AR3 | −0.002 | 0.175 | 0.058 | −0.013 | −0.024 | 0.138 | 0.763 | 0.092 | 0.153 |
| SLV2 | 0.281 | 0.065 | 0.053 | 0.224 | 0.150 | 0.060 | −0.024 | 0.816 | 0.051 |
| SLV4 | 0.190 | −0.006 | 0.131 | 0.203 | 0.230 | 0.009 | 0.029 | 0.807 | 0.032 |
| SLV1 | 0.153 | 0.059 | 0.077 | 0.192 | 0.190 | 0.081 | 0.016 | 0.807 | −0.010 |
| DA1 | 0.047 | 0.231 | 0.066 | 0.056 | 0.032 | 0.076 | 0.198 | −0.002 | 0.811 |
| DA4 | 0.024 | 0.203 | 0.064 | 0.055 | 0.056 | 0.058 | 0.179 | 0.029 | 0.808 |
| DA2 | 0.011 | 0.184 | 0.122 | 0.019 | 0.022 | 0.025 | 0.203 | 0.034 | 0.794 |
| Eigenvalue | 3.344 | 3.310 | 3.261 | 3.058 | 3.048 | 3.042 | 2.950 | 2.342 | 2.205 |
| % of Variance | 9.835 | 9.734 | 9.591 | 8.994 | 8.965 | 8.947 | 8.677 | 6.888 | 6.484 |
| Cumulative % | 9.835 | 19.569 | 29.160 | 38.155 | 47.120 | 56.066 | 64.743 | 71.631 | 78.116 |
| Mean | SD | CRG | FMM | TPM | SLV | EQ | LD | DA | AR | IDS | |
|---|---|---|---|---|---|---|---|---|---|---|---|
| CRG | 3.59 | 1.06 | 0.820 | ||||||||
| FMM | 3.73 | 0.96 | 0.505 ** | 0.839 | |||||||
| TPM | 3.55 | 1.02 | 0.491 ** | 0.524 ** | 0.839 | ||||||
| SLV | 3.63 | 1.05 | 0.489 ** | 0.477 ** | 0.497 ** | 0.830 | |||||
| EQ | 3.60 | 0.98 | 0.241 ** | 0.258 ** | 0.163 ** | 0.234 ** | 0.816 | ||||
| LD | 3.67 | 1.07 | 0.374 ** | 0.335 ** | 0.274 ** | 0.321 ** | 0.540 ** | 0.886 | |||
| DA | 3.69 | 1.01 | 0.275 ** | 0.225 ** | 0.247 ** | 0.226 ** | 0.235 ** | 0.326 ** | 0.802 | ||
| AR | 3.79 | 0.88 | 0.249 ** | 0.238 ** | 0.268 ** | 0.219 ** | 0.136 ** | 0.271 ** | 0.454 ** | 0.806 | |
| IDS | 3.72 | 0.93 | 0.221 ** | 0.258 ** | 0.235 ** | 0.224 ** | 0.207 ** | 0.287 ** | 0.504 ** | 0.431 ** | 0.873 |
| Variable | Item | Factor Loading | Composite Reliability (CR) | Average Variance Extracted (AVE) |
|---|---|---|---|---|
| Smart Classroom Personalized Learning Scale (SC-PLS) | Pedagogy | 0.719 | 0.752 | 0.503 |
| Space | 0.720 | |||
| Technology | 0.688 | |||
| Pedagogy | CRG | 0.766 | 0.836 | 0.560 |
| FMM | 0.741 | |||
| TPM | 0.750 | |||
| SLV | 0.735 | |||
| Space | EQ | 0.800 | 0.747 | 0.597 |
| LD | 0.744 | |||
| Technology | DA | 0.798 | 0.767 | 0.525 |
| AR | 0.662 | |||
| IDS | 0.707 | |||
| Clear and Relevant Goals (CRG) | CRG1 | 0.883 | 0.891 | 0.672 |
| CRG2 | 0.864 | |||
| CRG4 | 0.765 | |||
| CRG5 | 0.758 | |||
| Flexible Instructional Methods and Materials (FMM) | FMM1 | 0.871 | 0.905 | 0.704 |
| FMM2 | 0.832 | |||
| FMM3 | 0.750 | |||
| FMM5 | 0.896 | |||
| Timely Progress Monitoring (TPM) | TPM1 | 0.811 | 0.905 | 0.704 |
| TPM2 | 0.895 | |||
| TPM3 | 0.841 | |||
| TPM4 | 0.805 | |||
| Supporting Learner Variability (SLV) | SLV1 | 0.772 | 0.868 | 0.688 |
| SLV2 | 0.883 | |||
| SLV4 | 0.830 | |||
| Environmental Quality (EQ) | EQ1 | 0.857 | 0.888 | 0.665 |
| EQ2 | 0.766 | |||
| EQ3 | 0.837 | |||
| EQ4 | 0.799 | |||
| Layout and Display (LD) | LD1 | 0.833 | 0.936 | 0.785 |
| LD3 | 0.855 | |||
| LD4 | 0.923 | |||
| LD5 | 0.929 | |||
| Device Access (DA) | DA1 | 0.842 | 0.844 | 0.644 |
| DA2 | 0.778 | |||
| DA4 | 0.785 | |||
| Access to Resources (AR) | AR1 | 0.810 | 0.881 | 0.650 |
| AR2 | 0.835 | |||
| AR3 | 0.754 | |||
| AR4 | 0.824 | |||
| Intelligent Diagnosis and Services (IDS) | IDS1 | 0.864 | 0.928 | 0.762 |
| IDS2 | 0.879 | |||
| IDS3 | 0.910 | |||
| IDS4 | 0.837 |
Disclaimer/Publisher’s Note: The statements, opinions and data contained in all publications are solely those of the individual author(s) and contributor(s) and not of MDPI and/or the editor(s). MDPI and/or the editor(s) disclaim responsibility for any injury to people or property resulting from any ideas, methods, instructions or products referred to in the content. |
© 2025 by the authors. Licensee MDPI, Basel, Switzerland. This article is an open access article distributed under the terms and conditions of the Creative Commons Attribution (CC BY) license (https://creativecommons.org/licenses/by/4.0/).
Share and Cite
Tuo, P.; Bicakci, M.; Ziegler, A.; Zhang, B. Measuring Personalized Learning in the Smart Classroom Learning Environment: Development and Validation of an Instrument. Educ. Sci. 2025, 15, 620. https://doi.org/10.3390/educsci15050620
Tuo P, Bicakci M, Ziegler A, Zhang B. Measuring Personalized Learning in the Smart Classroom Learning Environment: Development and Validation of an Instrument. Education Sciences. 2025; 15(5):620. https://doi.org/10.3390/educsci15050620
Chicago/Turabian StyleTuo, Pan, Mehmet Bicakci, Albert Ziegler, and BaoHui Zhang. 2025. "Measuring Personalized Learning in the Smart Classroom Learning Environment: Development and Validation of an Instrument" Education Sciences 15, no. 5: 620. https://doi.org/10.3390/educsci15050620
APA StyleTuo, P., Bicakci, M., Ziegler, A., & Zhang, B. (2025). Measuring Personalized Learning in the Smart Classroom Learning Environment: Development and Validation of an Instrument. Education Sciences, 15(5), 620. https://doi.org/10.3390/educsci15050620