Article

Topic Level Visualization of Student Enrollment Records in a Computer Science Curriculum

Department of Bioengineering, Grainger College of Engineering, University of Illinois Urbana-Champaign, Urbana, IL 61801, USA
*
Author to whom correspondence should be addressed.
Educ. Sci. 2025, 15(5), 614; https://doi.org/10.3390/educsci15050614
Submission received: 31 March 2025 / Revised: 8 May 2025 / Accepted: 12 May 2025 / Published: 16 May 2025

Abstract

:
Reviewing academic curricula requires a significant investment of time and expertise. Beyond accreditation, curriculum may be reviewed in part or in whole during other administrative efforts including the consideration of new elective courses, faculty-student advising, admission of transfer students, internal audits, and more. These activities often require multiple people with deep knowledge of the coursework as well as the discipline(s) involved to pour over scattered documentation and comparatively limited assessment data in order to make an informed decision. In this work, we explored the development of a semi-automated computational approach to visualize a curriculum as described in official course listings at a topic level of detail. We show how our approach can help provide a detailed view of how topics are covered across multiple courses and how these visualizations can show similarities and differences for individual student registration records, paving the way for personalized student support. We also identified opportunities for improvement in this method, including the need to develop more robust topic mapping techniques for short texts.

1. Introduction

A complete curriculum of study at four-year, post-secondary program is typically published as a list or map of courses to be taken by students in pursuit of a degree. These course-level maps often contain a number of choices for students to make, such as general education coursework, composition coursework, elective coursework, and potentially others. Logistically, this results in a large number of possible combinations of courses which might comprise any single student’s enrollment history at any institution. At an even finer level of detail, we may consider each course in the curriculum map as being described by a particular list of topics covered during that course. The large number of possible course enrollments over time in combination with the evolution of course content over time results in a vast number of configurations for topic level curriculum maps, even at a single institution. These topics are sometimes listed, at least in part, in official course listings but are not always explicitly listed in a publicly accessible format.
Curriculum maps may be generated internally or may have been sourced from an external body such as national or international academic societies, accrediting boards, governmental agencies, or other independent groups representing an academic discipline (Rawle et al., 2017). In the larger domain of computational curricula, the Association of Computing Machinery (ACM) partners with the IEEE Computer Society to periodically release computing curricula reports. These reports cover undergraduate degree-granting programs of study, including Computer Engineering, Computer Science, Cybersecurity, Information Systems, Information Technology, and Software Engineering (CC2020 Task Force, 2020a). The purpose of these reports is to provide guidance and recommendations on curricular content and pedagogy for these programs of study, as well as providing forward looking recommendations. For this work, we chose to focus on the Computer Science (CS) program of study at a large, land grant university and will pull guidance from the ACM CS2013 and CS2023 reports, but also include appropriate considerations from the broader CC2020 report on all computing curricula. These reports provide the topic details required to map course enrollment data to topic level for visualization.

2. Background

Curriculum mapping is often an administrative task, and there are a number of different ways to approach it. To start, there are multiple different ways to frame a curriculum, such as whether to base the curriculum map on what was intended (program objectives, national standards, accreditation criteria, etc.) or what was delivered to students (assessments, course notes, lecture recordings, etc.) (Clemmons et al., 2022). Despite the large amount of information and detail curriculum maps could possibly contain, many public-facing and student-facing maps are limited in what information they convey, often displaying a list or diagram of course names/numbers (see Figure 1 for an example).
There are numerous decisions to be made when mapping a curriculum requiring cooperation and consensus which also leads to variation within and between different curriculum maps (Clemmons et al., 2022). For example, a department must decide whether to map program objectives, institutional objectives, accrediting body objectives, career focused objectives, other objectives, or a mixture of these. Typically, the mapping work will be decided manually by staff and faculty who must leverage their experience to make informed decisions (Clemmons et al., 2022). Recent work has also blended qualitative theory and computer automation to produce knowledge graph visualizations of educational topics from a focused literature search which requires combining multiple areas of expertise to complete (Falegnami et al., 2024). All of these possible data sources and approaches makes the mapping process a complicated, expensive, and challenging activity (Ervin et al., 2013). However, there are benefits to mapping which extend beyond the final product (Lam & Tsui, 2016; Rawle et al., 2017). These benefits include: informing curricular changes, tracking student achievement outcomes, building cohesion around program goals, and building better communication around curriculum for students and faculty (Lam & Tsui, 2016; Rawle et al., 2017; Schutte et al., 2019). In this work, we sought to develop a visualization approach which could accommodate multiple mapping strategies, and chose to work with accrediting body objectives as an authoritative data source.
In the most recent ACM 2023 computer science curriculum report (CS2023), curriculum is represented through a competency model comprising knowledge areas and dispositions (Kumar et al., 2024). This represents a different but complementary representation of curriculum from the previous CS2013 report which represented curriculum as a knowledge-based entity (The Joint Task Force on Computing Curricula & Association for Computing Machinery and IEEE Computer Society, 2013). The CS2023 report adopts the broader Computing Curriculum 2020 (CC2020) report’s definition of competency as being a combination of Skills, Knowledge, and Dispositions (CC2020 Task Force, 2020a). In the CC2020 executive summary, the report highlights the role and importance of visualizations in their ability to communicate ideas about the curriculum to students and faculty (Kumar et al., 2024).
Many of the visuals included in the CC2020 report (see Figure 2) illustrate how a map of knowledge areas can be used to visualize differences in curriculum and student expectations. These types of maps and visualizations are presented as a helpful tool for students when considering which program of study to consider (Ikuta & Gotoh, 2014; Takada et al., 2020). Although; prior work has shown that there are distinct differences between low prior knowledge (LPK) and high prior knowledge (HPK) students when it comes to interpreting concept maps which may inhibit certain students’ comprehension and decision making from such visualizations (Amadieu et al., 2009). Additionally, many curricular map visualizations do not provide a concise, specific map of topic coverage which may be important during activities like student academic advising or a detailed curriculum audit (Assiri et al., 2020; Rawle et al., 2017). For example, Figure 2 from the CC2020 report shows a visualization of the differences in knowledge areas for two different computing programs and a hypothetical student’s selection of interests, but does not show course-level detail which might help focus attention to specific areas of interest. Figure 3 also from CC2020 shows a complete map of computing focused topics, but does not show how these topics may be covered over time or across courses and is difficult to read at scale. The large amount of information from a complete topic map presents a challenge to any viewer, LPK or HPK, trying to take in everything at once. This challenge to forage and select pertinent information might require prerequisite knowledge or additional support in order to effectively filter and utilize the map (Su et al., 2012). Even formatting a correct query to filter a list of topics down to something manageable requires enough prior knowledge to understand the map at some level, which would pose a problem for many LPK students (Amadieu et al., 2009).
Our goal in this work is to find a way to visualize topic-level detail across multiple courses in a way that makes the resulting visualizations more intuitive and informative. With the advancement of computational approaches in NLP ranging from large language models using generative AI to the host of open source software, there is an opportunity to leverage these tools to enhance curricular mapping to enable the types of advantages a good curriculum map visualization may bring. Given the large amount of time and resources required to manually map curricula and the limitations of existing curriculum map visualizations, we sought to develop a method of mapping and visualizing curriculum which addressed the following objectives:
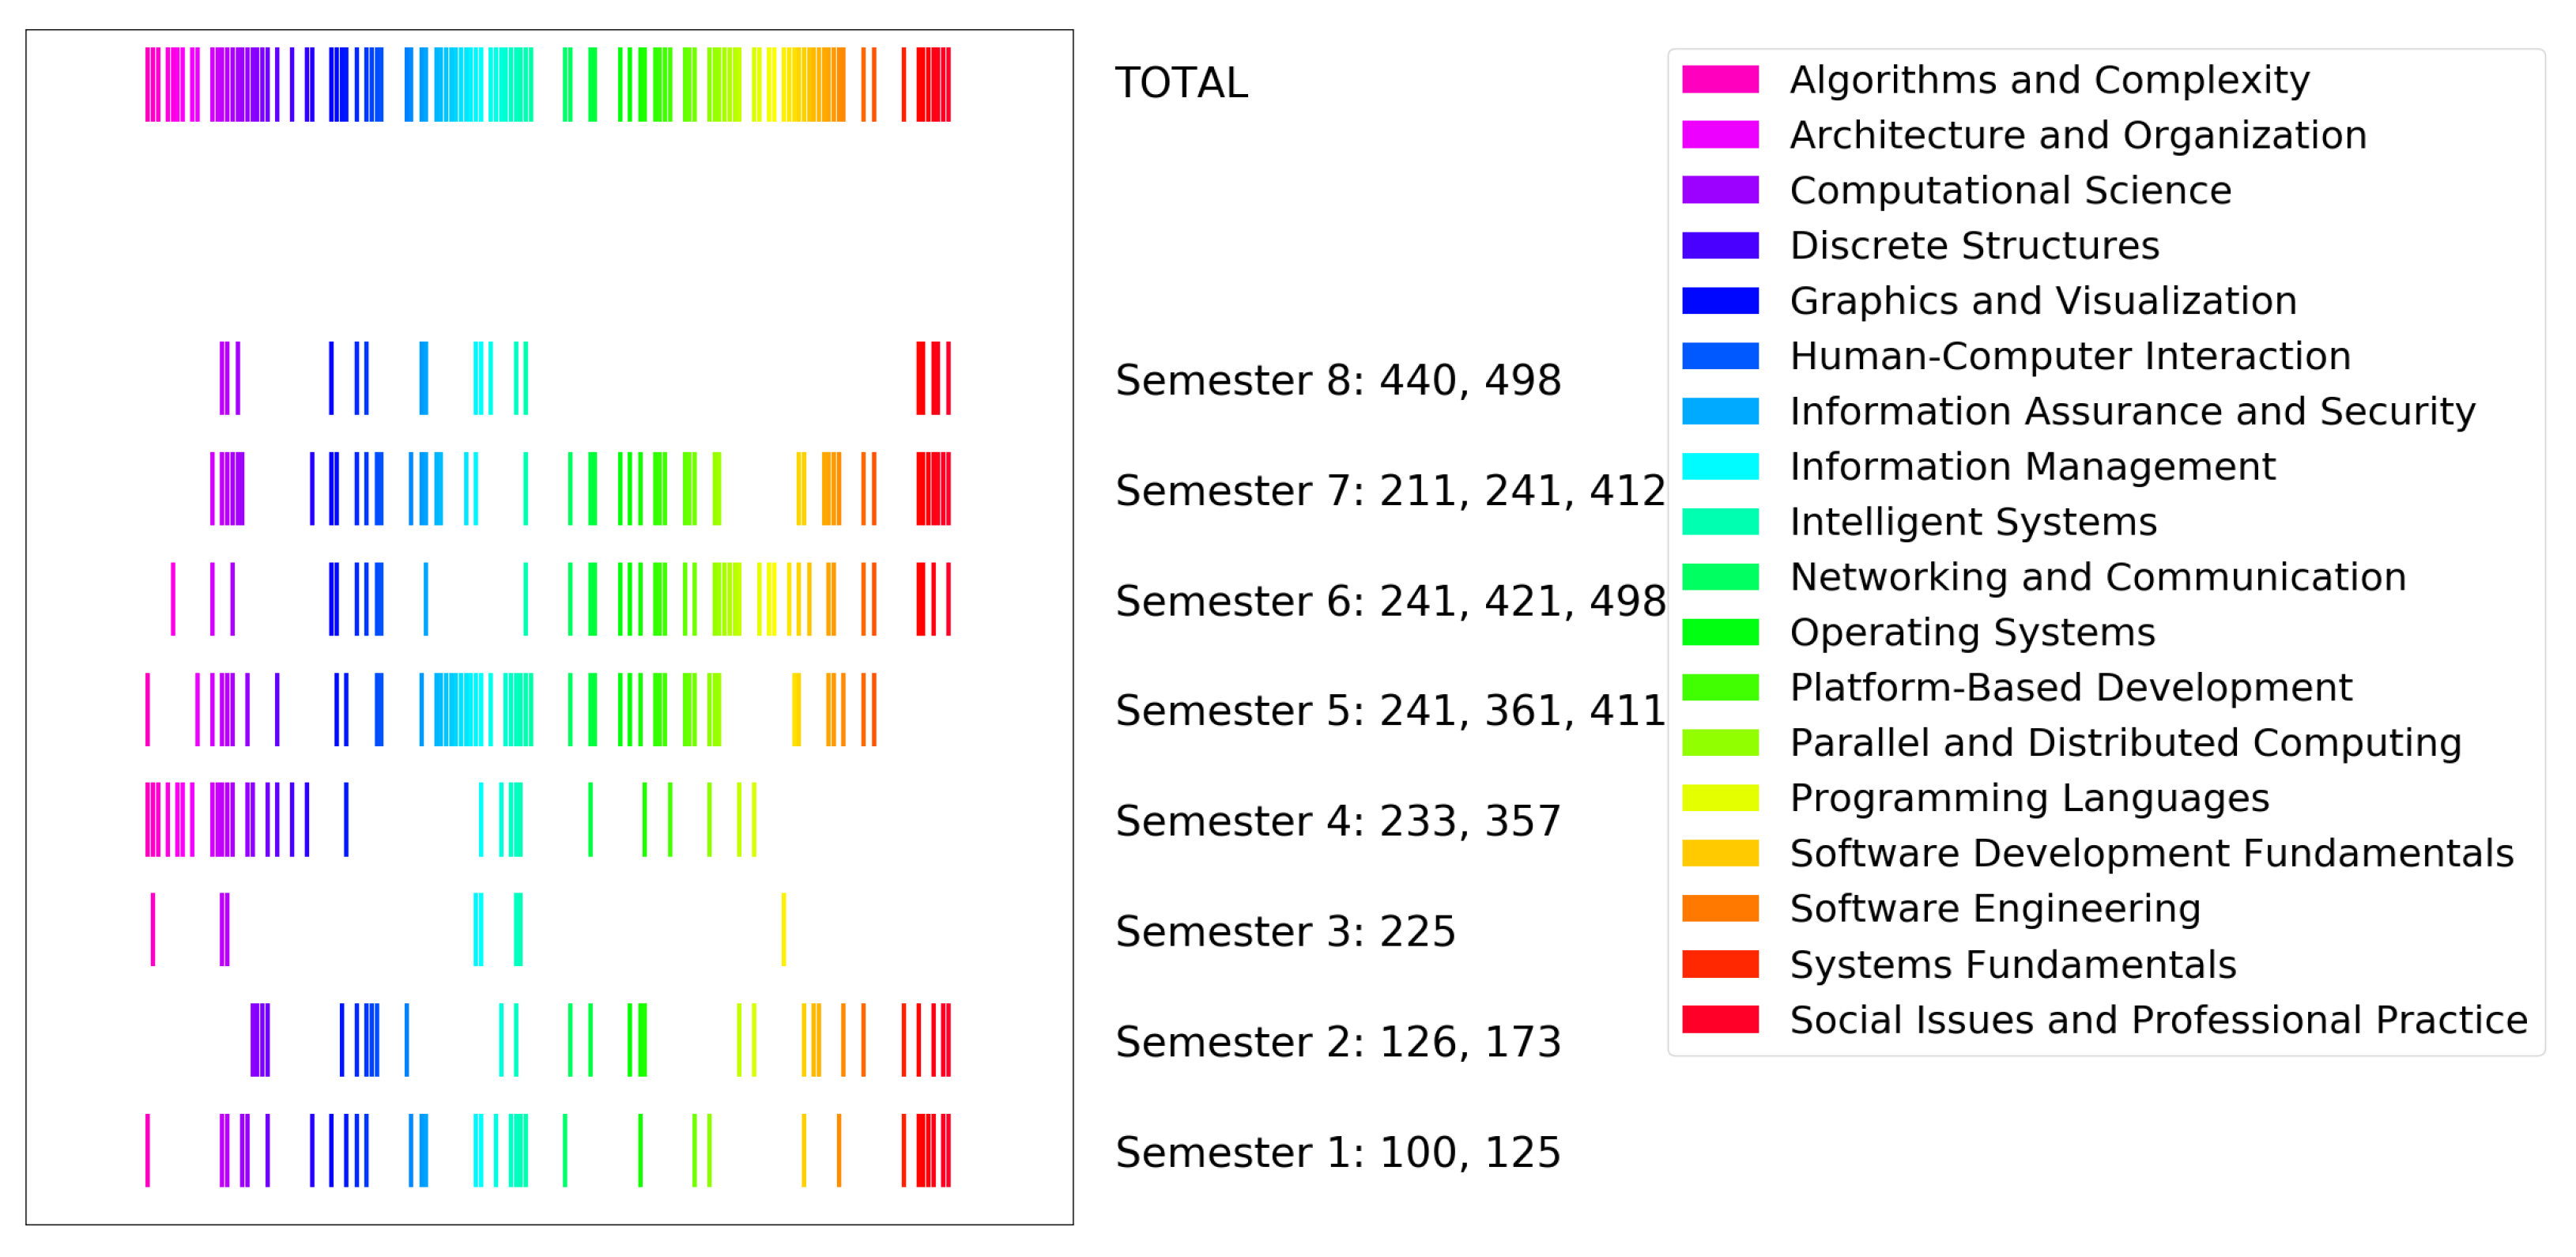
  • Show topic level detail of how courses contribute to a complete program of study
  • Enable individual students’ course enrollment to be visualized and compared
  • Be flexible enough to accommodate changes in course offerings or different curriculum maps
  • Perform the mapping and visualization in a way that is largely automated to reduce the manual burden of producing the visualizations
With those objectives in mind, we sought to answer the following research questions:
  • What can topic level visualizations show when plotted over a complete program of study?
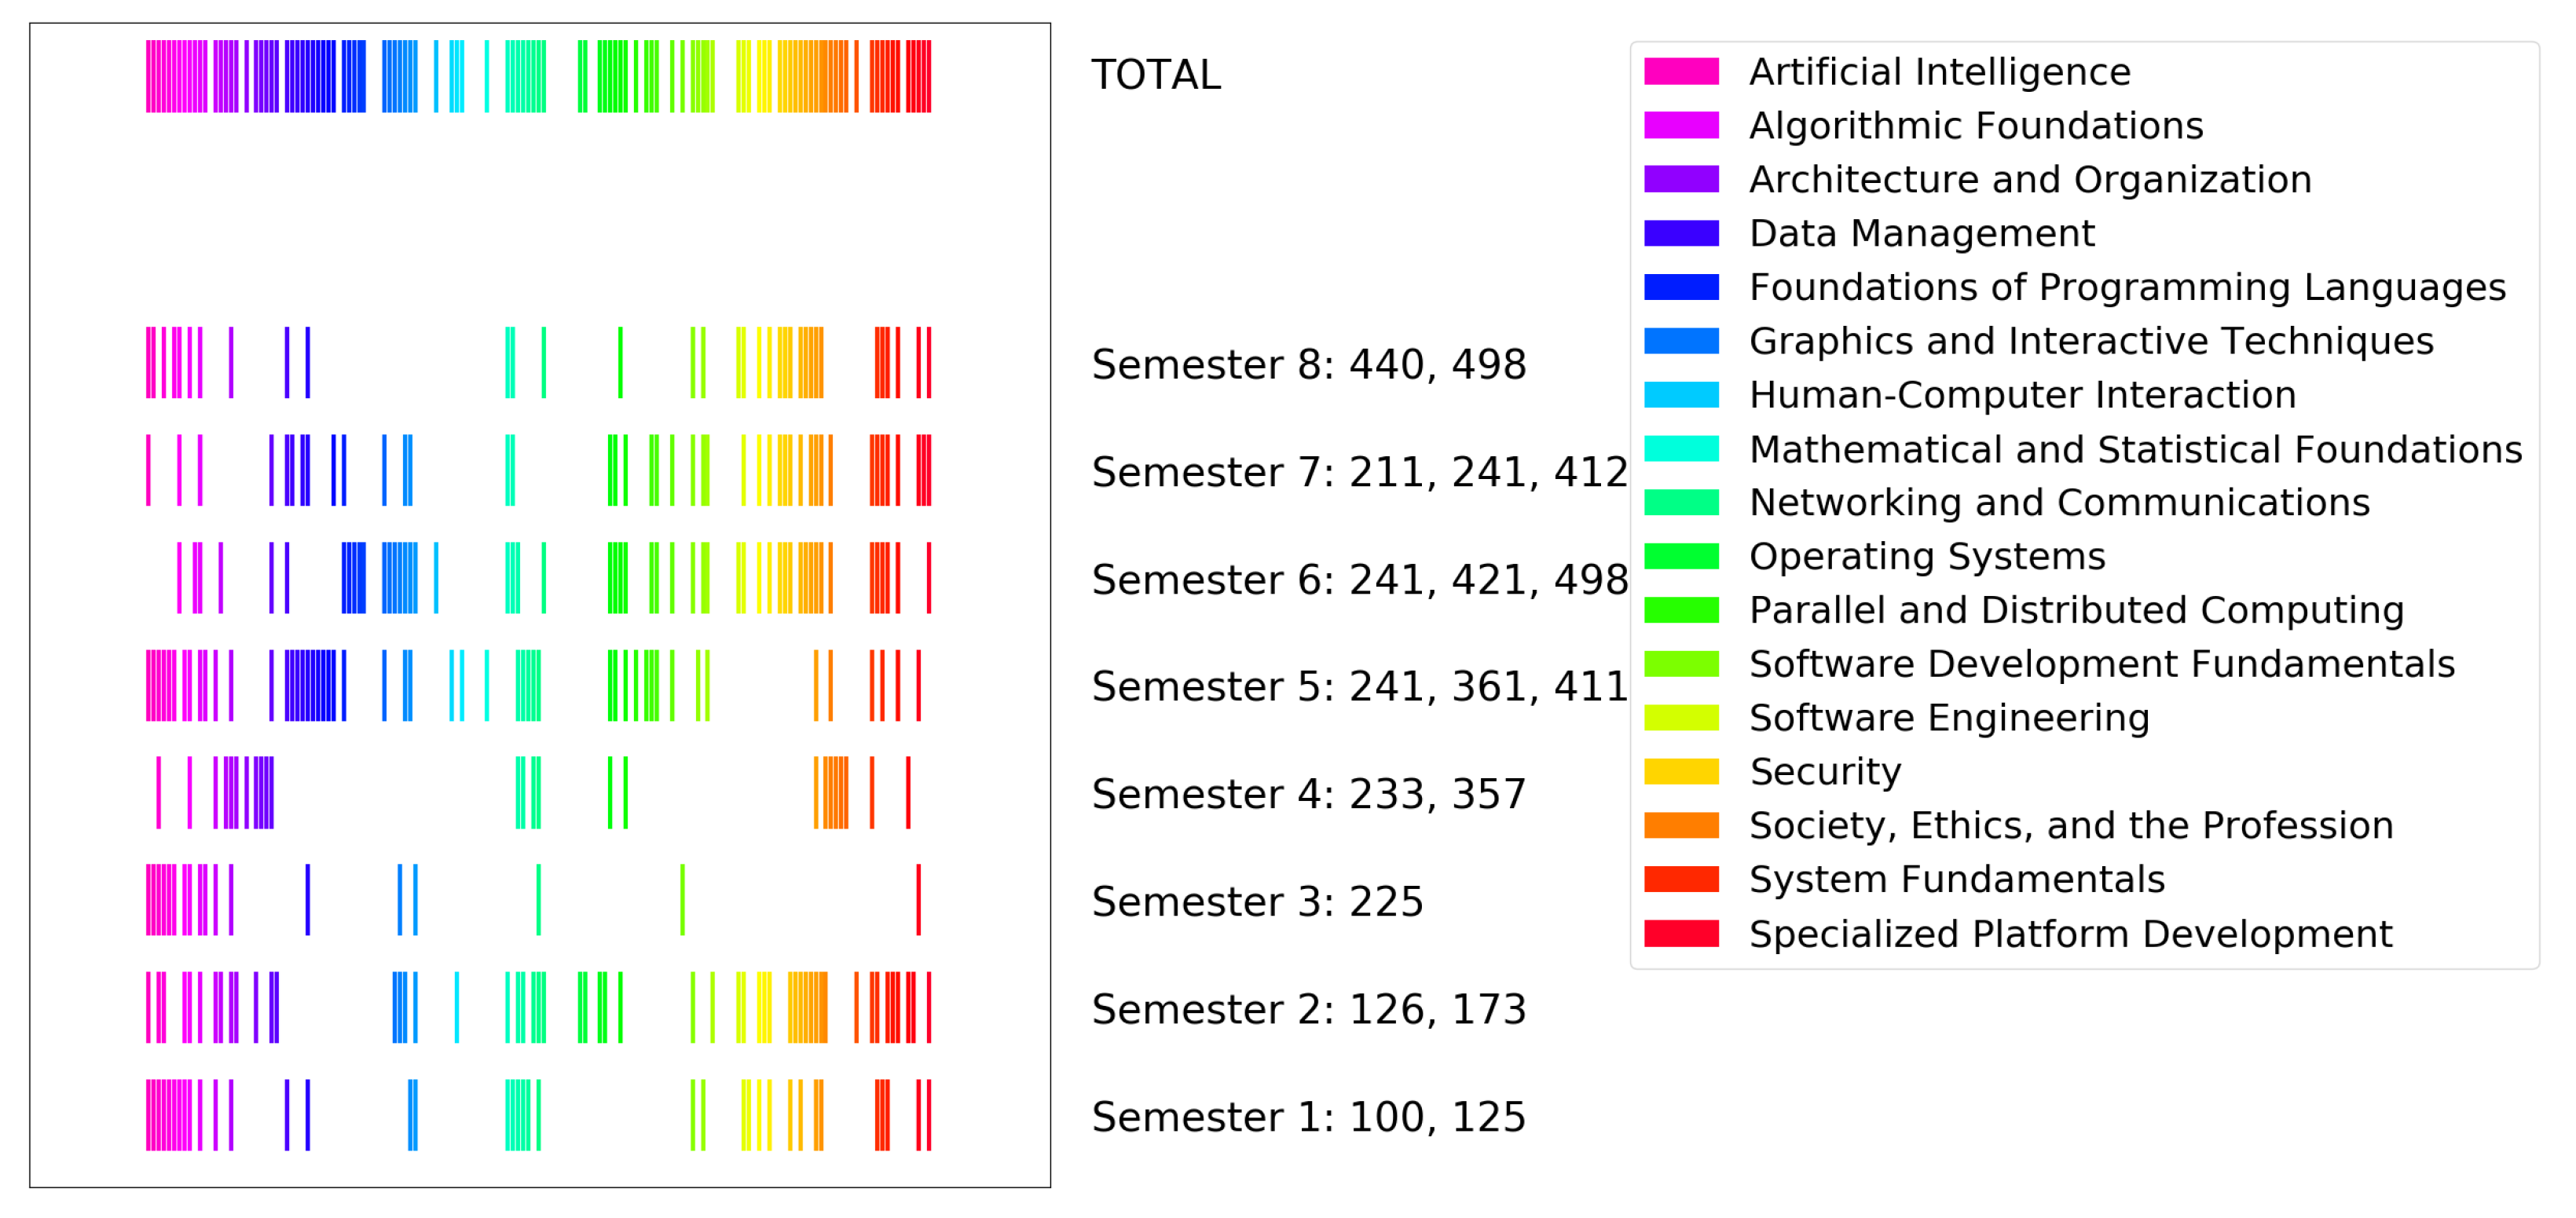
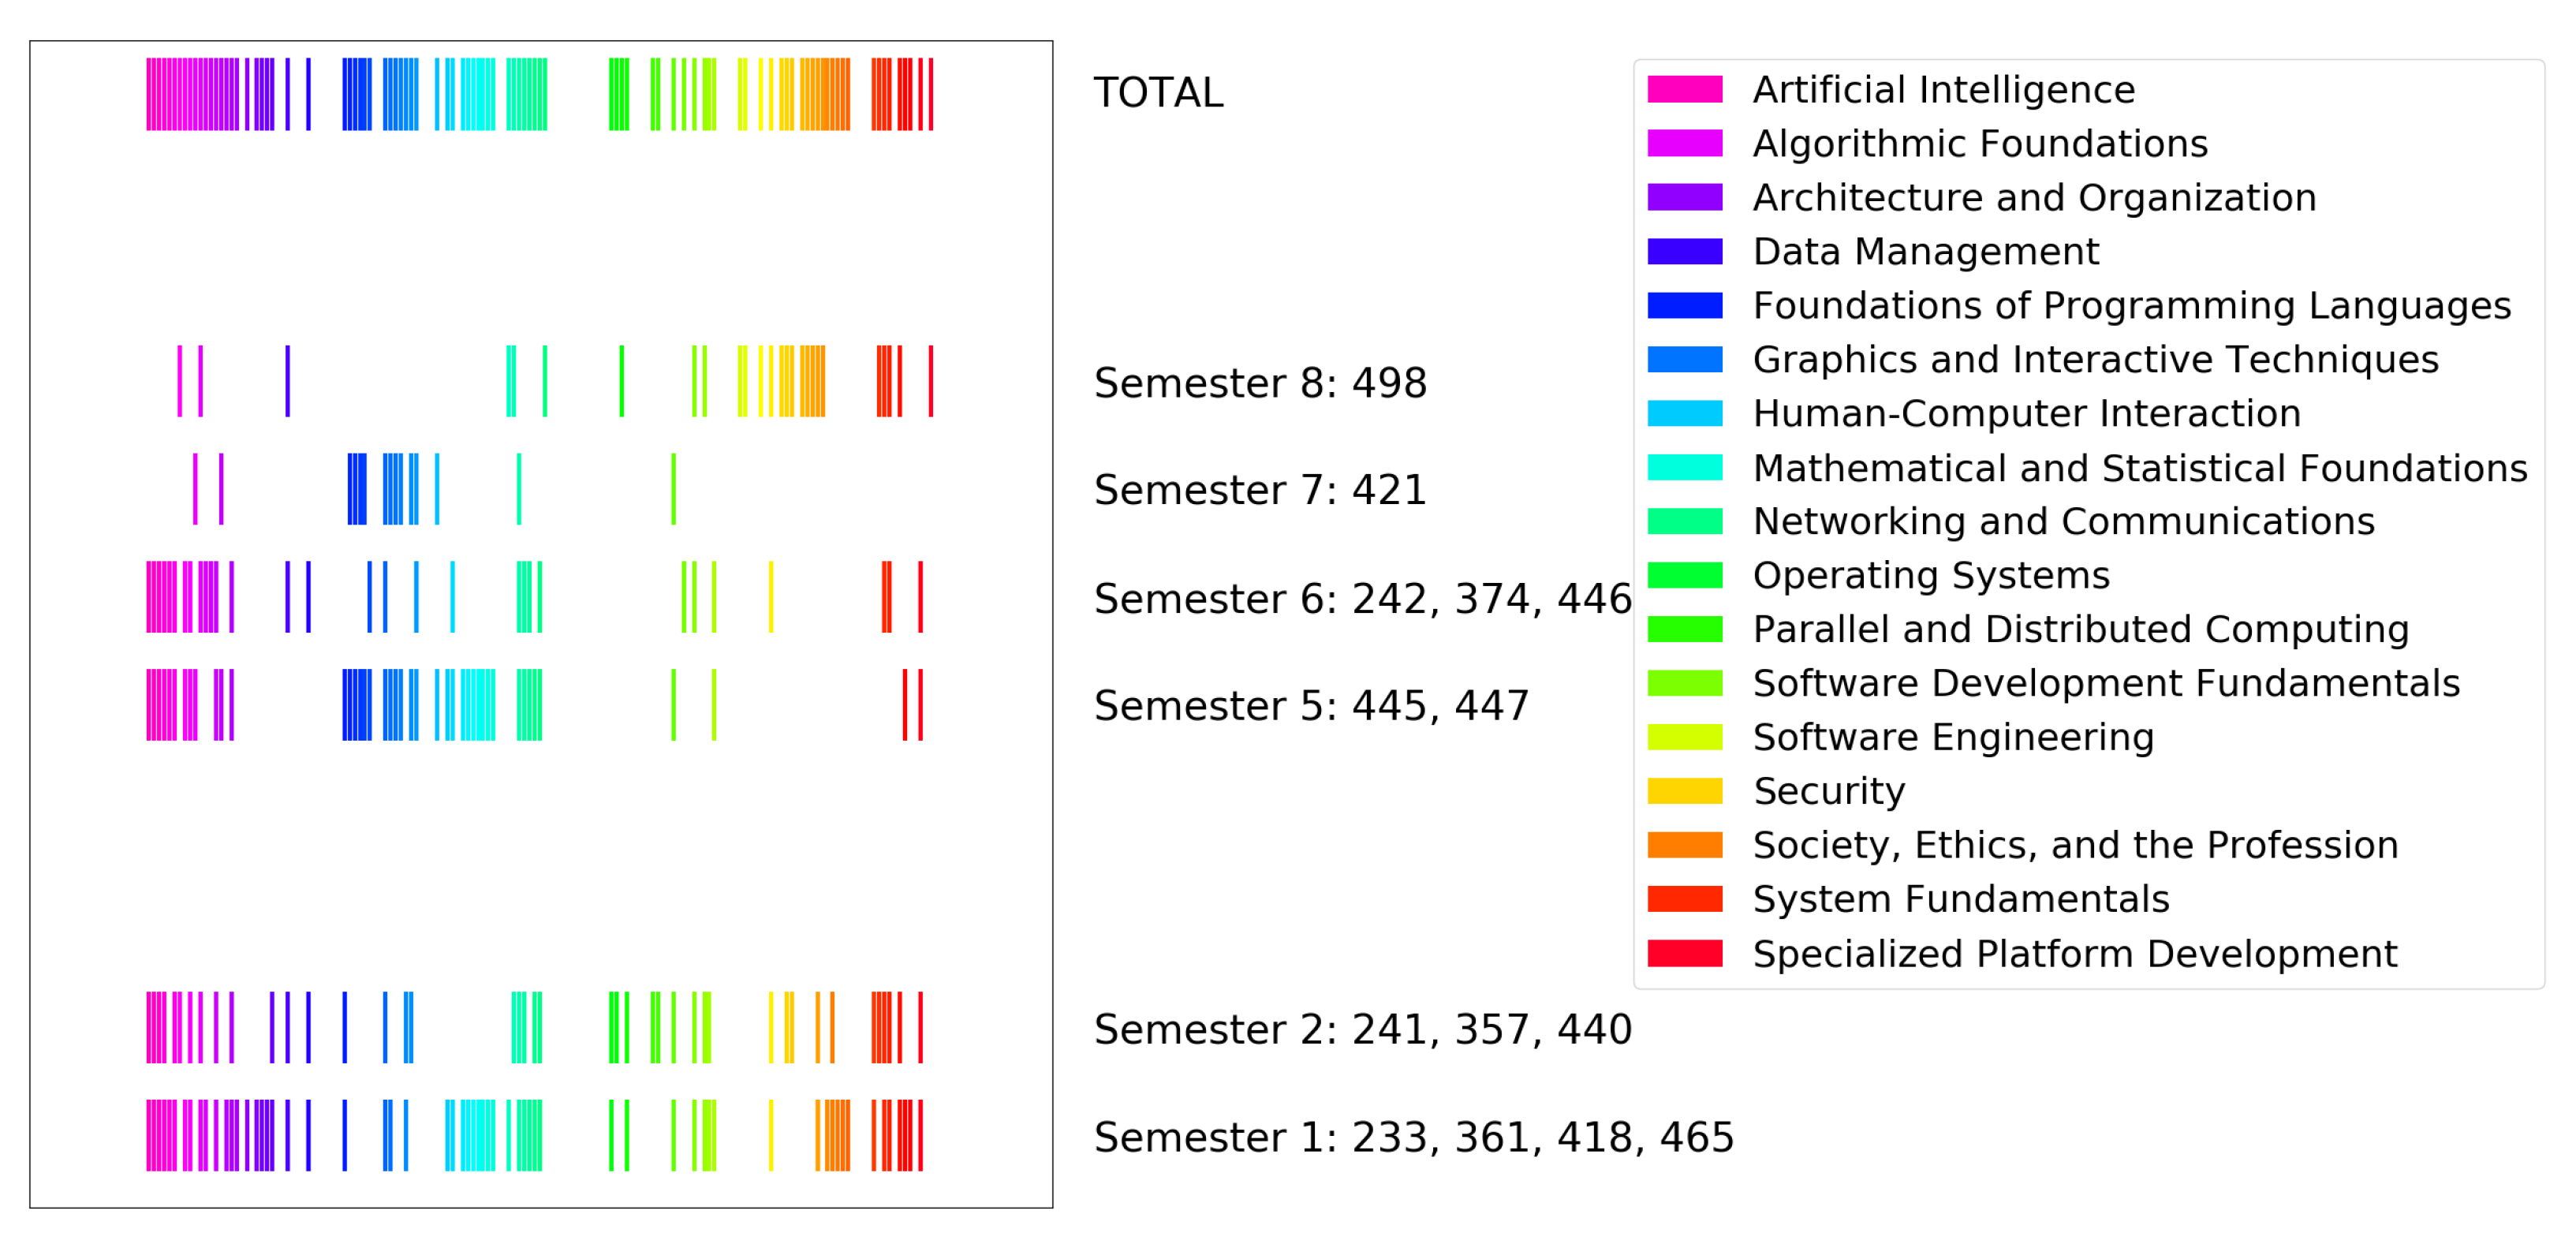
  • How can topic level visualizations be combined with student registration data to create individualized maps of topic coverage?

3. Materials and Methods

In order to produce the desired visualizations, we first needed to align each course of study to a list of topics covered in that course. We chose to compare both the CS2013 and CS2023 curriculum maps as a source list of topics. Both maps were converted to tabular format manually (converted maps included in Appendix A). The curricular topics and knowledge areas detailed in the CS2013 and CS2023 reports are short n-grams, typically between 2 and 3 words in length. The 2013 map includes 181 topic items spread across 18 categories and the 2023 map includes 179 topic items spread across 17 topic categories with detailed text descriptions.

3.1. CS2013 Data

For the 2013 map, we extracted topics from the CS2013 Appendix A: The Body of Knowledge, extracting two fields: one with the topic name and one containing context/detail of the topic. For example; “Algorithmic Strategies” is one of the topics listed, and for all such topics, we used the provided Core-Tier1 topic list for that item as the detail field. For “Algorithmic Strategies”, the Core-Tier1 topic list begins: “Brute force algorithms, Greedy algorithms”, etc. … For the 18 topics in the 2013 map which did not contain a Core-Tier1 topic list, we instead took the first paragraph of text explaining the category as the detail field.

3.2. CS2023 Data

For the 2023 map, we extracted the information from each sub-section under the Body of Knowledge section of the CS2023 report. We extracted the following four elements for each topic in the map separately: CS Core, KA Core, and Non-core knowledge lists, as well as Illustrative Learning Outcomes (ILOs). These four elements are described in brief in Table 1. Most topics in the map have a subset of these four elements. The 2023 report offers the following concise description of how each topic comprises its detail elements:
T o p i c { C S C o r e } { K A C o r e } { N o n c o r e }

3.3. Course Description and Enrollment Data

Course description text was scraped from the public facing course catalog for the 2022 academic year. Enrollment data was requested for 4 years of CS course enrollment spanning the academic years 2018 to 2022, as well as the final semester’s cumulative GPA. Students were assigned unique numerical IDs which helped to identify each semester’s enrollment at the time of data preparation; no identifiable information was requested/used in any analysis. All anonymous student data were obtained from under a Non-Human Subjects Research (NHSR) determination obtained from the university IRB, protocol number [23958].

3.4. Computational Approach

In order to align the topic items in the map to the courses of study in the CS curriculum, we devised a new approach to overcome the limitations of common NLP topic extraction methods. These limitations include not performing well on short texts, requiring large, high quality training data sets, and requiring human fine tuning to achieve state-of-the-art results (Asudani et al., 2023; Kinariwala & Deshmukh, 2023). Instead, we leveraged an existing word2vec (W2V)-style embedding model released by Efstathiou et al. which was constructed using scraped text from Stack Overflow, a popular question and answer website focused on computer science and software troubleshooting (Efstathiou et al., 2018). This embedding model captures better contexts for polysemous words which take on specific meanings in computer science. For example, in a standard corpus, neighbors of the word ‘cookie’ might be:
b r o w n i e , d e s s e r t , c h o c o l a t e ,
where in a computer science context we might expect something like:
b r o w s e r , a u t h e n t i c a t i o n , p r i v a c y ,
Because the language used on Stack Overflow is primarily focused on ideas relating to computer science, the W2V model will serve to help align our short text descriptions of the map and the courses.
Preprocessing of the course descriptions and topic map texts proceeded in a typical manner, including casting to lower case, stripping HTML tags and punctuation, removing out-of-vocabulary (OOV) words, and removing stopwords (Bird et al., 2009). For the topic maps, the source text used were the context elements extracted from each of the curriculum reports (CS2013 and CS2023). For the CS2013 map, this meant the Core-Tier1 text was used, and for the CS2023 map, we preferred the CS Core text. If there were no CS Core elements listed, we used the KA Core text, and if no KA Core text, we used Non-core text, and we only used the ILOs if no other elements were provided.
In order to map the short text of the course descriptions to the short n-gram topics in the curriculum maps, we first built a neighborhood of the 20 most similar words from the W2V model. The 20 most similar words were identified using the most_similar_cosmul() function implemented in gensim, which applies the multiplicative combination objective from Levy and Goldberg (2014) and Řehůřek and Sojka (2010). This neighborhood of similar words acts as a means to compare and differentiate terms from one another, akin to the work in Newman-Griffis and Fosler-Lussier (2017). We then proceeded to compare the neighborhoods of each topic in the knowledge map and each course description using a Word Mover’s Distance (WMD) score, again as implemented in gensim (Rehurek & Sojka, 2011). This metric allows for the context established in the larger W2V model to influence the relationship of the words expressed in the short course descriptions and topic maps without the need to construct a task-specific model (Newman-Griffis & Fosler-Lussier, 2017; Nooralahzadeh et al., 2018). The WMD scores are lower for words which share context in the model and higher for words which share different context in the model. The WMD scores were sorted lowest to highest and the knee of the resulting scores curve calculated using the Kneed python package (Arvai, 2018). Topics with WMD scores below the knee were considered to be a good match and were assigned to that course. In this way, this method can produce variable number of topic matches for each course depending on the quality of alignment of the text within the model. A pseudocode representation of the method is detailed in Algorithms 1 and 2.
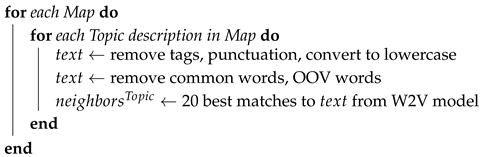
Algorithm 1: Map preprocessing.
Education 15 00614 i001
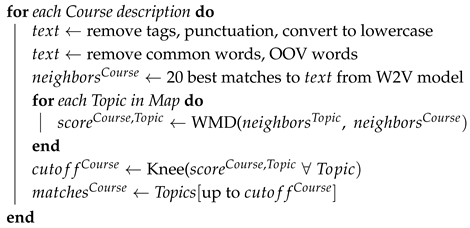
Algorithm 2: Align courses to map.
Education 15 00614 i002
Initial results were poor for many courses with extraneous or unrelated topics being matched throughout, so we added an additional preprocessing step to improve the relevance and quality of the map-to-course alignment. Using the Brown and Names corpora via the NLTK Python library, we extracted the 5000 (5 k) most common non-name (e.g., removing John, Elisabeth, etc. …) words and substituted that list for the stopwords to be removed during preprocessing (Francis & Kucera, 1979; Kantrowitz, 1995). This had the effect of removing non-specific words and additional filler words while largely preserving domain specific terms from the course descriptions and topic maps, which improved the quality of the matching results. The size of 5000 (5 k) common words to remove was selected after testing 1 k, 2 k, 3 k, 5 k, and 7 k sizes with little differences noted between 5 k and 7 k, so 5 k was selected to reduce computation time. This approach does not require the use of AI, and may therefor be preferable for some applications. Later, we compare an LLM for topic matching as a contrasting approach which some may find preferable.

3.5. Visualization

Once each course was mapped to a list of topics, those topics needed to be represented in a visualization which would be readily interpretable. To visualize the topic coverage, each topic from the map was assigned a unique horizontal index according to its placement in the map, such that topics related by a category were close together. As each course of study was loaded in from anonymized enrollment data, the topics mapped to that course were associated by their index numbers. Subsequently, the course of study for any given sequence of courses could be separated or aggregated by semester and rendered as its own sequence of topics which we call a barcode. These barcodes encode the curriculum map topics covered in courses taken. To keep the map more concise, we aggregated topics covered during each semester, such that each barcode displays all topics which were covered during at least one course in that semester. All visualization software was written in a custom Python script available on Github (https://github.com/ebbethke/ed-rainbow-plot).

4. Results

4.1. Visualization

The resulting visualization from our mapping is provided in Figure 4 and Figure 5. Each row (barcode) in this visualization represents topics covered during at least one course during that semester, and the course numbers of CS courses which contributed are annotated along the right side. At the top, the cumulative topic coverage is shown as the combination of any topic covered at least once. Note that some topics were not detected or covered. This is not necessarily indicative that the student never experienced that topic, but rather that the description text provided about the courses of study did not describe that topic in an explicit way that our computational mapping could identify.

4.2. Quality of Alignment

Manually reviewing each course, the topics identified by our method appeared to capture many of the most relevant topics to most courses. However, our method often included several topics which appeared unrelated to the course description. We identified several trends in the mapping results which are detailed in Table 2.

4.3. Potential Mapping Using LLM’s

With many options available for what topics to map and how to map them, we chose to investigate the use of LLMs to perform the mapping between course descriptions and a list of topics. We attempted to map the ‘Computer Architecture’ course to the CS2023 map using both OpenAI’s Chat-GPT 4 and Anthropic’s Claude 3.5 models (Anthropic, 2024; OpenAI, 2024). The results compared to our method are detailed in Table 3. The contemporary models from OpenAI (ChatGPT-4) and Anthropic (Claude 3.5) were both prompted by uploading the topic list as a CSV file, and then queried with the following prompt:
“Given the attached list of topics, could you please try and tell me which topics match the following text? ‘Fundamentals of computer architecture: digital logic design, working up from the logic gate level to understand the function of a simple computer; machine-level programming to understand implementation of high-level languages; performance models of modern computer architectures to enable performance optimization of software; hardware primitives for parallelism and security.’
For both ChatGPT and Claude, the free use models (4 and 3.5 Haiku respectively) provided no analysis, reporting that the task could not be completed. However, with Claude 3.5 Sonnet, the model did complete the task and offered a selection of 8 topics which it matched to the course description. The full text output can be seen in Appendix B. Claude 3.5 took approximately 8 s (average 3 runs) to generate the output for one course; our method took approximately 5 min (average 3 runs) to map 156 courses, which averages out to around 2 s per course after the initial vocabulary lists had been pre-calculated.

5. Discussion

Analysis and validation of curriculum mapping is difficult to do in an empirical manner because there is not one “correct” way to perform this type of mapping. For example; people may disagree whether to include “Linear Algebra” as a topic for an advanced computer graphics course, whether that topic should be implied by a more specific topic such as “Applied Rendering Techniques” which might imply the use linear algebra, or if indeed both should apply. We therefor relied heavily on qualitative inspection to refine the visualization and performed timing measurements to assess the performance of our method which is a common strategy for evaluating new visualizations (Isenberg et al., 2013). While there may not be one “correct” answer for this type of mapping, we were able to identify several key benefits and areas for improvement in our method from our qualitative inspection of our results.
Each barcode visualization in Figure 4, Figure 5 and Figure 6 shows how each semester contributes to the total topic coverage for the entire 8 semesters of study. Figure 7 shows the core CS course sequence recommended by this institution. At a glance, it is clear how the core topics covered at each semester contribute to the total coverage at the top. For example; looking at Figure 7, each of the first three semesters shows high coverage in the AI and algorithmic foundations categories (left, pink), and also in operating systems (center, green) and system fundamentals (right, red). From our first research question about what topic level visualizations show, it is clear we can see how the order and sequencing of courses contribute to total topic coverage. Several additional trends can be seen directly from the visualizations which reinforce several assumptions we held from personal experience. The first several semesters (barcodes closest to the bottom) tended to be more sparse than the later semesters in the plot, which makes sense if the earliest courses are more introductory and cover a few topics more broadly. We see later on, especially semesters 5 and 6 representing the third year of enrollment, are often more densely populated which makes sense that students would be taking more specialized coursework covering more detailed topics. These observations show that there is indeed variation between students that can be seen in the visualizations, both apparent from the sequencing of topic coverage from semester to semester, as well as the total coverage, answering our second research question that meaningful visualizations can be produced to view and compare individual student enrollment records.
To get a sense of the quality of the mapping, we first looked for outliers in our results and focused on categories and topics which were at the extremes of how frequently they were identified by our method (fewest and most mapped). The CS curriculum map categories with the fewest identified topics according to our alignment method was “Human Computer Interaction” (HCI) which saw fewer than half of the topics identified over the entire course registry. This category contains topics which failed to map strongly to our method. Upon inspection, HCI topics each contained very similar language to other topics in the map, which likely masked several topics from one another. This highlights a broader issue with topic extraction where multiple topics which are very close together in vocabulary and context become difficult to distinguish in such short text, and this is an active area of interest for ongoing work (Jelodar et al., 2019; Kinariwala & Deshmukh, 2023).
In Table 3, we noted that several of the most frequently mapped topics, including “Quantum Architectures”, stood out as being unlikely to be high quality matches. We inferred this given our understanding that of the courses being mapped, relatively few courses focused on quantum computing. This type of basic inference was useful to identify issues during development of the method, but does not provide a robust and repeatable measurement against which other methods may be compared (Isenberg et al., 2013). Given the lack of standards or labeled datasets against which we could compare, we present all our results ‘as-is’ for anyone to compare against their own expectations or to that of current LLMs output, and table a verification procedure for future work.
Another highlight of our method was that one of our three test student cases (see Figure 6) had front loaded courses in the first two semesters of our dataset and took multiple graphics-oriented elective courses including “Interactive Computer Graphics” and “Computational Photography” covering 5/6 of the Graphics and Visualizations category where other test students had 1 or 2 topics covered from that category. This was especially clear from the distribution of barcodes, and from the different gaps in the TOTAL coverage at the top. These direct observations highlight how our method succeeds in easily finding differences in student topic coverage and curricular navigation strategy/preferences.
Comparing our method’s mapping results to the LLMs (see Table 3), it is clear that our method provides many more topic matches than the LLMs. Our method captured several items we felt were high quality which the LLM did not provide, highlighting how the goal of the mapping and resulting visualization may affect the choice of mapping methods. The LLM provided fairly appropriate and succinct topic mappings, but may not cover all reasonable matches which may help expand the overall curriculum map. For example; “System Performance”, and “System Fundamentals: Basic Concepts” matched by our method both match the course description text for the course “Computer Architectures” quite well, yet were not matched by the LLM. This result was expected, as the LLMs are trained on very large corpora of natural language, and likely pick up on the syntax without being able to directly calculate the epistemological aspects of the topic map. We also found several of our matches appear to be extraneous; for example, “Sustainability Issues” is a topic which is likely not covered in great detail in “Computer Architectures”. We understand that the curriculum map text describing “Sustainability Issues” was long and used broad terms (including: resources, models, energy, footprint, data, etc. …) which likely produced spurious matches. The overall result is that the LLM does a very decent job at providing a summary and clear alignment between the course description and the topic map, where our method extends the matching to a deeper level of detail, which has a direct impact on the visualizations produced. Possible considerations include whether this style of visualization is intended for student viewing, where a more concise map may be appropriate; or whether the purpose is evaluating accreditation criteria, where a more broad mapping may be better suited. Ultimately, it will be up to the users making a map to choose the method best aligned with their goals.

Limitations

The method presented is not without issues. For one, the method relies on a word embedding model trained on decent amounts of text specific and relevant to the domain of study (in our case, CS) to adequately differentiate similar items in the topic map to align them correctly. In the Efstathiou W2V model, 10 years of text from 2008 to 2017 (15 GB) were cleaned and used to prepare the model (Efstathiou et al., 2018). While we felt our method performed fairly well using this resource, a more up-to-date W2V model would likely perform even better, especially given the number of advances in the field since 2017, which may provide higher quality results, and potentially reduce the number of erroneous matches. Because our method provides only a distance score to judge the quality of matches, we have fewer post-processing options, where a generative LLM can also provide generative explanation text.
Finally, we acknowledge that utilizing colors in our visualizations to identify categories is problematic for multiple reasons, including the difficulty to delineate edges between categories precisely and any color vision deficiencies would make this visualization additionally challenging to parse. However, we feel the spatially separated topics still convey a sense of topic coverage even discounting the color scheme. Additional visual information could also be added to the visualizations according to preferences, such as boundaries between categories, hover-labels for topics, or even animations showing the addition of courses and topics over time. We chose to present a simplistic version of the visualization as a baseline upon which changes and additions would be made.

6. Conclusions

The focus of this work was to develop and demonstrate a method for mapping course description text to an established topic map so the topics could be visualized intuitively. We did not compare our method against different approaches including common topic extraction methods like Latent Dirichlet Allocation or Term Frequency Inverse Document Frequency (TF-IDF) due to the aforementioned difficulties in evaluating the results and also the challenges these methods have with short texts (Blei et al., 2003; Jelodar et al., 2019; Zhao et al., 2018).
Despite the limitations, we were encouraged to see that even our parsimonious method could recover high quality topic matches to short-text course descriptions, identifying most of the same matches a state-of-the-art LLM while including several other additional high quality matches not included in the LLM output. This result highlights how multiple mapping methods may be used to generate topic-level visualizations, depending on the goal of the visuals. Our visualizations themselves allow for quick and straightforward means of comparing and identifying gaps in topic coverage and differences between students beyond what prior visualizations would allow for. In light of our results, we believe there is potential for these types of models to help support complex manual labor like curriculum mapping. It is important to acknowledge that both our results and those from the LLMs would not be sufficient to completely replace human experts, but both may serve as a valid starting point to enhance or expedite manual review.

Future Directions

We plan on further improving the method by exploring other means of improving our matching algorithm, and investigate further the reason why some topics were not matched by either our algorithm or the LLMs when we felt they should have been. It is possible that refining the topic map descriptions or extending the course description text may lead to additional improvements in the alignment. We were also unable to compare our methods to human experts due to the intensive time demands, but we plan to refine our method and engage qualified faculty to compare and contrast human made maps with computationally aligned maps to asses how our method compares to multiple human raters similar to prior work in this space (Schutte et al., 2019). There is also a possibility in future work to extend the mapping from rather broad course descriptions to course syllabi to achieve an even finer-grained and detailed result, which may be beneficial to staff, faculty, and students to rank, sort, and view topic coverage over larger portions of the curriculum. Finally, we hope to apply this method to additional programs of study beyond CS and evaluate the more general approach and its efficacy.

Author Contributions

Conceptualization, E.B. and J.R.A.; methodology, E.B.; software, E.B.; validation, E.B.; formal analysis, E.B.; investigation, E.B.; resources, J.R.A.; data curation, E.B.; writing—original draft preparation, E.B.; writing—review and editing, J.R.A.; visualization, E.B.; supervision, J.R.A.; project administration, E.B. All authors have read and agreed to the published version of the manuscript.

Funding

This research received no external funding.

Institutional Review Board Statement

The study was determined to be Non-Human Subjects Research (NHSR) by the Institutional Review Board of the University of Illinois (23958).

Informed Consent Statement

Not applicable.

Data Availability Statement

The original contributions presented in this study are included as links to a public Github: https://github.com/ebbethke/ed-rainbow-plot, accessed on 11 May 2025. Further inquiries can be directed to the corresponding author.

Acknowledgments

The authors would like to thank Johann Pally for their support for the initial data acquisition.

Conflicts of Interest

The authors declare no conflicts of interest.

Abbreviations

The following abbreviations are used in this manuscript:
ACMAssociation of Computing Machinery
NLPNatural Language Processing
LLMLarge Language Model
HPKHigh Prior Knowledge
LPKLow Prior Knowledge
ILOIllustrative Learning Outcome
W2VWord2Vec
OOVOut of Vocabulary
WMDWord Mover Distance

Appendix A

Appendix A.1. CS2013 Topic Map

Appendix A.2. CS2023 Topic Map

Appendix B. Claude 3.5 Sonnet Mapping Computer Architecture Course Description Text to the CS2023 Topic Map

Let me analyze the text and match it with topics from the provided list. The text describes fundamentals of computer architecture, starting from basic components and working up to advanced concepts.
Let’s break down the main components of the text and match them:
  • “digital logic design, working up from the logic gate level” matches:
    -
    Digital Logic and Digital Systems
  • “understand the function of a simple computer” and “machine-level programming” matches:
    -
    Assembly Level Machine Organization
    -
    Machine-Level Data Representation
    -
    Functional Organization
  • “performance models of modern computer architectures to enable performance optimization” matches:
    -
    Performance and Energy Efficiency
    -
    Systems Execution and Memory Model
  • “hardware primitives for parallelism and security” matches:
    -
    Parallel and Distributed Computing
    -
    Secure Processor Architectures
Additionally, as this covers computer architecture fundamentals broadly, it also relates to:
-
Memory Hierarchy
-
Interfacing and Communication
So the most relevant topics from the list are:
  • Digital Logic and Digital Systems
  • Machine-Level Data Representation
  • Assembly Level Machine Organization
  • Functional Organization
  • Performance and Energy Efficiency
  • Secure Processor Architectures
  • Memory Hierarchy
  • Interfacing and Communication
Would you like me to explain how any of these topics specifically relate to the text?

References

  1. Amadieu, F., van Gog, T., Paas, F., Tricot, A., & Mariné, C. (2009). Effects of prior knowledge and concept-map structure on disorientation, cognitive load, and learning. Learning and Instruction, 19(5), 376–386. [Google Scholar] [CrossRef]
  2. Anthropic. (2024). Claude. (Large Language Model). Available online: https://anthropic.com/claude (accessed on 4 December 2024).
  3. Arvai, K. (2018). kneed: Knee-point detection in Python. Available online: https://github.com/arvkevi/kneed (accessed on 5 May 2024).
  4. Assiri, A., AL-Malaise, A., & Brdesee, H. (2020). From traditional to intelligent academic advising: A systematic literature review of e-academic advising. IJACSA, 11(4), 507–517. [Google Scholar] [CrossRef]
  5. Asudani, D. S., Nagwani, N. K., & Singh, P. (2023). Impact of word embedding models on text analytics in deep learning environment: A review. Artificial Intelligence Review, 56(9), 10345–10425. [Google Scholar] [CrossRef]
  6. Bird, S., Klein, E., & Loper, E. (2009). Natural language processing with Python. O’Reilly. [Google Scholar]
  7. Blei, D. M., Ng, A. Y., & Jordan, M. I. (2003). Latent dirichlet allocation. Journal of Machine Learning Research, 3, 993–1022. [Google Scholar]
  8. CC2020 Task Force. (2020a). Computing curricula 2020: Paradigms for global computing education. ACM. [Google Scholar] [CrossRef]
  9. CC2020 Task Force. (2020b). Computing curricula 2020: Paradigms for global computing education. Appendix G. [Google Scholar]
  10. Clemmons, A. W., Donovan, D. A., Theobald, E. J., & Crowe, A. J. (2022). Using the intended–enacted–experienced curriculum model to map the vision and change core competencies in undergraduate biology programs and courses. LSE, 21(1), ar6. [Google Scholar] [CrossRef] [PubMed]
  11. Efstathiou, V., Chatzilenas, C., & Diomidis, S. (2018, March). Word embeddings for the software engineering domain. Zenodo. [Google Scholar] [CrossRef]
  12. Ervin, L., Carter, B., & Robinson, P. (2013). Curriculum mapping: Not as straightforward as it sounds. Journal of Vocational Education and Training, 65(3), 309–318. [Google Scholar] [CrossRef]
  13. Falegnami, A., Romano, E., & Tomassi, A. (2024). The emergence of the GreenSCENT competence framework: A constructivist approach: The GreenSCENT theory. In The european green deal in education (p. 13). Routledge. [Google Scholar]
  14. Francis, W. N., & Kucera, H. (1979). Brown corpus manual. Available online: http://clu.uni.no/icame/manuals/BROWN/INDEX.HTM (accessed on 5 May 2024).
  15. Ikuta, T., & Gotoh, Y. (2014). Development of visualization of learning outcomes using curriculum mapping. In D. G. Sampson, D. Ifenthaler, J. M. Spector, & P. Isaias (Eds.), Digital systems for open access to formal and informal learning (pp. 69–82). Springer International Publishing. [Google Scholar] [CrossRef]
  16. Isenberg, T., Isenberg, P., Chen, J., Sedlmair, M., & Möller, T. (2013). A systematic review on the practice of evaluating visualization. IEEE Transactions on Visualization and Computer Graphics, 19(12), 2818–2827. [Google Scholar] [CrossRef] [PubMed]
  17. Jelodar, H., Wang, Y., Yuan, C., Feng, X., Jiang, X., Li, Y., & Zhao, L. (2019). Latent Dirichlet allocation (LDA) and topic modeling: Models, applications, a survey. Multimedia Tools and Applications, 78(11), 15169–15211. [Google Scholar] [CrossRef]
  18. Kantrowitz, M. (1995). Names corpus. Available online: http://www.cs.cmu.edu/afs/cs/project/ai-repository/ai/areas/nlp/corpora/names/readme.txt (accessed on 5 May 2024).
  19. Kinariwala, S., & Deshmukh, S. (2023). Short text topic modelling using local and global word-context semantic correlation. Multimedia Tools and Applications, 82(17), 26411–26433. [Google Scholar] [CrossRef] [PubMed]
  20. Kumar, A. N., Raj, R. K., Aly, S. G., Anderson, M. D., Becker, B. A., Blumenthal, R. L., Eaton, E., Epstein, S. L., Goldweber, M., Jalote, P., Lea, D., Oudshoorn, M., Pias, M., Reiser, S., Servin, C., Simha, R., Winters, T., & Xiang, Q. (2024). Computer science curricula 2023. ACM. [Google Scholar] [CrossRef]
  21. Lam, B. H., & Tsui, K. T. (2016). Curriculum mapping as deliberation—Examining the alignment of subject learning outcomes and course curricula. Studies in Higher Education, 41(8), 1371–1388. [Google Scholar] [CrossRef]
  22. Levy, O., & Goldberg, Y. (2014, June). Linguistic Regularities in Sparse and Explicit Word Representations. In R. Morante, & S. W.-t. Yih (Eds.), Proceedings of the eighteenth conference on computational natural language learning (pp. 171–180). Association for Computational Linguistics. [Google Scholar] [CrossRef]
  23. Newman-Griffis, D., & Fosler-Lussier, E. (2017). Second-order word embeddings from nearest neighbor topological features. arXiv. [Google Scholar] [CrossRef]
  24. Nooralahzadeh, F., Øvrelid, L., & Lønning, J. T. (2018). Evaluation of Domain-specific Word Embeddings using Knowledge Resources. In N. Calzolari, K. Choukri, C. Cieri, T. Declerck, S. Goggi, K. Hasida, H. Isahara, B. Maegaard, J. Mariani, H. Mazo, A. Moreno, J. Odijk, S. Piperidis, & T. Tokunaga (Eds.), Proceedings of the eleventh international conference on language resources and evaluation (LREC 2018) (pp. 1438–1445). European Language Resources Association (ELRA). Available online: https://aclanthology.org/L18-1228/ (accessed on 14 January 2025).
  25. OpenAI. (2024). Chatgpt: A conversational AI model. Available online: https://openai.com/chatgpt (accessed on 4 December 2024).
  26. Rawle, F., Bowen, T., Murck, B., & Hong, R. (2017). Curriculum mapping across the disciplines: Differences, approaches, and strategies. CELT, 10, 75–88. [Google Scholar] [CrossRef]
  27. Rehurek, R., & Sojka, P. (2011). Gensim–python framework for vector space modelling. NLP Centre, Faculty of Informatics, Masaryk University, Brno, Czech Republic, 3(2), 45–50. [Google Scholar]
  28. Řehůřek, R., & Sojka, P. (2010). Software framework for topic modelling with large corpora. University of Malta. Available online: https://is.muni.cz/publication/884893/en/Software-Framework-for-Topic-Modelling-with-Large-Corpora/Rehurek-Sojka (accessed on 10 June 2022).
  29. Schutte, K., Line, D., & McCullick, C. (2019). Using curriculum mapping and visualization to maximize effective change. AIJ, 8(2), 81–93. [Google Scholar] [CrossRef]
  30. Su, M. T., Tempero, E., Hosking, J., & Grundy, J. (2012, August 20–24). A study of architectural information foraging in software architecture documents [Conference session]. 2012 Joint Working IEEE/IFIP Conference on Software Architecture and European Conference on Software Architecture (pp. 141–150), Helsinki, Finland. [Google Scholar] [CrossRef]
  31. Takada, S., Cuadros-Vargas, E., Impagliazzo, J., Gordon, S., Marshall, L., Topi, H., van der Veer, G., & Waguespack, L. (2020). Toward the visual understanding of computing curricula. Education and Information Technologies, 25(5), 4231–4270. [Google Scholar] [CrossRef]
  32. The Joint Task Force on Computing Curricula & Association for Computing Machinery and IEEE Computer Society. (2013). Computer science curricula 2013: Curriculum guidelines for undergraduate degree programs in computer science. Association for Computing Machinery. [Google Scholar]
  33. Zhao, G., Liu, Y., Zhang, W., & Wang, Y. (2018, January 13–15). TFIDF based feature words extraction and topic modeling for short text [Conference session]. 2018 2nd International Conference on Management Engineering, Software Engineering and Service Sciences (pp. 188–191), Wuhan, China. [Google Scholar] [CrossRef]
Figure 1. Fictitious representation of a stereotypical curriculum map for the first 3 semesters of study. Note how student choices are unclear (e.g., can a student take 101 and 104, or can they only take one of those two?), and how the content and focus of each course is completely hidden, requiring further work to understand the practical aspects of the curriculum.
Education 15 00614 g001
Figure 2. A radar plot from CC2020 showing the difference in knowledge coverage between an example Information Technology (IT, orange) program and Computer Science (CS, blue) program, and a student selection of criteria (green). It can be challenging to interpret what the overlap signifies, and how significant the shaded areas are between the ordinal ratings. Originally figure G.8; used with permission (CC2020 Task Force, 2020b).
Education 15 00614 g002
Figure 3. A graphical representation of topics laid out in CC2013. Nodes highlighted yellow were selected topics which were sub-topics of Human Computer Interaction (HCI). Notice how nodes are not readily legible, some are hidden or obscured, and patterns in local connectivity are difficult to consider given the scale of the graphic, requiring search and zoom functionality which may be challenging to lower knowledge users. Originally figure G.22; used with permission (CC2020 Task Force, 2020b).
Education 15 00614 g003
Figure 4. Topic coverage visualized for an example student using the CS2013 topic map. Each colored bar represents a topic identified from a course description with color aligning to the categories in the legend. Each row of bars represents all topics covered during a semester. Each row is labeled at the right with courses enrolled for that semester. The total coverage of topics is shown at the top (TOTAL), and is the combination of all semesters.
Education 15 00614 g004
Figure 5. Same courses of study as Figure 4, but mapped using the CS2023 topic map. Note how this topic map produces different density of topics in certain categories. Also note the maps have slightly different categories, and are not directly comparable.
Education 15 00614 g005
Figure 6. Different example student courses mapped using the CS2023 topic map. Compared to Figure 5, more Graphics and Interactive Technologies covered (Teal), fewer Data Management (Dark Blue) and Operating Systems (Green) covered, and more heavily front-loaded coursework. Student had no enrollment in any CS courses for semesters 3 or 4.
Education 15 00614 g006
Figure 7. Topic coverage of the recommended core coursework visualized using the CS2023 topic map. These represent the required core courses in CS with no electives or general education requirements, in the sequence recommended by the university according to their typical curriculum map.
Education 15 00614 g007
Table 1. CS2023 Topic elements described.
ElementDescriptionExample Item
CS CoreMust know topics; kept to a minimumComplexity
KA CoreTopics for in-depth studyFormal Recursive Analysis
Non-coreElective topicsQuantum Computation
ILOsDescriptive student activities, results, or valuesExplain examples of NP–complete problems.
Table 2. Summary of trends noted in the alignment of courses to topics using our method.
TrendExplanation
Special topics and independent study courses produce spurious mapThesis research, Seminar courses, Individual study etc. … cannot be mapped without better data
More detailed descriptions yield better resultsThe more specific the language (eigenvalues, vertex, combinatorics, …) vs. (algorithm, topics, methods, …)
WMD scores tended to be lower (0.3–0.7) for better matchese.g., Course: “Probability and Statistics” top 2: Statistics (0.52), Probability (0.55) vs. “Special Topics” top 2: Teamwork (0.85), Evaluating the Design (0.86)
Some matches appear logical without direct evidenceFor example, course “Database Systems” matched to topic “NoSQL Systems” which is reasonable but may not actually be covered as it was not listed explicitly in the course description
Several topics over- or under-matched coursese.g., Topic: “Quantum Architectures” matched 40% of courses, likely because it was defined using many generic terms like: “principle, axiom, measurement, computation, state, theorem” and few specific terms like: “qubit, entanglement, quantum”
Table 3. Mapping comparison between Chat-GPT 4, Claude 3.5 Sonnet, and our method for one course, Computer Architecture, using the CS2023 Map. Items which our method matched Claude’s mapping are bolded.
ModelTopics Identified
Chat-GPT 4None (did not compute)
Claude 3.5 SonnetDigital Logic and Digital Systems
Machine-Level Data Representation
Assembly Level Machine Organization
Functional Organization
Performance and Energy Efficiency
Secure Processor Architectures
Memory Hierarchy
Interfacing and Communication
Our MethodHeterogeneous Architectures
System Fundamentals: Basic Concepts
Overview of Computer Systems
Performance and Energy Efficiency
Assembly Level Machine Organization
Performance Evaluation
Embedded Platforms
Functional Organization
Principles of Operating Systems
Common Aspects/Shared Concerns
Sustainability Issues
Computing History
Resource Management
System Performance
Scheduling
Digital Logic and Digital Systems
Interfacing and Communication
Disclaimer/Publisher’s Note: The statements, opinions and data contained in all publications are solely those of the individual author(s) and contributor(s) and not of MDPI and/or the editor(s). MDPI and/or the editor(s) disclaim responsibility for any injury to people or property resulting from any ideas, methods, instructions or products referred to in the content.

