
Psychometric Network Analysis and Dimensionality Assessment: A Software Review


Abstract
1. Introduction
1.1. Psychometric Network Analysis
1.2. Psychometric Network Analysis and Exploratory Factor Analysis
1.3. R Packages for Psychometric Network Analysis
2. Methods
2.1. Data
2.2. Data Analysis
3. Results
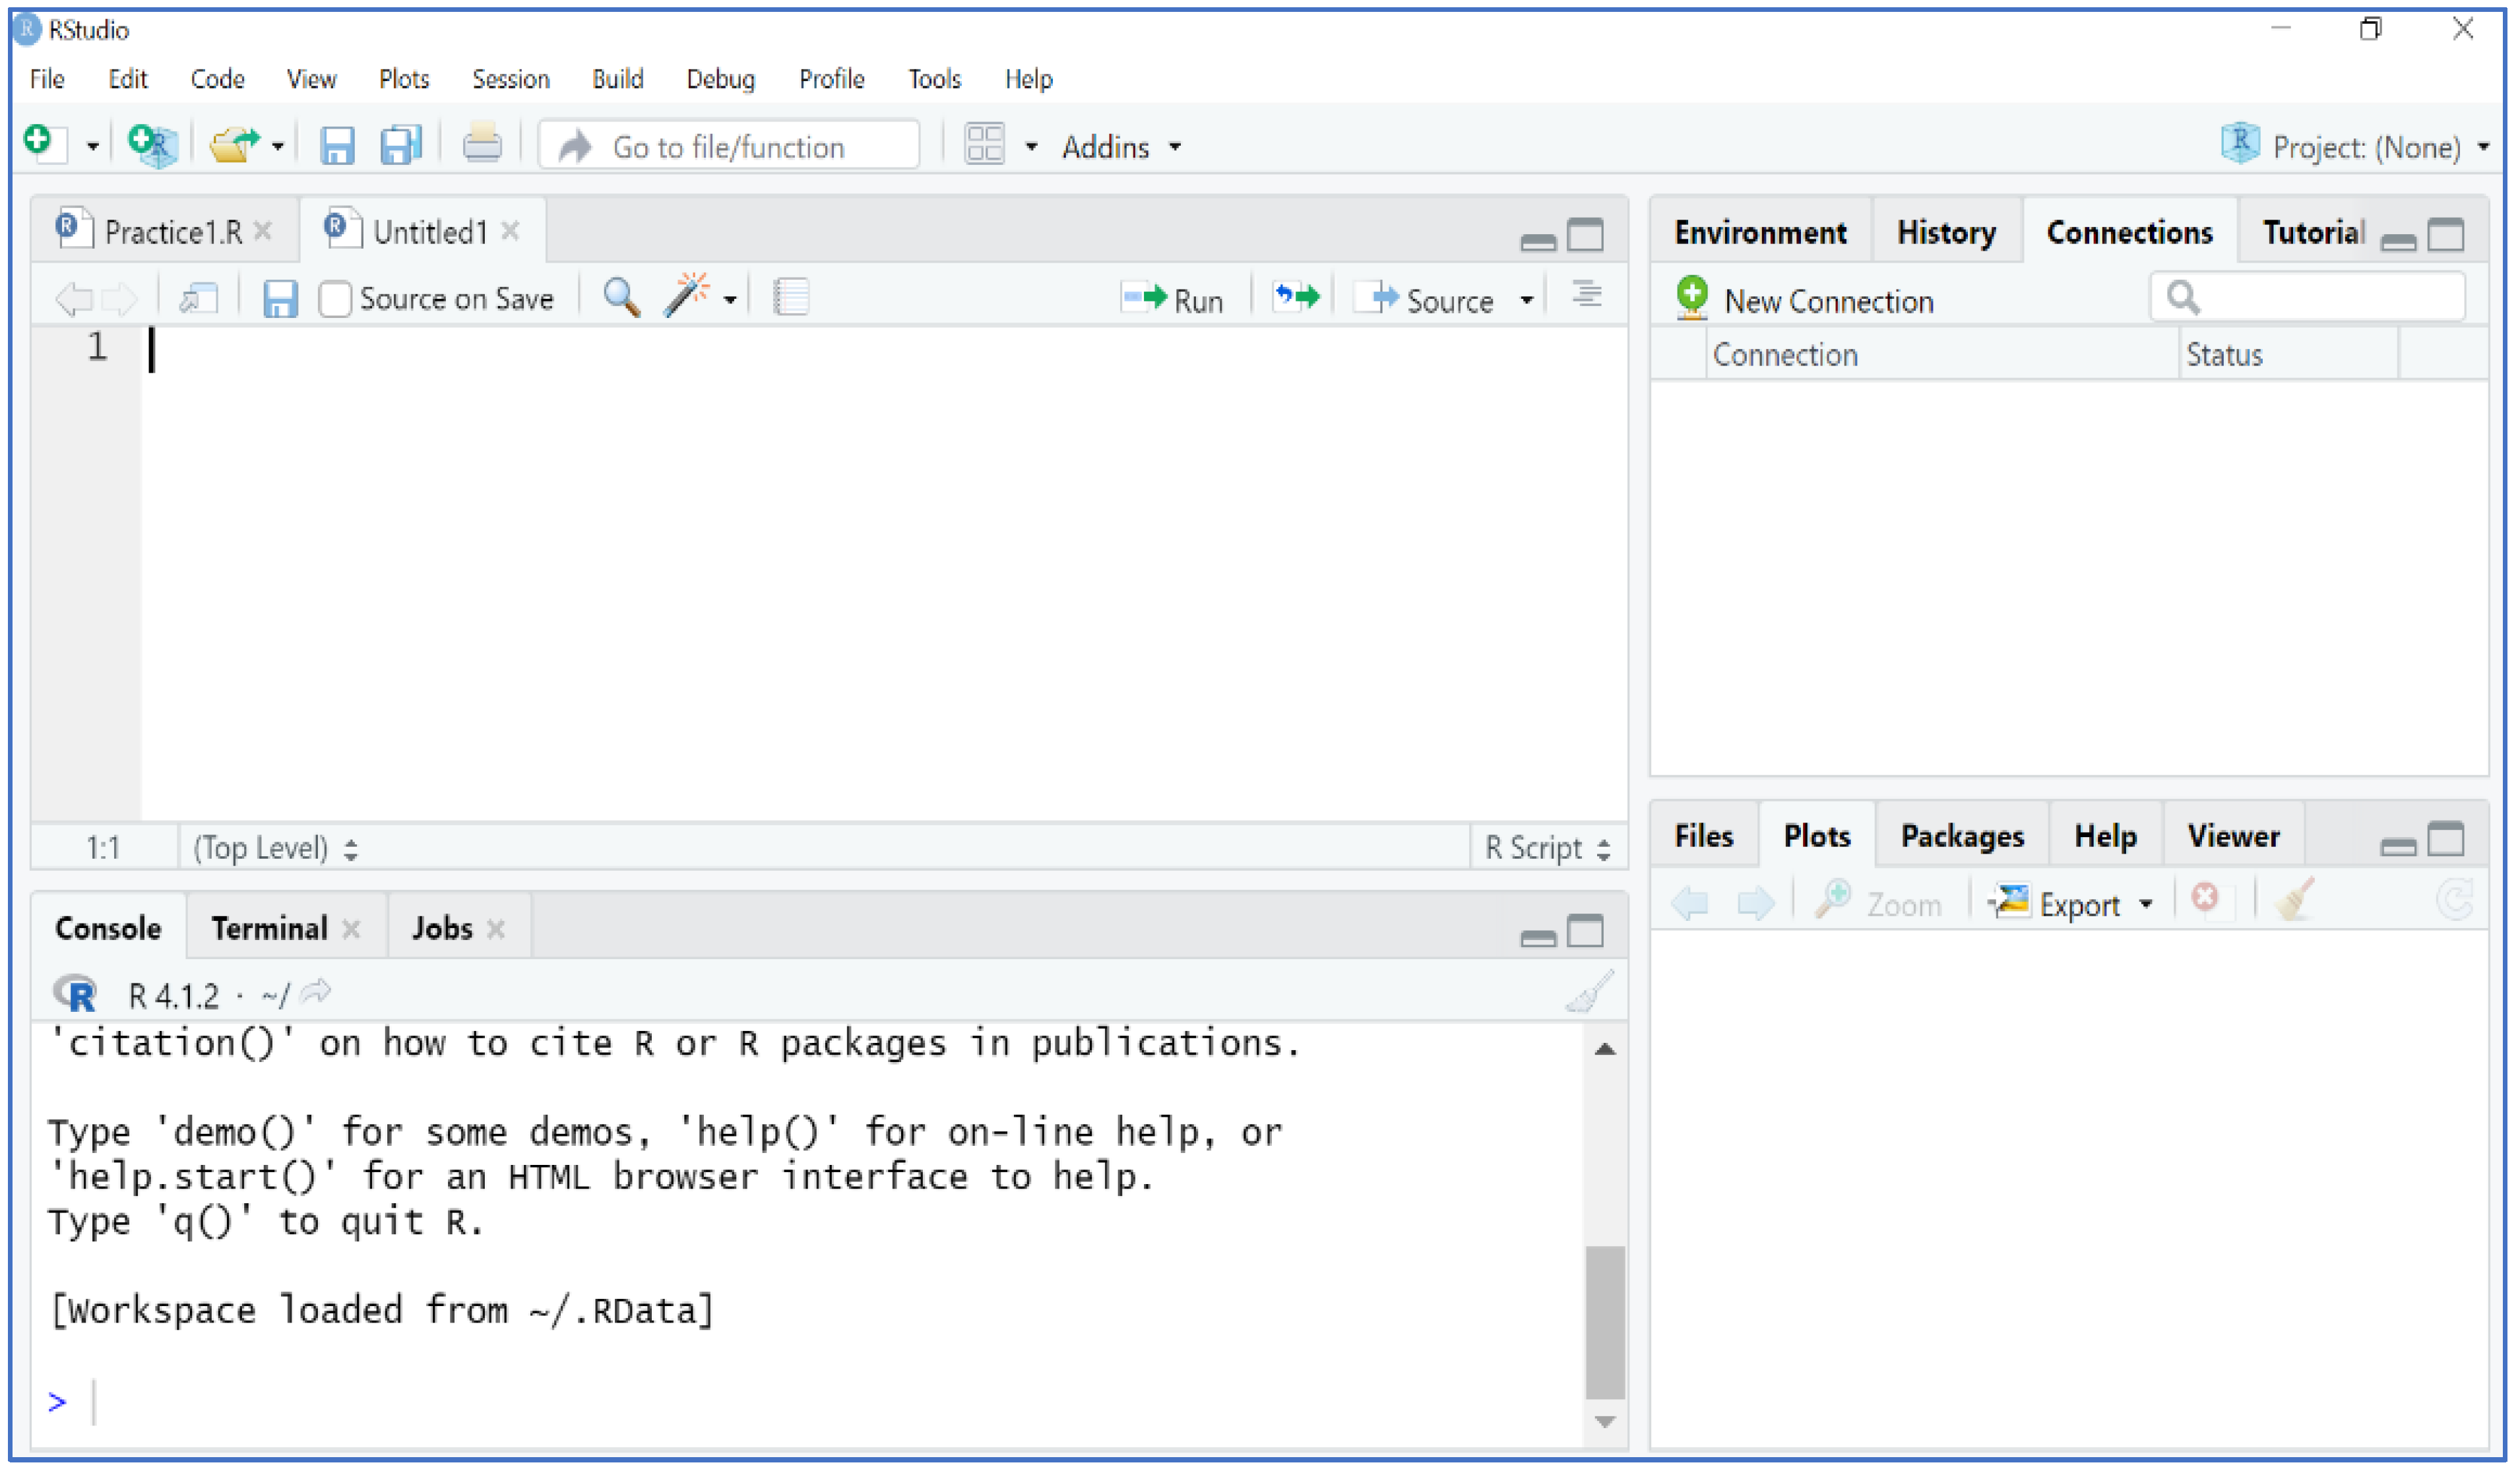
3.1. Step One: Data Setup
| Install.packages(“tidyverse”) #This includes a few commonly used packages install.packages(“psych”) #We will use bfi data from this packages library(tidyverse) library(psych) |
| #only select the measurement items and exclude the demographical variables bfidata <- bfi[, 1:25] |
| Install.packages(“qgraph”) install.packages(“bootnet”) install.packages(“EGAnet”) install.packages(“BGGM”) library(qgraph) library(bootnet) library(EGAnet) library(BGGM) |
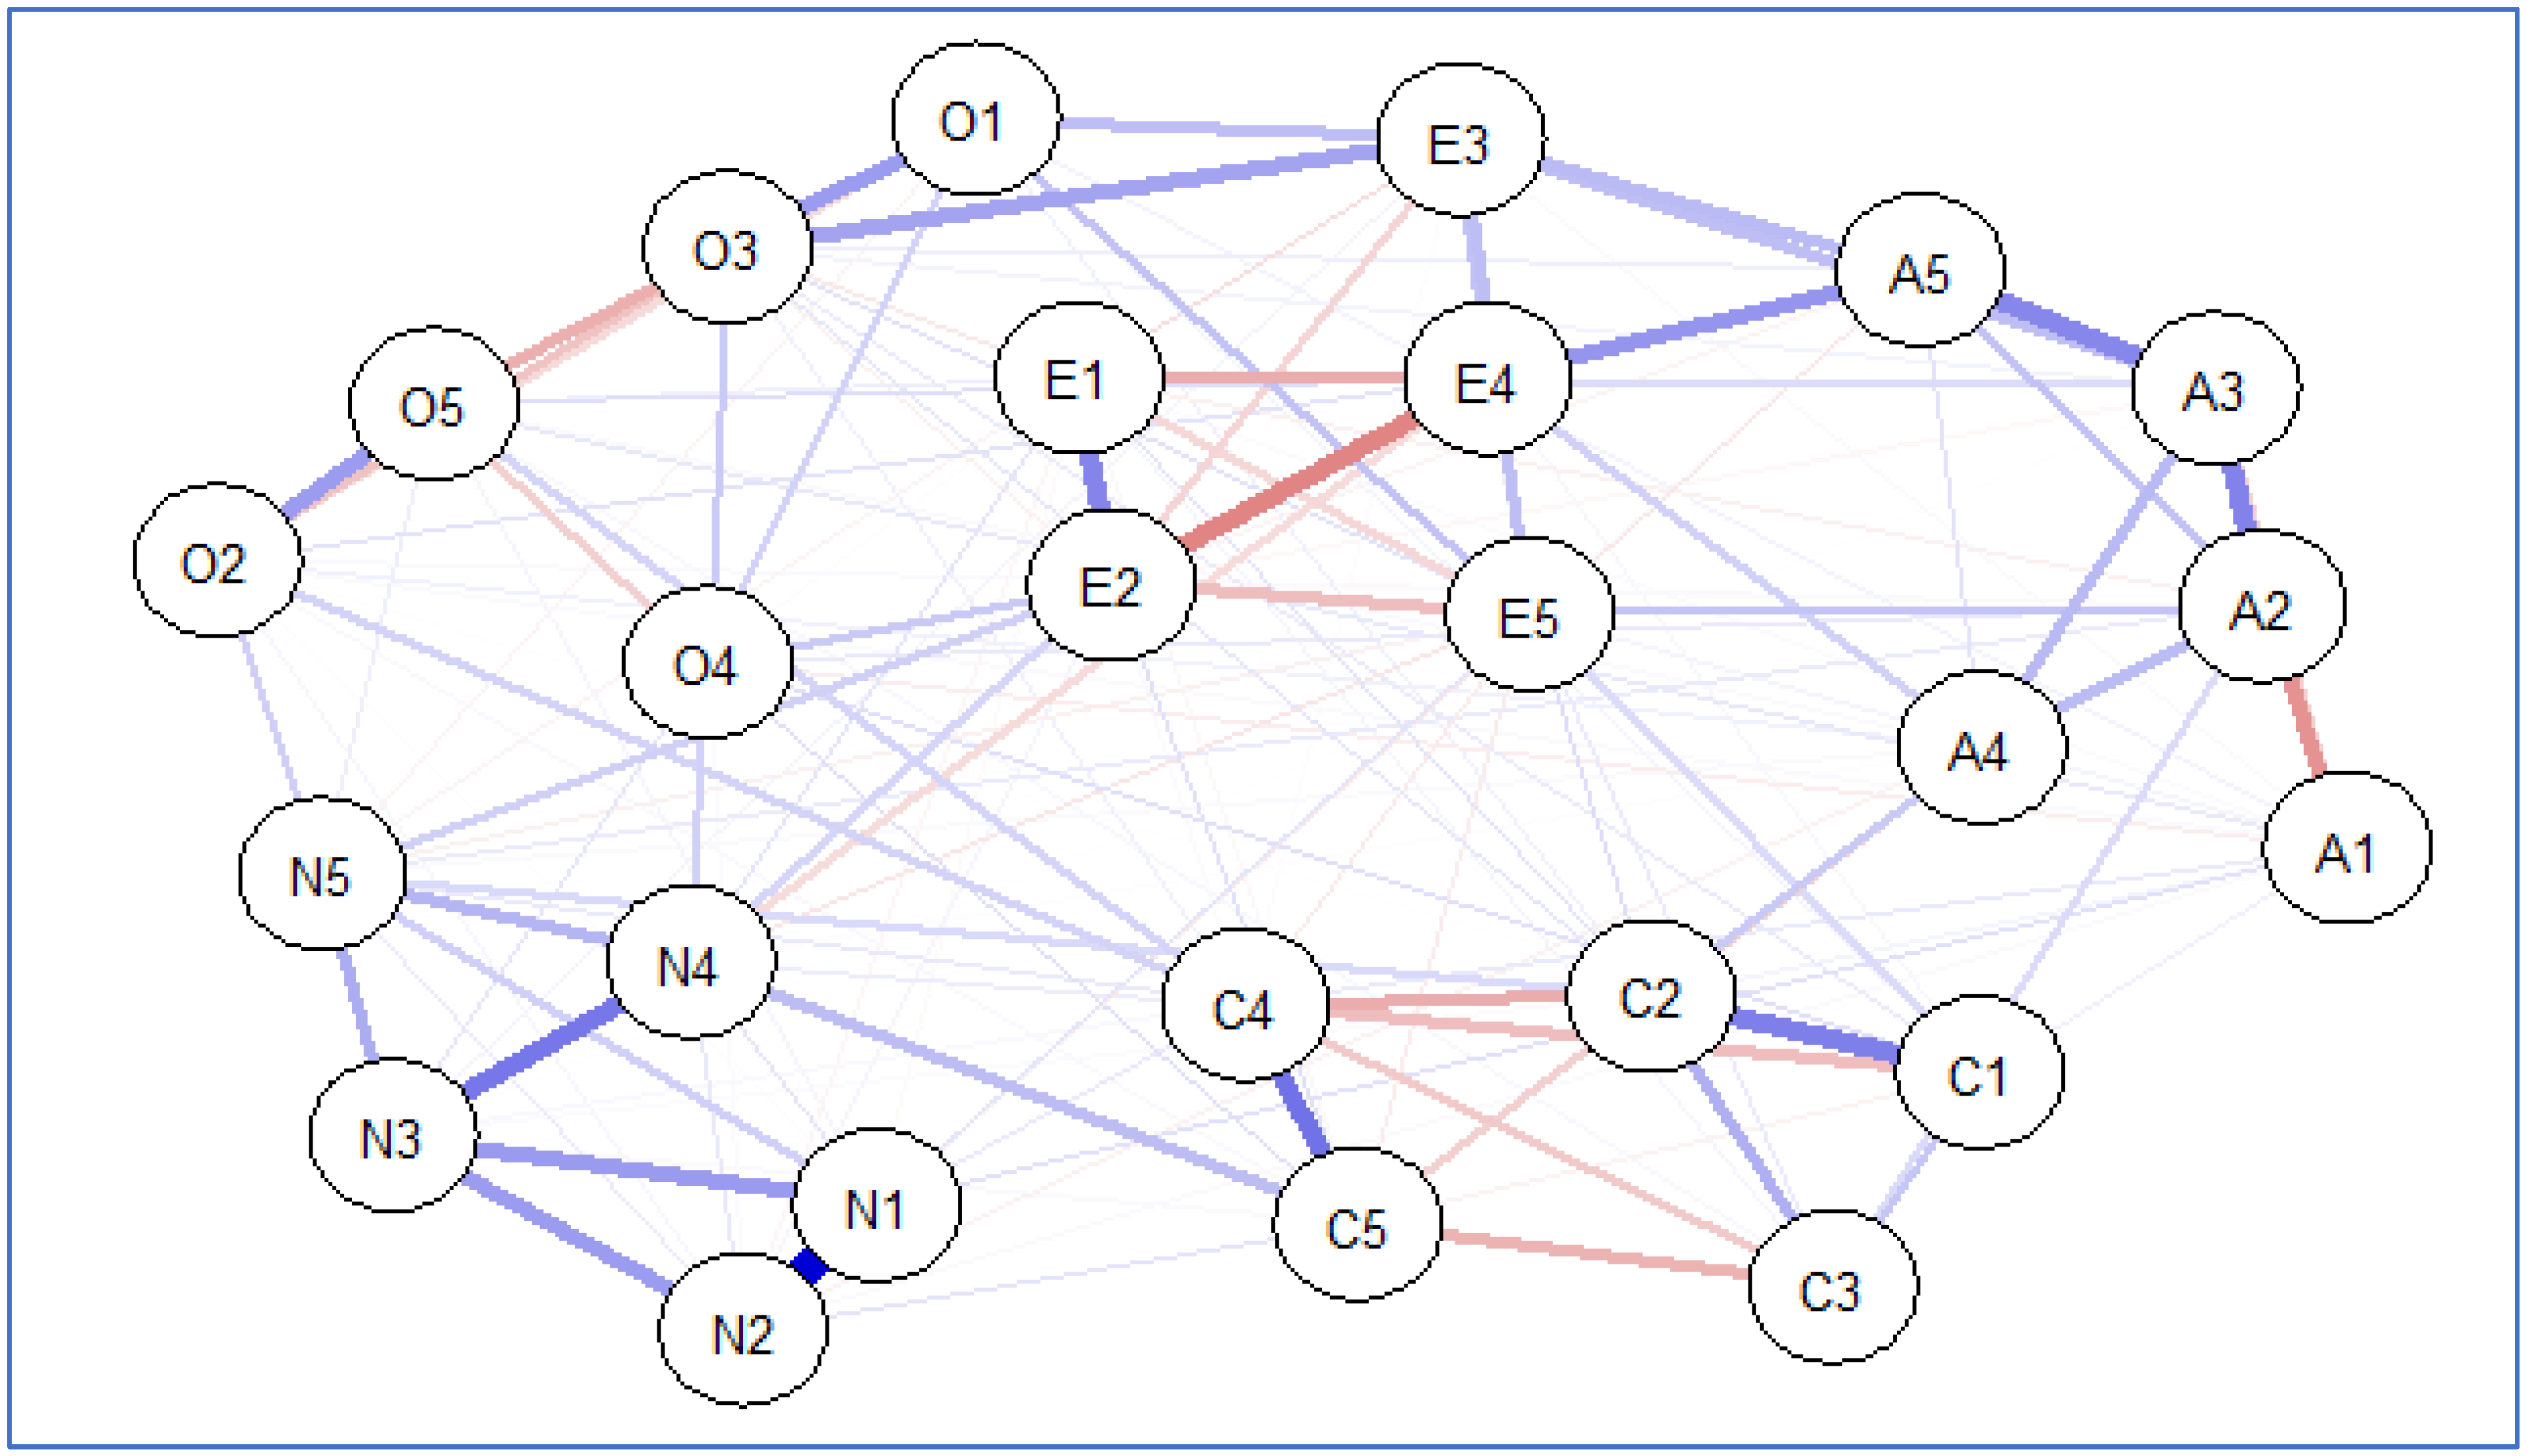
3.2. Step Two: Network Estimation and Plots
| bootnetNetwork <- estimateNetwork(bfidata, default = “EBICglasso”) plot(bootnetNetwork, layout = “spring”, labels = colnames(bfidata)) |
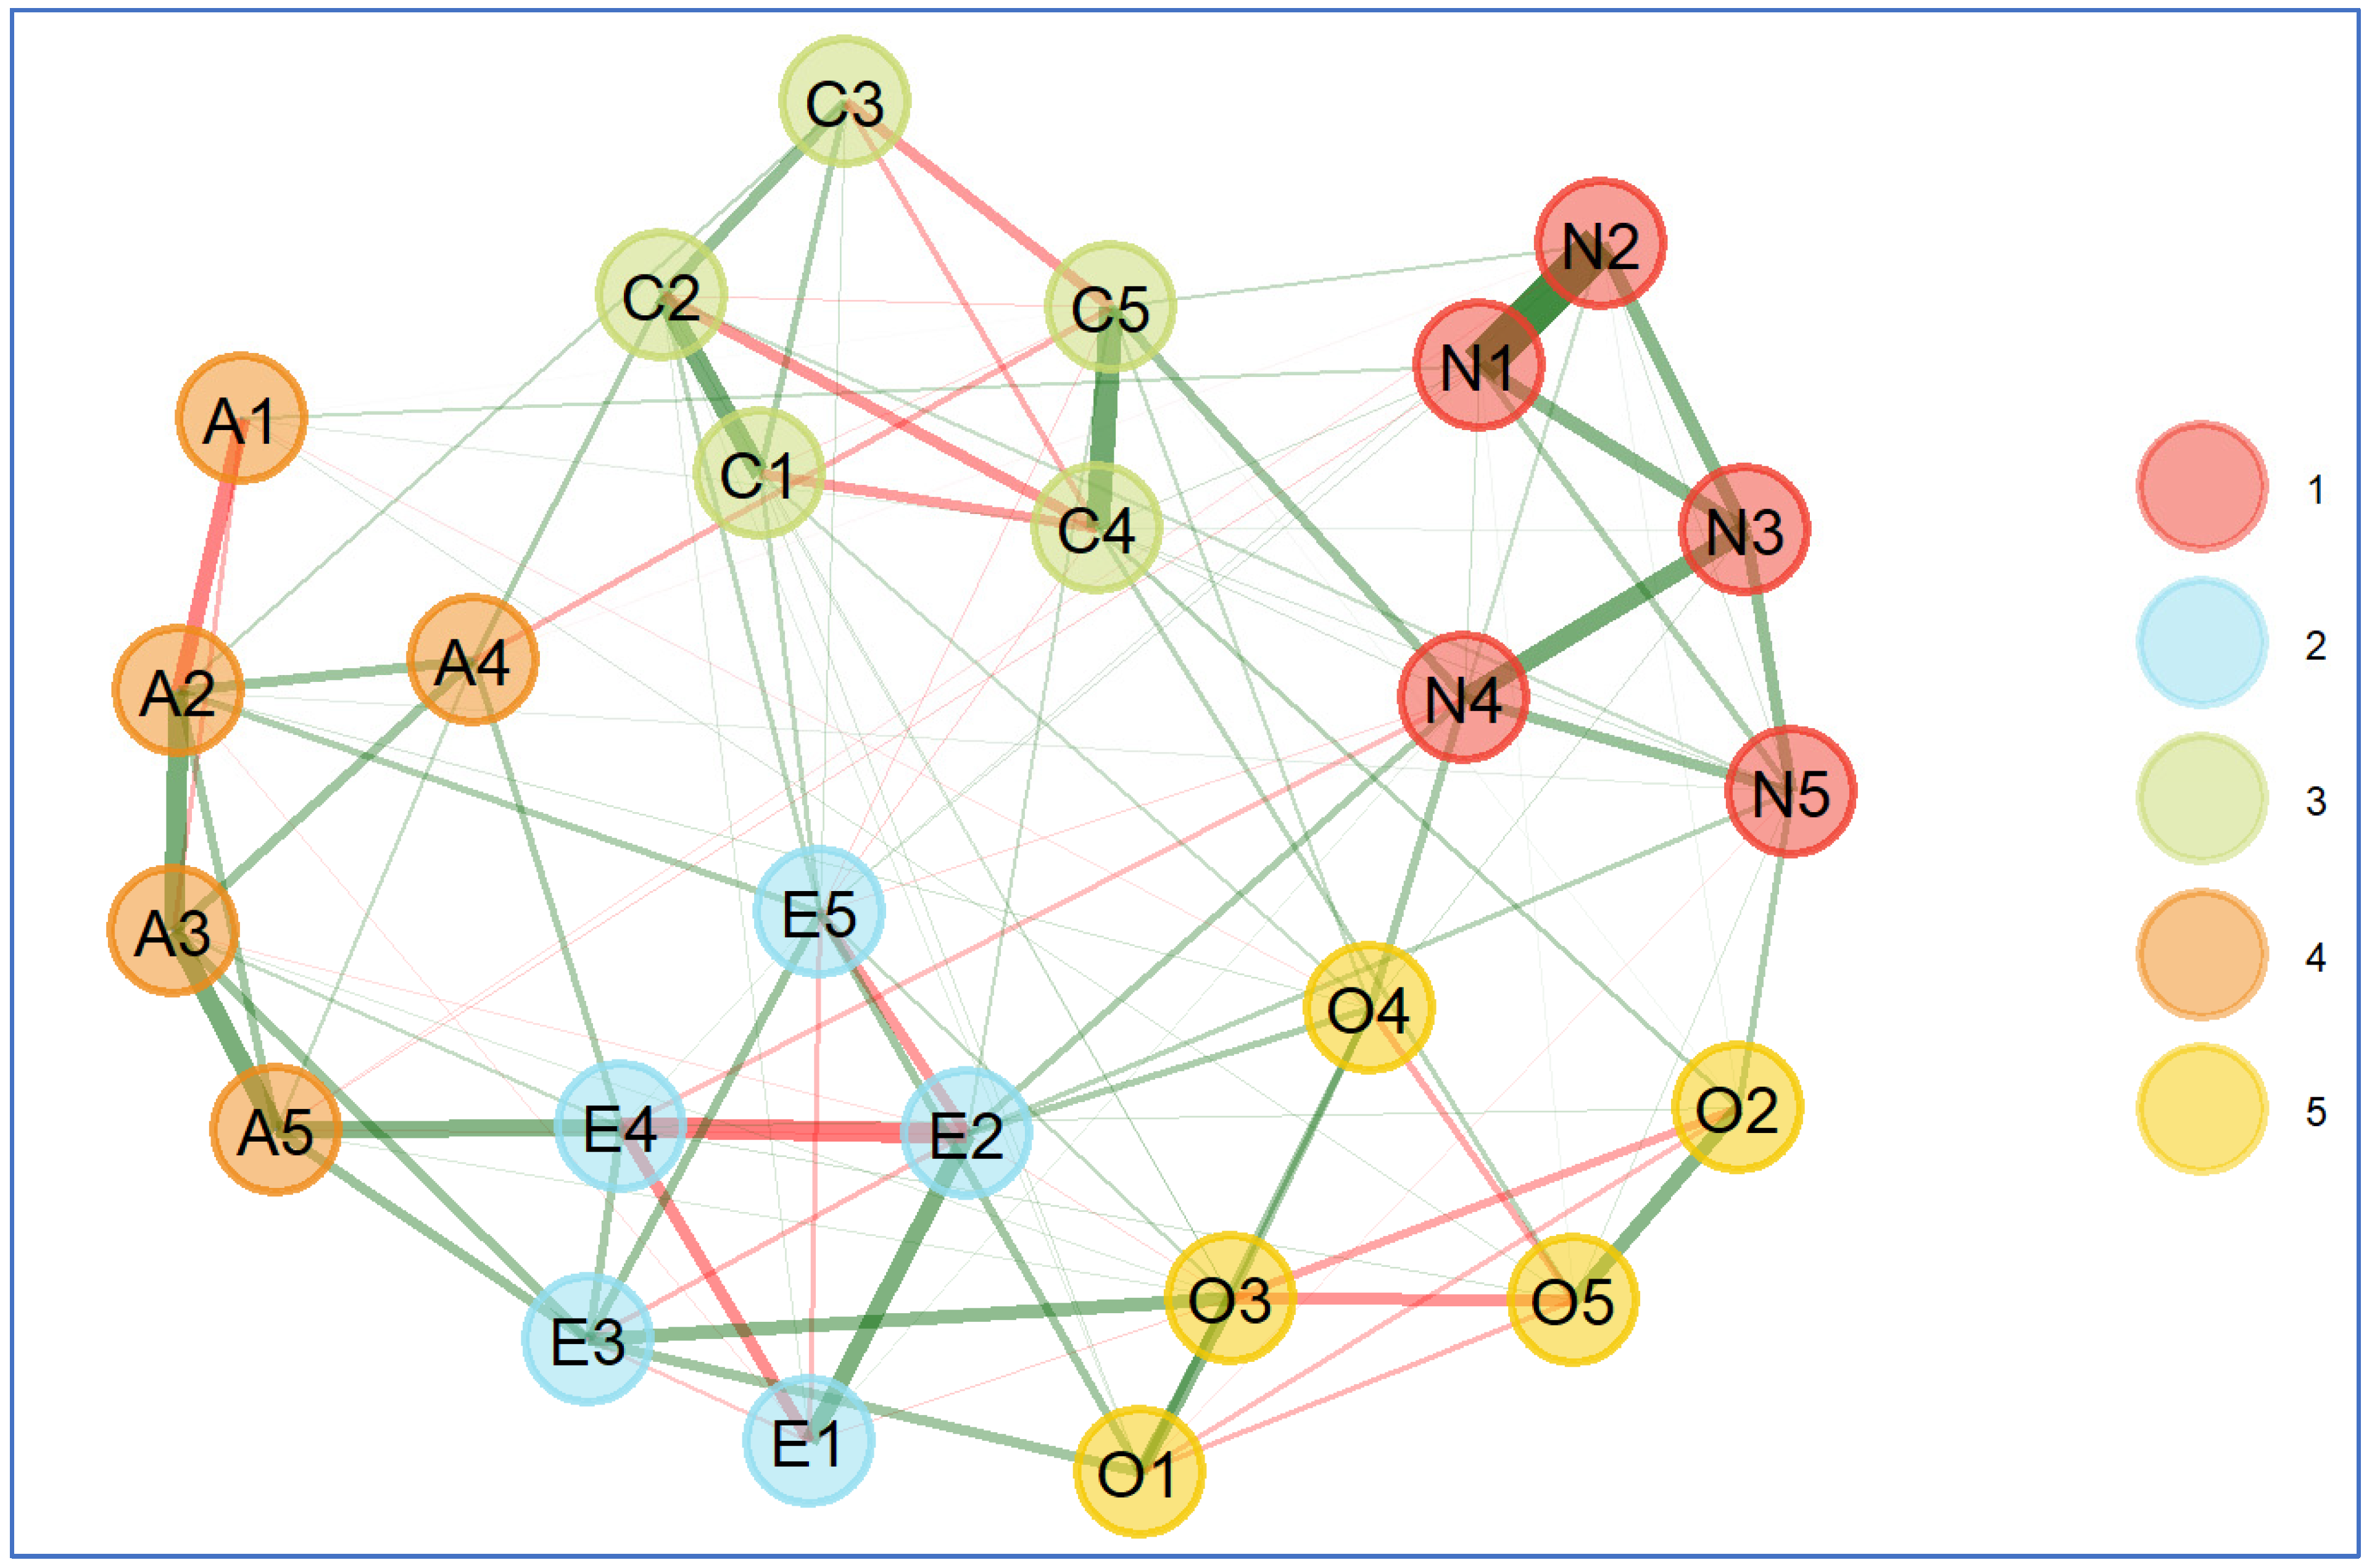
| EGAnetNetwork <- EGA(bfidata, model = “glasso”, plot.EGA = TRUE) |
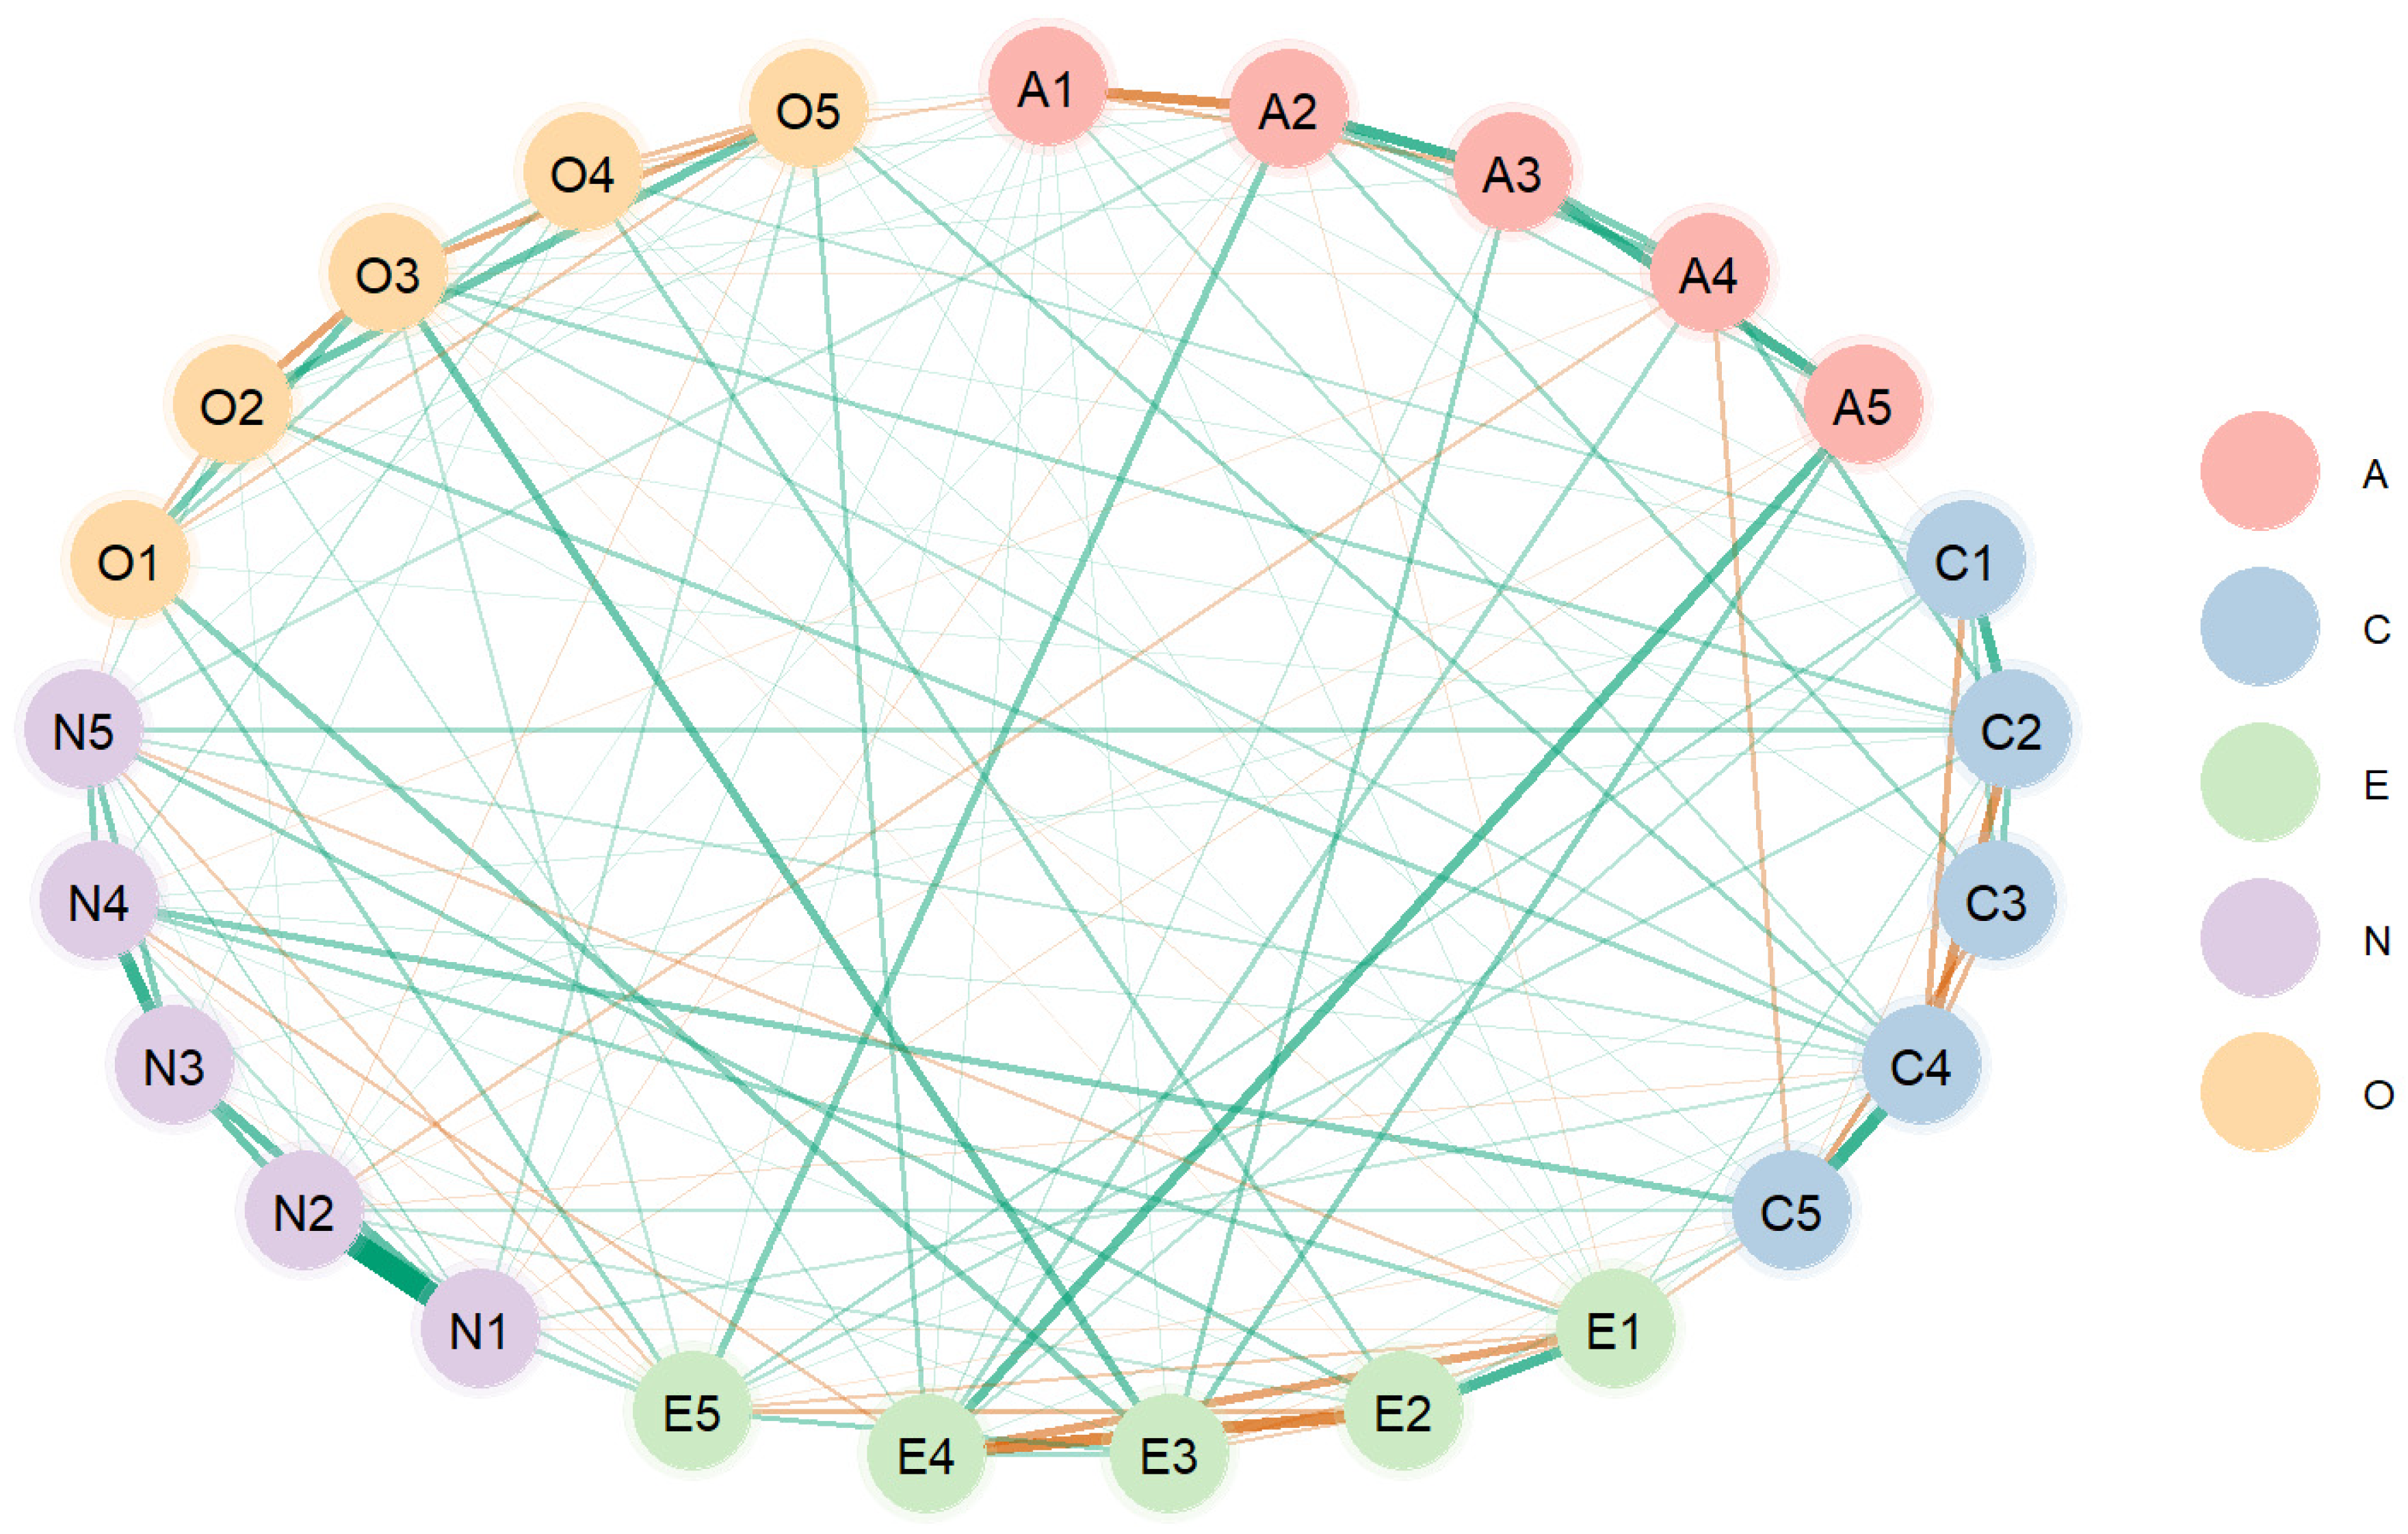
| BGGMnetwork <- estimate(bfidata) select(BGGMnetwork) summary(BGGMnetwork) comm <- substring(colnames(bfidata), 1, 1) BGGMplot <- plot(select(BGGMnetwork), groups = comm, edge_magnify = 5, palette = “Pastel1”, title = “BGGMnetwork”, node_size = 12) BGGMplot |
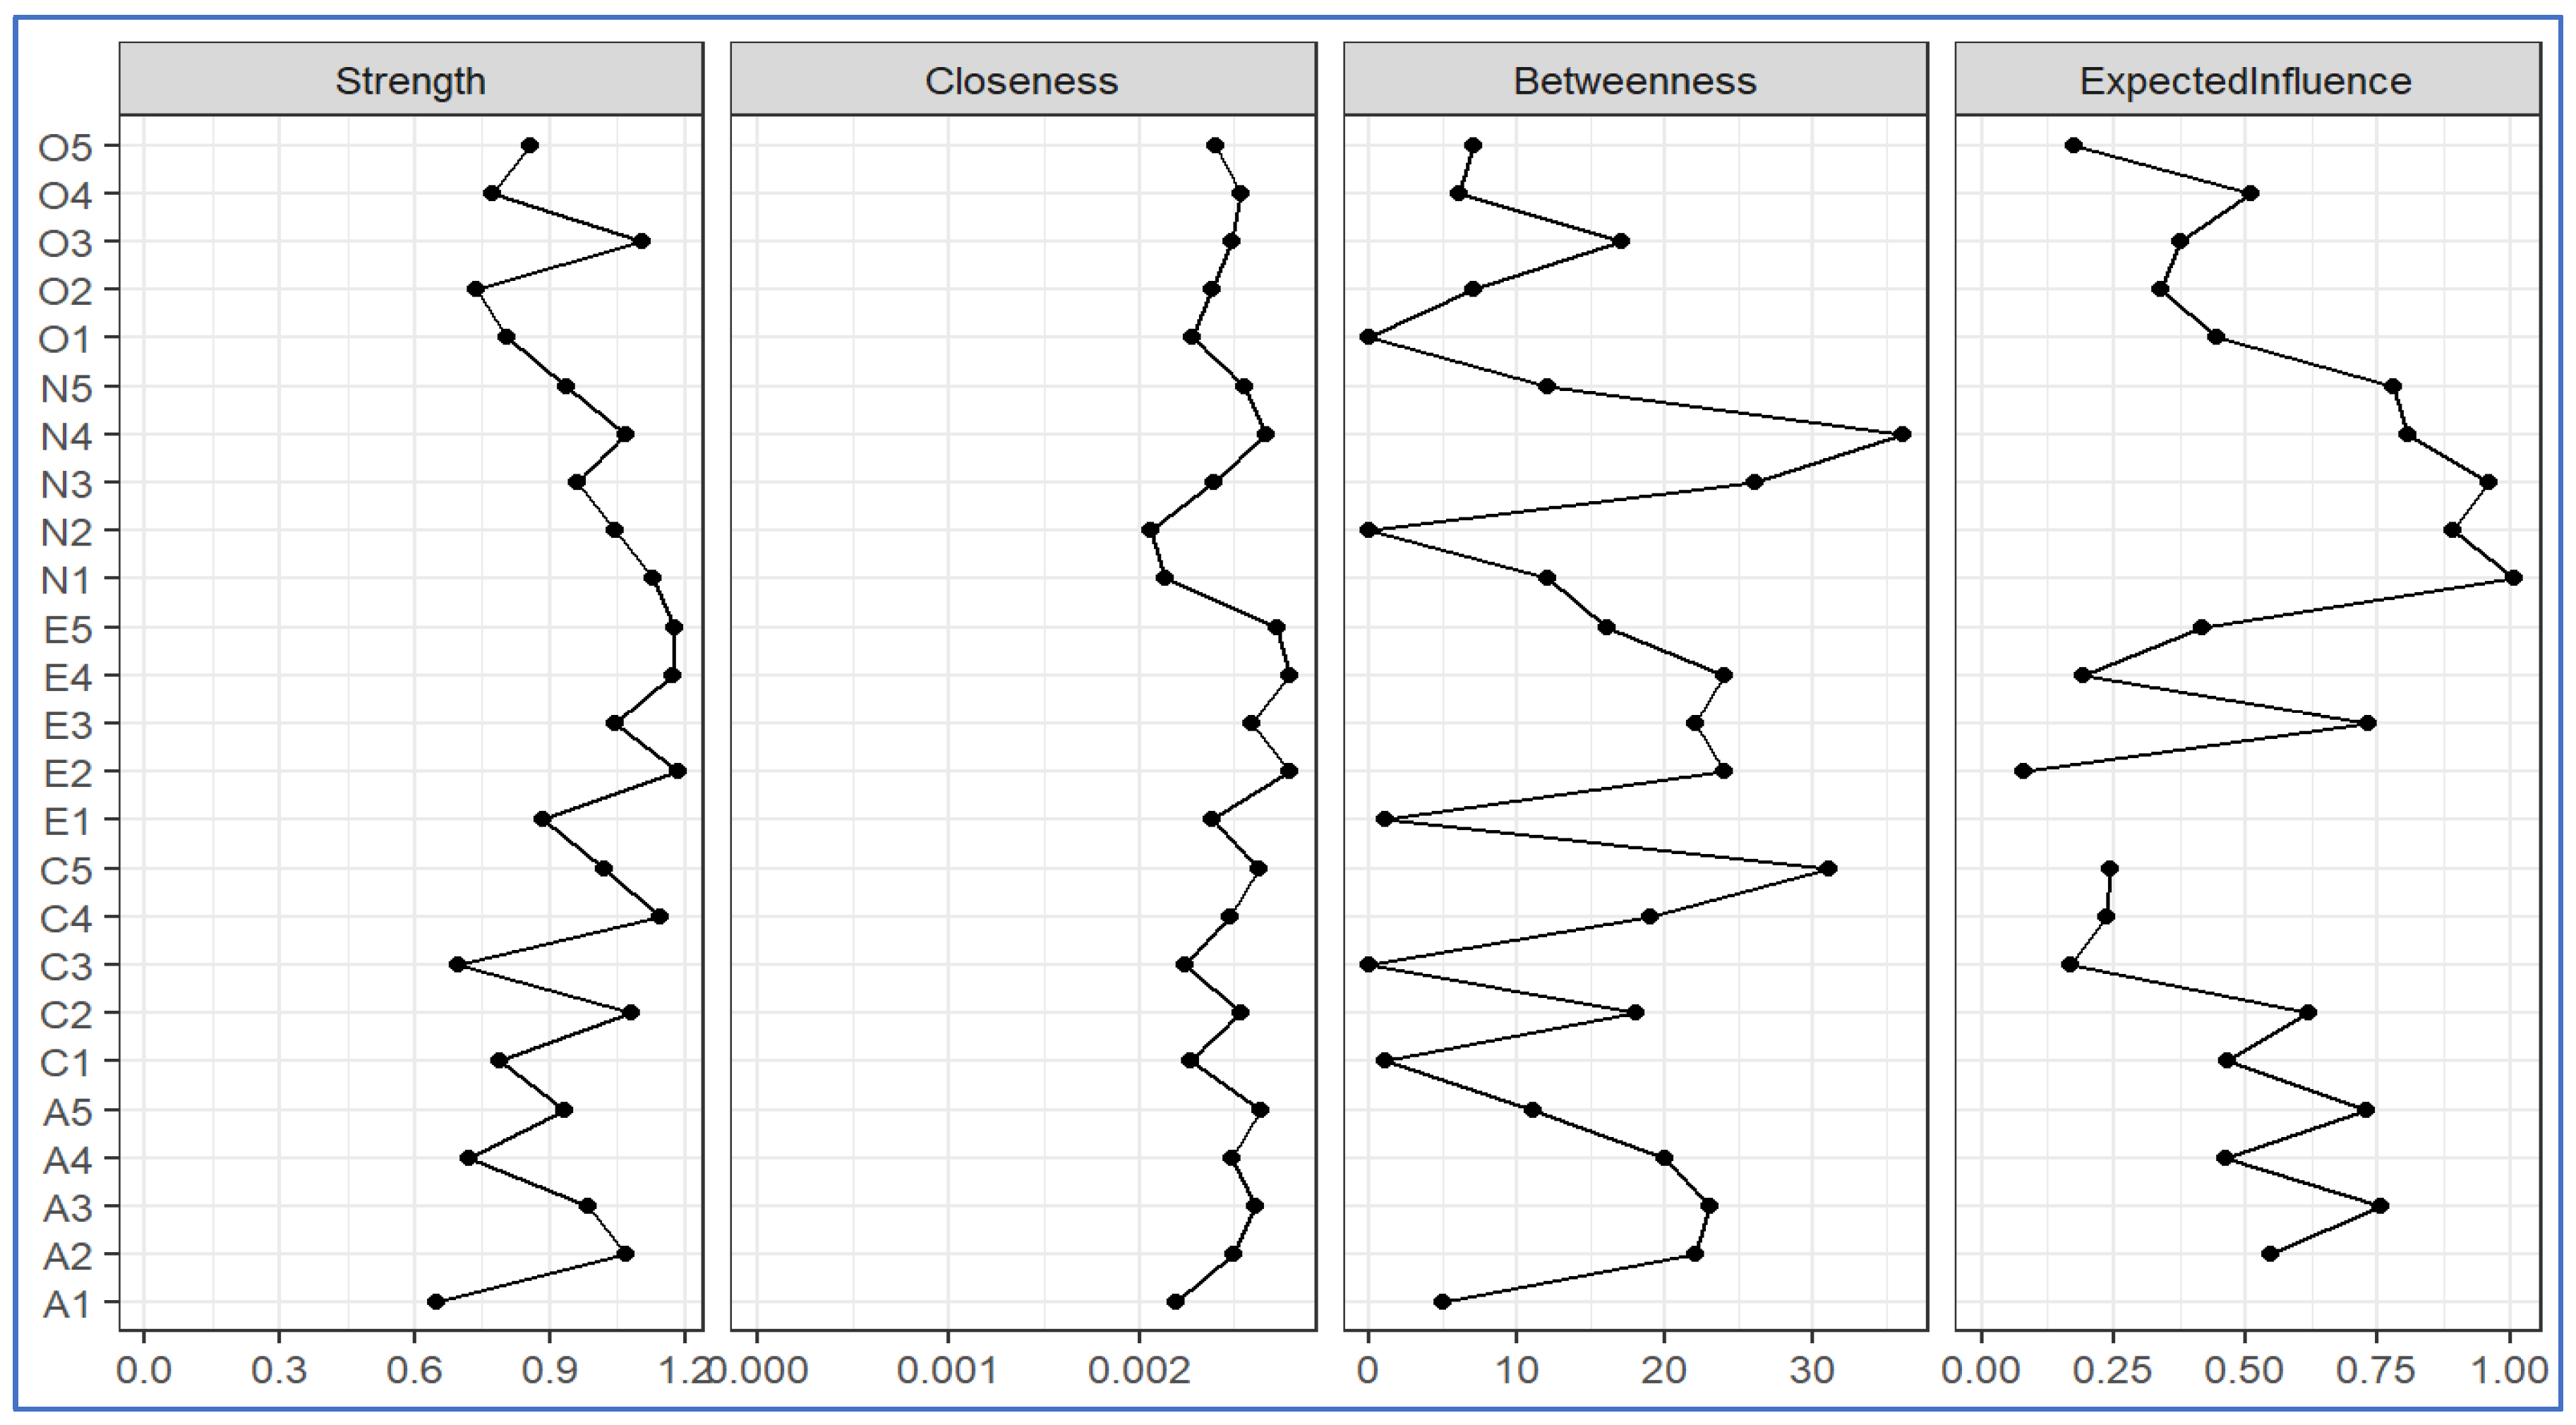
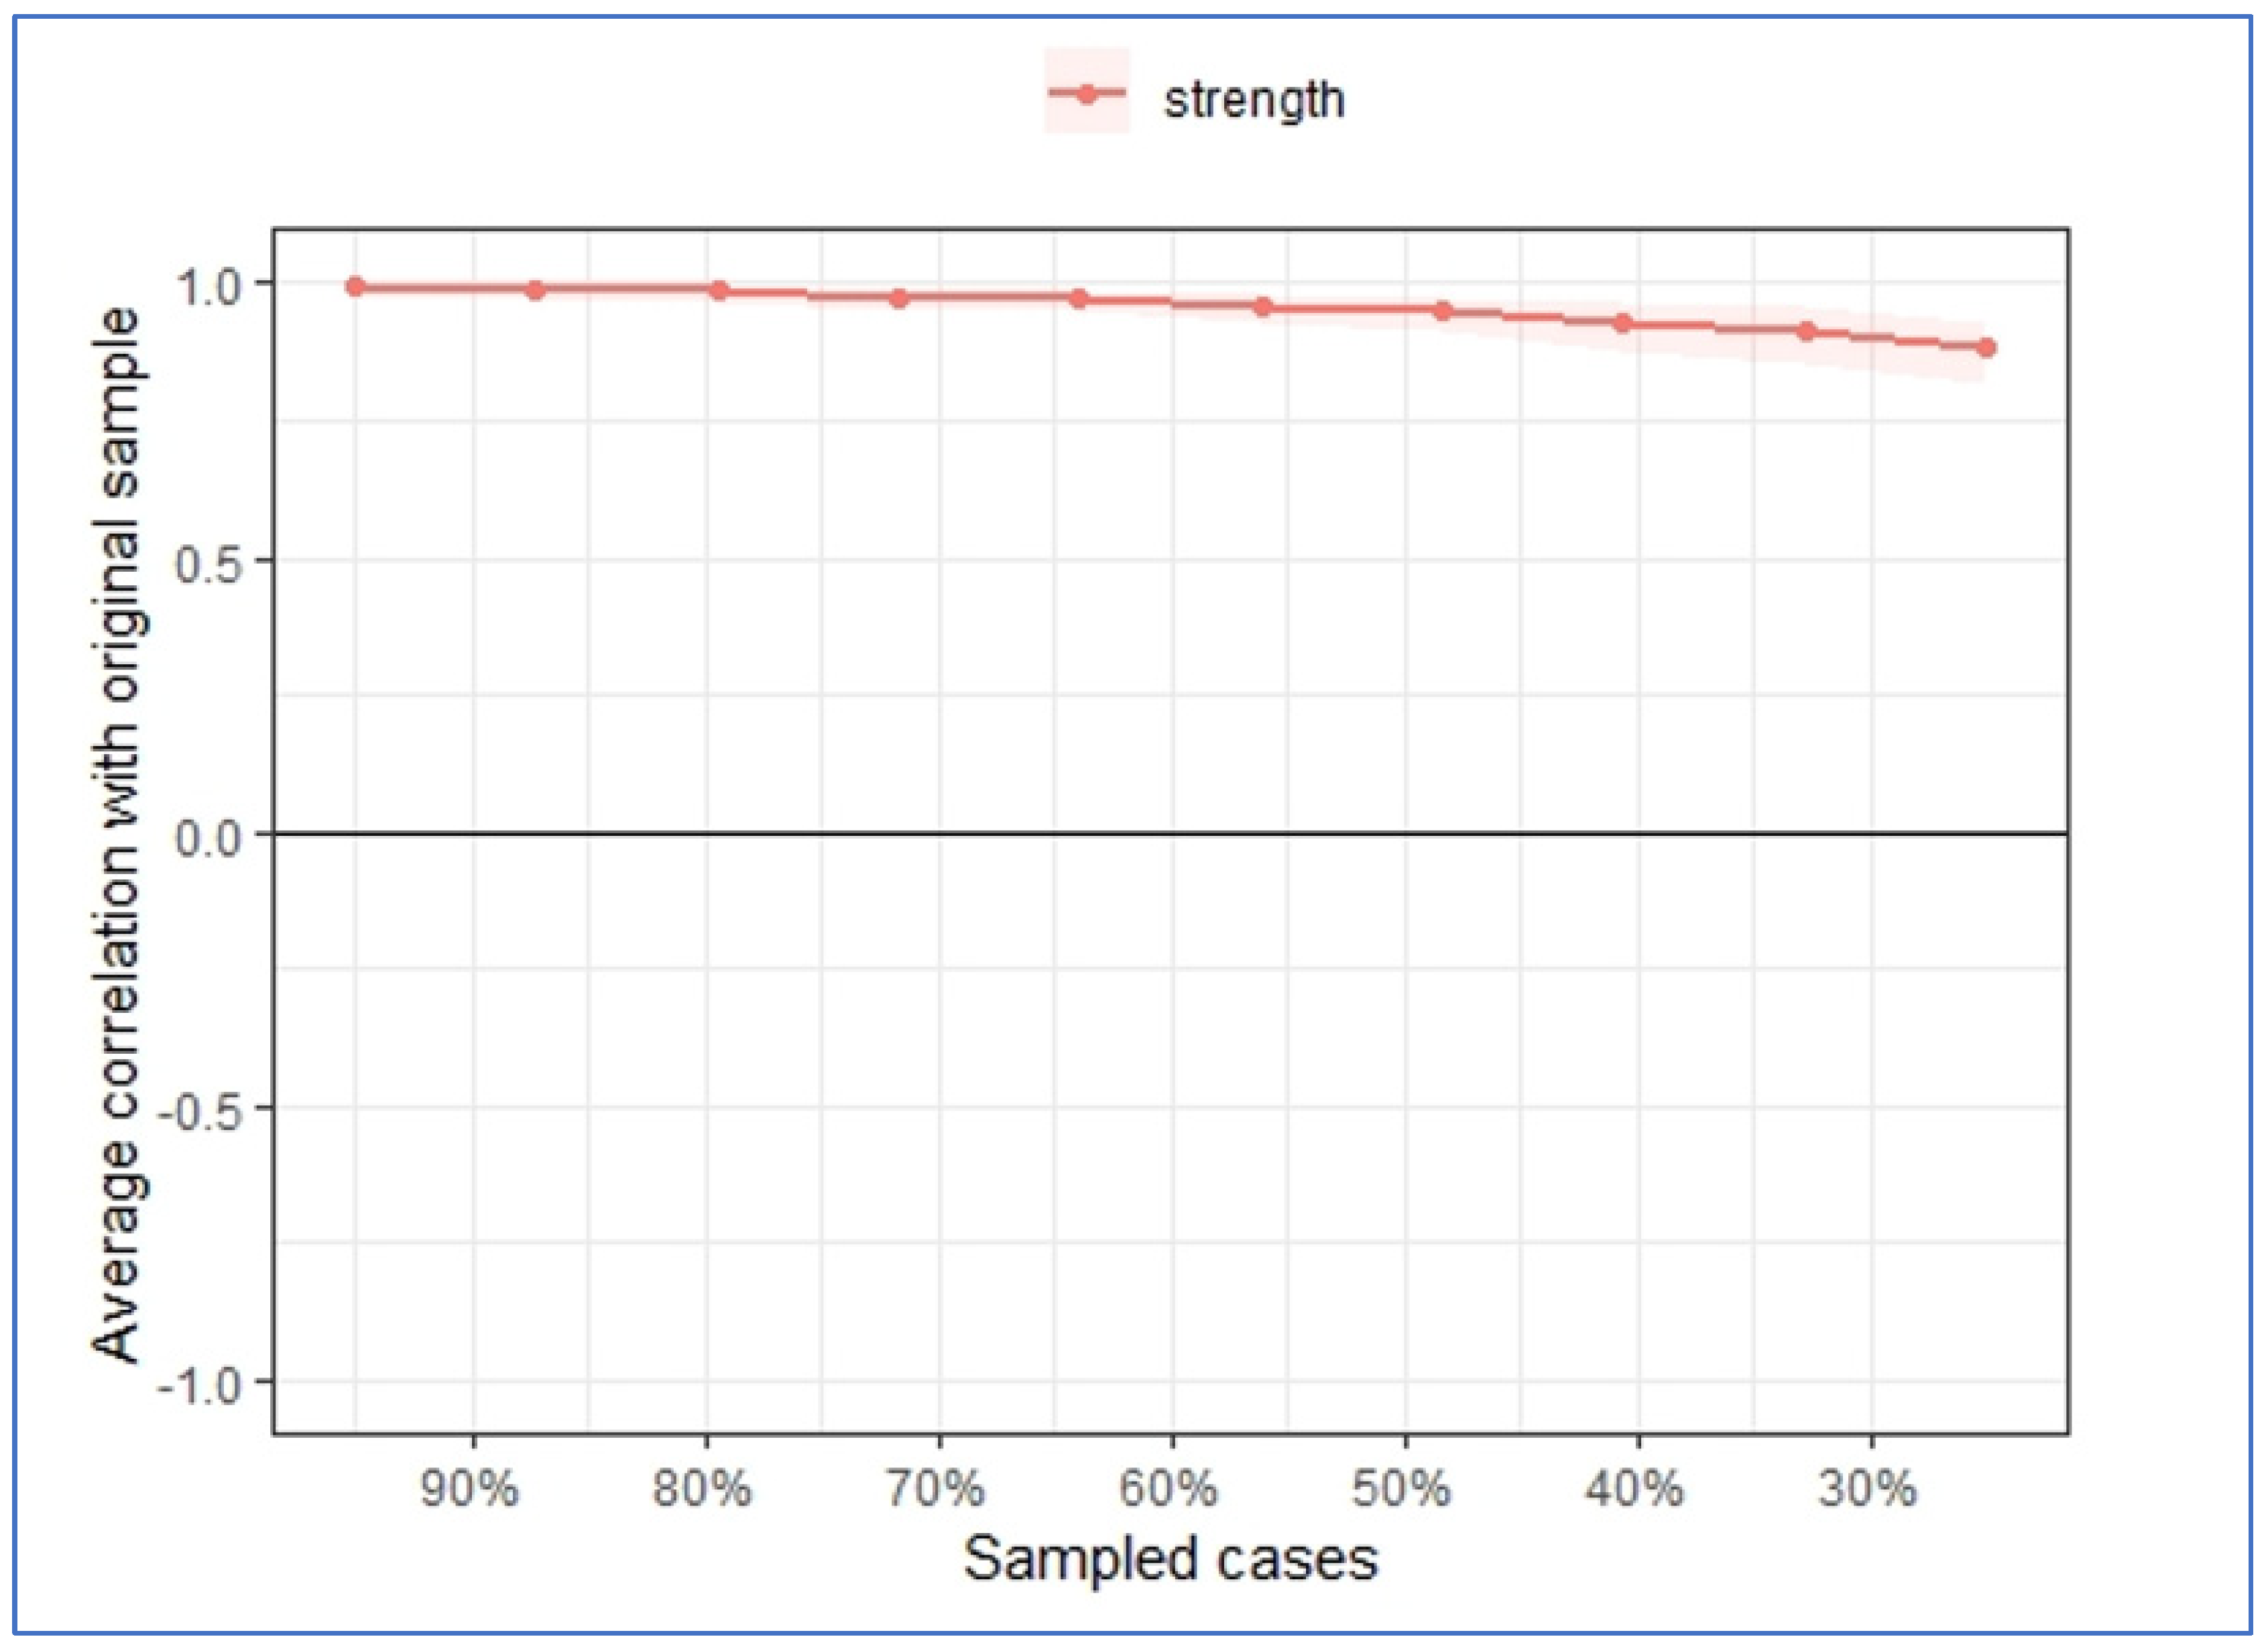
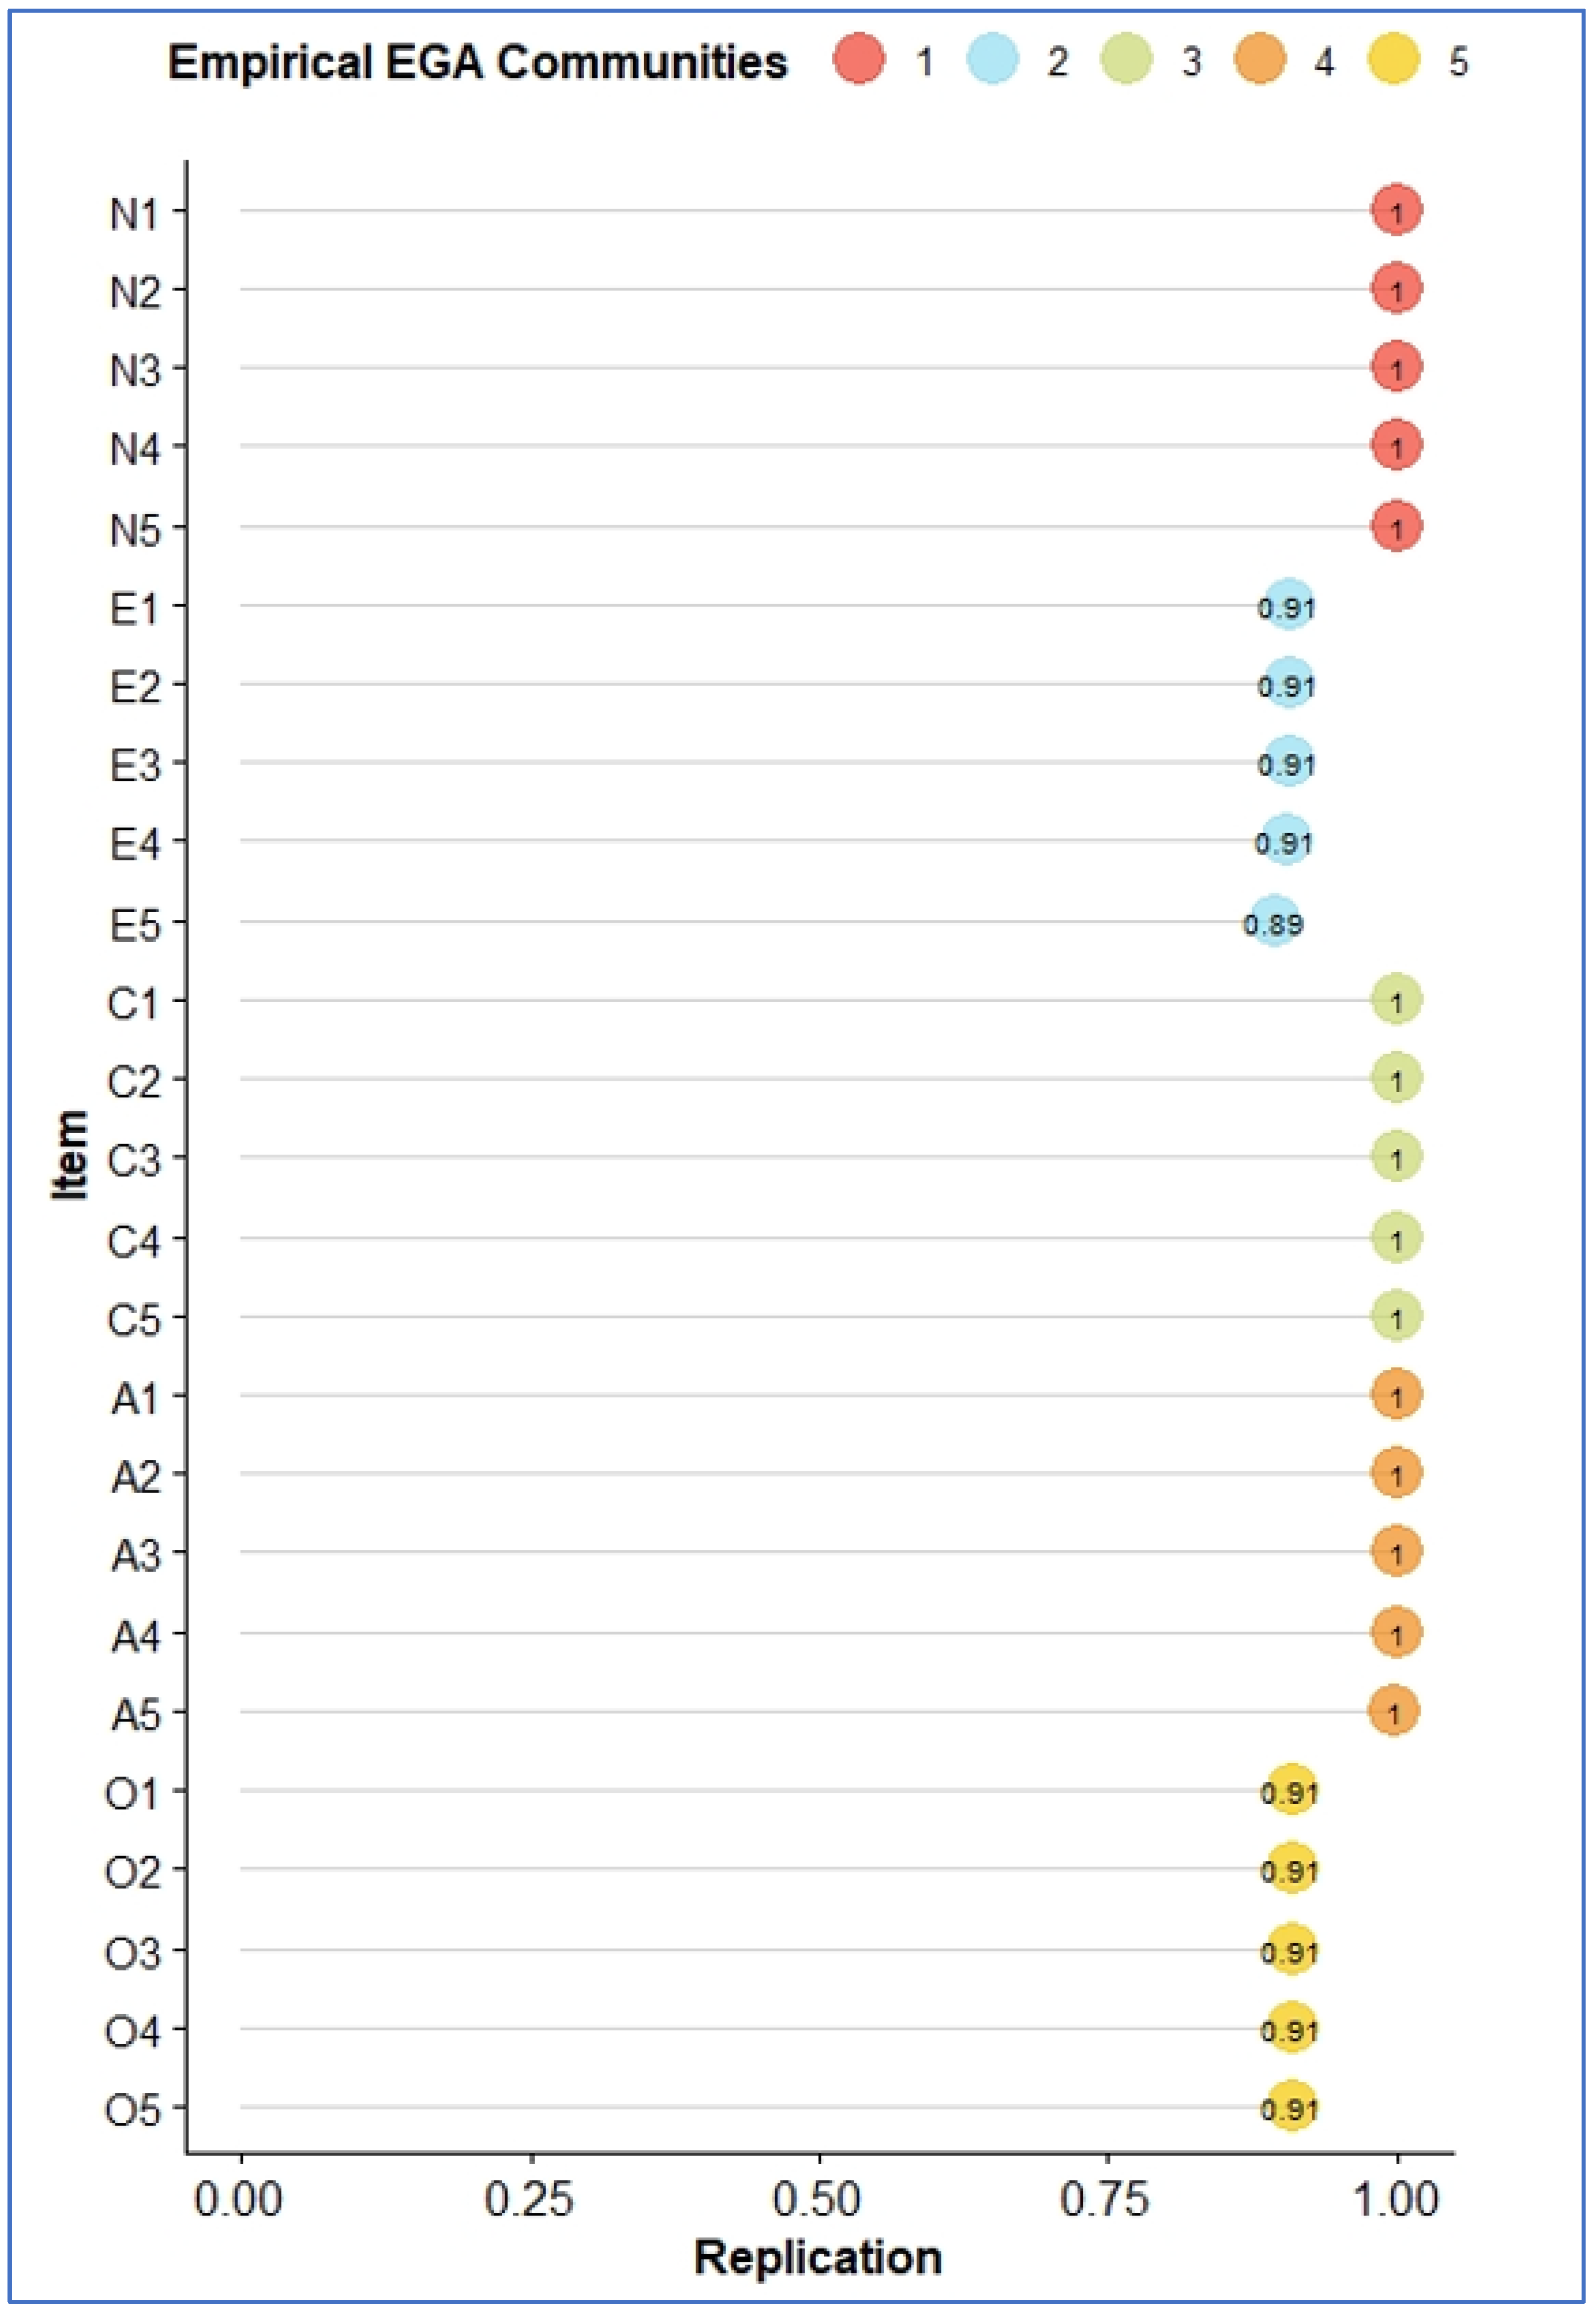
3.3. Step Three: Evaluate Network Structure and Stability of Dimensions and Items
| centralStability <- bootnet(bootnetNetwork, nBoots = 2500, type = “case”) summary(centralStability) corStability(centralStability) plot(centralStability) |
| EGAboot <- bootEGA(bfidata, iter = 500, type = “resampling”) EGAboot$summary.table EGAboot$frequency itemStability(EGAboot) |
4. Discussion
4.1. Comparison of Performance
4.2. PNA, Dimensionality Assessment, and Other Implications
4.3. Limitations and Future Research
Author Contributions
Funding
Institutional Review Board Statement
Informed Consent Statement
Data Availability Statement
Conflicts of Interest
Appendix A

| Dimensions | Items |
|---|---|
| Agreeableness | A1 Am indifferent to the feelings of others. |
| A2 Inquire about others’ well-being. | |
| A3 Know how to comfort others. | |
| A4 Love children. | |
| A5 Make people feel at ease. | |
| Conscientiousness | C1 Am exacting in my work. |
| C2 Continue until everything is perfect. | |
| C3 Do things according to a plan. | |
| C4 Do things in a half-way manner. | |
| C5 Waste my time. | |
| Extraversion | E1 Don’t talk a lot. |
| E2 Find it difficult to approach others. | |
| E3 Know how to captivate people. | |
| E4 Make friends easily. | |
| E5 Take charge. | |
| Neuroticism | N1 Get angry easily. |
| N2 Get irritated easily. | |
| N3 Have frequent mood swings. | |
| N4 Often feel blue. | |
| N5 Panic easily. | |
| Openness | O1 Am full of ideas. |
| O2 Avoid difficult reading material. | |
| O3 Carry the conversation to a higher level. | |
| O4 Spend time reflecting on things. | |
| O5 Will not probe deeply into a subject. |
References
- Borgatti, S. P., Everett, M. G., & Johnson, J. C. (2018). Analyzing social networks. Sage. [Google Scholar]
- Borkulo, C. V., & Epskamp, S. (2023). IsingFit: Fitting ising models using the elasso method (0.4) [R package]. Available online: https://cran.r-project.org/web/packages/IsingFit/index.html (accessed on 1 February 2025).
- Borsboom, D., & Cramer, A. O. (2013). Network analysis: An integrative approach to the structure of psychopathology. Annual Review of Clinical Psychology, 9, 91–121. [Google Scholar] [CrossRef] [PubMed]
- Borsboom, D., Deserno, M. K., Rhemtulla, M., Epskamp, S., Fried, E. I., McNally, R. J., Robinaugh, D. J., Perugini, M., Dalege, J., Costantini, G., & Isvoranu, A. M. (2021). Network analysis of multivariate data in psychometric science. Nature Reviews Methods Primers, 1(1), 1–18. [Google Scholar] [CrossRef]
- Christensen, A. P., Golino, H., & Silvia, P. J. (2020). A psychometric network perspective on the validity and validation of personality trait questionnaires. European Journal of Personality, 34(6), 1095–1108. [Google Scholar] [CrossRef]
- Costantini, G., Epskamp, S., Borsboom, D., Perugini, M., Mõttus, R., Waldorp, L. J., & Cramer, A. O. (2015). State of the aRt personality research: A tutorial on network analysis of personality data in R. Journal of Research in Personality, 54, 13–29. [Google Scholar] [CrossRef]
- Dalege, J., Borsboom, D., Van Harreveld, F., Van den Berg, H., Conner, M., & Van der Maas, H. L. (2016). Toward a formalized account of attitudes: The Causal Attitude Network (CAN) model. Psychometric Review, 123(1), 2. [Google Scholar] [CrossRef] [PubMed]
- Epskamp, S. (2024). graphicalVAR: Graphical VAR for experience sampling data (0.3.4) [R package]. Available online: https://cran.r-project.org/web/packages/graphicalVAR/index.html (accessed on 1 February 2025).
- Epskamp, S., Borsboom, D., & Fried, E. I. (2018a). Estimating psychometric networks and their accuracy: A tutorial paper. Behavior Research Methods, 50(1), 195–212. [Google Scholar] [CrossRef] [PubMed]
- Epskamp, S., Costantini, G., Haslbeck, J., & Isvoranu, A. (2023). qgraph: Graph plotting methods, psychometric data visualization and graphical model estimation (1.9.8) [R package]. Available online: https://cran.r-project.org/web/packages/qgraph/qgraph.pdf (accessed on 1 February 2025).
- Epskamp, S., Cramer, A. O., Waldorp, L. J., Schmittmann, V. D., & Borsboom, D. (2012). qgraph: Network visualizations of relationships in psychometric data. Journal of Statistical Software, 48(4), 1–18. [Google Scholar] [CrossRef]
- Epskamp, S., & Fried, E. I. (2024). bootnet: Bootstrap methods for various network estimation routines (1.6) [R package]. Available online: https://cran.r-project.org/web/packages/bootnet/index.html (accessed on 1 February 2025).
- Epskamp, S., Maris, G. K., Waldorp, L. J., & Borsboom, D. (2016). Network psychometrics. arXiv, arXiv:1609.02818. [Google Scholar]
- Epskamp, S., Waldorp, L. J., Mõttus, R., & Borsboom, D. (2018b). The gaussian graphical model in cross-sectional and time-series data. Multivariate Behavioral Research, 53(4), 453–480. [Google Scholar] [CrossRef]
- Fried, E. I., Epskamp, S., Veenman, M., & van Borkulo, C. D. (2022). Network stability, comparison, and replicability. In A.-M. Isvoranu, S. Epskamp, L. J. Waldorp, & D. Borsboom (Eds.), Network psychometrics with R: A guide for behavioral and social scientists (pp. 133–153). Routledge. [Google Scholar] [CrossRef]
- Gao, Q., Qian, M., Wang, A. X., & Dai, S. (2024). Examining the dimensionality of the self-perceptions of creativity scale using psychometric network analysis: A tutorial. Creativity Research Journal, 1–14. [Google Scholar] [CrossRef]
- Goldberg, L. R. (1999). A broad-bandwidth, public domain personality inventory measuring the lower-level facets of several five-factor models. In I. Mervielde, I. Deary, F. De Fruyt, & F. Ostendorf (Eds.), Personality psychology in Europe (Vol. 7, pp. 7–28). Tilburg University Press. [Google Scholar]
- Golino, H., & Christensen, A. (2024). EGAnet: Exploratory graph analysis—A framework for estimating the number of dimensions in multivariate data using network psychometrics (2.1.0) [R package]. Available online: https://cran.r-project.org/web/packages/EGAnet/index.html (accessed on 1 February 2025).
- Golino, H., Shi, D., Christensen, A. P., Garrido, L. E., Nieto, M. D., Sadana, R., Thiyagarajan, J. A., & Martinez-Molina, A. (2020). Investigating the performance of exploratory graph analysis and traditional techniques to identify the number of latent factors: A simulation and tutorial. Psychological Methods, 25(3), 292. [Google Scholar] [CrossRef] [PubMed]
- Golino, H. F., & Demetriou, A. (2017). Estimating the dimensionality of intelligence like data using exploratory graph analysis. Intelligence, 62, 54–70. [Google Scholar] [CrossRef]
- Grey, S., & Morris, P. (2022). Capturing the spark: PISA, twenty-first century skills and the reconstruction of creativity. Globalisation, Societies and Education, 22(2), 156–171. [Google Scholar] [CrossRef]
- Haslbeck, J. (2023). mgm: Estimating time-varying k-order mixed graphical models (1.2–14) [R package]. Available online: https://cran.r-project.org/web/packages/mgm/index.html (accessed on 1 February 2025).
- Hevey, D. (2018). Network analysis: A brief overview and tutorial. Health Psychology and Behavioral Medicine, 6(1), 301–328. [Google Scholar] [CrossRef] [PubMed]
- Hogan, B., Fielding, N., & Lee, R. M. (2008). Analyzing social networks. In The sage handbook of online research methods (pp. 141–160). Sage. [Google Scholar]
- Jones, P. (2025). networktools: Tools for identifying important nodes in networks (1.6.0) [R package]. Available online: https://cran.r-project.org/web/packages/networktools/index.html (accessed on 1 February 2025).
- McNally, R. J. (2016). Can network analysis transform psychopathology? Behaviour Research and Therapy, 86, 95–104. [Google Scholar] [CrossRef] [PubMed]
- McNally, R. J. (2021). Network analysis of psychopathology: Controversies and challenges. Annual Review of Clinical Psychology, 17, 31–53. [Google Scholar] [CrossRef] [PubMed]
- Qian, M., & Clark, K. R. (2016). Game-based learning and 21st century skills: A review of recent research. Computers in Human Behavior, 63, 50–58. [Google Scholar] [CrossRef]
- Revelle, W. (2021). psych: Procedures for psychometric, psychometric, and personality research. Northwestern University, Evanston, Illinois. R package version 2.1.9. Available online: https://CRAN.R-project.org/package=psych (accessed on 1 February 2025).
- Revelle, W., Wilt, J., & Rosenthal, A. (2010). Individual differences in cognition: New methods for examining the personality-cognition link. In A. Gruszka, G. Matthews, & B. Szymura (Eds.), Handbook of individual differences in cognition: Attention, memory, and executive control (pp. 27–49). Springer Science+Business Media. [Google Scholar] [CrossRef]
- Sass, D. A., & Schmitt, T. A. (2010). A comparative investigation of rotation criteria within exploratory factor analysis. Multivariate Behavioral Research, 45(1), 73–103. [Google Scholar] [CrossRef]
- Williams, D., Mulder, J., & Rast, P. (2024). BGGM: Bayesian gaussian graphical models (2.1.5) [R package]. Available online: https://cran.r-project.org/web/packages/BGGM/index.html (accessed on 1 February 2025).
- Williams, D. R., & Mulder, J. (2020). BGGM: Bayesian gaussian graphical models in R. Journal of Open Source Software, 5(51), 2111. [Google Scholar] [CrossRef]
| R Packages | Initial Version Release Date | Number of Downloads Since Its Initial Release | Features * |
|---|---|---|---|
| qgraph | 2011-01-08 | 1,483,997 | qgraph (Epskamp et al., 2023) can be used for both psychometric data visualization and network estimation. |
| bootnet | 2015-03-04 | 163,800 | bootnet (Epskamp & Fried, 2024) and qgraph have a lot of features in common, but bootnet has more advanced features than qgraph and is kind of an upgraded package of qgraph. It can estimate network structures and check their accuracy and stability. With the recent updates, bootnet is considered a hub package that can estimate commonly used graphical models, such as the Gaussian graphical model (GGM), mixed graphical model, and graphical vector auto-regression models. |
| EGAnet | 2019-05-02 | 206,710 | EGAnet (H. Golino & Christensen, 2024) is a great package for assessing the dimensionality of a latent construct. It can check the stability of factors and items. |
| BGGM | 2020-02-06 | 109,698 | BGGM (Bayesian Gaussian graphical model; D. Williams et al., 2024) is a relatively new package and is the only package to date to provide Bayesian estimation of network models. |
| Networktools | 2017-04-14 | 126,341 | Networktools (Jones, 2025) is a great package for identifying important nodes and detecting redundant nodes in networks. |
| graphicalVAR | 2015-03-11 | 109,016 | The graphicalVAR package (Epskamp, 2024) uses graphical vector autoregressive models to estimate the interactions within and between time points in experience sampling data. In other words, it can estimate time-series network models. It has been integrated into the bootnet package. |
| IsingFit | 2014-02-17 | 148,777 | The IsingFit package (Borkulo & Epskamp, 2023) is used to estimate networks with binary variables. It has been integrated into the bootnet package. |
| mgm | 2015-09-13 | 146,554 | MGM represents mixed graphical models. The mgm package (Haslbeck, 2023) can estimate network models in cross-sectional data and handle both categorical and continuous variables. It can also estimate time-varying time-series network models (i.e., network structures that change over time). It has been integrated into the bootnet package. |
| R Packages | Main Function | Data and Variables | Missing Data |
|---|---|---|---|
| qgraph | qgraph() | - Uses correlation matrix from the function cor_auto(), which requires a data frame. - cor_auto () removes factor variables and then treats variables as ordinal variables if it has 7 or less unique integer values. | - Relies on cor_auto() which uses pairwise deletion to handle missing data. |
| bootnet | Bootnet() | - Uses raw data in the form of either a data frame or matrix. The variables can be numeric, integer, or ordered factors. | - Four options: pairwise deletion (default), listwise deletion, full-information maximum likelihood (FIML), and stop (stop with error message if missing data presents). |
| EGAnet | EGA() | - Uses (1) raw data in the form of either a data frame or matrix, or (2) a correlation matrix. - Default option “auto” automatically calculates appropriate correlations for binary, ordinal, and continuous variables. | - Two options: pairwise deletion (default) and listwise deletion. |
| BGGM | estimate() | - Uses raw data in the form of either a data frame or matrix. - Users need to specify the variable type among continuous, binary, ordinal, or mixed (only works for data with ordinal variables). | - Uses specify if impute missing data or not. If yes, missing values are imputed with posterior predictive distribution; if no, listwise deletion is used. |
| Networktools | Uses qgraph (). | - Uses na.rm = TRUE or FALSE to indicate if missing values are to be removed (i.e., listwise). | |
| graphicalVAR | graphicalVAR() | - Uses raw data in the form of either a data frame or matrix. | - Uses deleteMissings = TRUE or FALSE to indicate if missing values are to be removed (i.e., listwise deletion). |
| IsingFit | IsingFit() | - Uses raw data in the form of a matrix. | - N/A. |
| mgm | mgm() | - Uses raw data in the form of a matrix. - Uses the type argument to indicate the type of the variables for each column, “g” = Gaussian, “p” = Poisson, and “c” = categorical, and the level argument to indicate the number of levels/categories of each variable (for continuous variables, level = 1). | - N/A. |
| n. Boots | Median Dim. | SE Dim. | Lower CI | Upper CI | Lower Quantile | Upper Quantile |
|---|---|---|---|---|---|---|
| 500 | 5 | 0.40 | 4.22 | 5.78 | 4 | 5 |
| Number of Factors | Frequency |
|---|---|
| 4 | 0.194 |
| 5 | 0.806 |
Disclaimer/Publisher’s Note: The statements, opinions and data contained in all publications are solely those of the individual author(s) and contributor(s) and not of MDPI and/or the editor(s). MDPI and/or the editor(s) disclaim responsibility for any injury to people or property resulting from any ideas, methods, instructions or products referred to in the content. |
© 2025 by the authors. Licensee MDPI, Basel, Switzerland. This article is an open access article distributed under the terms and conditions of the Creative Commons Attribution (CC BY) license (https://creativecommons.org/licenses/by/4.0/).
Share and Cite
Qian, M.; Wang, X.; Dai, S. Psychometric Network Analysis and Dimensionality Assessment: A Software Review. Educ. Sci. 2025, 15, 555. https://doi.org/10.3390/educsci15050555
Qian M, Wang X, Dai S. Psychometric Network Analysis and Dimensionality Assessment: A Software Review. Education Sciences. 2025; 15(5):555. https://doi.org/10.3390/educsci15050555
Chicago/Turabian StyleQian, Meihua, Xianyong Wang, and Shenghai Dai. 2025. "Psychometric Network Analysis and Dimensionality Assessment: A Software Review" Education Sciences 15, no. 5: 555. https://doi.org/10.3390/educsci15050555
APA StyleQian, M., Wang, X., & Dai, S. (2025). Psychometric Network Analysis and Dimensionality Assessment: A Software Review. Education Sciences, 15(5), 555. https://doi.org/10.3390/educsci15050555