Abstract
Psychometric network analysis (PNA) has been gaining great popularity over the past decade. As a promising dimensionality assessment method, existing research has shown that PNA is able to outperform traditional methods such as exploratory factor analysis in examining the internal structure of a latent construct, and various R packages have been developed to carry out PNA. Yet, PNA has not been widely used in various fields due to researchers’ lack of familiarization with this method and the available R packages. Therefore, this study aims to briefly review the PNA method, compare different R packages, and provide step-by-step guidance on how to use these R packages to conduct PNA using a personality dataset.
1. Introduction
As a statistical framework that conceptualizes psychological constructs as systems of directly interacting observed variables, psychometric network analysis (PNA) has been gaining great popularity over the past decade (Borsboom & Cramer, 2013; Gao et al., 2024; McNally, 2021). Developed from graph theory and network theory, PNA uses observable items as nodes, and the estimated partial correlations as edges to measure the relationships between observable items (Epskamp et al., 2016; H. Golino et al., 2020; McNally, 2016). Unlike traditional factor-analytic techniques that assume items share the same common cause and are reflective of latent factors, PNA provides an alternative approach to assess the internal structures of latent constructs by directly measuring the relationships between observable variables (H. Golino et al., 2020; Hevey, 2018; McNally, 2016). Also, compared to exploratory factor analysis (EFA), PNA provides substantive value through visualizing the relationships between items using network graphs (Borsboom et al., 2021; Epskamp et al., 2018a). Several simulation studies (e.g., H. F. Golino & Demetriou, 2017; H. Golino et al., 2020) have also pointed out that PNA could even outperform traditional methods such as EFA in examining the factor structure of a latent construct. Hence, many researchers believe PNA is better than, or at least an alternative to factor analysis and it can be very useful to measure psychological phenomena (Borsboom et al., 2021; McNally, 2021).
PNA has been successfully applied in several fields such as personality psychology (Christensen et al., 2020; Costantini et al., 2015), social psychology (Dalege et al., 2016), and psychopathology (e.g., Borsboom et al., 2021; Epskamp et al., 2018a, 2018b). For instance, scholars in psychopathology believe that some symptoms of major depression might be correlated to each other instead of reflecting a latent factor (Borsboom et al., 2021; Epskamp et al., 2018b). Major depression is not measurable and cannot be verified by lab work. Rather, these symptoms might interact with each other and have a causal relationship (McNally, 2016, 2021). If a person gets divorced, he or she might have changes in feelings. Then the changes in feelings could cause sleeping problems and prolonged anxiety problems. In this case, divorce is the major reason causing the chain reaction in the person’s feelings and emotions (McNally, 2016). From the intervention perspective, it might be more critical to figure out the fundamental reasons that cause chain reactions of emotions rather than just simply aggregating these symptoms as a reflection of major depression.
Some researchers have argued that PNA makes several unique contributions to psychological measurement. First, PNA measures direct relationships between observable items and some of these items may have causal relationships or co-occur in some circumstances. Through network estimation, PNA can map the relationships between these observable variables visually (Epskamp et al., 2018a). Second, PNA can help identify key variables that might be more important than others in the chain of reaction. Thus, more effective interventions can be developed by focusing on the key variables instead of latent factors (Epskamp et al., 2018a; McNally, 2016, 2021). Third, compared with traditional factor-analytic techniques such as EFA, PNA can achieve comparable or even superior performance in dimensionality assessment (H. F. Golino & Demetriou, 2017; H. Golino et al., 2020).
Although PNA appears to be a great method, it has not yet been widely used by researchers in some fields (e.g., creativity, entrepreneurship, marketing, and youth development) for various reasons such as a lack of familiarization with this approach and the available R packages (e.g., Gao et al., 2024). There are a variety of R packages, and their features are quite different, which could create barriers for some researchers, particularly those without strong programming skills, when selecting the most appropriate R package to analyze their data. Therefore, this study will briefly review the PNA method, compare several R packages, and provide step-by-step guidance on how to use these R packages to conduct PNA.
The structure of this paper is as follows. In the next section, we will briefly discuss the key features of PNA as well as similarities and differences between PNA and EFA. Then, a few popular R packages that can be used to conduct PNA will be reviewed and compared using a personality data set.
1.1. Psychometric Network Analysis
Networks are ubiquitous and much of our society is organized as networks, from neural networks to social networks, and from individuals to organizations. The key terms in network science consist of nodes and edges (Borgatti et al., 2018; Hogan et al., 2008). Nodes can be anything, such as people in social networks and roads in road networks, whereas edges represent links between nodes (Borgatti et al., 2018; Hogan et al., 2008). Furthermore, edges can be either directed or undirected, and can be weighted or unweighted. For instance, in the social network, individual persons are nodes and friendships are edges. These friendships can be directed from one person to another and weighted from weak to strong (Borgatti et al., 2018).
PNA originates from network theory and thus shares many fundamental concepts with network science. The nodes in PNA represent observed items or variables and edges are correlations between these observed items or variables (Borsboom et al., 2021; Epskamp et al., 2018a; McNally, 2016, 2021). Unlike most networks in which edges are observable, edges in PNA need to be estimated (Epskamp et al., 2018a; McNally, 2016). For instance, studies in psychopathology use depression symptoms as nodes and partial correlations between these depression symptoms as edges (McNally, 2016, 2021). There are different types of PNA networks such as association networks, partial correlation networks, relative importance networks, and Bayesian networks (McNally, 2016). Explicitly, association networks signify the co-occurrence of nodes with undirected edges, partial correlation networks (also known as concentration networks) use partial correlations between nodes by controlling for other nodes to examine if their relationship is direct or spurious, relative importance networks signify the relationship and direction between nodes using predictions, and Bayesian networks manages nodes and their associations in a causal system. Among them, partial correlation networks are most commonly used in PNA because they measure correlations between observable items by controlling for other variables, which cannot be achieved via association networks. For a detailed introduction and review of different networks, see McNally (2021).
1.2. Psychometric Network Analysis and Exploratory Factor Analysis
There is a debate about similarities and differences between EFA and PNA. Although some researchers have argued that PNA and EFA are statistically consistent when they are used to assess factor structures (McNally, 2021), PNA can provide additional information by displaying the relationships between items visually, and in some circumstances, it can explain the causal relationships between these observable variables and potentially identify which variable is more important than others (Epskamp et al., 2018a; McNally, 2021). Therefore, it enables researchers and practitioners to conduct an effective intervention by focusing on the important variables. Yet, it is important to note that while PNA can suggest causal relationships between variables, these networks remain correlational in nature, and caution should be exercised when making causal interpretations unless such claims are supported by longitudinal data or experimental designs.
In addition, EFA remains one of the most widely used factor-analytic techniques (e.g., Gao et al., 2024). Yet, it requires researchers to make a number of subjective decisions pertaining to estimation methods, factor rotation methods, and the interpretation of factor structures, which sometimes leads to varied findings across studies (e.g., Gao et al., 2024; Sass & Schmitt, 2010). In contrast, PNA is able to estimate the factor structure of a latent construct without involving extensive decision making from researchers, which reduces the risk of bias and errors in data analysis (H. Golino et al., 2020). Specifically, in PNA, items are clustered and assigned to dimensions objectively, without researchers’ input. In other words, unlike EFA, PNA does not heavily rely on theoretical guidance for item placement. However, researchers should be aware that for PNA, various network estimation methods and community (i.e., factor) detection algorithms exist, and researcher input is still required to select the optimal solution (for a more detailed discussion, see Epskamp et al., 2018b; H. Golino et al., 2020).
1.3. R Packages for Psychometric Network Analysis
A variety of R packages can be used to conduct PNA. These packages have different features and functionalities, and some of them are still under development. Therefore, this can create great barriers for some researchers who are interested in PNA. Table 1 shows most of the R packages that are currently available, the important features of each package, and the number of downloads that each package has since its initial version was released. For this study, based on the popularity and features of available R packages, as well as the ordinal data used in this study, four packages (i.e., bootnet, qgraph, EGAnet, and BGGM) were selected to perform the analysis.

Table 1.
R packages that can be used to perform PNA.
These four packages have different features and functionalities. However, Bootnet and qgraph were developed by the same research group and have a lot of features in common (Epskamp et al., 2012; Epskamp et al., 2018a). Therefore, in this study, bootnet and qgraph were treated as one combined package. EGAnet separates itself from other packages because it can test the stability of dimensions and items (H. Golino et al., 2020). Unlike most packages that use the traditional frequentist approach, BGGM stands for Bayesian Gaussian graphical models and estimates network structure from the Bayesian perspective (D. R. Williams & Mulder, 2020).
2. Methods
2.1. Data
A personality dataset called bfi was used to demonstrate how to perform PNA in R because Likert items have been extremely widely used in practice to measure psychological constructs such as personality traits. This dataset consists of 28 variables and 2800 observations, and has already been embedded in a very popular R package, psych (Revelle, 2021). The data were originally collected for the Synthetic Aperture Personality Assessment project (Revelle et al., 2010). Since 25 out of 28 variables represented items that were used to measure personality traits (i.e., agreeableness, conscientiousness, extraversion, neuroticism, and openness) and the rest were demographic variables (i.e., gender, education, and age) (Revelle et al., 2010), we created a new dataset (i.e., bfidata) that only included 25 personality items (see the Appendix A for details), and each item was associated with a 6-point Likert scale, ranging from 1 (very inaccurate) to 6 (very accurate).
It is important to note that the types of data supported by the above-listed packages are not limited to the bfi dataset in terms of input data structure (correlation matrix, data frame, or data matrix), variable types and scales (e.g., ordinal vs. continuous), and approaches to handling missing data (e.g., listwise deletion, pairwise deletion, and imputations). Table 2 provides a summary of data and variable-related features across the selected packages. In practice, the selection of packages and specifications of different arguments will result in different ways to recognize the scales of the variables, and the types of correlations used (tetrachoric, polychoric, and Pearson correlations). Together with how missing data are handled, this may lead to results that are different for different degrees and temporal biases. We recommend that users report detailed specifications and procedures applied when using a specific package to conduct the analysis.
Table 2.
Data and variable features of selected R packages that can be used to perform PNA.
2.2. Data Analysis
Four commonly used R packages, including bootnet (Epskamp & Fried, 2024), qgraph (Epskamp et al., 2023), EGAnet (H. Golino & Christensen, 2024), and BGGM (D. Williams et al., 2024) were selected to conduct PNA, which involves three steps: (1) set up the data, (2) estimate the network structure, and (3) assess the accuracy of the network structure. These four R packages were also compared in terms of steps 2 and 3 as step 1 (i.e., data setup) is similar across all of the packages.
3. Results
3.1. Step One: Data Setup
Some people prefer to use R directly, while others like to use the Integrated Development Environment (IDE). The most common IDE for R is Rstudio and everyone can download Rstudio from its website for free. In this study, we used Rstudio to complete the analysis because it is more user friendly than R. To use Rstudio, you must first install R on your computer before you install Rstudio because Rstudio is just an IDE. After you open Rstudio, the Rstudio interface will pop up with four panes (see Figure 1).
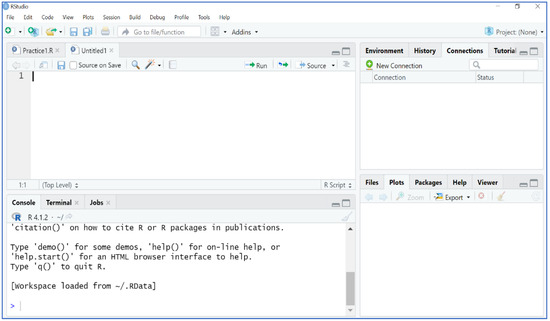
Figure 1.
The interface of Rstudio.
The four panes include console/terminal, editor, environment/history/connection, and files/plots/packages. The console/terminal pane is the major graphical interface where you can directly type in your code, and your code and results will be shown. The editor pane is located at the top left of the interface. You can write, edit, and save your code here. Also, your code will automatically be saved in R and can be edited later and thus it is more useful for large projects that require you to write many lines of code and your own functions. The environment/history/connection pane displays your data, the code and functions you created in the past, and other important features in R. Finally, the files/plots/packages pane serves as a great place to see where your R files are located, all the packages you have installed, the plots you will get, etc.
Next, we need to install a few packages and import data. First, we installed the package tidyverse because this package consists of a few commonly used packages such as ggplot2. Second, we installed a specific package, psych, because we needed the data called bfi that was embedded in the package (Revelle, 2021). We only need to install the packages once. But whenever we use the package, we need to import the package using the library() function.
| Install.packages(“tidyverse”) #This includes a few commonly used packages install.packages(“psych”) #We will use bfi data from this packages library(tidyverse) library(psych) |
Since the original bfi dataset consists of 28 variables, with three being demographic variables (Revelle, 2021), a new dataset was created which only contained 25 items that were used to measure personality traits, and we named the new dataset bfidata.
| #only select the measurement items and exclude the demographical variables bfidata <- bfi[, 1:25] |
After creating our dataset, we installed a few packages that we needed to perform PNA. These packages were bootnet, qgrpah, EGAnet, and BGGM.
| Install.packages(“qgraph”) install.packages(“bootnet”) install.packages(“EGAnet”) install.packages(“BGGM”) library(qgraph) library(bootnet) library(EGAnet) library(BGGM) |
3.2. Step Two: Network Estimation and Plots
In this step, we will use bootnet to estimate psychometric networks and compare these to the networks generated by EGAnet, and BGGM. First, we ran bootnet to estimate the network structure.
| bootnetNetwork <- estimateNetwork(bfidata, default = “EBICglasso”) plot(bootnetNetwork, layout = “spring”, labels = colnames(bfidata)) |
The estimated network plot (see Figure 2) shows the partial correlations between different items of personality measurement using different colors of weighted edges. The purple color represents positive partial correlations, while the red color represents negative partial correlations (Epskamp et al., 2018a). The plot also helps identify three bridge edges with strong correlations between items that belonged to different clusters (i.e., factors) including N4 and C5, E4 and A5, and O3 and E3. However, the clusters (i.e., factors) are hard to identify without using different colors to represent different clusters of nodes.
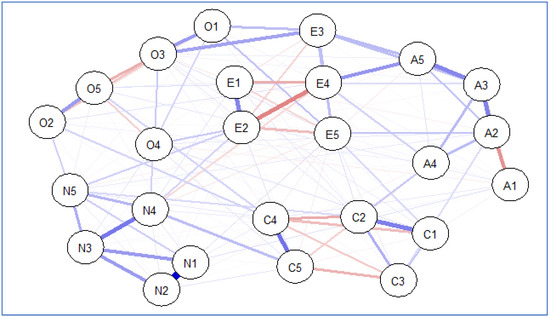
Figure 2.
Estimated network structure from bootnet. Note. A1–A5 stand for five items that were used to measure agreeableness, C1–C5 stand for five items that were used to measure conscientiousness, E1–E5 represent five items that were used to measure extraversion, O1–O5 stand for five items that were used to measure openness, and N1–N5 stand for five items that were used to measure neuroticism.
Second, we used the same data to estimate the network using the EGAnet package. This package is different from bootnet because it uses a different algorithm called Walktrap (H. Golino et al., 2020). Estimation and plotting can be done with one line of code.
| EGAnetNetwork <- EGA(bfidata, model = “glasso”, plot.EGA = TRUE) |
Compared to the findings from bootnet, EGAnet generated a better visual plot with different colors representing different clusters of nodes, and edges (see Figure 3). Similarly, the blue color represents the positive partial correlation whereas the red color represents negative correlation (H. Golino et al., 2020). Five clusters (i.e., factors) and three bridge edges were easily identified.
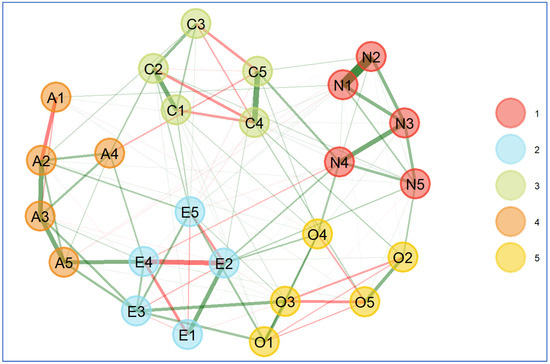
Figure 3.
Estimated network structure from EGAnet. Note. A1–A5 stand for five items that were used to measure agreeableness, C1–C5 stand for five items that were used to measure conscientiousness, E1–E5 represent five items that were used to measure extraversion, O1–O5 stand for five items that were used to measure openness, and N1–N5 stand for five items that were used to measure neuroticism.
Third, we used BGGM to estimate the network. The syntax of BGGM was slightly different from bootnet and EGAnet, and the plot was different as well from those generated by bootnet and EGAnet. However, the results (see Figure 4) were similar in terms of the number of clusters (i.e., factors), strong edges, and bridge edges that link items belonging to different clusters (i.e., factors). In the BGGM plot, two more bridge edges were identified and they were A2 and E5, and N4 and C5 (see Figure 4).
| BGGMnetwork <- estimate(bfidata) select(BGGMnetwork) summary(BGGMnetwork) comm <- substring(colnames(bfidata), 1, 1) BGGMplot <- plot(select(BGGMnetwork), groups = comm, edge_magnify = 5, palette = “Pastel1”, title = “BGGMnetwork”, node_size = 12) BGGMplot |
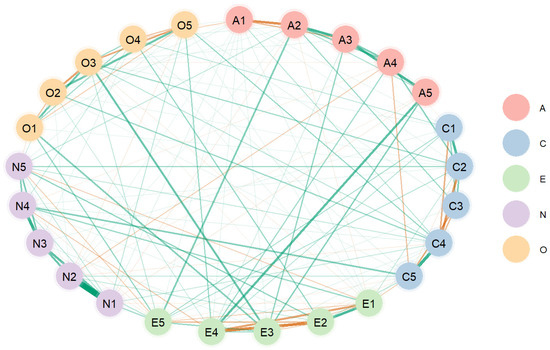
Figure 4.
Estimated network structure from BGGM. Note. A1–A5 stand for five items that were used to measure agreeableness, C1–C5 stand for five items that were used to measure conscientiousness, E1–E5 represent five items that were used to measure extraversion, O1–O5 stand for five items that were used to measure openness, and N1–N5 stand for five items that were used to measure neuroticism.
3.3. Step Three: Evaluate Network Structure and Stability of Dimensions and Items
First, we used bootnet to further evaluate the network structure through computing the centrality indices of the estimated network structure. Bootnet is also capable of measuring the stability of centrality indices using the case-dropping bootstrapping method (Epskamp et al., 2018a; Hevey, 2018). Major centrality indices include node strength, closeness, betweenness, and expected influence, which assess the relative importance or impact of a node within the network. Specifically, node strength measures “how well a node is directly connected to other nodes” (Epskamp et al., 2018a, p. 196), whereas closeness estimates the degree to which a node is indirectly linked to others (Epskamp et al., 2018a). Betweenness quantifies the importance of a node in the average path when two other nodes are connected directly or indirectly (Epskamp et al., 2018a; Hevey, 2018). Expected influence determines the extent to which a node can affect other nodes in a network (Epskamp et al., 2018a). The codes below were used to generate the centrality indices and the stability information (see Figure 5 and Figure 6).
| centralStability <- bootnet(bootnetNetwork, nBoots = 2500, type = “case”) summary(centralStability) corStability(centralStability) plot(centralStability) |
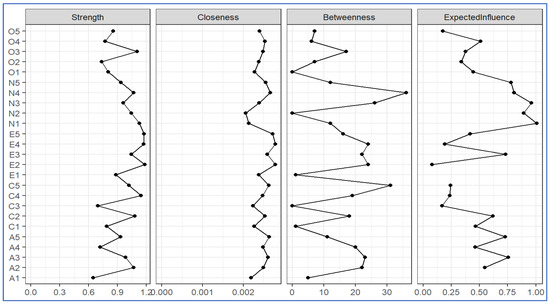
Figure 5.
Estimated centrality indices.
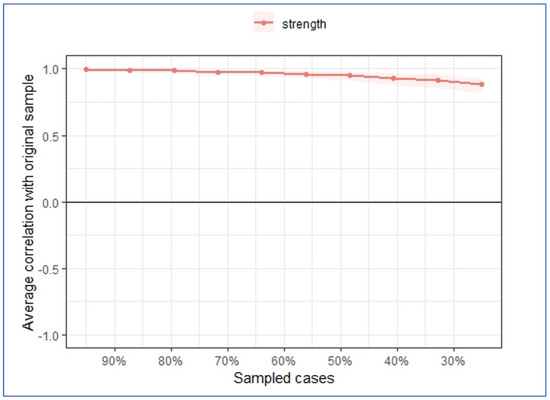
Figure 6.
Estimated stability of centrality indices (strength).
Figure 5 shows that item E2 had the highest strength and closeness, indicating that this item was most strongly connected to other nodes both directly and indirectly. However, N4 had the highest betweenness score, meaning that N4 was more important when two other nodes connected, potentially serving as an important bridge node. N1 had the highest expected influence score, meaning this item had the greatest potential to influence other nodes in the network. However, these results might not be very interpretable if these centrality indices are not stable. Therefore, testing the stability of these centrality indices is critical to correctly interpret the results. Figure 6 shows that the stability score for strength was above 0.7, indicating the node strength was very stable using the case-dropping bootstrapping method (Epskamp et al., 2018a).
To estimate model stability, EGAnet also uses the bootstrapping method to check the stability of dimensions and items. However, unlike bootnet, EGAnet does not provide centrality indices.
The following codes generated two tables and one figure of dimension stability and item stability information across all bootstrap samples (see Table 2 and Table 3, and Figure 7).
| EGAboot <- bootEGA(bfidata, iter = 500, type = “resampling”) EGAboot$summary.table EGAboot$frequency itemStability(EGAboot) |
Table 3.
Summary statistics.
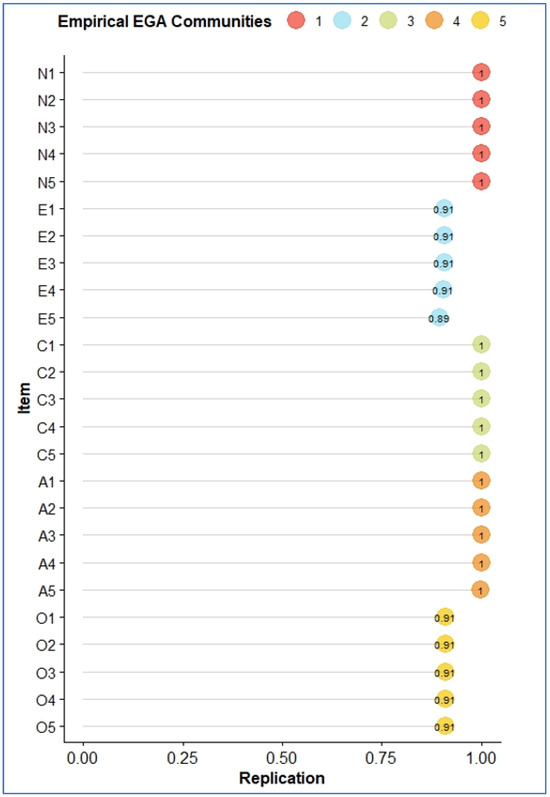
Figure 7.
Estimated stability of dimensions and items from EGAnet.
Table 3 shows that the median number of dimensions (median.dim) was five, with a relatively narrow confidence interval (CI 95% [4.22, 5.78]). Table 4 further indicates that the five-dimension structure was successfully replicated most of the time (80.6%), that is, 403 out of 500 bootstrapping iterations. The four-dimension structure only occurred 19.4% of the time.
Table 4.
Frequency of the number of dimensions.
Figure 7 shows that all of the items in five dimensions were highly stable based on the bootstrapped samples, with the scores being above 0.75 (Fried et al., 2022).
The last package we tried to run for the stability test of items was BGGM. However, BGGM is unable to check the stability of items or centrality indices. One reason is that this package is relatively new and was just released in 2020. Thus, new features might be currently under development.
4. Discussion
We reviewed four popular R packages that can be used to conduct psychometric network analysis and compared their performance regarding network estimation and stability. This comparison can help researchers become familiar with these packages, and the step-by-step guidance will further enable them to choose a specific R package to carry out PNA.
4.1. Comparison of Performance
The four packages have different features and functionalities and they estimate network structures and the stability of network structures in different ways. However, for network structure estimation, these packages generated similar results, while EGAnet’s plot was clearer because it used different colors and shapes and positions to demonstrate the nodes, edges, and clusters (i.e., factors). For the further evaluation of the estimated network structure, bootnet was able to compute the centrality indices including nodes strength, closeness, betweenness, and expected influence. All these indices can be used to measure the relative importance or influence of a node in a network. Also, bootnet can assess the stability of centrality indices using the case-dropping bootstrapping method. While EGAnet could check dimension and item stability, it did not provide centrality indices. BGGM did not provide these features at all.
To estimate the factor structure of a latent construct, we would recommend starting with EGAnet to assess dimensionality and visualize different dimensions. If studies are supported by strong theories and measures are well constructed, bootnet might be a better option as it also allows researchers to further examine the estimated network structure using centrality indices such as nodes strength, closeness, and betweenness. In other words, bootnet also allows researchers to identify the important variables. Overall, both EGAnet and bootnet are great R packages for psychometric network analysis with different features and functionalities.
4.2. PNA, Dimensionality Assessment, and Other Implications
Existing research has shown that PNA may serve as a great alternative to traditional factor-analytic techniques such as EFA for dimensionality assessment (e.g., H. F. Golino & Demetriou, 2017; H. Golino et al., 2020). This study confirms prior findings by providing additional evidence of PNA’s performance. Specifically, previous studies using EFA indicated that the 25 personality items used in this study reflected five latent factors (Goldberg, 1999; Revelle, 2021), and PNA correctly identified all the five factors (i.e., agreeableness, conscientiousness, extraversion, neuroticism, and openness).
Furthermore, PNA can visualize the relationships between different items. The centrality indices provided by the bootnet package can help identify the more important or influential nodes in a network, which will be very helpful when it comes to investigating causal relationships among various psychological phenomena. For instance, divorce might lead to sleeping problems and anxiety problems, which then might lead to depression. Another example will be how to develop creativity. Although creativity has been identified as one of the most important 21st century skills (e.g., Grey & Morris, 2022; Qian & Clark, 2016), promoting student creativity in schools remains a challenge for researchers and educators. If PNA is used to achieve a better understanding of the relationships among various factors such as personal characteristics (e.g., creative personality traits), domain knowledge, creativity assessment, and teacher support, it will help researchers and educators develop effective interventions to promote students’ creativity in formal and informal learning environments.
4.3. Limitations and Future Research
One limitation is that we did not discuss various network estimation methods and their associated statistical assumptions, as the primary goal of this study is to compare several widely used R packages and assist researchers in selecting an appropriate package for conducting PNA. For those interested in a more in-depth exploration of network models, we recommend they read articles such as Epskamp et al. (2018a) and H. Golino et al. (2020).
Also, in this study, we only compared four commonly used R packages. One reason is that the personality dataset we used only contained ordinal responses. In practice, however, many studies involve binary, ordinal, and continuous cross-sectional data or time-series data. Although all four R packages used in this study can handle binary, ordinal, and continuous cross-sectional data, researchers need to choose appropriate packages to conduct PNA if their research necessitates collecting time-series data. For instance, the graphicalVAR package (Epskamp, 2024) can be used to estimate the interactions within and between time points in experience sampling data, and mgm (Haslbeck, 2023) is a great package for estimating time-varying time-series network models (i.e., network structures that change over time). Since both graphicalVAR and mgm have been integrated into the bootnet package, researchers can choose to download and install these two packages separately or just download and install the bootnet package. If the major goal of a study is to identify important nodes (i.e., items) and detect redundant nodes in a network, either bootnet or the relatively new package networktools (Jones, 2025) would be a good choice.
In addition, these packages have their own strengths and weaknesses, and newer versions with additional features are constantly being developed. Hence, researchers are encouraged to update the codes presented in this study in the future, if necessary. This is a common problem for any software, especially open-source software. However, with further development, all these R packages might become more and more similar in terms of features, and might be able to effectively handle all kinds of data (e.g., cross-sectional vs. time-series data) and models. In other words, researchers can choose any of the packages to analyze their data.
Author Contributions
Conceptualization, M.Q. and X.W.; methodology, X.W., M.Q. and S.D.; Software and formal analysis, X.W. and M.Q.; data curation, X.W.; writing—original draft preparation, M.Q., X.W. and S.D.; Writing—review and editing, M.Q., X.W. and S.D.; visualization, X.W. and M.Q. All authors have read and agreed to the published version of the manuscript.
Funding
This research received no external funding.
Institutional Review Board Statement
Not applicable.
Informed Consent Statement
Not applicable.
Data Availability Statement
A public dataset was used in this study: https://www.personality-project.org/r/html/bfi.html. Accessed on 20 March 2023 and 1 February 2025.
Conflicts of Interest
The authors declare no conflicts of interest.
Appendix A
Table A1.
Personality items used in the study.
Table A1.
Personality items used in the study.
| Dimensions | Items |
|---|---|
| Agreeableness | A1 Am indifferent to the feelings of others. |
| A2 Inquire about others’ well-being. | |
| A3 Know how to comfort others. | |
| A4 Love children. | |
| A5 Make people feel at ease. | |
| Conscientiousness | C1 Am exacting in my work. |
| C2 Continue until everything is perfect. | |
| C3 Do things according to a plan. | |
| C4 Do things in a half-way manner. | |
| C5 Waste my time. | |
| Extraversion | E1 Don’t talk a lot. |
| E2 Find it difficult to approach others. | |
| E3 Know how to captivate people. | |
| E4 Make friends easily. | |
| E5 Take charge. | |
| Neuroticism | N1 Get angry easily. |
| N2 Get irritated easily. | |
| N3 Have frequent mood swings. | |
| N4 Often feel blue. | |
| N5 Panic easily. | |
| Openness | O1 Am full of ideas. |
| O2 Avoid difficult reading material. | |
| O3 Carry the conversation to a higher level. | |
| O4 Spend time reflecting on things. | |
| O5 Will not probe deeply into a subject. |
Note. The items are from the International Personality Item Pool (Goldberg, 1999).
References
- Borgatti, S. P., Everett, M. G., & Johnson, J. C. (2018). Analyzing social networks. Sage. [Google Scholar]
- Borkulo, C. V., & Epskamp, S. (2023). IsingFit: Fitting ising models using the elasso method (0.4) [R package]. Available online: https://cran.r-project.org/web/packages/IsingFit/index.html (accessed on 1 February 2025).
- Borsboom, D., & Cramer, A. O. (2013). Network analysis: An integrative approach to the structure of psychopathology. Annual Review of Clinical Psychology, 9, 91–121. [Google Scholar] [CrossRef] [PubMed]
- Borsboom, D., Deserno, M. K., Rhemtulla, M., Epskamp, S., Fried, E. I., McNally, R. J., Robinaugh, D. J., Perugini, M., Dalege, J., Costantini, G., & Isvoranu, A. M. (2021). Network analysis of multivariate data in psychometric science. Nature Reviews Methods Primers, 1(1), 1–18. [Google Scholar] [CrossRef]
- Christensen, A. P., Golino, H., & Silvia, P. J. (2020). A psychometric network perspective on the validity and validation of personality trait questionnaires. European Journal of Personality, 34(6), 1095–1108. [Google Scholar] [CrossRef]
- Costantini, G., Epskamp, S., Borsboom, D., Perugini, M., Mõttus, R., Waldorp, L. J., & Cramer, A. O. (2015). State of the aRt personality research: A tutorial on network analysis of personality data in R. Journal of Research in Personality, 54, 13–29. [Google Scholar] [CrossRef]
- Dalege, J., Borsboom, D., Van Harreveld, F., Van den Berg, H., Conner, M., & Van der Maas, H. L. (2016). Toward a formalized account of attitudes: The Causal Attitude Network (CAN) model. Psychometric Review, 123(1), 2. [Google Scholar] [CrossRef] [PubMed]
- Epskamp, S. (2024). graphicalVAR: Graphical VAR for experience sampling data (0.3.4) [R package]. Available online: https://cran.r-project.org/web/packages/graphicalVAR/index.html (accessed on 1 February 2025).
- Epskamp, S., Borsboom, D., & Fried, E. I. (2018a). Estimating psychometric networks and their accuracy: A tutorial paper. Behavior Research Methods, 50(1), 195–212. [Google Scholar] [CrossRef] [PubMed]
- Epskamp, S., Costantini, G., Haslbeck, J., & Isvoranu, A. (2023). qgraph: Graph plotting methods, psychometric data visualization and graphical model estimation (1.9.8) [R package]. Available online: https://cran.r-project.org/web/packages/qgraph/qgraph.pdf (accessed on 1 February 2025).
- Epskamp, S., Cramer, A. O., Waldorp, L. J., Schmittmann, V. D., & Borsboom, D. (2012). qgraph: Network visualizations of relationships in psychometric data. Journal of Statistical Software, 48(4), 1–18. [Google Scholar] [CrossRef]
- Epskamp, S., & Fried, E. I. (2024). bootnet: Bootstrap methods for various network estimation routines (1.6) [R package]. Available online: https://cran.r-project.org/web/packages/bootnet/index.html (accessed on 1 February 2025).
- Epskamp, S., Maris, G. K., Waldorp, L. J., & Borsboom, D. (2016). Network psychometrics. arXiv, arXiv:1609.02818. [Google Scholar]
- Epskamp, S., Waldorp, L. J., Mõttus, R., & Borsboom, D. (2018b). The gaussian graphical model in cross-sectional and time-series data. Multivariate Behavioral Research, 53(4), 453–480. [Google Scholar] [CrossRef]
- Fried, E. I., Epskamp, S., Veenman, M., & van Borkulo, C. D. (2022). Network stability, comparison, and replicability. In A.-M. Isvoranu, S. Epskamp, L. J. Waldorp, & D. Borsboom (Eds.), Network psychometrics with R: A guide for behavioral and social scientists (pp. 133–153). Routledge. [Google Scholar] [CrossRef]
- Gao, Q., Qian, M., Wang, A. X., & Dai, S. (2024). Examining the dimensionality of the self-perceptions of creativity scale using psychometric network analysis: A tutorial. Creativity Research Journal, 1–14. [Google Scholar] [CrossRef]
- Goldberg, L. R. (1999). A broad-bandwidth, public domain personality inventory measuring the lower-level facets of several five-factor models. In I. Mervielde, I. Deary, F. De Fruyt, & F. Ostendorf (Eds.), Personality psychology in Europe (Vol. 7, pp. 7–28). Tilburg University Press. [Google Scholar]
- Golino, H., & Christensen, A. (2024). EGAnet: Exploratory graph analysis—A framework for estimating the number of dimensions in multivariate data using network psychometrics (2.1.0) [R package]. Available online: https://cran.r-project.org/web/packages/EGAnet/index.html (accessed on 1 February 2025).
- Golino, H., Shi, D., Christensen, A. P., Garrido, L. E., Nieto, M. D., Sadana, R., Thiyagarajan, J. A., & Martinez-Molina, A. (2020). Investigating the performance of exploratory graph analysis and traditional techniques to identify the number of latent factors: A simulation and tutorial. Psychological Methods, 25(3), 292. [Google Scholar] [CrossRef] [PubMed]
- Golino, H. F., & Demetriou, A. (2017). Estimating the dimensionality of intelligence like data using exploratory graph analysis. Intelligence, 62, 54–70. [Google Scholar] [CrossRef]
- Grey, S., & Morris, P. (2022). Capturing the spark: PISA, twenty-first century skills and the reconstruction of creativity. Globalisation, Societies and Education, 22(2), 156–171. [Google Scholar] [CrossRef]
- Haslbeck, J. (2023). mgm: Estimating time-varying k-order mixed graphical models (1.2–14) [R package]. Available online: https://cran.r-project.org/web/packages/mgm/index.html (accessed on 1 February 2025).
- Hevey, D. (2018). Network analysis: A brief overview and tutorial. Health Psychology and Behavioral Medicine, 6(1), 301–328. [Google Scholar] [CrossRef] [PubMed]
- Hogan, B., Fielding, N., & Lee, R. M. (2008). Analyzing social networks. In The sage handbook of online research methods (pp. 141–160). Sage. [Google Scholar]
- Jones, P. (2025). networktools: Tools for identifying important nodes in networks (1.6.0) [R package]. Available online: https://cran.r-project.org/web/packages/networktools/index.html (accessed on 1 February 2025).
- McNally, R. J. (2016). Can network analysis transform psychopathology? Behaviour Research and Therapy, 86, 95–104. [Google Scholar] [CrossRef] [PubMed]
- McNally, R. J. (2021). Network analysis of psychopathology: Controversies and challenges. Annual Review of Clinical Psychology, 17, 31–53. [Google Scholar] [CrossRef] [PubMed]
- Qian, M., & Clark, K. R. (2016). Game-based learning and 21st century skills: A review of recent research. Computers in Human Behavior, 63, 50–58. [Google Scholar] [CrossRef]
- Revelle, W. (2021). psych: Procedures for psychometric, psychometric, and personality research. Northwestern University, Evanston, Illinois. R package version 2.1.9. Available online: https://CRAN.R-project.org/package=psych (accessed on 1 February 2025).
- Revelle, W., Wilt, J., & Rosenthal, A. (2010). Individual differences in cognition: New methods for examining the personality-cognition link. In A. Gruszka, G. Matthews, & B. Szymura (Eds.), Handbook of individual differences in cognition: Attention, memory, and executive control (pp. 27–49). Springer Science+Business Media. [Google Scholar] [CrossRef]
- Sass, D. A., & Schmitt, T. A. (2010). A comparative investigation of rotation criteria within exploratory factor analysis. Multivariate Behavioral Research, 45(1), 73–103. [Google Scholar] [CrossRef]
- Williams, D., Mulder, J., & Rast, P. (2024). BGGM: Bayesian gaussian graphical models (2.1.5) [R package]. Available online: https://cran.r-project.org/web/packages/BGGM/index.html (accessed on 1 February 2025).
- Williams, D. R., & Mulder, J. (2020). BGGM: Bayesian gaussian graphical models in R. Journal of Open Source Software, 5(51), 2111. [Google Scholar] [CrossRef]
Disclaimer/Publisher’s Note: The statements, opinions and data contained in all publications are solely those of the individual author(s) and contributor(s) and not of MDPI and/or the editor(s). MDPI and/or the editor(s) disclaim responsibility for any injury to people or property resulting from any ideas, methods, instructions or products referred to in the content. |
© 2025 by the authors. Licensee MDPI, Basel, Switzerland. This article is an open access article distributed under the terms and conditions of the Creative Commons Attribution (CC BY) license (https://creativecommons.org/licenses/by/4.0/).