1. Introduction
The emergence of social media networks (SMNs) has significantly changed how people interact with each other. Such platforms can create new opportunities in different life sectors, including business, economic, healthcare, and education. Governmental and non-governmental organizations adopt SMNs to improve the relationship with their customers and citizens as well as strengthen their engagement (
Khlaif & Salha, 2021). Accordingly, several different SMSs have been established such as Facebook, Twitter, YouTube, and TikTok. Each platform has its particular features and focus, i.e., the content of TikTok is intended for short videos. TikTok has been ranked number five in comparison with other SMNs based on the number of active users (
Dixon, 2024). Although TikTok was originally established for entertainment, its potential use as an educational tool has also been considered (
Xu et al., 2019).
SMNs have a significant effect on pedagogical practices, creating innovative theoretical approaches (
Al-Azawei, 2019). Creating innovative theoretical approaches in contemporary education may include suggesting original models or new perspectives in responding to learners’ needs. This may often compete with existing approaches and introduce new ideas. For example, SMNs play a key role in fostering innovative theoretical approaches by introducing new platforms for idea exchange, effective collaboration, and continuous communication (
Greenhow & Lewin, 2016). Hence, the popularity of short videos with the aim of achieving a particular learning objective has been raised. In this regard, TikTok represents a potential learning platform in contemporary education because it enables the delivery of short educational videos in a small time period (
Khlaif & Salha, 2021). As stated by
Fiallos et al. (
2021), about 41% of its active users are young people. This should encourage educational institutions to consider such a platform with the aim of enhancing learner engagement. According to the findings of a previous research study (
Al-Azawei, 2019), learners tend towards SMNs such as Facebook in education more than formal e-learning platforms. However, this may be more evident for TikTok as it has a perfect format for creating short educational videos and this, in turn, led LearnOnTikTok videos to have more than 72 billion views and hundreds of videos to be uploaded every day (
Fiallos et al., 2021). In this context, considering what can drive successful adoption of TikTok as an informal learning setting is necessary. Moreover, TikTok may or may not be implemented successfully in learning settings, particularly if educators aim to integrate this technology with formal learning.
Technology adoption refers to the apparent willingness of users to use the technology for the purposes that it is intended for. Several different technology adoption and success models have been proposed such as the theory of reason action (
Ajzen & Fishbein, 1980), the technology acceptance model (
Davis, 1986), the unified theory of acceptance and use of technology (
Venkatesh et al., 2003), and the DeLone and McLean Information Systems Success model (
DeLone & McLean, 2003). This research is grounded on the DeLone and McLean Information Systems Success (D&M-ISS) model due to several reasons. First, it is widely applied in technology success research (
Al-Azawei & Al-Azawi, 2021). Second, it is an adaptable model to new contexts and technologies (
Petter et al., 2008). Finally, this model can be successfully aligned with emerging learning technologies (
Marjanovic et al., 2024). However, this model focuses on quality factors, whereas other constructs that may relate to the current behavior of users are neglected. It should be clear that there is a lack of research on predicting TikTok’s success in the education sector. Moreover, SNSs provide enjoyable and interactive features, so such factors are integrated with the proposed model. However, as reported in earlier research (
D’Arcy & Herath, 2011), users may not tend to use an information system or application if they feel that their individual information and privacy are not preserved. This leads to integrating security perceptions to evaluate the success of information systems. Yet, there is limited research on their role in predicting technology adoption (
Al-Azawei et al., 2023). This research, therefore, aims to predict the acceptance of TikTok as an informal learning means.
The contributions of this research are threefold. First, it provides a more comprehensive understanding of the factors that can contribute to TikTok’s success in informal education. Second, an integrated model is proposed based on several different theories to show the outcomes of the adoption of SMSs for learning. The integrated theories complement each other. For example, although the D&M-ISS model focuses on quality concepts, it pays little attention to the social effect of technology confusion, its interactive features, intrinsic motivation, and security considerations. Finally, the research compares the performance of structural equation modeling with data mining techniques. To the best of the authors’ knowledge, this research is the first of its kind that integrates five widely adopted theories in technology success research to predict TikTok adoption in informal learning.
The rest of this research is structured as follows.
Section 2 presents general background on TikTok technology, whereas
Section 3 shows the use of TikTok in education.
Section 4 introduces the proposed framework. In
Section 5, the research methodology is reported.
Section 6 presents the research findings, whereas
Section 7 discusses the key research outcomes. Finally,
Section 8 highlights the research conclusions.
2. The TikTok Application
TikTok was first launched in China under the name of Douyin in 2016 and internationally under the name of TikTok in 2017. This technology allows 10 min micro videos. Micro videos are the most used type of multimedia on mobile devices. They typically include three features: (1) a brief duration, which makes them simple to share on social media, (2) the subjective expression of micro-video semantics can be facilitated by social attributes such as descriptions, follower counts, and click through rates, and (3) they are created in real time, so videos can show the feelings and emotions of content producers (
Guo et al., 2021). TikTok is preferred by its users because the content is concise, expressive, and informative. As TikTok is an application that displays talent content and knowledge, its users enjoy using this application and it may lead to addiction (
Y. Yang & Zilberg, 2020). TikTok has also been successfully used in recommendation systems based on artificial intelligence (
Grandinetti, 2023). Algorithms of artificial intelligence can accurately learn users’ preferences and provide recommendations based on their past search.
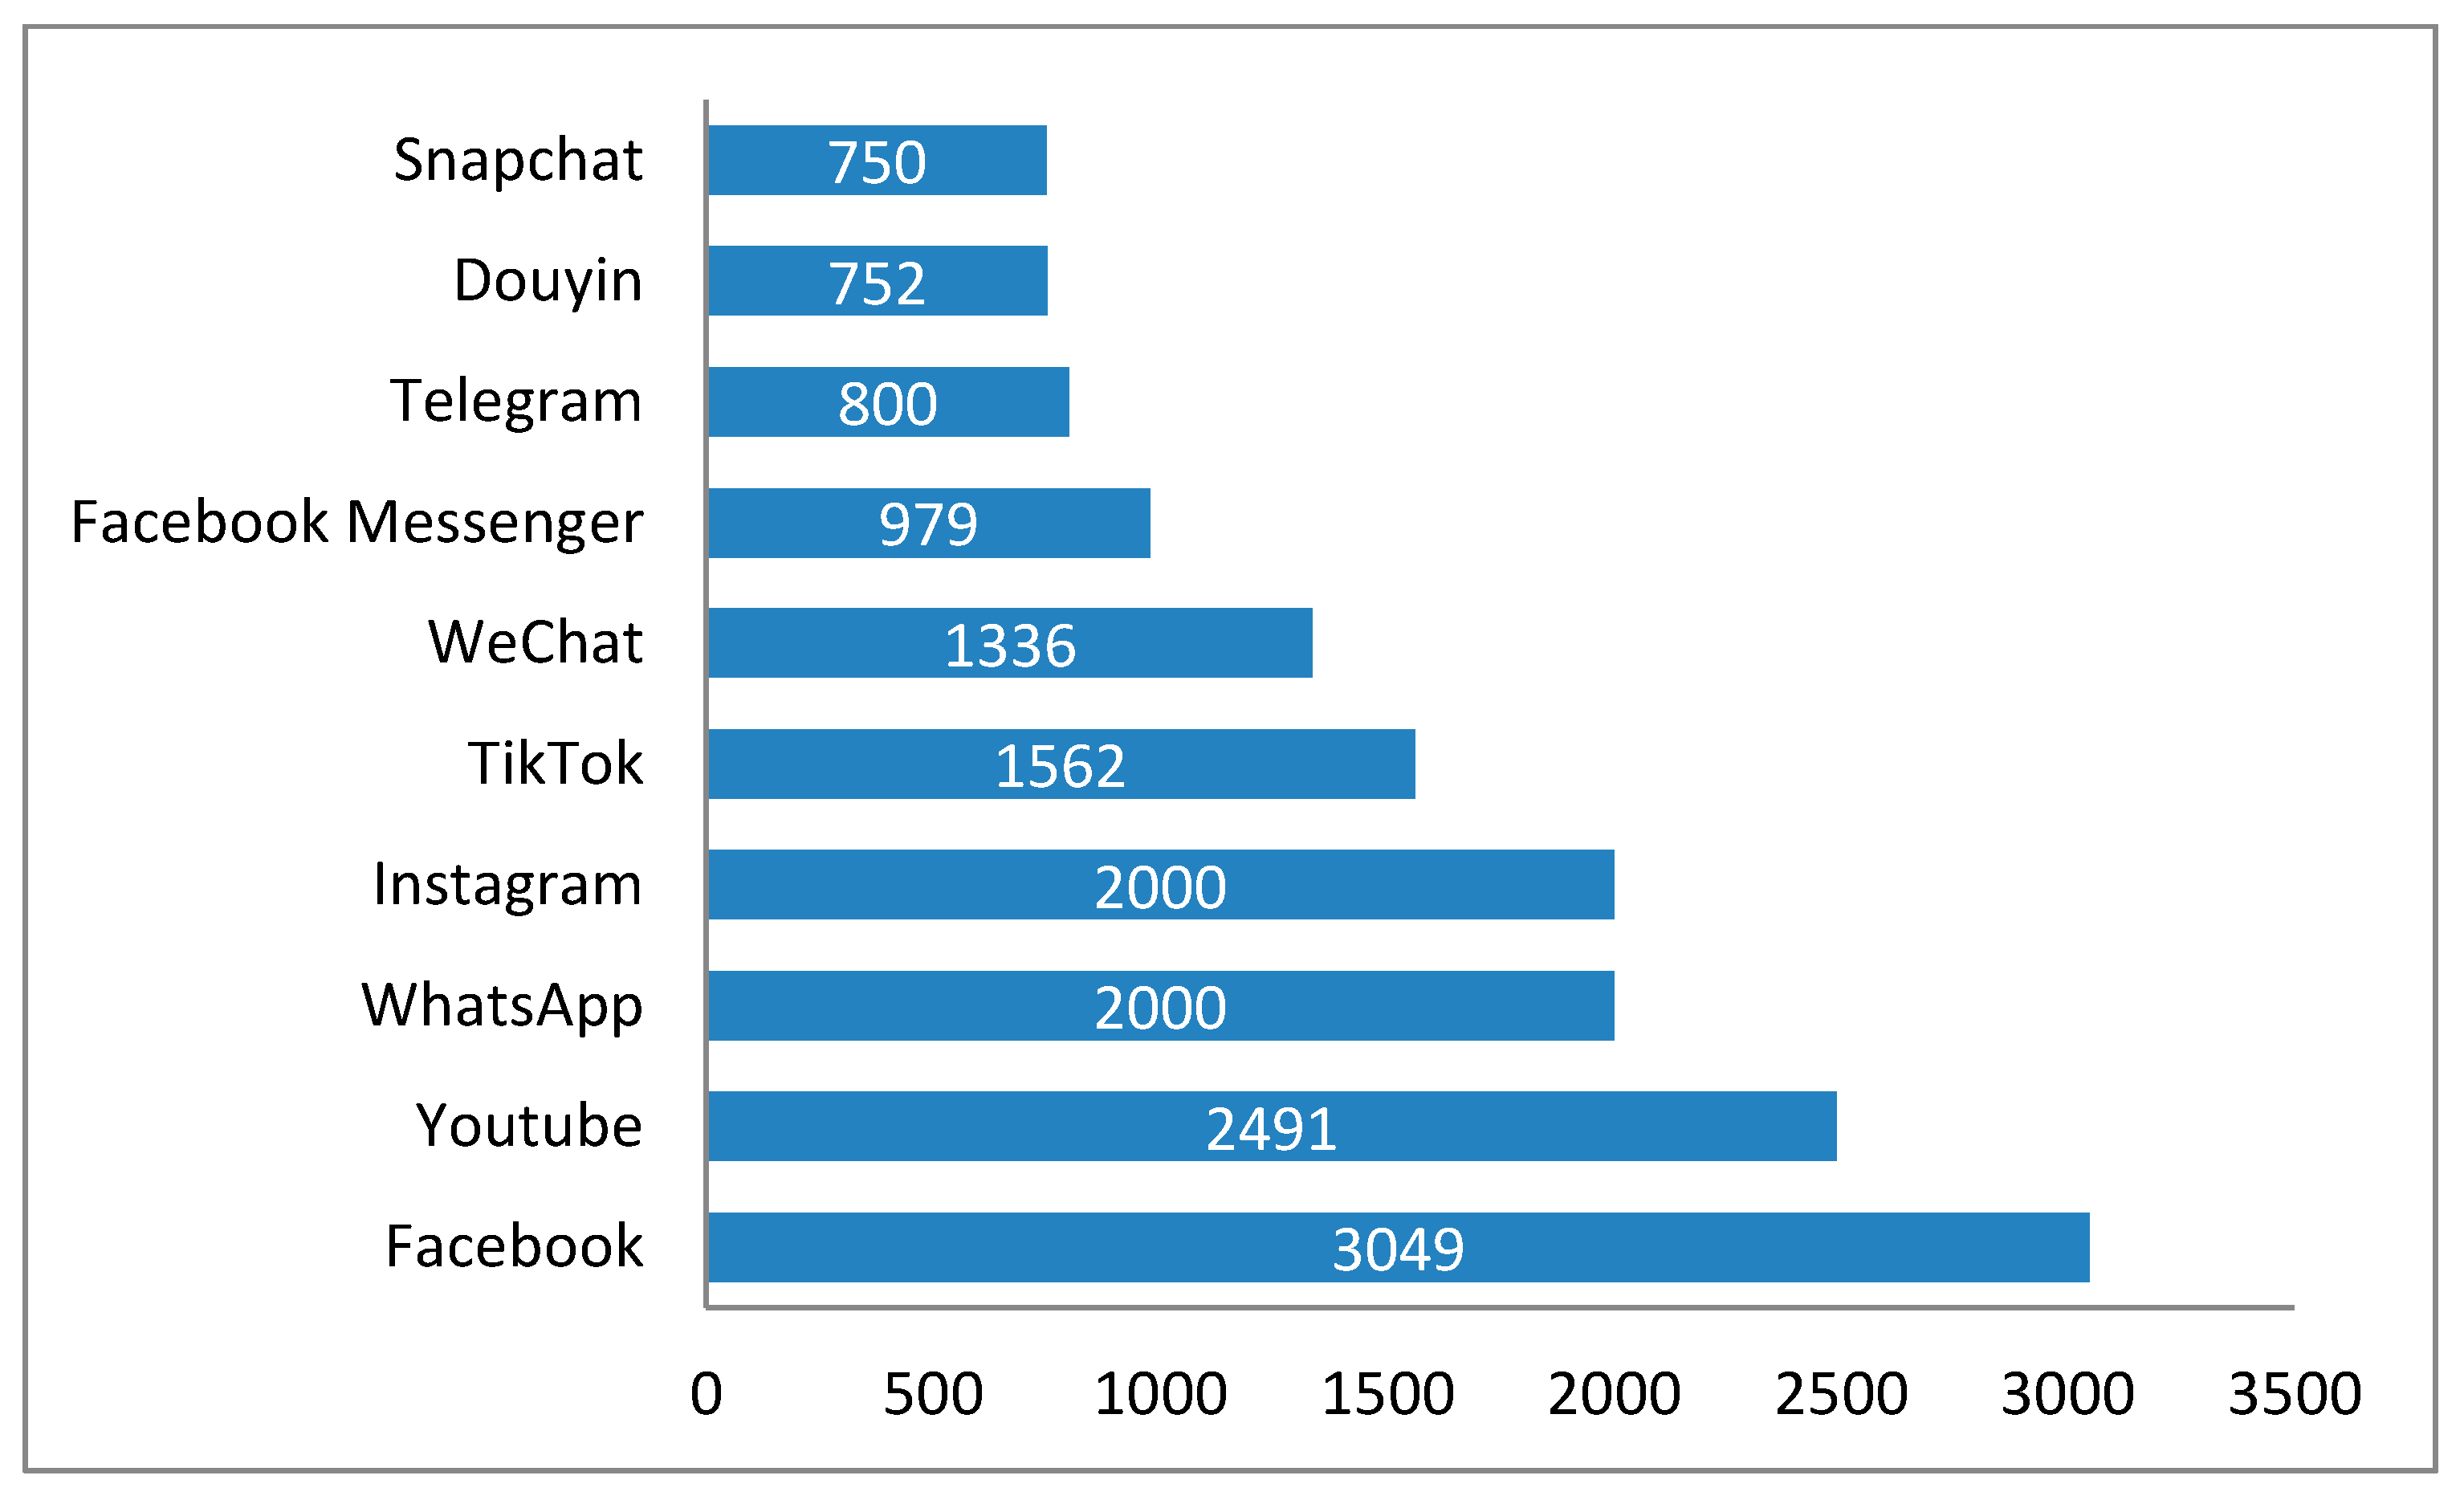
Figure 1 shows the most popular SMNs.
Iraq is ranked number one in the Middle East region regarding the number of active TikTok users (
IraqiNews, 2023). This is followed by the United Arab Emirates, Saudi Arabia, Kuwait, and Qatar. In Iraq, TikTok has about 23.88 million active users within the following age ranges: 18–24 (65.9%), 25–34 (24.3%), and 35–44 (5.6%) (
Start.io, 2024;
Kemp, 2023). For all active users in early 2023, 33.7% were female, while 66.3% were male (
Kemp, 2023). This may be attributed to the nature of Iraqi culture and religion. In respect to TikTok penetration, Iraq is number three with 100.4%, whereas Saudi Arabia is ranked number one (110.7%), followed by the United Arab Emirates (104.7%). Such statistics should invite educational organizations in Iraq to exploit TikTok features in the learning and teaching process.
3. The Use of TikTok in Learning
According to
Mei and Aziz (
2022), the key functions of SMSs are interaction, entertainment, knowledge, and education. Hence, such platforms can undoubtedly improve students’ learning experience, but there are still concerns regarding their negative effects (
Greenhow & Lewin, 2016). Although TikTok is well-known as an application where users can upload their own videos, participate in trends and display other talents, its use for sharing educational content is beginning to grow (
Fiallos et al., 2021). In India, for example, TikTok hosted the EduTok program to revolutionize successful e-learning application (
Rahimullah et al., 2022). This was followed by the development of the LearnOnTikTok application by TikTok (
Grandinetti, 2023). To create educational content, TikTok works with 800 educational institutions, educators and nonprofit institutions as part of this program. This includes different scientific subjects such as technology and engineering, medicine and healthcare, food and drink, and science/chemistry (
Rahimullah et al., 2022).
In line with the previous discussion, TikTok has been widely integrated in education (
S. Wang et al., 2024), and this should invite further research to investigate what can affect its successful adoption and implementation. Providing an integrated learning environment by face-to-face and TikTok application may offer a means for learners’ engagement and this, in turn, can lead to improving learning outcomes. However, this cannot be achieved without investigating factors that may affect TikTok successful adoption.
The above-discussed benefits of TikTok use do not mean that this social media application is without limitations in educational contexts. SMSs such as TikTok can also cause (1) learner distraction (
Junco, 2012), (2) misinformation (
Pennycook & Rand, 2019), and privacy and security issues (
Maheshwari & Mac, 2023). Accordingly, SNSs should be used in learning with more consideration on such limitations.
4. The Proposed Framework and Literature Review
In this study, a conceptual framework is proposed, which is grounded on the D&M-ISS model (
DeLone & McLean, 2003). However, other constructs that were not considered in the original D&M-ISS model and may have effect on TikTok adoption are integrated. The proposed model includes learner enjoyment, security perceptions, perceived popularity, interactivity, learner satisfaction, information quality, and system quality.
Figure 2 depicts the proposed model.
According to
DeLone and McLean (
1992), several different models on information system success were reviewed. This leads to the proposal of a six-dimensional model. It suggests a relationship among six constructs. These are perceived satisfaction, user impact, information quality, system quality, information system use, and organizational impact. According to
Y. S. Wang and Liao (
2007), the framework adds two important contributions to earlier literature on information system success. First, it establishes a scheme to categorize the multitude of measures of information system success. It, furthermore, suggests a framework of causal interdependence between factors. Accordingly, this model received researchers’ and scholars’ attention because of its validation and evaluation in different contexts (
Petter & McLean, 2009). In 2003, DeLone and McLean reviewed the model and suggested a new construct, namely, service quality (
DeLone & McLean, 2003). However, issues were faced by earlier research concerning the validity of this construct (
Ramirez-Correa et al., 2017).
Previous literature adopted this model to investigate the success of learning technologies. For example, (
Sutiyono et al., 2024) assessed the acceptance of e-learning based on the D&M-ISS model. Similarly, to examine learning management systems (LMS) success,
Rulinawaty et al. (
2024) also uses this model, confirming its validity in evaluating LMS success. In this context,
Widyaningrum et al. (
2024) supported its validity to predict LMS success. On the other hand,
Alotaibi and Alshahrani (
2022) extended the model with two constructs namely, learner and instructor quality in the e-learning context, confirming its validity. In another research study conducted by
Rokhman et al. (
2022), teacher capability, student capability, and social impact were integrated with the model to evaluate e-learning success. Unlike earlier literature, this present research extends the model based on widely accepted theories in technology adoption. It also examines the effectiveness of the proposed model in informal learning context. This investigation confirms the acceptance of SMNs for learning purposes, considering their content quality, users’ privacy, popularity, intrinsic motivation, and interactive features.
4.1. Enjoyment
Persistence in the workplace, health behavior, and academic performance can be predicted by intrinsic motivation (
Fishbach & Woolley, 2022). Hence, activity engagement for its pleasure and inherent satisfaction represents intrinsic motivation.
Ryan and Deci (
2000) emphasize that enjoyment can fulfill psychological needs such as competence and autonomy as well as enhancing intrinsic motivation by expressing a critical emotional experience. Enjoyment refers to the feelings of pleasure when users adopt technology regardless of the performance resulting from technology use (
Dickinger et al., 2008). According to the motivation theory, enjoyment is an influential construct in formalizing people’s acceptance of technology (
S. Yang, 2013). TikTok is intended for entertainment more than education, so it is expected that users’ decision to accept it for learning is based on their level of pleasure during the use of this technology. If users enjoy their learning experience on TikTok, they are more likely to continue using the platform for educational purposes. For example, if a user finds a TikTok video on a topic that they are interested in, they will more likely engage with the video by liking, commenting, and sharing it, as well as seeking out similar videos in the future. It is shown that young people prefer mobile communication more than other ways because they feel it is more enjoyable (
Dickinger et al., 2008). Enjoyment was found to be a predictor of behavioral intention to adopt mobile learning (
Al-Azawei & Alowayr, 2020). It was found that enjoyment affects users’ decision to accept TikTok for learning (
Rahimullah et al., 2022). In this research, therefore, the following hypothesis is proposed:
H1. Enjoyment affects users’ decision to accept TikTok for informal learning.
4.2. Security Perceptions
Perceived security refers to perceptions of users regarding the possible security threats of technology use (
Belanche-Gracia et al., 2015). According to Maqableh et al. (
Maqableh et al., 2021), it is crucial to consider security constructs in investigating technology success. Moreover,
Al-Azawei et al. (
2023) found that security perceptions were predictors of online learning actual use. This study, therefore, integrates this construct with the proposed model to understand TikTok adoption in informal learning. The rationale behind this integration is that when users perceive that their personal information and data are secure, they are more likely to trust the platform and use it for educational purposes. For example, if technology has strong security measures such as two-factor authentication and encryption, users may feel more comfortable sharing their personal information with the platform, and thus are more likely to use it for learning (
Kumar et al., 2018). Moreover, the sensitive nature of educational data may necessitate a high level of security. In earlier literature, perceived security was found to affect users’ decision to adopt technology (
Al-Azawei et al., 2023;
Kumar et al., 2018). Accordingly, the following hypothesis is proposed:
H2. Security perceptions affect users’ decision to accept TikTok for informal learning.
4.3. Popularity
In the diffusion theory, it was proposed that social systems have a significant effect on people’s decision to accept technology (
Rogers, 1995). Accordingly,
Rogers (
1995) defines social norm as an influential factor on technology adoption. Other scholars have used several different names to refer to the effect of social systems such as “social pressure”, “cultural fashion”, “social atmosphere”, and “bandwagon effects” (
Zhu & He, 2002). Looking at statistics as presented in
IraqiNews (
2023), it can be clear that TikTok becomes very popular in the Iraqi society. Hence, its popularity may affect its adoption in informal learning settings.
Popularity means that when users perceive TikTok as a popular platform for learning, they may be more likely to use it for educational purposes. In earlier literature, it was argued that popularity was the most significant determinant of SMN use (
Sun et al., 2014). As such, if a user finds that many people share or use educational content on TikTok, they will be more likely to explore the platform for the same purpose. In short, both the reality of TikTok popularity in Iraq and existing theories may confirm the need for an empirical investigation of the effect of perceived popularity on the acceptance of TikTok. Hence, the following hypothesis is suggested:
H3. Perceived popularity affects users’ decision to accept TikTok for informal learning.
4.4. Interactivity
Interactivity refers to the notion of attracting users to a particular technology. SMNs involve online interaction among users as a key feature of each social network. This interactive communication could be a one-to-one or one-to-many based on different network features (
Shipps & Phillips, 2013). In the interactivity theory, it was posited that the quality of communication can affect perceived interactivity (
Rafaeli, 1988). Interactive features that are included in each technology should motivate users towards that technology and this, in turn, may influence their decision to adopt it. Earlier studies argued that including interactive features with technology could significantly affect users’ willingness to adopt it (
Gan & Balakrishnan, 2016;
Shipps & Phillips, 2013).
Shipps and Phillips (
2013) found that perceived interactivity was a determinant of user satisfaction. Hence, when users are able to interact with the content of TikTok such as asking questions or leaving comments on a video, they may be more likely to use the platform for educational purposes. Hence, the following is assumed in this research:
H4. Interactivity affects users’ decision to accept TikTok for informal learning.
4.5. Perceived Satisfaction
Learner satisfaction is defined as the acquisition of all benefits learners aim to obtain from the learning process, as per their attitudes, behavior, and beliefs (
Wu et al., 2010). According to
Bolliger and Martindale (
2004), learner satisfaction is essential in the adoption of educational technology. Thus, perceived satisfaction is a key construct stemming from performing a learning task, where learning outcomes are derived enjoyably (
Al-Azawei & Lundqvist, 2015). Educational institutions should pay special consideration to learner satisfaction. From a commercial perspective, students are similar to customers. Thus, their learning needs should be met. From a learning point of view, students cannot learn properly if they feel that there are environmental or personal barriers preventing the achievement of their objectives. Previous research confirms that learner satisfaction is a predictor of behavioral intention (
Al-Azawei et al., 2023;
Hussein et al., 2022). Hence, this research suggests the following:
H5. Satisfaction affects users’ decision to accept TikTok for informal learning.
4.6. Information and System Quality
DeLone and McLean (
2003) suggested that information and system quality are determinants of behavioral intention. In this research, the former refers to the sufficiency and accuracy of information learners obtained from TikTok, whereas the latter means technical features of TikTok, such as interface design, reliability, stability, and efficiency. These two constructs were also confirmed as strong predictors of intention to use technology in earlier literature (
Al-Azawei et al., 2023;
Al-Adwan et al., 2022). Accordingly, we suppose the following:
H6. Information quality affects users’ decision to accept TikTok for informal learning.
H7. System quality affects users’ decision to accept TikTok for informal learning.
5. Research Methods
This research focuses on TikTok adoption as a means of informal learning technology based on the perspectives of users in Iraq.
Cater-Steel (
2004) recommends choosing an appropriate research design in information system research. Hence, a cross-sectional, survey, and quantitative research approach is adopted here because data were collected only once. This study aims to provide a clear understanding of the cause and effect relationship among different constructs, and the collected data are based on numerical values that can be used to investigate the predictability of the proposed model (
Saunders et al., 2012).
Leedy and Ormrod (
2001, p. 183) define the survey research design as “acquiring information about one or more groups of people—perhaps about their characteristics, opinions, attitudes, or previous experiences by asking them questions and tabulating their answers”. According to
Saunders et al. (
2012), surveys are significant in data collection based on the notion that researchers can focus on estimating constructs with high precision. For collecting research data, surveys are argued as an effective method according to the promise that surveys can help researchers consider estimating constructs with high precision (
Saunders et al., 2012). Furthermore, designing a questionnaire based on previous literature can help compare findings (
Brislin, 1986).
5.1. The Research Questionnaire and Data Collection
The research instrument includes clear guidance for participants to answer questions properly. It first introduced the aim of this research, clearly demonstrated that the collected data would be used for academic research only; mentioned that participants can withdraw their participation at any time, and that participation is voluntarily. The two parts of the instrument consist of general questions about respondents’ demographic information such as sex, age group, and TikTok use, whereas the other part includes thirty-six questions that are intended to measure the proposed framework constructs. However, two questions from security perceptions and perceived popularity were deleted due to their low outer loading. A Likert scale ranging from 1 for strongly disagree to 5 for strongly agree was used. All questions were adapted from previous research as shown in
Appendix A in which each construct in the proposed model was measured based on several items. However, a few changes were made based on the nature of this study.
Figure 3 shows the number of items used for each construct.
A Google form was used to collect the research data. It was distributed online via social media, using a nonprobability convenience sampling method. According to
Golzar et al. (
2022, p. 73), “convenience sampling describes the data collection process from a research population that is effortlessly reachable to the researcher”. A convenience sample is adopted because it simply encompasses individuals who are accessible to a researcher (
Pallant, 2013). Although this method may lead to bias, it is cheap and easy to implement, considering the limitations of time and resources. As mentioned in the literature, the key advantages of this technique are (1) less effort is required by researchers in the selection of respondents, (2) low cost in terms of budget and time based on convenience sampling as population is easily accessible, and (3) preparing a list of population characteristics is unrequired because only a specific part is selected (
Golzar et al., 2022). Hence, the questionnaire link was distributed to many friends via social media such as Viber and Whatsup and they were asked to share it with other friends. The homogeneity or heterogeneity of the participants cannot be exactly determined because the questionnaire was anonymized. Moreover, no specific information on participants’ work, level of study, and/or organizations or institutions that they belonged to was collected. Participants were asked to rate each factor based on a scale of 1 to 5, with 1 being “strongly disagree” and 5 being “strongly agree”. All questions were determined as mandatory to avoid receiving incomplete responses.
5.2. Data Analysis
The collected data were analyzed using several different methods. Descriptive statistics analysis included mean, standard deviation, and frequency. Pearson correlation was also measured to ensure that the multicollinearity issue was avoided. To confirm the questionnaire properties, item loading, Cronbach’s alpha, composite reliability, average variance extracted, and discernment validity were computed. To measure the cause and effect relationship among the proposed model, partial least square and two data mining techniques, namely, Support Vector Classifier and Random Forest, were implemented. Such analyses were conducted using SPSS version 16.0 and SmartPLS software version 3 as well as Python programming language version 3.11.
SEM is used in this research as it represents the most dominant approach to investigating the cause and effect association among model’s constructs (
Al-Azawei et al., 2017). Moreover, SEM is an appropriate approach for the purpose of prediction and development of theories (
Chin, 1998). Finally, according to
Tobias (
1995), this technique is appropriate in determining responses’ behavior (constructs) from the identified variables (independent factors). On the other hand, Support Vector Classifier and Random Forest are widely adopted data mining techniques due to their power in the prediction and classification contexts (
Alamri et al., 2020). Support Vector Classifier maximizes the distance that separates the elements of two labels that the elements belong to. When a set of data is used to compute the boundary limit among labels, this is known as the training set, whereas the set of data that is used to test the technique’s performance is called the validation set. Random Forest is based on the Decision Tree technique as it represents a group of several tree predictors. Specifically, each tree relies independently on values of a vector with the same distribution over all trees in a particular forest (
AhmedK et al., 2013).
7. Discussion
The overall outcomes of this research based on the structural equation modeling suggested that users’ enjoyment, security perceptions, interactivity, and perceived satisfaction were predictors of user intention, supporting hypotheses H1, H2, H4, and H5. However, the association among perceived popularity, information quality, and system quality with behavioral intention was not confirmed, rejecting hypotheses H3, H6, and H7.
Pertaining to H1 that suggested a relationship between enjoyment and user intention, the results showed that this construct had the highest influence on TikTok adoption. In fact, this outcome is consistent with earlier research (
Al-Azawei & Alowayr, 2020;
Arain et al., 2019), confirming the importance of enjoyment in technology use. As such, considering strategies that could motivate learners to use different learning technologies is crucial to ensure that they use such technologies with fun and enjoyment. Security concerns were also a predictor of behavioral intention (H2), supporting the findings of previous literature (
Al-Azawei et al., 2023;
Farooq et al., 2020). This means that even though learners voluntarily use informal learning technologies, they seek platforms that hide their personal information from unauthorized parties. Moreover, guaranteeing that learning content or personal information will not be modified without a user is also a concern of learners. Such technologies should also be free of errors or technical issues that prevent their effective use. This result confirms the conclusion of
Maqableh et al. (
2021) that security concerns should be considered in the investigation of technology acceptance.
Another significant predictor of user intentional behavior was interactivity as proposed in H4. It is obvious that SMNs include several different features that match the principles of the interactivity theory such as one-to-one or one-to-many communication. It was found in this research that such interactive features had an influence on users’ willingness to adopt TikTok, confirming the findings of previous research (
Gan & Balakrishnan, 2016;
Shipps & Phillips, 2013). Thus, high interactive features of TikTok such as leaving comments on particular learning content or asking a question on a video showed a high influence on its adoption as an informal learning technology. As confirmed in other studies (
Al-Azawei et al., 2023), satisfaction was a determinant of behavioral intention. Users’ satisfaction covers their beliefs that particular technology could respond to their individual preferences (
Dong et al., 2014).
DeLone and McLean (
2003) also assumed an association between perceived satisfaction and behavioral intention as found in this present research. Hence, to ensure that users will use a particular informal learning technology, their individual needs and preferences should be met. This can be achieved by, for example, personalizing learning content or videos on an SMN platform based on their individual search.
Three hypotheses were rejected in this research. The assumption that there was a relationship between perceived popularity and behavioral intention (H3) was not supported. Although the diffusion theory suggested that social systems can influence users’ decision to adopt technology (
Rogers, 1995), this was not the case in all contexts. Previous research also found that social norm was not a predictor of mobile-learning adoption in Iraq (
Al-Azawei & Alowayr, 2020). This may indicate that Iraqi people do not build their decision to accept technology according to other preferences. They may use particular technology based on its features that meet their needs and this, in turn, leads to its popularity. Moreover, both information and system quality were not determinants of user intention to adopt TikTok. This means that other features of TikTok had a high influence on its adoption such as enjoyment, security concerns, and interactivity as confirmed in this research. In agreement with this research findings,
Jahan et al. (
2024) also adopted the D&M-ISS model to examine the adoption of SMNs. The significant influence of information and service quality on social media acceptance was not confirmed. Thus, although D&M ISS had attracted great attention in information system success research, the effect of its original constructs may decrease due to the influence of other factors on technology adoption.
Rahimullah et al. (
2022) suggested that information and system qualities were determinants of learners’ satisfaction when using TikTok in higher education. This may also support the findings of this present study that both factors had a low effect on behavioral intention.
The research adds key theoretical and practical implications. The former includes the proposal of a modified framework that explains the high variance of TikTok adoption. This study also suggests that in informal learning contexts, enjoyment, security, interactivity, and satisfaction constructs had more effect on technology use than information or system quality. This is because learners use such technologies voluntarily, so they want to have fun and pleasure while using them. The overall findings of structural equation modeling and machine learning techniques are consistent. This supports the practical implications of this research. The former explains about 83% of the variance of behavioral intention, whereas the accuracy outcome of the latter was between 70% and 77%. Support Vector Classifier outperforms Random Forest in both cases before and after weighting the features. This lower performance of machine learning techniques may be attributed to the small dataset used in this research. Another possible reason is the use of a low number of features in the prediction process. However, based on such outcomes, machine learning techniques can also be applied effectively with such a small dataset with no concern of overfitting as their explained accuracy was in line with the findings of structural equation modeling. According to the research findings, the following recommendations are made:
Integrating SMNs as an informal leaning means is becoming important in contemporary education. This is because young people have a greater tendency to use such technologies due to their interactive and enjoyable elements.
SMNs can also be included alongside traditional learning approaches to enhance learning experience.
Teachers and/or lecturers in formal learning settings should be eager to integrate informal learning methods as this may lead to improving learners’ satisfaction and meeting their own needs.
People may tend to use SMNs as an informal learning means based on their included features rather than considering their popularity and widespread use.
8. Conclusions
Based on the assumptions of different theories on technology diffusion and adoption, this research proposed a framework to identify constructs that may affect TikTok adoption as an informal learning platform among Iraqi users. The proposed model integrated the D&M-ISS model with the diffusion theory, the interactivity theory, the intrinsic motivation theory, and the security perceptions. Two prediction techniques were adopted to examine the cause and effect association among the proposed model constructs. These were partial least square and data mining techniques in which their findings suggested that the proposed model can explain from 70% to 83% of TikTok adoption. Based on the overall findings, several conclusions can be drawn, as outlined below:
TikTok represents a supportive platform in teaching and learning.
The interactive features included with this technology play a significant role in its widespread use and adoption.
The high influence of both satisfaction and enjoyment on TikTok adoption could mean that any technology will not be adopted without responding to users’ own needs and providing several different features that make its use fun and enjoyable.
The successful use of a platform highly depends on ensuring that its services are secure.
Although data mining techniques are more appropriate with large datasets, these research findings suggest that such techniques can also be used successfully with small datasets.
Regardless of the significant findings of this research, it is not without its limitations that should be addressed in future research. First, the research instrument was distributed online via a Google form, which might affect the overall understanding of some questions that may need explanation. However, this issue was avoided as much as possible by ensuring clarity of questions. Second, the sample size cannot reflect the whole sample of Iraqi users. Hence, recruiting more participants and from different disciplines is necessary. This can also help in avoiding the overfitting issue in data mining techniques. Third, learners’ perceptions were measured once only, whereas collecting their opinions in two periods can better reflect their perceptions. Finally, the average performance of data mining techniques could be attributed to the low number of features used to predict the class label. Therefore, integrating other constructs with the proposed framework may help explain the unpredicted ratio.


