Article

Modeling the Factors That Determine Sustainable Development Goal 12 in University Students

by
Monica Martinez Gomez
1,
Ma Angeles Alcaide Gonzalez
2 and
Elena de la Poza Plaza
3,*
1
Department of Statistics, Applied Operational Research and Quality (DEIOAC), Universitat Politècnica de València, 46022 Valencia, Spain
2
Department of Accounting, Universitat de València, 46022 Valencia, Spain
3
Research Centre for Economics Engineering, (INECO), Universitat Politècnica de València, 46022 Valencia, Spain
*
Author to whom correspondence should be addressed.
Educ. Sci. 2025, 15(3), 325; https://doi.org/10.3390/educsci15030325
Submission received: 14 December 2024 / Revised: 14 February 2025 / Accepted: 27 February 2025 / Published: 5 March 2025

Abstract

:
SDG12 is one of the top three Sustainable Development Goals that require more urgent action. Hence, this work aims to develop and validate a conceptual model that measures the main factors which may influence university students’ sustainable consumption and to determine to what extent each one influences Sustainable Consumption Behavior. Partial Least Squares modeling is used to develop and validate the proposed model. The results indicate that Sustainable Consumption Behavior is determined by Environmental Education and Information, Green Purchase and Sustainable Consumption Habits. Identifying what motivates people to adopt this form of behavior is extremely helpful for designing relevant strategies that specifically aim to stimulate positive responses concerning the environment, economy and society.

1. Introduction

Today’s society is immersed in a consumerist environment dominated by a market full of disposable products wrapped in plastic and other polluting materials. In recent decades, a capitalist culture has been created that encourages us to buy beyond our needs, which has triggered a series of environmental problems. These problems have been analyzed for several years, and attempts have been made to find solutions to stop our planet’s degradation. Notwithstanding, climate change continues to affect our lives.
Beginning in the 1970s, concern began growing about the environment, nature, and pollution and its impact on climate change. As a result, in September 2015, the United Nations Assembly approved Agenda 2030 for Sustainable Development, which establishes a transformative vision toward economic, social and environmental sustainability and is the reference guide for the international community’s work. Agenda 2030 is an action plan for people and the planet. It includes 17 Sustainable Development Goals (SDGs) and 169 specific goals, developed on the basis of Millennium Development Goals (MDGs) in 2000 (United Nations, 2015; Sachs, 2012), to be achieved before 2030 that will transform our society into one of responsible living. These objectives range from social problems, such as poverty and change in education or gender equality, to technological problems. They are grouped into five action areas: people (SDGs 1–5); planet (SDGs 6, 12, 13, 14, 15); prosperity (SDGs 7–11); peace (SDG 16); partnerships (SDG 17). According to (D’Amato et al., 2019; Hajer et al., 2015), this agenda represents a guide for action for all social actors, from governments to the private sector, and involves all stakeholders making joint efforts to effectively meet the SDGs.
This study is based on SDG12, which aims to “ensure responsible consumption and production”. This means that it intends to instill in companies the ethics of manufacturing products with minimal environmental impact and, in consumers, awareness of demanding such products and rejecting those produced with harmful materials and/or achieved through processes with a high carbon footprint or under conditions that do not respect human rights. Thus, SDG12 aims to guarantee sustainable consumption and production patterns. Its raison d’être is part of the need to stop the environmental degradation that has been destroying our planet in the last century.
As this sustainable objective concerns society as a whole, the measures to be taken to meet it must consider all population segments because all citizens are consumers and are, at the same time, an important part of production processes. However, consumers’ behavior could vary according to their demographic, economic and social characteristics, etc. This suggests that the design of measures must take these differences into account to guarantee their success. However, the literature review shows that there is no conceptual model to allow the factors that influence consumers’ decision-making processes and, in turn, consumers’ or households’ degree of awareness, to be measured. This means that public administrations’ efforts are limited to awareness campaigns that address all citizens in an attempt to promote waste recycling and discourage consuming products manufactured with nonrecyclable materials or involving workers’ undignified conditions, and these measures’ success has been of little relevance.
In this context, university higher education institutions can, and should, play a fundamental role in meeting SDGs on the whole, especially universities of a technological nature with SDG12 because their teaching, research and transfer activity can focus on the development of techniques, models and competences that guarantee efficient resources use and minimized waste.
In fact, as stated by Martínez-Acosta et al. (2023), SDG12 is one of the first goals whose number of mentions in publications in indexed journals have increased the most since 2018 (42.8%) in parallel to SDG7 (44.4%), SDG13 (41.5%) and SDG11 (40.5%). According to Frank et al. (2020), however, in 2020, SDG12 was one of the top three SDGs which required more urgent action in academia, administration and policy, industry and civil society.
Although SDG12 is one of the most understood and relevant ones in daily life, it ranks as one of the least popular for students in academic contexts globally and is, thus, one of the least achieved (Tedeneke, 2019; Fischer et al., 2017). Young consumers are particularly significant for researchers, policymakers and educators in the sustainable consumption field because this group’s purchasing power is rapidly growing and, in turn, increases the potential for positive sustainability impacts through their consumption choices (Fischer et al., 2017).
Young consumers, as digital natives in a globalized world, share similar conditioning across cultures, nationalities and ethnicities. However, their consumption-related behaviors are also shaped by distinct cultural, historical and individual contexts (Eagles & Demare, 1999). Childhood environments in connection to place attachment, identity and dependence, as well as cultural and environmental experiences, form the basis for environmental relations (Eagles & Demare, 1999; Chawla, 2007). Also, Yli-Panula et al. (2020) assess how teachers can determine crucial information about students’ interests and environmental values. This body of literature provides the framework for the empirical study.
Hence, the purpose of this work is to develop and validate a model that analyzes the main factors that may influence university students’ sustainable consumption. The identification of the most relevant factors will allow teaching methodologies to be designed that educate our university students on responsible, efficient consumption and waste minimization that, in this way, will bring about a change in new generations’ habits and mindsets and promote research, innovation and knowledge transfer to industries in the form of more sustainable production techniques.
In summary, the aims of this paper are to (1) determine a conceptual model to measure the main factors that may influence university students’ sustainable consumption; (2) establish to what extent each one influences Sustainable Consumption Behavior; (3) validate the proposed model using Partial Least Square (PLS-SEM) (Wetzels et al., 2009).
The rest of the paper is structured as follows. Section 2 introduces the methodological framework. Section 3 presents the methodology herein followed and describes the sample used in the analysis. Section 4 provides the main results. Finally, Section 5 concludes and sets out the limitations of this paper.

2. Framework

People’s lifestyle determines not only their relationship with the environment, but also their consumption responsibility. It is specifically influenced by the way of thinking, the social environment and daily habits. More and more people are interested in living a sustainable way of life, as evidenced during all awareness campaigns, and also in the entire supply and demand for sustainable products, such as food, clothing, electronics and any product originally made with plastics. This includes fighting planned obsolescence, which is the characteristic of products’ life cycles ending when manufacturers want them to and the tendency to promote circular economy. Durability used to be an essential characteristic of any product, but companies’ need to sell has led this same durability to become a disadvantage. This is because a product generates interest and sells well if it is not easily destroyed. However, the time will come when there will no longer be the need to buy that product. This is why products have begun to be manufactured in a way that renders them less durable and they have a deliberate shelf life (Leiva-Brondo et al., 2022).
Although they have made our lives easier in many ways, these are advances that consume the planet’s natural resources very quickly and endanger our future development. The costs we consequently suffer are accelerated climate change, reductions in green spaces and aquatic areas, and corrosion of fertile areas. Another influence of this is the disproportionate advance of some countries compared to others, which translates into the overexploitation of less developed ones.
There are various theories, models and frameworks that help us to understand green consumer behavior by emphasizing the hierarchy of values, attitudes/norms, intentions and behaviors. These include the Theory of Planned Behavior (TPB) (Ajzen, 1985, 1991), the Theory of Reasoned Action (TRA) (Fishbein & Ajzen, 1975) and models of Ecologically Conscious Consumer Behavior (ECCB) (Ajzen, 1985). Nonetheless, they may be more useful to researchers who seek to explain green behavior by considering other factors, value-driven beliefs and norms.
As such, people’s lifestyles shape their habits and behaviors in resource consumption and waste generation terms. These are considered major contributors to environmental impacts, especially greenhouse gas emissions (GG), ozone layer depletion and the production of acidifying substances (Straughan & Roberts, 1999). In this context, the challenge is to change our ways of thinking, feeling and acting to ultimately transform society as a whole. This would imply favoring sustainable development scenarios, such as shifting consumer lifestyles, reducing excessive consumption and reconsidering the value of accumulation. Re-evaluating economies based on quality of development, rather than on growth rates, would also be essential.
Empirical studies have revealed encouraging data on the existence of such behaviors. For instance, there are consumers who demand more information about sustainable products, their origin and supply chain; care about the environmental and social impacts of their consumption; respond to the influence of reference groups and purchase eco-friendly products; are even willing to pay a premium for sustainable options (Caeiro et al., 2012). Similarly, there is growing awareness of environmental protection by encompassing sustainable practices and consumption (Shao et al., 2017). All these actions indicate a shift toward sustainable lifestyles.
This is why the importance of SDG12 is prioritized in this work by providing data that reveal the importance of responsible consumption, which we attempt to promote to meet the 17 objectives established in Agenda 2030.
Although it is true that different goals and indicators in Agenda 2030 have been established that contribute to measuring the degree of their achievement, there is still a wide gap when it comes to evaluating the contribution of households or individual consumers. The closest approximation that can be found is in indicator 12.5.1: “National recycling rate, in tons of recycled material, of Goal 12.5. By 2030, significantly reducing waste generation through prevention, reduction recycling and reuse activities”. However, relevant information is missing in the calculation of this indicator and it does not take into account the different factors that may affect it. Although various actions have begun to be taken to ensure sustainable consumption, the gap is still wide, hence the purpose of this research.
In this context, this article aims to define how certain social factors contribute to sustainable consumption by generating a model that explains Sustainable Consumption Behaviors of university students in the Valencian Community, which stands out in Spain for the number of centers of university educational excellence and the number of university students. To provide a global applicable definition to the different methodologies for measuring SGD 12, various theories and acceptance models have been consulted, but we focus mainly on (Figueroa-García et al., 2018; Tabernero et al., 2015; Kowalska et al., 2021; Do Paco et al., 2019). The social factors presented as exogenous variables that form the foundation of this theoretical model include environmental influences, education and information, government action, social pressure and market conditions.
The constructs taken from those models are the following:
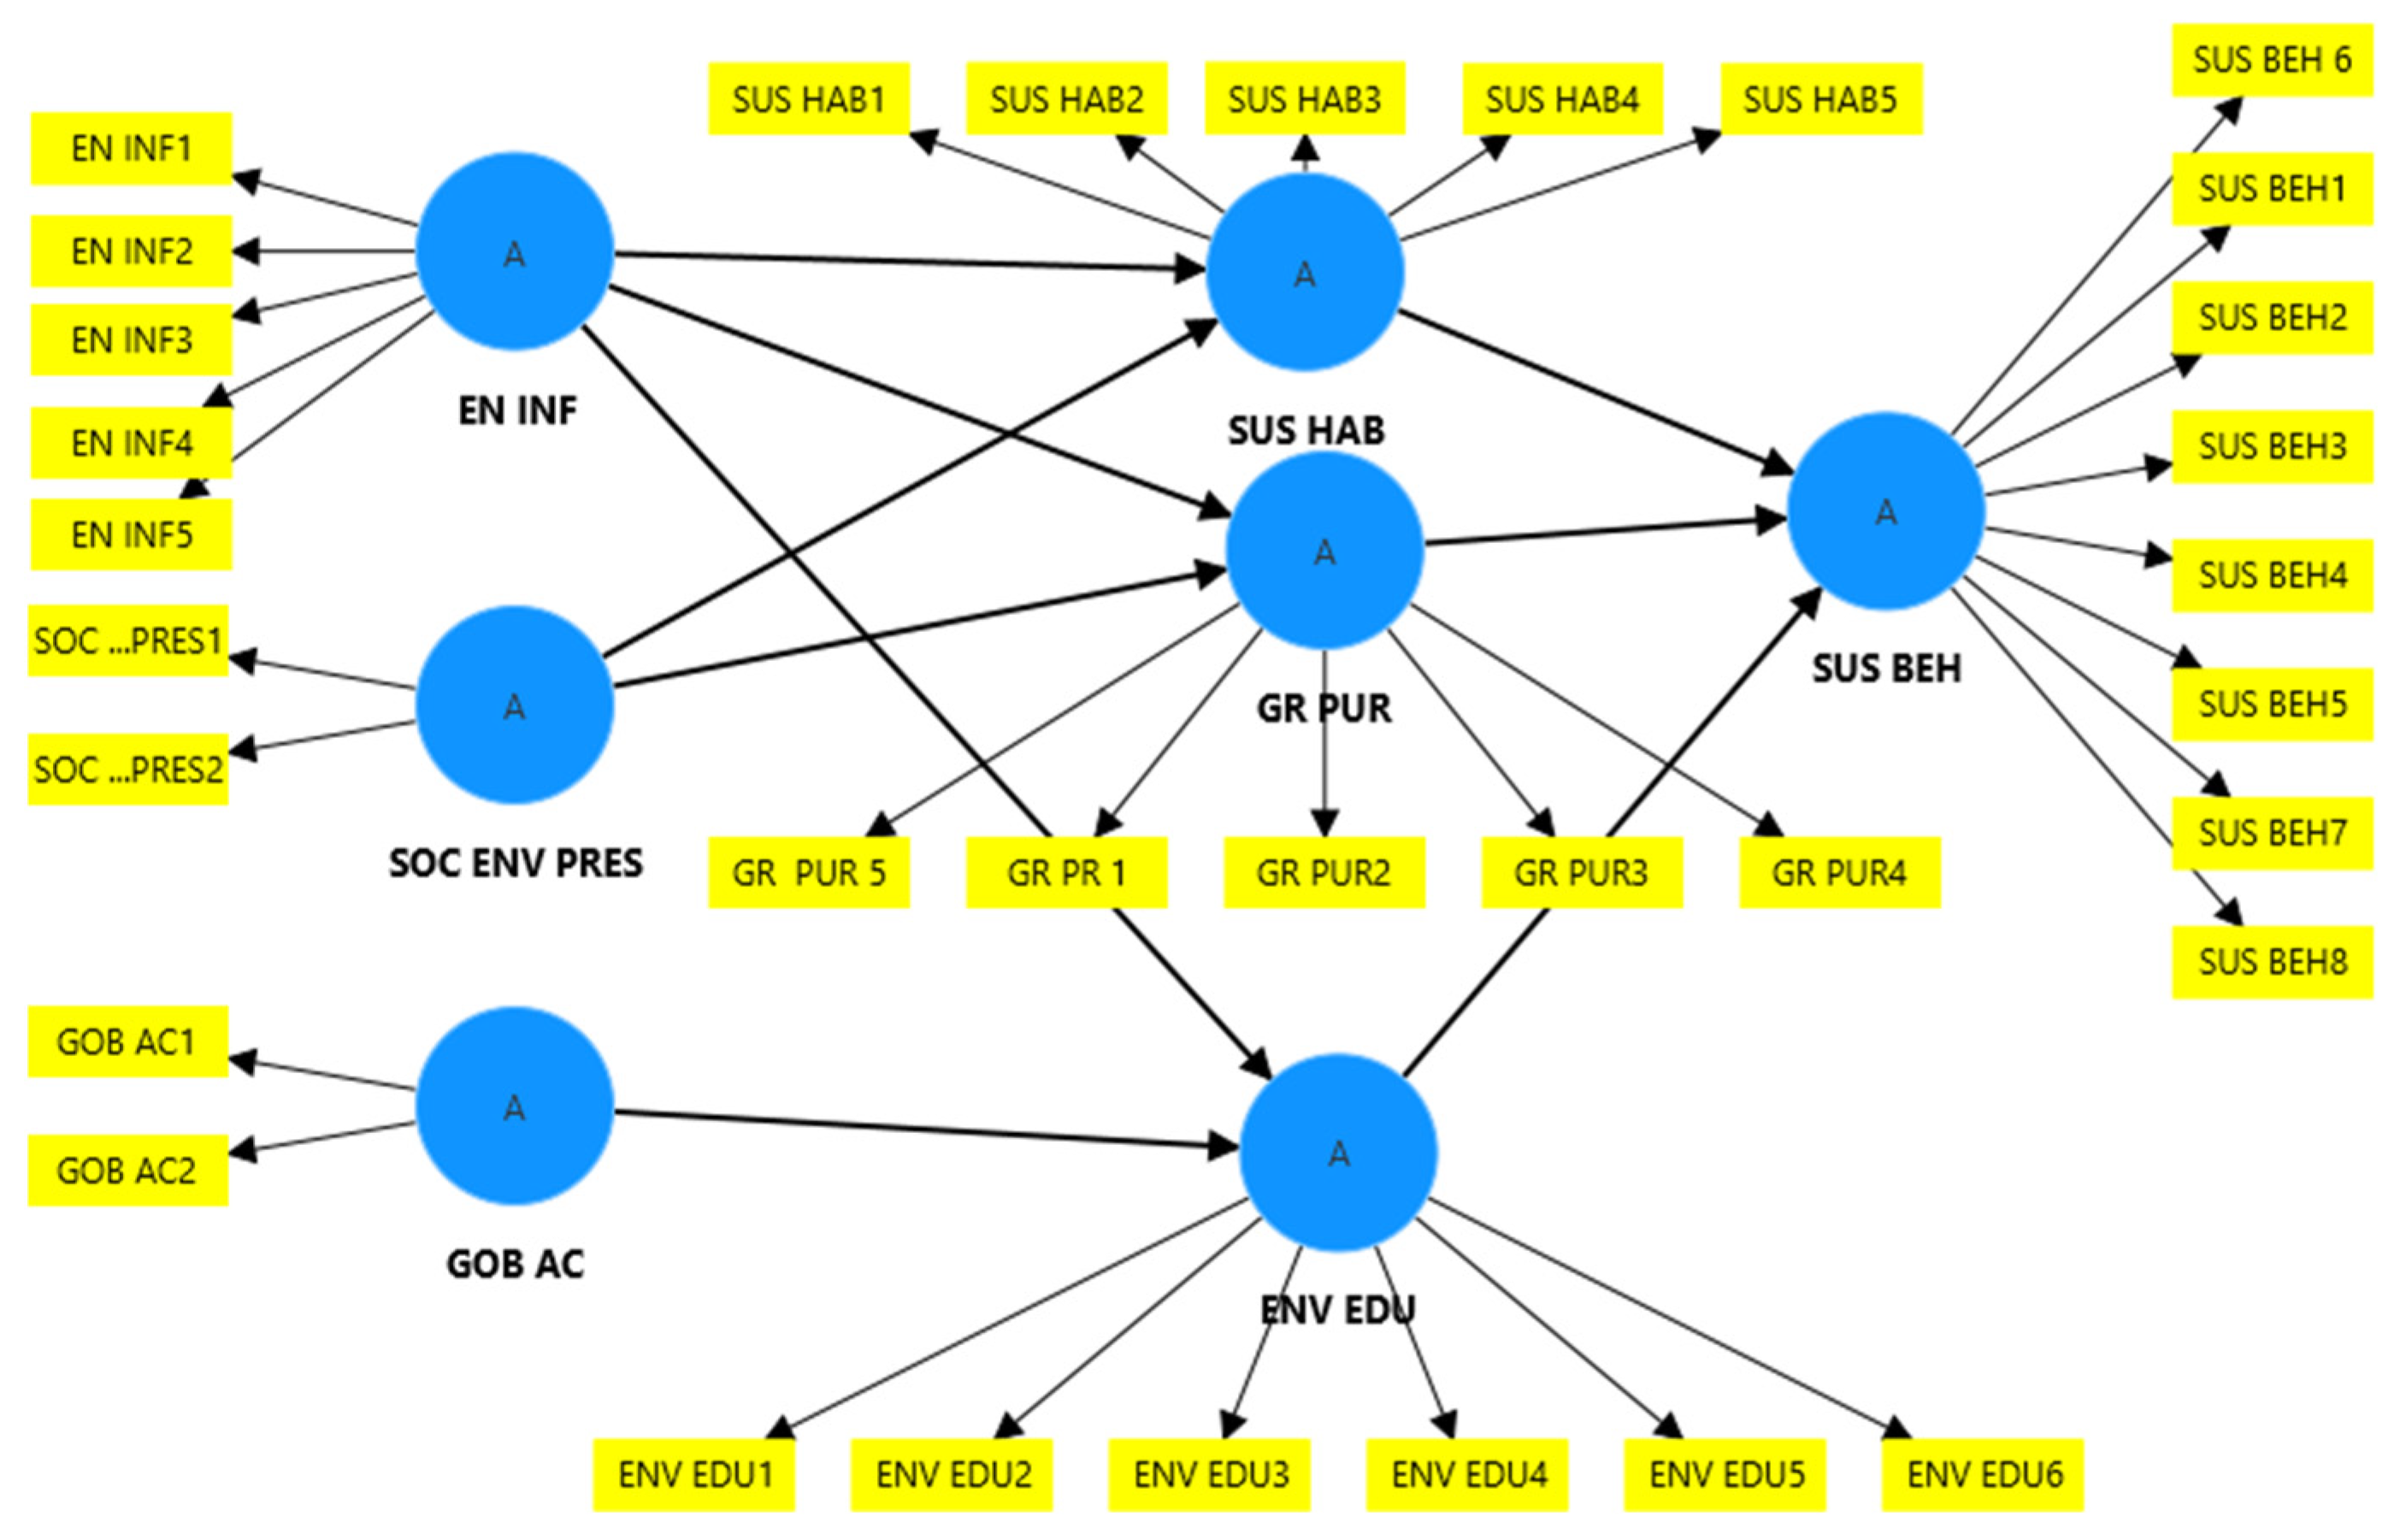
  • Sustainable Consumption Behavior (SUS BEH) refers to the responsible use of goods and services to minimize environmental impact and ensure the conservation of natural resources for current and future generations.
  • Sustainable Consumption Habits (SUS HAB) refer to the practices individuals can adopt to lead more sustainable lifestyles and positively impact society. This includes actions such as consuming less, selecting products with lower environmental impacts and reducing the carbon footprint associated with everyday activities.
  • Green Purchasing (GR PURCH) refers to the practice of buying products and services that have a lower impact on human health and the environment compared to similar options. For a purchase to be considered green, it must meet specific criteria that demonstrate a reduced environmental footprint. This concept is related to consumer trends and habits, such as a growing preference for organic products over conventional ones.
  • Environmental Education and Information (ENV EDU) empowers individuals to explore environmental issues, engage in problem-solving, and take action to improve the environment. This process promotes a deeper understanding of environmental challenges and helps develop the skills necessary for making informed and responsible decisions. Key topics include awareness and sensitivity to environmental challenges, knowledge and understanding of environmental issues, attitudes that reflect concern for the environment, and motivation to enhance or preserve the environment.
  • Environmental Influence (ENV INF) refers to various conditions in the surrounding environment, as well as structures and external sources such as friends, family, communities, and social or technological factors that can affect individual development.
  • Social Environmental Pressure (SOC PR) refers to the different conditions or groups that can influence individual development by applying various forms of pressure. Cultural and social norms also establish expectations for how individuals should behave in different contexts. Additionally, media and social networks can exert significant pressure by setting behavioral standards related to the environment.
  • Government Action (GOB AC) includes initiatives by local authorities aimed at fostering environmental stewardship among community members. These efforts seek to inspire community members to actively participate in the care of our shared environment.
Implementing this type of study enables relevant policies and actions to be designed whose aim is to promote this behavior both nationally and internationally (Tabernero et al., 2015).
This model is tested by Partial Least Squares Structural Equation Modeling (PLS-SEM) using the SmartPLS statistical software, version 4.1.0.9. Subsequently, this article details the employed materials and methods, including sample definition, data collection, the theoretical model estimation that defines the working hypotheses and the description of the PLS analysis. The results cover the assessment of the measurement and structural models, hypothesis testing and the model’s goodness-of-fit evaluation. Finally, the discussion and conclusions are presented.

3. Materials and Methods

3.1. Aim and Participants
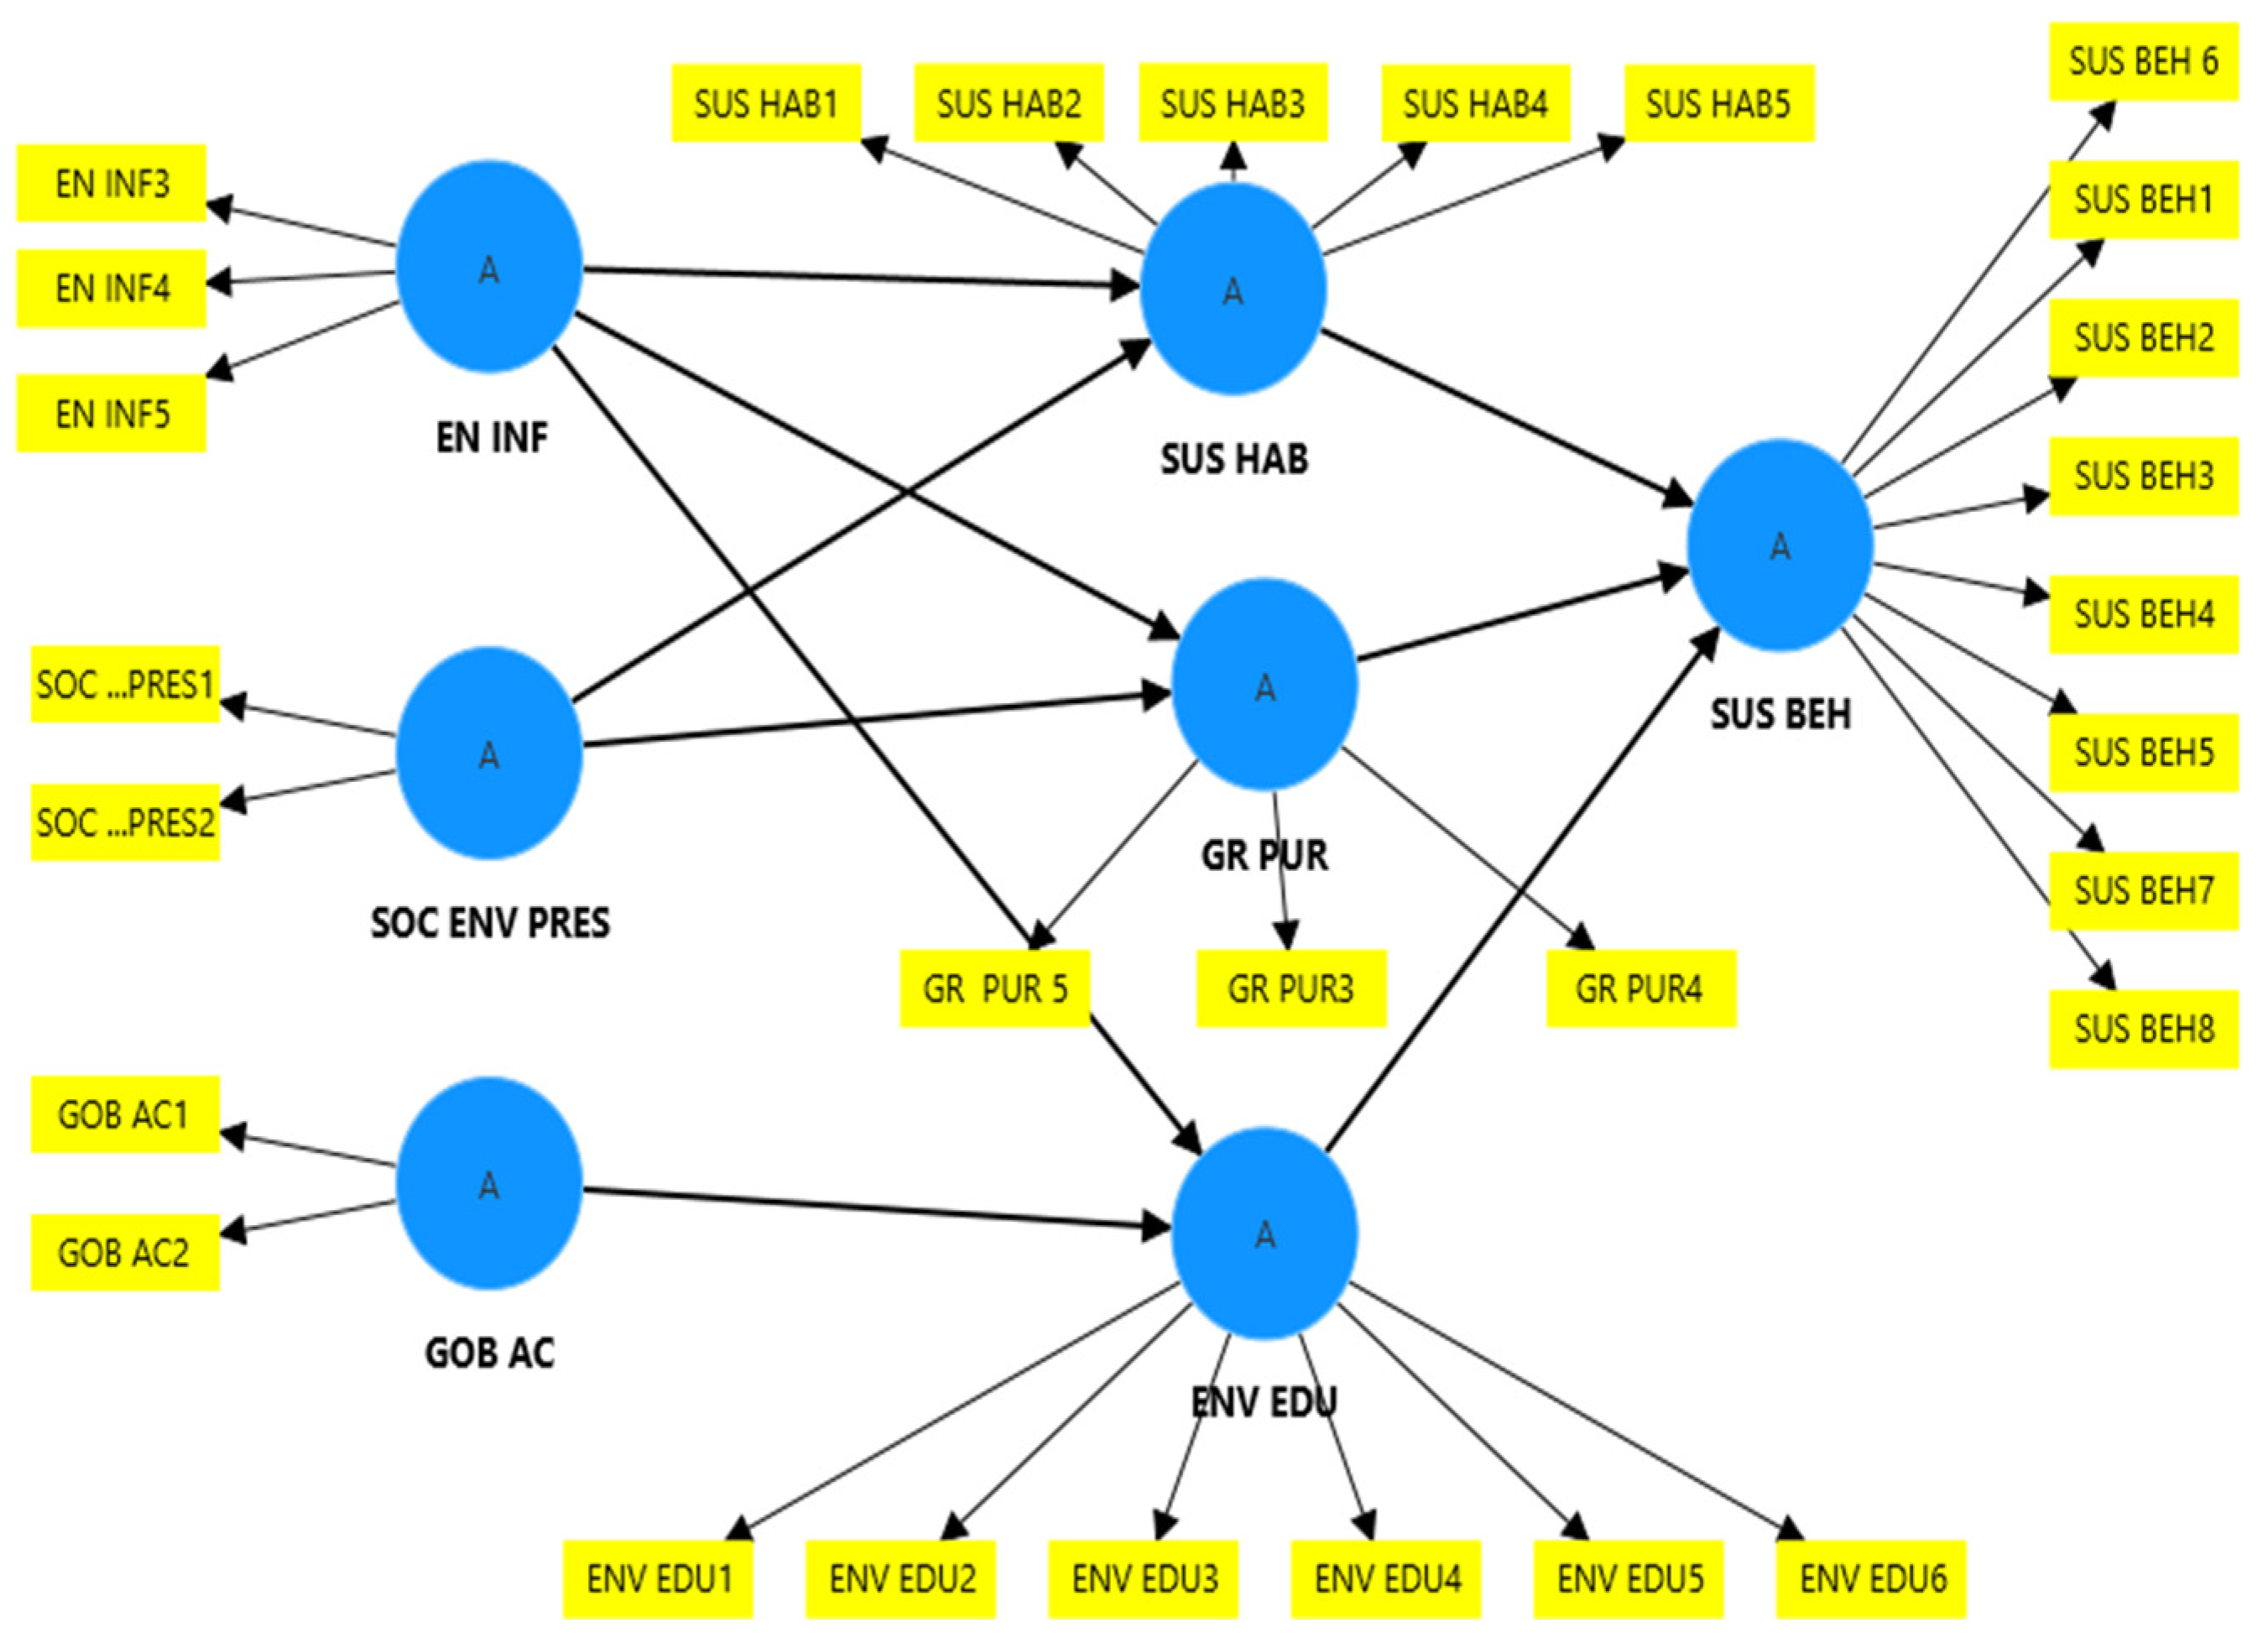
A sample of 196 university students of technical and technological degrees (bachelor’s and master’s degrees) of the Universitat Politécnica of Valéncia (UPV), Spain, aged between 18 and 35 years, participated in the study. Sample distribution is shown in Table 1.
For the study, a questionnaire was designed and distributed online. The questions or items included in it were obtained from other already-validated instruments (Figueroa-García et al., 2018; Kowalska et al., 2021) in the field of measuring sustainable consumption habits and their influence on the social environment. It includes 33 Likert-type scale questions, where the lowest value, 1, represents “I do not agree at all” and the highest, 5, represents “I totally agree”, and there are three socio-demographic questions. Questions were grouped into eight sections (see Table 2).

3.2. Research Model

Figure 1 illustrates the initial theoretical model, where latent variables (represented in blue) and their respective indicators (in yellow) are identified. This model was constructed based on a literature review to understand how external factors influence sustainable individual behavior. Table 1 summarizes the selected manifest variables (indicators) and latent variables (constructs) used to formulate the proposed initial model, as depicted in Figure 1.
The formulation of the hypotheses in Section 3.3 is directly derived from this structural model, ensuring a clear alignment between theoretical variables and the expected relationships:
  • Government Action and Environmental Education (H1-a, RQ1)
The latent variable GOB AC (Government Action) has a direct relationship with ENV EDU (Environmental Education and Information), reflecting the role of governmental policies and regulations in promoting environmental education.
This relationship justifies the hypothesis that government action positively influences environmental education and access to environmental information.
2.
Social Environmental Pressure and Sustainable Behavior (H2-a, H2-b, RQ2, RQ3)
The variable SOC ENV PRES (Social Environmental Pressure) influences GR PUR (Green Purchase) and SUS HAB (Sustainable Consumption Habits), suggesting that social environmental pressure can motivate the adoption of sustainable habits and green purchasing decisions.
These relationships explain H2-a and H2-b, which state that Social Environmental Pressure correlates positively with Green Purchase and Sustainable Consumption Habits.
3.
Environmental Influence and Sustainable Habits (H3-a, H3-b, H3-c, RQ4, RQ5, RQ6)
EN INF (Environmental Influence) is related to SUS HAB (Sustainable Habits), GR PUR (Green Purchase) and ENV EDU (Environmental Education).
These connections justify hypotheses H3-a, H3-b and H3-c, demonstrating that environmental influence drives both environmental education and sustainable consumption actions.
4.
Environmental Education and Sustainable Behavior (H4, RQ7)
ENV EDU (Environmental Education and Information) is linked to SUS BEH (Sustainable Behavior), supporting hypothesis H4, which states that environmental education has a positive impact on sustainable behavior.
5.
Sustainable Habits and Sustainable Behavior (H5, RQ8)
SUS HAB (Sustainable Habits) influences SUS BEH (Sustainable Behavior), validating the hypothesis that sustainable habits promote overall sustainable behavior.
6.
Green Purchase and Sustainable Behavior (H6, RQ9)
GR PUR (Green Purchase) has a direct relationship with SUS BEH (Sustainable Behavior), reinforcing the hypothesis that green purchasing decisions impact overall sustainable behavior.

3.3. Research Hypothesis

The inclusion of constructs and the relations between them in establishing the model is grounded in prior knowledge, research and relevant studies about motivators of Sustainable Consumption Behavior. Governments’ role as either motivators for or constraints of this behavior, through the presence or absence of necessary conditions for pro-environmental actions, has been previously established (see, for example, Do Paco et al., 2019; Kollmuss & Agyeman, 2002; Steg & Gifford, 2005; Corral-Verdugo, 2012; Chen & Tung, 2010). Likewise, poorly enforcing existing regulations has been shown to have a more detrimental effect than not having regulations altogether (Vicente-Molina et al., 2013). Hence, we put forward the following hypotheses to corroborate a possible correlation:
-
RQ1 (H1-a). Government Action correlates positively with Environment Education and Information.
Social pressure that results from the norms that form in community life can serve as a persuasive force in various aspects, from group dynamics to individual behavior (Tabernero et al., 2015). This often leads to behavior shaped by the desire to comply with these established norms, beginning with personal values and subsequently influenced by expectations imposed by reference groups, especially when individuals seek membership in these groups (Salgado Beltrán & Bravo Díaz, 2015). In this context, we can assume the following:
-
RQ2 (H2-a). Social environmental pressure correlates positively with Green Purchase.
-
RQ3 (H2-b). Social environmental pressure correlates positively with Sustainable Consumption Habits.
Influences that stem from the social environment may arise from friends, family and other social groups, and can shape consumer attitudes toward this context (Salgado Beltrán & Bravo Díaz, 2015). The hypotheses are, therefore, as follows:
-
RQ4 (H3-a). Environmental Influence correlates positively with Sustainable Consumption Habits.
-
RQ5 (H3-b). Environmental Influence correlates positively with Green Purchase.
-
RQ6 (H3-a). Environmental Influence correlates positively with Environmental Education and Information.
On Education and Information and Sustainable Habits, some studies indicate a lack of clarity concerning the type of relation established between this variable and Sustainable Consumption Behavior. It is also widely believed that both formal and informal education, along with the availability of information on the topic, significantly influence consumer purchasing decisions (Vicente-Molina et al., 2013). Hence, we formulate the following hypotheses:
-
RQ 7 (H4). Environmental Education and Information influence Sustainable Behavior.
-
RQ 8 (H5). Sustainable Habits correlate positively with Sustainable Behavior.
Market conditions for sustainable products and services also demonstrate contradictory behavior (Salgado Beltrán & Bravo Díaz, 2015; Gleim et al., 2013). When making green purchasing decisions, it is important how individuals perceive the efficiency of products on this market and the factors that influence the costs of substituting one product for another (Shao et al., 2017). This leads to the following hypothesis:
-
RQ 9 (H6). Green Purchase influences Sustainable Consumption Behavior.

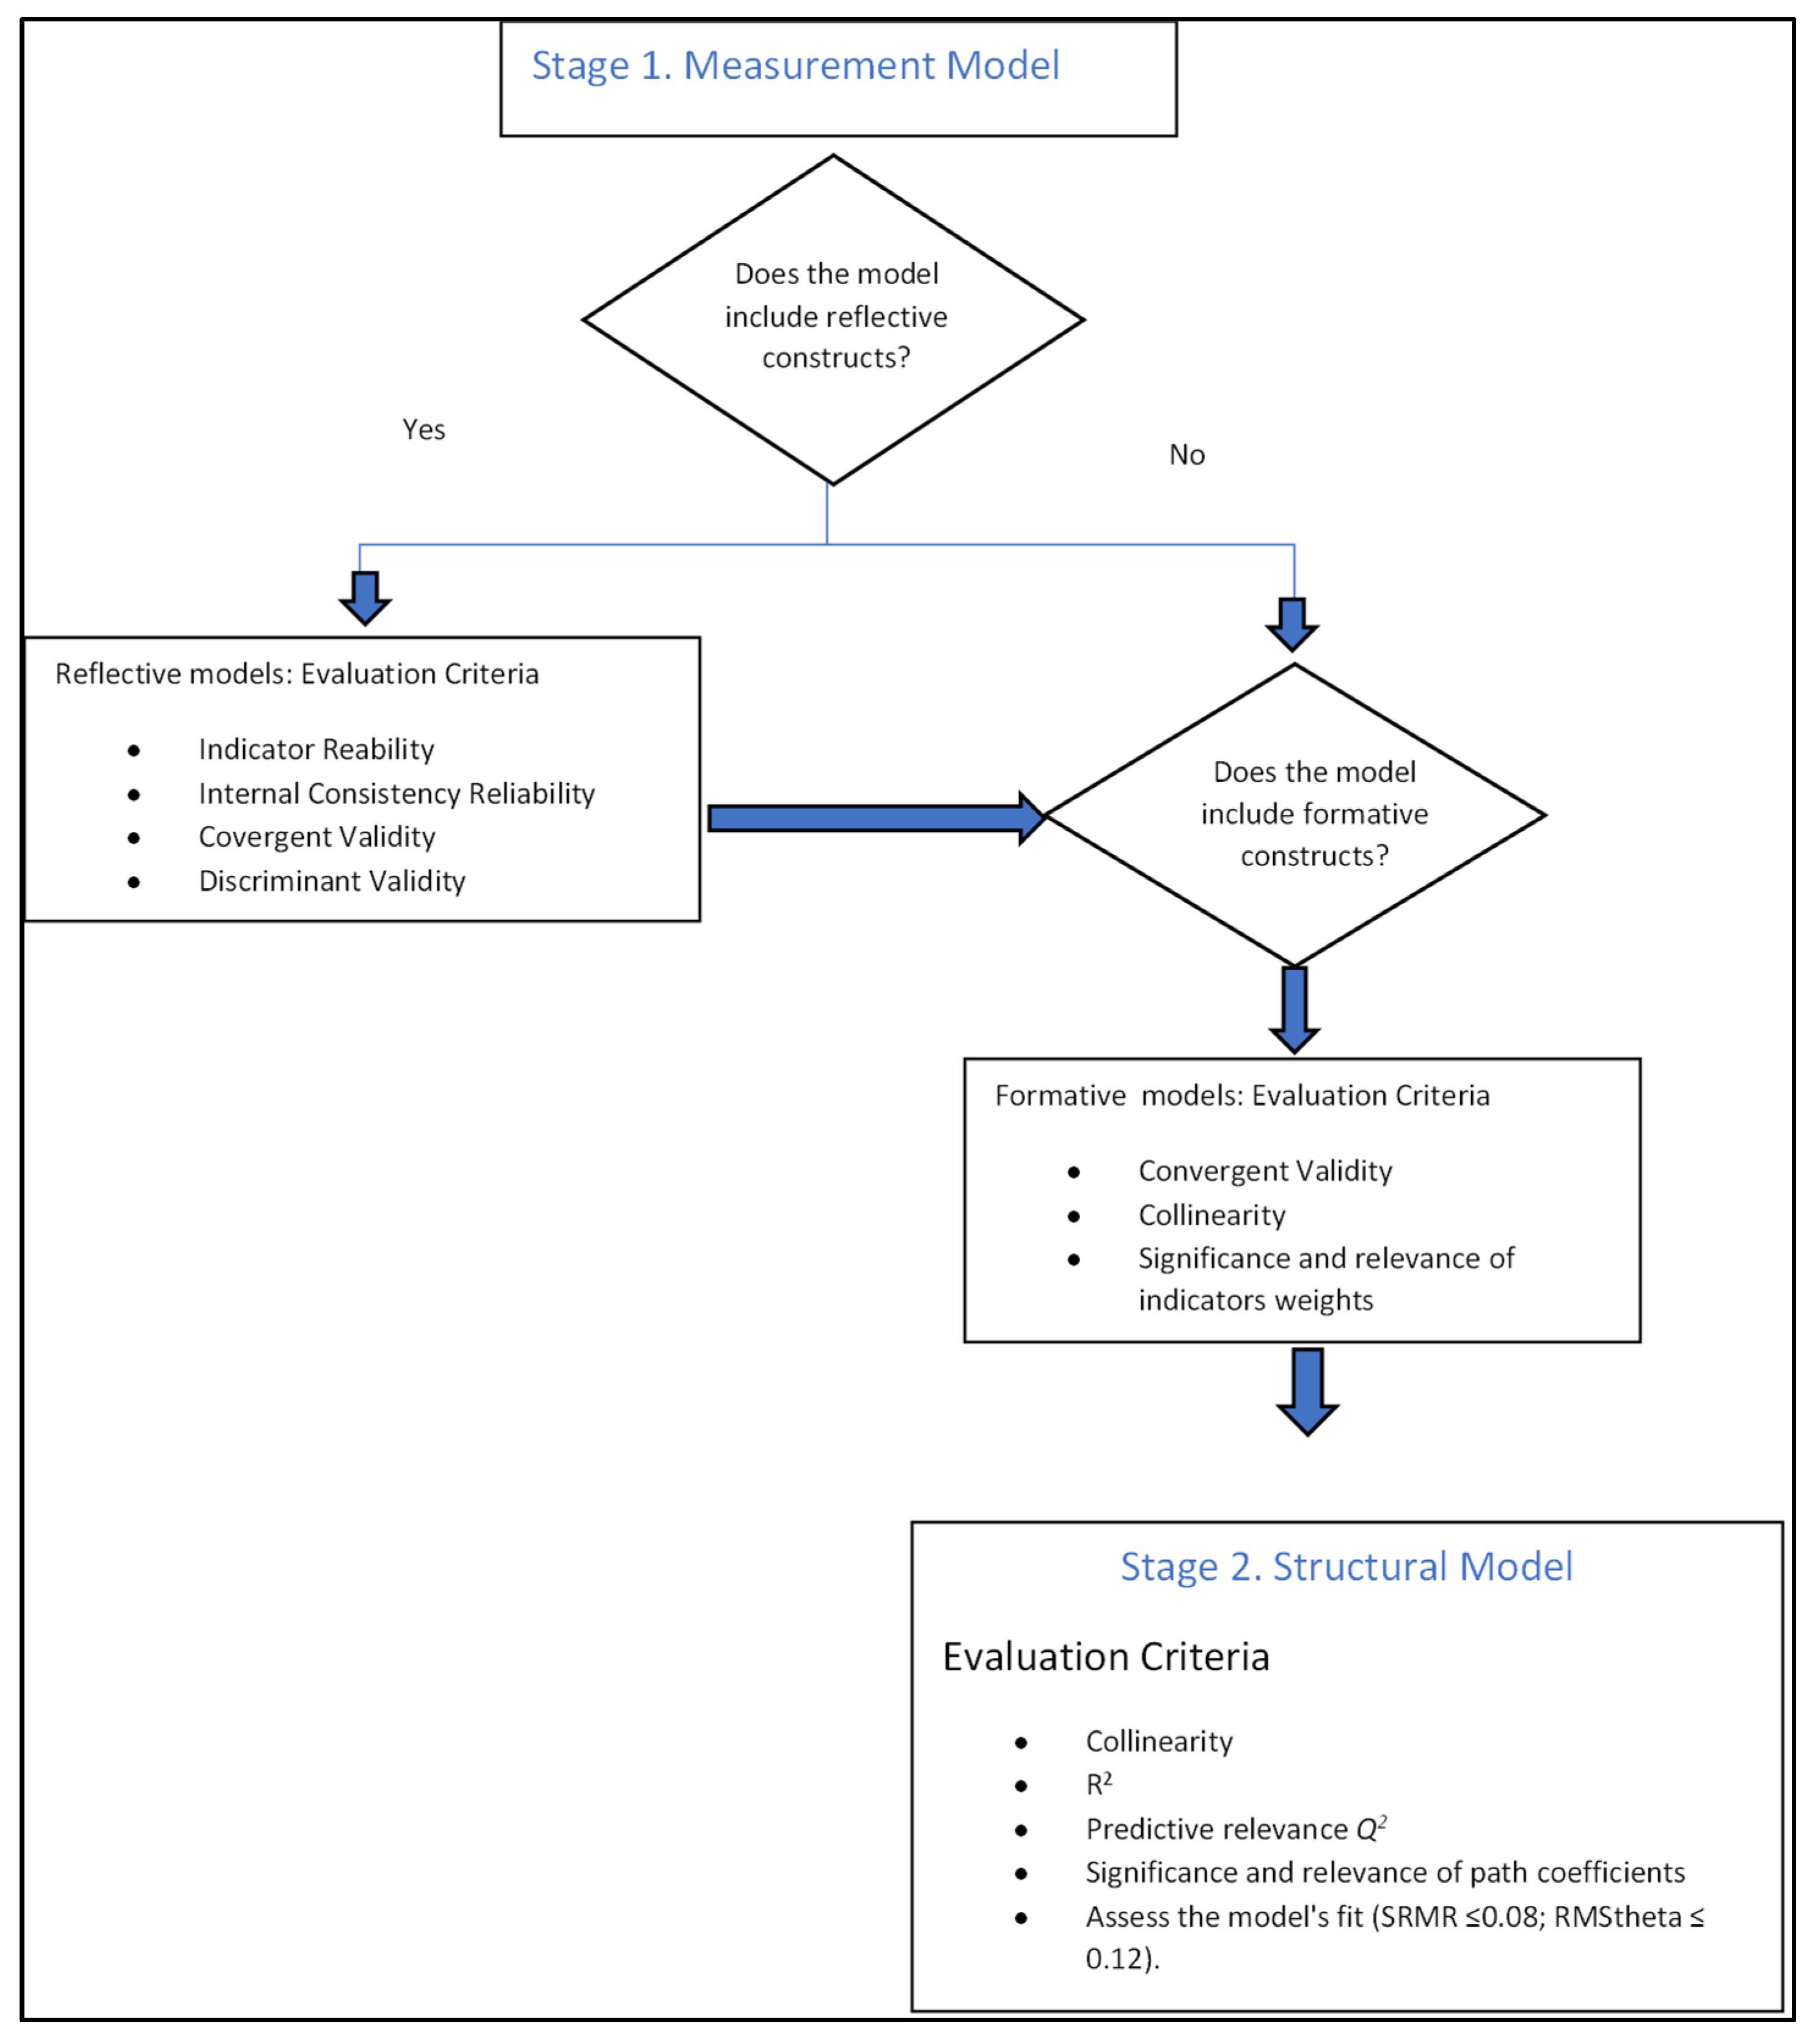
3.4. Research Method

A confirmatory factor analysis (CFA) using structural equation modeling (SEM) was conducted to evaluate the factor structure of the 33-item scale. Two SEM approaches are available: covariance-based SEM (CB-SEM) and composite-based SEM, or PLS-SEM. This study adopts the latter (PLS-SEM) given the model’s seven constructs and three items or indicators. PLS-SEM is a valuable method for predicting behaviors in behavioral research fields. For complex models that include both formative (causal) and reflective (outcome) constructs, PLS provides theoretical insights, with its primary strength lying in modeling (Gupta & Ogden, 2009; Hair et al., 2019). This technique was selected for its ability to simultaneously examine a series of dependence relations, especially when the model includes latent variables of both first and second orders (Lowry & Gaskin, 2014).
The Measurement Theory guides how to measure latent variables and includes two types of measurement models (Hair et al., 1998): formative and reflective models. In our study, all the constructs were formulated as composite type A. This allowed us to assess reliability and validity measurements.
Stage 1: Measurement Model
A measurement model describes the relation between indicators and each construct by assessing the reliability and validity of measures. The evaluation of the measurement model followed the following criteria (Lowry & Gaskin, 2014):
-
Indicator Reliability: Outer loading for each indicator should meet or exceed 0.70 (Lowry & Gaskin, 2014).
-
Internal Consistency Reliability: Assessed using Cronbach’s alpha (α) and Composite Reliability (CR), with a threshold of ≥ 0.70 for both (Hair et al., 1998).
-
Validity:
Stage 2: Structural Model
Structural models examine relations between constructs. The structural model was assessed following the following criteria from (Hair et al., 1998):
-
Check for collinearity issues (VIF < 5);
-
Evaluate the significance and relevance of the relations in the structural model (p < 0.05);
-
Analyze the R2 level (with thresholds of 0.190 for weak, 0.333 for moderate and 0.670 for substantial);
-
Assess Q2 values (should be over zero);
-
Check the model’s fit (SRMR ≤ 0.08; RMStheta ≤ 0.12).
Figure 2 illustrates the methodology’s two stages. Stage 1 addresses the assessment of reflective and formative measurement models, with both measurement models testing the Measurement Theory. Stage 2 involves evaluating the structural model, which addresses the Structural Theory by testing the proposed hypotheses and by analyzing the relations among the latent variables (Hair et al., 1998).

4. Results

4.1. Measurement Model

-
Internal Consistency Reliability Tests
All the constructs were formulated as composite type A. Thus, outer loadings were analyzed (Lowry & Gaskin, 2014). As some outer loadings did not exceed 0.7 across items, and Internal Consistency and Reliability (CR) and (AVE) did not reach the threshold value in some cases, the model was refined and was left as shown in Figure 3.
In this model, all the outer loadings were higher than 0.7. Table 3 shows the validity and reliability measures of each construct (Cronbach’s Alpha), Composite Reliability (CF) and Convergent Validity (AVE). In all cases, thresholds were exceeded (0.5 and 0.7), except for government performance because this construct was measured only with two indicators when three are recommended.
-
Discriminant Validity
The Fornell–Lacher criterion, the cross-loadings matrix and the HTMT criterion were assessed. The Fornell–Lacher criterion results appear in Appendix A (Table A1). This method uses AVE to compare the squared correlation to the other constructs in the model. With our data, the diagonal values were higher than those in the same column.
Table 4 shows the HTMT matrix. Heterotraits analyze any correlations between different constructs, and monotrait correlations measure the correlations in the same construct. Values of ≤0.9 are acceptable. The results indicated that values differed significantly from 1 in most cases.
Finally, to assess the significance of loadings, the bootstrap algorithm was applied using 50,000 samples to estimate the t and p values and to, thus, check the significance of external loadings with a 5% probability of error. This means that the 5% statistical significance level indicates that p-values must be >0.05 to accept the hypothesis with a t value of >1.65. The results showed that all the loadings were significant (p-value < 0.05). In this way, the measurement model was validated.

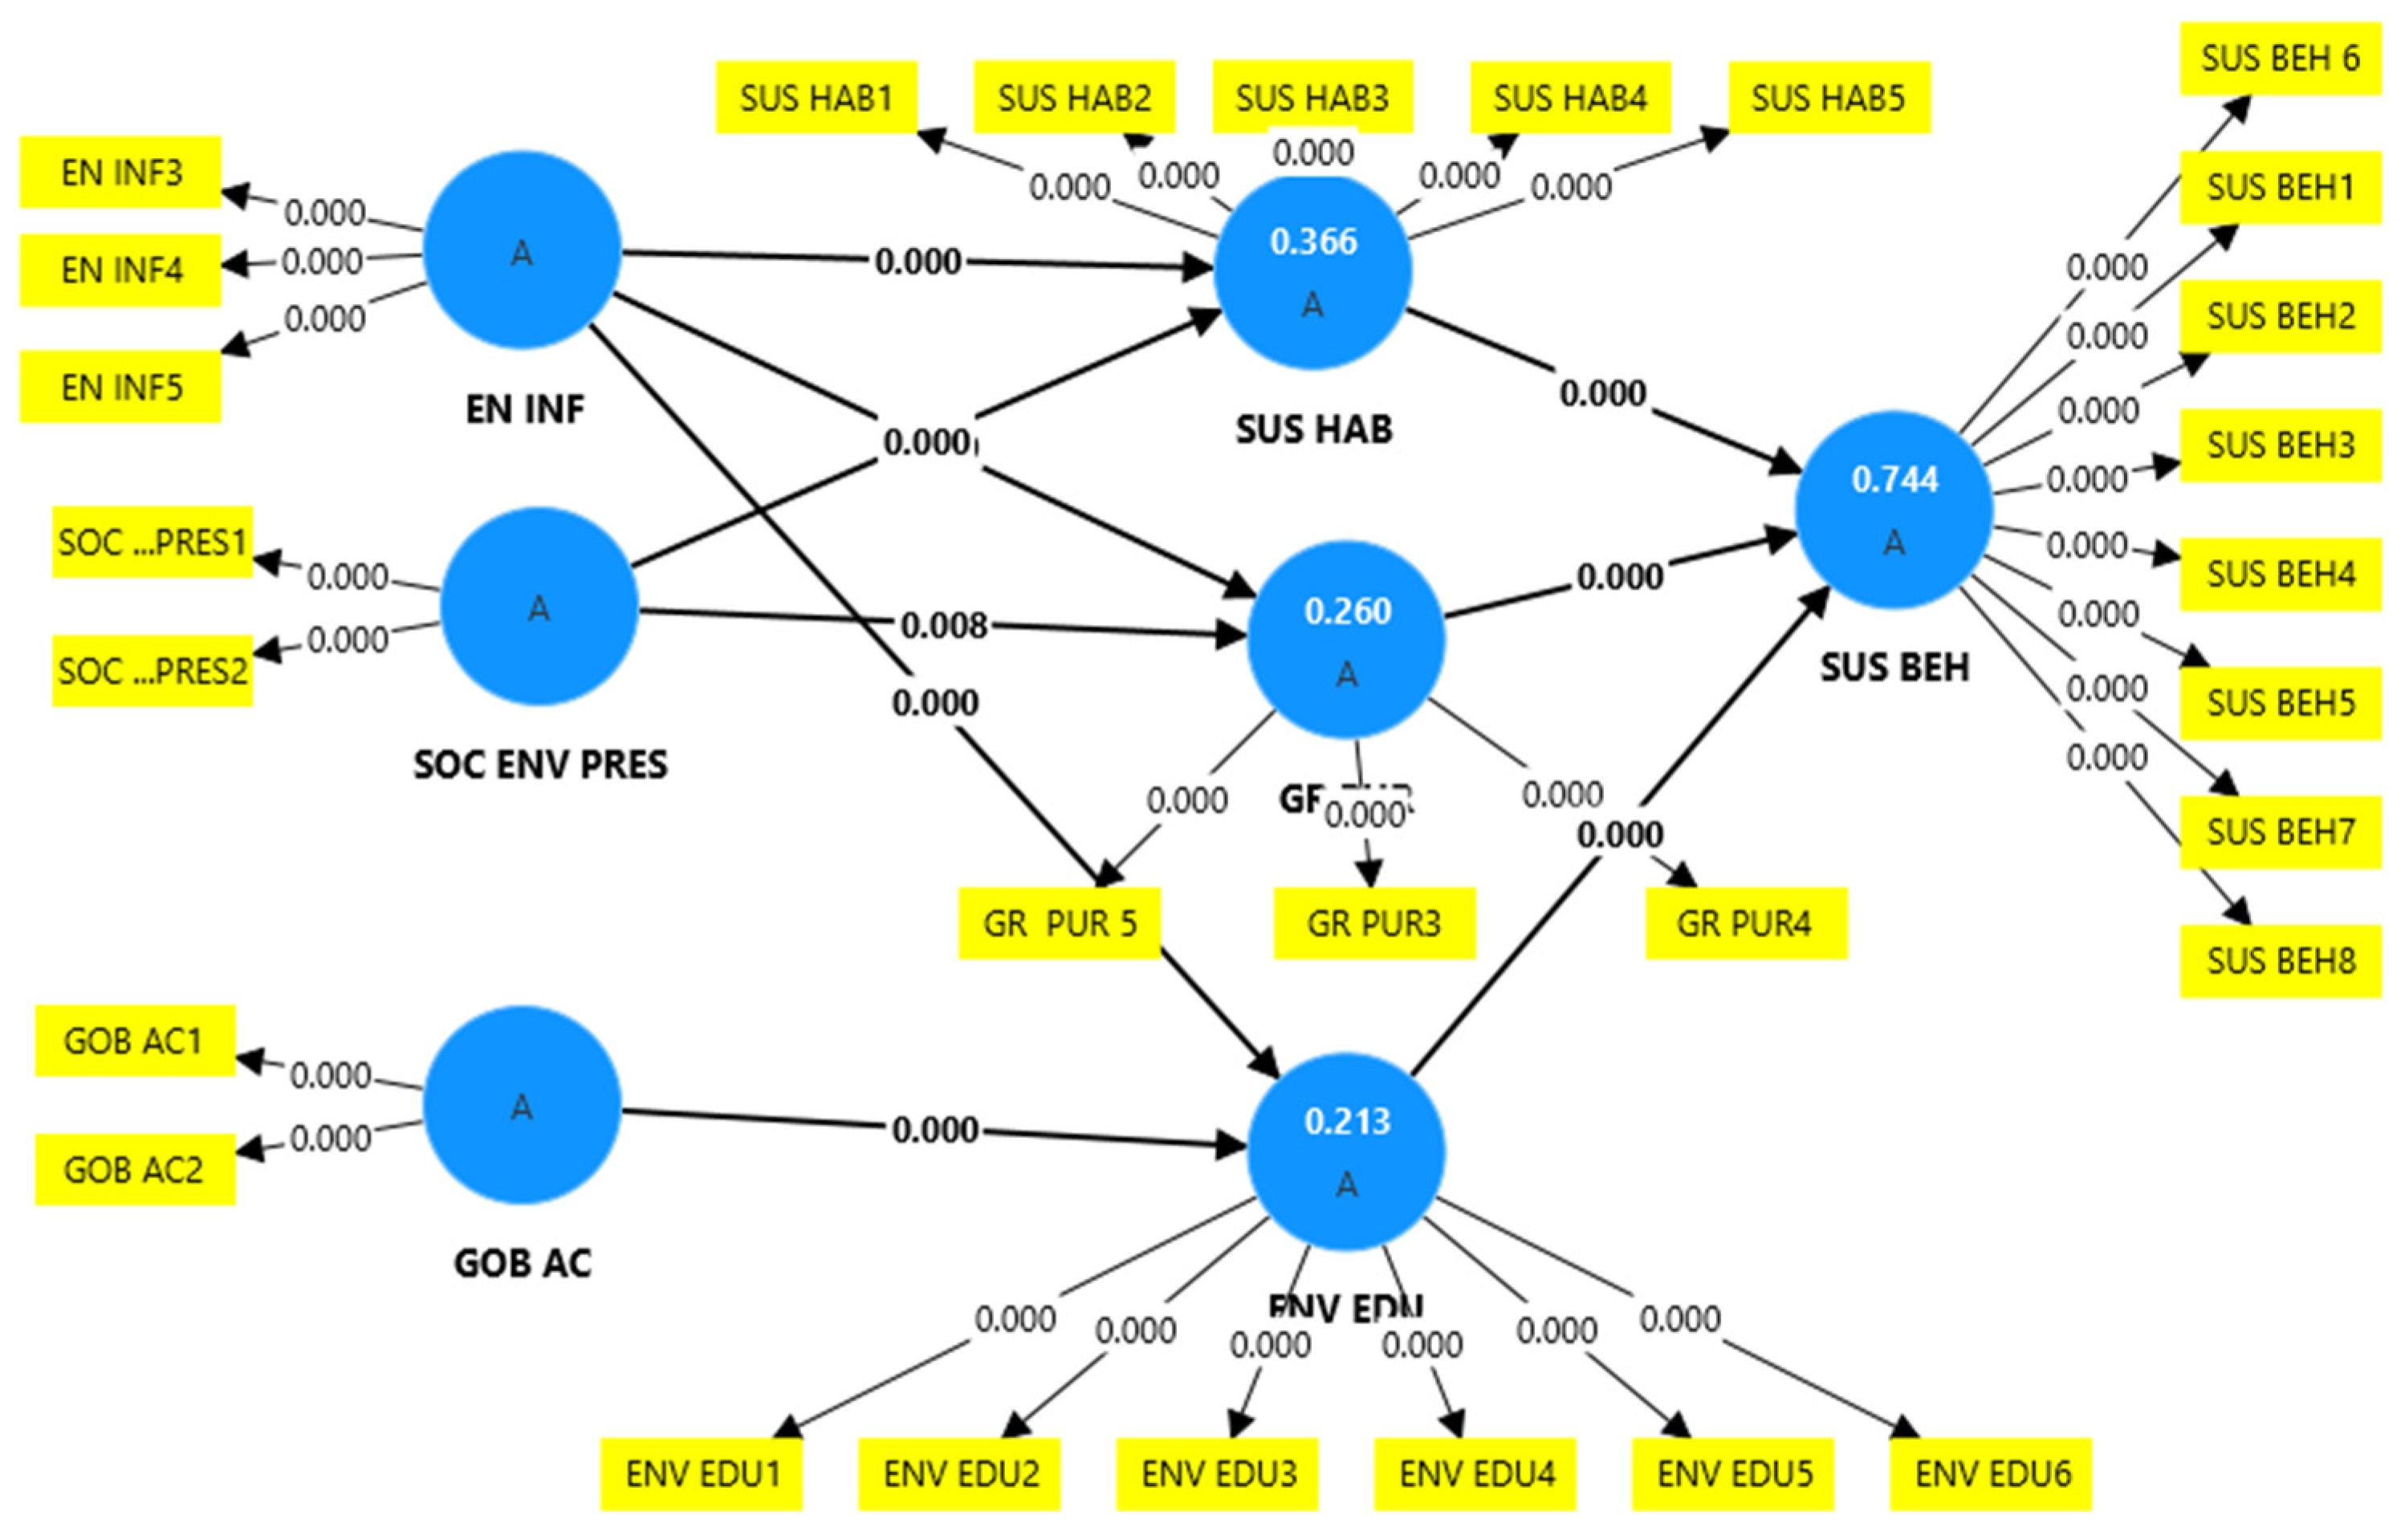
4.2. Structural Model Validation

Validating the structural model requires five steps (Lowry & Gaskin, 2014). First, evaluate collinearity using the variance inflation factor (VIF). VIF values of ≥5 indicate a possible collinearity problem (Lowry & Gaskin, 2014). The results appear in Appendix A (Table A2). As all the obtained VIF values were under 5, there were no collinearity problems.
Next the structural model must be evaluated to check the significance of the path coefficients. To do this, a Bootstrap analysis is performed. As shown in Figure 4, the p-value was estimated for each relation, and all of them were significant (p-value < 0.05).
As shown in Table 5, all the hypotheses were accepted at the 5% significance level given the estimated p-value for each relation. It was verified that all the path coefficients were significant by comparing the empirical “t” value to the critical value. When the first is higher than the second, the coefficient is considered statistically significant with a certain probability of error, i.e., significance level (Hair et al., 1998).
Then, the coefficients of determination (R2) of the dependent factors of the theoretical model were evaluated. This provides their amount of variance, which is explained by the independent factors, and can be interpreted as an indicator of the proposed model’s predictive accuracy by taking values of the order of 0.75 as being substantial, of the order of 0.5 as moderate and of the order of 0.25 as weak (Hair et al., 1998). As Figure 5 depicts, 74.4% of Sustainable Consumption Habits (SUS BEH) were explained by Sustainability Habits, Green Purchase, and Environment Education and Information, which were, in turn, influenced by Government Action.
The fourth step assessed predictive relevance, i.e., Q2, using blindfolding. If the Q2 value is 0.02, it indicates minor predictive relevance, values of 0.15 imply medium relevance and values of 0.35 denote considerable predictive relevance (Gupta & Ogden, 2009). Table A2 shows the Q2 for the latent variables.
Finally, Q2 was examined to assess the structural model’s predictive relevance as an additional predictive criterion to R2. The predictive relevance of the constructs must be positive with values above zero. Values of 0.02 are taken as small values, values of 0.15 are medium values and those of 0.35 are large values when considering the model’s predictive validity (Gupta & Ogden, 2009; Hair et al., 2017).
To determine this, it is necessary to generate the blindfolding procedure, which demonstrates model items’ predictive precision. A Q2 of 0.293 was obtained for the Sustainable Consumption Habits (SCH) factor and one of 0.349 was obtained for the Sustainable Habits construct when considering an almost strong average prediction, (Table 6).
To evaluate the model’s fit, we applied a series of fit indices as outlined by (Chin & Newsted, 1999), as follows:
-
The Standardized Root Mean Square Residual (SRMR). In this study, the SRMR was 0.082, which is below the threshold of 0.10 recommended by (Lohmöller, 1989).
-
The Normed Fit Index (NFI), as proposed by (Chin & Newsted, 1999). Higher values close to 1 indicate a better fit, with values above 0.9 representing an acceptable fit level (Lohmöller, 1989; Hu & Bentler, 1999). Here, the NFI value was 0.658.
We also examined the model’s goodness-of-fit (GoF), defined as “the extent to which the proposed model reproduces the observed covariance matrix among the indicator variables” (Hair et al., 1998). In this model, GoF was 0.45, which exceeded the threshold value of 0.35 suggested by (Bentler & Bonett, 1980) and indicates strong overall performance and a substantial fit.

5. Discussion

This paper analyzes the impact of Sustainable Habits, Green Purchase, Environmental Education and Information, Environmental Influence, Social Environmental Pressure and Government Action on Sustainable Behavior by proposing a PLS-SEM model. It presents a new conceptualization of the SUS BEH construct that differs from previous research because it considers Sustainability Habits, Green Purchase and Environmental Education and Information, Social Environmental Pressure, Government Action and Environmental Influence as the relevant factors used to construct an initial theoretical model.
The relationships between the exogenous and the endogenous variables of Sustainable Behavior and structural equations were assessed using Partial Least Squares (PLS-SEM) modeling.
All five initially proposed hypotheses were confirmed. So, we can state that Sustainable Consumption Behavior was determined by Environmental Education and Information (t = 4.535), understood as Education for Sustainable Development and Green Purchase (t = 7–489), which refer to positive consumer perceptions of sustainable products and Sustainable Consumption Habits (t = 8.310) which are related to the behavior and buying habits of consumers to minimize harm to the environment. In addition, Government Action (t = 4.639) contributes to Environmental Education and Information and Social Environmental Pressure contributes to Green Purchase (t = 2.643) and Sustainable Consumption Habits (t = 2.646). These research findings are supported by the literature identified above. Finally, Environmental Influence, particularly interested in studying the effects of family and friends, contributes to Sustainable Consumption Habits (t = 9.993), Green Purchase (t = 7.341) and Environmental Education and Information (t = 4.281).
The research confirmed that the original scale proposed by (Figueroa-García et al., 2018) could be adapted to assess Sustainable Consumption Behavior, and moreover, it was proved that the modified proposed model retained a good model fit in studies on young consumers in other countries with different backgrounds.
The findings of this study provide new insights into the determinants of Sustainable Consumption Behavior among university students, highlighting the role of environmental education, green purchasing habits, social environmental pressure, and governmental actions. These results not only validate the proposed PLS-SEM model but also contribute to the broader discourse on sustainable development, particularly in achieving SDG12 (Responsible Consumption and Production).
A key contribution of this research is the confirmation that Environmental Education and Information plays a crucial role in shaping sustainable behavior. This finding aligns with previous studies emphasizing the need for well-structured educational programs to raise awareness about environmental issues and responsible consumption. Given the increasing focus on sustainability in higher education institutions, our study suggests that curricula should integrate sustainability-oriented courses, practical experiences, and interdisciplinary approaches to foster students’ awareness and engagement with sustainability.
Furthermore, the study confirms that Green Purchase and Sustainable Consumption Habits significantly impact sustainable behavior, indicating that students who are more conscious of the environmental impact of their purchases are more likely to adopt sustainable consumption patterns. This reinforces the idea that educational institutions and policymakers should collaborate to promote responsible consumer choices through campus-wide sustainability campaigns, green certifications for student organizations and incentives for sustainable consumption.
Another relevant insight is the influence of social and environmental pressures on sustainable consumption. The significant effect of Environmental Influence from family and peers suggests that social networks play a vital role in shaping students’ consumption patterns. This has implications for educational methodologies, as collaborative learning strategies and peer-led sustainability initiatives can amplify the impact of formal education. Universities should consider implementing mentorship programs where environmentally conscious students can guide their peers in making sustainable choices.
Additionally, Government Action was found to positively contribute to environmental education and awareness. This suggests that public policies aimed at promoting sustainable consumption should be reinforced through educational campaigns, subsidies for sustainable products, and stricter environmental regulations. Such measures could complement university efforts by creating an external framework that supports and reinforces sustainable behavior.
Despite these findings, some limitations should be acknowledged. This study was conducted within a specific university context, and future research should explore whether similar trends emerge among students from different regions and educational backgrounds. Additionally, further studies could examine the long-term impact of sustainability education on students’ post-graduate consumption behaviors.

6. Conclusions

In this paper, we propose and test a framework that explains the role of Sustainable Behavior and the main factors that correlate with it. This study extends sustainable consumption research by developing and validating a sustainable consumption model that consists of seven main dimensions or factors: Sustainable Consumption Behavior (SUS BEH), Sustainable Consumption Habits (SUS HAB), Green Purchase (GR PURCH), Environmental Education and Information (ENV EDU), Environmental Influence, (ENV INF), Social Environmental Pressure (SOC PR) and Government Action (GOB AC).
This research confirms that Sustainable Consumption Behavior among university students is strongly influenced by Environmental Education and Information, Green Purchase, and Sustainable Consumption Habits. Moreover, Social Environmental Pressure, and Environmental Influence, along with Government Action, significantly contribute to shaping sustainable attitudes and behaviors.
The implications of these findings extend beyond academia, providing valuable insights for educators, policymakers, and industry stakeholders. Universities should incorporate sustainability education into their curricula and promote student-led sustainability initiatives to enhance awareness and behavioral change. Policymakers should develop strategies that integrate education, regulation and incentives to foster sustainable consumption at a broader level.
In alignment with the United Nations (2023), this study underscores the necessity of intensifying efforts to integrate sustainability principles into education. By identifying the key motivators behind sustainable consumption, governments, institutions, and businesses can design targeted interventions that drive meaningful and long-lasting environmental, economic, and social benefits.
Future research should consider expanding the sample to include students from diverse academic disciplines and geographical locations. Additionally, longitudinal studies could assess the evolution of Sustainable Consumption Behaviors over time, providing deeper insights into the long-term effectiveness of sustainability education.
Overall, this study contributes to the growing body of knowledge on sustainability in higher education, reinforcing the importance of integrating educational, social, and policy-driven approaches to promote Sustainable Consumption Behaviors among young consumers.

Author Contributions

Conceptualization and methodology, M.M.G.; formal analysis and investigation, M.M.G., E.d.l.P.P. and M.A.A.G.; data curation, E.d.l.P.P. and M.A.A.G.; writing—original draft preparation, M.M.G. and M.A.A.G.; writing—review and editing, visualization, and supervision M.M.G., E.d.l.P.P. and M.A.A.G.; funding acquisition, M.M.G., E.d.l.P.P. and M.A.A.G. All authors have read and agreed to the published version of the manuscript.

Funding

Universitat Politècnica de València: (PAID-06-23), “Support through Data Science, Social Media and Innovation to Enhance Digital Divide and Sustainability with a gender approach: An International Study (DIVIDataSci)”.

Institutional Review Board Statement

The research was conducted following the principles embodied within the Declaration of Helsinki and according to local statutory requirements. This study was approved by the UPV Research Ethics Committee.

Informed Consent Statement

All the participants gave written informed consent to participate in the study. Participation in the study was voluntary, and participants could withdraw at any point. The online survey was completely anonymous and did not contain any information that could allow participants’ identification.

Data Availability Statement

The authors confirm that the data supporting the findings of this study are available in the article.

Conflicts of Interest

The authors declare no conflicts of interest.

Abbreviations

AVEAverage variance extracted
CB-SEMCovariance-based and structural equation modeling
CFAConfirmatory Analysis
CRComposite Reliability
GoFGoodness of fit
HTMTHeterotrait–monotrait ratio
PLSPartial Least Square
Sustainability2022, 14, 13261 20 of 28
PLS-SEMPartial Least Square and structural equation model
Q2Goodness of PLS prediction
QoI Quality of Interaction
R2Determination Coefficient
RMSRoot Mean Square
SRMRStandardized Root Mean Residual
VIFVariance inflation factor
SUS BEHSustainable Behavior
SUS HABSustainable Habits
GR PURCHGreen Purchase
ENV EDUEnvironmental Education and Information
ENV INFEnvironmental Influence
SOC ENV PRSocial Environmental Pressure
GOB ACGovernment Action

Appendix A

Table A1. Fornell–Lacker discriminant validity correlation matrix.
EN INFENV EDUGOB ACGR PURSOC ENV PRESSUS BEHSUS HAB
EN INF0.793
ENV EDU0.3540.719
GOB AC0.2100.3640.810
GR PUR0.4840.4730.2190.789
SOC ENV PRES0.2380.2250.2090.2720.834
SUS BEH0.5380.5660.2750.7740.2280.747
SUS HAB0.5630.4260.2570.6700.3490.7700.721
Table A2. Collinearity (VIF) analysis.
VIF
EN INF31.349
EN INF41.466
EN INF51.433
ENV EDU11.346
ENV EDU21.765
ENV EDU31.809
ENV EDU42.128
ENV EDU51.669
ENV EDU61.914
GOB AC11.121
GOB AC21.121
GR PUR 51.346
GR PUR31.341
GR PUR41.453
SOC ENV PRES11.272
SOC ENV PRES21.272
SUS BEH 61.920
SUS BEH11.668
SUS BEH22.927
SUS BEH31.915
SUS BEH42.367
SUS BEH52.246
SUS BEH71.930
SUS BEH81.579
SUS HAB11.687
SUS HAB21.381
SUS HAB31.205
SUS HAB41.819
SUS HAB51.457

References

  1. Ajzen, I. (1985). From intentions to actions: A theory of planned behaviour. In J. Kuhl, & J. Beckmann (Eds.), Action control: From cognition to behaviour (pp. 11–39). Springer. [Google Scholar]
  2. Ajzen, I. (1991). The theory of planned behavior. Organizational Behavior and Human Decision Processes, 50(2), 179–211. [Google Scholar] [CrossRef]
  3. Bentler, P. M., & Bonett, D. G. (1980). Significance tests and goodness of fit in the analysis of covariance structure. Psychological Bulletin, 88, 588–606. [Google Scholar] [CrossRef]
  4. Caeiro, S., Ramos, T. B., & Huisingh, D. (2012). Procedures and criteria to develop and evaluate household sustainable consumption indicators. Journal of Cleaner Production, 22, 72–91. [Google Scholar] [CrossRef]
  5. Chawla, L. (2007). Childhood experiences associated with care for the naturalworld: A theoretical framework for empirical results. Children, Youth and Environments, 17, 144–170. [Google Scholar] [CrossRef]
  6. Chen, M. F., & Tung, P. J. (2010). The moderating effect of perceived lack of facilities on consumers’ recycling intentions. Environment and Behavior, 42(6), 824–844. [Google Scholar] [CrossRef]
  7. Chin, W. W., & Newsted, P. R. (1999). Structural equation modeling analysis with small samples using partial least squares. In R. Hoyle (Ed.), Statistical strategies for small samples research (pp. 307–341). Sage Publications. [Google Scholar]
  8. Corral-Verdugo, V. (2012). The positive psychology of sustainability. Environment, Development and Sustainability, 14(5), 651–666. [Google Scholar] [CrossRef]
  9. D’Amato, D., Korhonen, J., & Toppinen, A. (2019). Circular, green, and bioeconomy: How do companies in land-use intensive sectors align with sustainability concepts? Ecological Economics, 158, 116–133. [Google Scholar] [CrossRef]
  10. Do Paco, A., Shiel, C., & Alves, H. (2019). A new model for testing green consumer behaviour. Journal of Cleaner Production, 207, 998–1006. [Google Scholar] [CrossRef]
  11. Eagles, P. F. J., & Demare, R. (1999). Factors influencing children’s environmental attitudes. The Journal of Environmental Education, 30, 33–37. [Google Scholar] [CrossRef]
  12. Figueroa-García, E. C., García-Machado, J. J., & Perez-Bustamante Yabar, D. C. (2018). Modeling the social factors that determine sustainable consumption behavior in the community of Madrid. Sustainability, 10(8), 2811. [Google Scholar] [CrossRef]
  13. Fischer, D., Böhme, T., & Geiger, S. M. (2017). Measuring young consumers’ sustainable consumption behavior: Development and validation of the YCSCB scale. Young Consumers, 18, 312–326. [Google Scholar] [CrossRef]
  14. Fishbein, M., & Ajzen, I. (1975). Belief, attitude, intention, and behaviour: An introduction to theory and research. Addison-Wesley. [Google Scholar]
  15. Frank, T., Schlange, J., & Cort, T. (2020). Report of results global survey on sustainability and the SDGs. Federal Ministry for the Environment, Nature Conservation and Nuclear Safety. Available online: https://www.globalsurvey-sdgs.com/ (accessed on 13 July 2024).
  16. Gleim, M., Smith, J., Andrews, D., & Cronin, J. J., Jr. (2013). Against the green: A multi-method examination of the barriers to green consumption. Journal of Retailing, 89, 44–61. [Google Scholar] [CrossRef]
  17. Gupta, S., & Ogden, D. T. (2009). To buy or not to buy? A social dilemma perspective on green buying. Journal of Consumer Marketing, 26, 376–391. [Google Scholar] [CrossRef]
  18. Hair, J. F., Jr., Anderson, R. E., Tatham, R. L., & Black, W. C. (1998). Multivariate data analysis (5th ed.). Springer Science & Business Media. [Google Scholar]
  19. Hair, J. F., Jr., Hult, G. T. M., Ringle, C., & Sarstedt, M. A. (2017). Primer on partial least squares structural equation modeling (PLS-SEM) (2nd ed.). Sage Publications. [Google Scholar]
  20. Hair, J. F., Jr., Risher, J. J., Sarstedt, M., & Ringle, C. M. (2019). When to use and how to report the results of PLS-SEM. European Business Review, 31(1), 2–24. [Google Scholar] [CrossRef]
  21. Hajer, M., Nilsson, M., Raworth, K., Bakker, P., Berkhout, F., de Boer, Y., Rockstr€om, J., Ludwig, K., & Kok, M. (2015). Beyond cockpit-ism: Four insights to enhance the transformative potential of the sustainable development goals. Sustainability, 7(2), 1651–1660. [Google Scholar] [CrossRef]
  22. Hu, L.-T., & Bentler, P. M. (1999). Cutoff criteria for fit indexes in covariance structure analysis: Conventional criteria versus new alternatives. Structural Equation Modeling: A Multidisciplinary Journal, 6(1), 1–55. [Google Scholar] [CrossRef]
  23. Kollmuss, A., & Agyeman, J. (2002). Mind the Gap: Why do people act environmentally and what are the barriers to pro-environmental behavior? Environmental Education Research, 8, 239–260. [Google Scholar] [CrossRef]
  24. Kowalska, A., Ratajczyk, M., Manning, L., Bieniek, M., & Macik, R. (2021). Young and green: A study of consumer’ perceptions and reported purchasing behaviour towards organic food in poland and the United Kingdom. Sustainability, 13, 13022. [Google Scholar] [CrossRef]
  25. Leiva-Brondo, M., Lajara-Camilleri, N., Vidal-Meló, A., Atarés, A., & Lull, C. (2022). Spanish university students’ awareness and perception of sustainable development goals and sustainability literacy. Sustainability, 14, 4552. [Google Scholar] [CrossRef]
  26. Lohmöller, J. B. (1989). Predictive vs. structural modeling: Pls vs. ml. In Latent variable path modeling with partial least squares (pp. 199–226). Physica. [Google Scholar] [CrossRef]
  27. Lowry, P. B., & Gaskin, J. (2014). Partial least squares (PLS) structural equation modeling (SEM) for building and testing behavioral causal theory: When to choose it and how to use it. IEEE Transactions on Dependable and Secure Computing, 57, 123–146. [Google Scholar] [CrossRef]
  28. Martínez-Acosta, M., Vázquez-Villegas, P., Mejía-Manzano, L. A., Soto-Inzunza, G. V., Ruiz-Aguilar, K. M., Kuhn Cuellar, L., Caratozzolo, P., & Membrillo-Hernández, J. (2023). The implementation of SDG12 in and from higher education institutions: Universities as laboratories for generating sustainable cities. Frontiers in Sustainable Cities, 5, 1158464. [Google Scholar] [CrossRef]
  29. Sachs, J. D. (2012). From millennium development goals to sustainable development goals. The Lancet, 379, 2206–2211. [Google Scholar] [CrossRef] [PubMed]
  30. Salgado Beltrán, L., & Bravo Díaz, B. (2015). Consumo verde en el norte de sonora. Agroproductividad, 8, 42–47. [Google Scholar]
  31. Shao, J., Taisch, M., & Mier, M. O. (2017). Influencing factors to facilitate sustainable consumption: From the expert’s viewpoints. Journal of Cleaner Production, 142, 203–216. [Google Scholar] [CrossRef]
  32. Steg, L., & Gifford, R. (2005). Sustainable transport and quality of life. Journal of Transport Geography, 13, 59–69. [Google Scholar] [CrossRef]
  33. Straughan, R. D., & Roberts, J. A. (1999). Environmental segmentation alternatives: A look at green consumer behavior in the new millennium. Journal of Consumer Marketing, 16, 558–575. [Google Scholar] [CrossRef]
  34. Tabernero, C., Hernández, B., Cuadrado, E., Luque, B., & Pereira, C. R. (2015). A multilevel perspective to explain recycling behaviour in communities. Journal of Environmental Management, 159, 192–201. [Google Scholar] [CrossRef]
  35. Tedeneke, A. (2019). Global survey shows 74% are aware of the sustainable development goals. World Economic Forum. Available online: https://www.weforum.org/press/2019/09/global-survey-shows-74-are-aware-of-the-sustainable-development-goals/ (accessed on 20 September 2024).
  36. United Nations. (2015). Transforming our world: The 2030 agenda for sustainable development. General Assembly of the United Nations. Available online: https://www.un.org/en/development/desa/population/migration/generalassembly/docs/globalcompact/A_RES_70_1_E.pdf (accessed on 15 September 2024).
  37. United Nations. (2023). The sustainable development goals report: Special edition. Available online: https://desapublications.un.org/publications/sustainable-development-goals-report-2023-special-edition (accessed on 28 December 2024).
  38. Vicente-Molina, M. A., Fernández-Sáinz, A., & Izagirre-Olaizola, J. (2013). Environmental knowledge and other variables affecting pro-environmental behaviour: Comparison of university students from emerging and advanced countries. Journal of Cleaner Production, 61, 130–138. [Google Scholar] [CrossRef]
  39. Wetzels, M., Odekerken-Schroder, G., & Van Oppen, C. (2009). Using PLS path modeling for assessing hierarchical construct models: Guidelines and empirical illustration. MIS Quarterly, 33(1), 177–195. [Google Scholar] [CrossRef]
  40. Yli-Panula, E., Jeronen, E., & Rodriguez-Aflecht, G. (2020). Nature is something we can’t replace: Mexican students’ views of the landscape they want to conserve. Education Sciences, 10, 13. [Google Scholar] [CrossRef]
Figure 1. Initial theoretical Path Model (own research adapted from (Figueroa-García et al., 2018).
Education 15 00325 g001
Figure 2. PLS-SEM model evaluation (adapted from (Hair et al., 1998)).
Education 15 00325 g002
Figure 3. Redefined conceptual model.
Education 15 00325 g003
Figure 4. Significance testing results of each relation (p-values).
Education 15 00325 g004
Figure 5. Coefficients of determination of the dependent factors of the theoretical model proposed to evaluate the determinants of sustainable consumption.
Education 15 00325 g005
Table 1. Socio-demographic data of the sample.
Indicator %
GD_1Between 18 and 24 years81.12
Between 25 and 30 years7.65
Over 30 years6.63
NS/NC4.59
GD_2Degree81.12
Master18.36
Doctorate0.51
GD_3Female51.53
Male47.95
NS/NC0.51
Table 2. Indicators and definitions of the questions in the questionnaire.
Indicator Definition
General data (GD)
GD_1Age
GD_2Level of education
GD_3Gender
Sustainable Consumption Habits (SUS HAB)
SUS HAB 1Every day I am careful about the activities I perform to protect the environment.
SUS HAB_2I perform specific activities to protect the environment.
SUS HAB_3I consume local products to support the economy of my area
SUS HAB_4I consider myself environmentally responsible.
SUS HAB_5I consider the potential environmental impact of my actions before making decisions.
Sustainable Consumption Behavior (SUS BEH)
SUS BEH_1It is important for me that the products I consume do not harm the environment.
SUS BEH_2I am motivated to make changes in my lifestyle to achieve responsible consumption.
SUS BEH_3I care about wasting our planet’s resources.
SUS BEH_4I would describe myself as an environmentally responsible and involved person.
SUS BEH_5I am willing to compromise my comfort to act in an environmentally responsible way.
SUS BEH_6I try to buy products that do not have too much packaging.
SUS BEH_7If possible, I buy products in reusable/recyclable packaging.
SUS BEH_8I have convinced my family and/or friends to buy responsibly.
Environmental Influence (ENV INF)
ENV INF_1Someone in my family or friends motivates me to be environmentally friendly.
ENV INF_2I have volunteered for social work related to the environment.
ENV INF_3Being environmentally friendly is a priority in my family.
ENV INF_4At my usual home, waste is separated for recycling.
ENV INF_5At my usual home, there are always green spaces.
Environmental Education and Information (ENV EDU)
ENV EDU 1I have been taught activities to be more responsible in resources use (water, electricity, energy).
ENV EDU2I am informed about the environmental problems that currently exist.
ENV EDU3I am informed about the negative effects of certain products that I consume.
ENV EDU4I usually pay attention to environmental advertising.
ENV EDU5I am aware of the advertising behind organic products.
ENV EDU6The use of green messages in advertising affects my attitude about that advertising.
Social Environmental Pressure (SOC PR)
SOC PR_1I have felt pressure from my friends to perform activities that benefit the environment.
SOC PR_2I feel obliged to belong to a group of people involved with the environment.
Green Purchase (GR PURCH)
GR PUR 1I trust organic products more than conventional ones.
GR PUR 2I think there are many places where I can find products that are not harmful to the environment.
GR PUR 3I support brands that produce responsibly.
GR PUR 5I take advantage of the fact that I can now easily get products.
Government Action (GOB AC)
GOB AC_1In my city, the government motivates people to act responsibly through equality and social justice.
GOB AC_2The government is responsible for doing what is necessary so I can take action in favor of the environment.
Table 3. Measures of the Internal Consistency Reliability test.
Cronbach’s AlphaComposite Reliability (CR)Average Variance Extracted (AVE)
EN INF0.7190.7780.630
ENV EDU0.8120.8220.517
GOB AC0.4950.5600.656
GR PUR0.7030.7620.623
SOC ENV PRES0.6321.1240.696
SUS BEH0.8860.8900.558
SUS HAB0.7630.7820.520
Table 4. The heterotrait–monotrait ratio (HTMT) correlation matrix.
EN I
NF
ENV
EDU
GOB
AC
GR
PUR
SOC ENV
PRES
SUS
BEH
SUS
HAB
EN INF
ENV EDU0.419
GOB AC0.3010.561
GR PUR0.6160.6030.344
SOC ENV PRES0.3190.3010.3330.341
SUS BEH0.6260.6550.3900.9490.270
SUS HAB0.7120.5460.3890.8850.4230.924
Table 5. Significance of the model parameters (p values).
Original Sample (O)Sample Mean (M)Standard Deviation (STDEV)T Statistics (|O/STDEV|)p Values
EN INF -> ENV EDU0.2910.2960.0684.2810.000
EN INF -> GR PUR0.4450.4470.0617.3410.000
EN INF -> SUS HAB0.5090.5130.0519.9930.000
ENV EDU -> SUS BEH0.1990.2030.0444.5350.000
GOB AC -> ENV EDU0.3030.3090.0654.6390.000
GR PUR -> SUS BEH0.4000.4000.0537.4890.000
SOC ENV PRES -> GR PUR0.1660.1690.0632.6460.008
SOC ENV PRES -> SUS HAB0.2280.2300.0593.8930.000
SUS HAB -> SUS BEH0.4170.4150.0508.3100.000
Table 6. Results of Q2, predictive relevance.
Q2 PredictRMSEMAE
ENV EDU0.1810.9110.703
GR PUR0.2350.8840.710
SUS BEH0.2930.8540.665
SUS HAB0.3490.8180.645
Disclaimer/Publisher’s Note: The statements, opinions and data contained in all publications are solely those of the individual author(s) and contributor(s) and not of MDPI and/or the editor(s). MDPI and/or the editor(s) disclaim responsibility for any injury to people or property resulting from any ideas, methods, instructions or products referred to in the content.

