Abstract
Students’ measurement estimation skills require benchmark knowledge (about measures of known objects) and estimation strategies (ways to compare with benchmarks). While students’ estimation skills have been assessed and unpacked in several empirical studies (for length and area but less for mass), approaches for fostering them have hardly been empirically studied. We present the instructional design of a digital teaching-learning environment designed to foster fifth graders’ estimation skills for mass measures and empirical evidence for its efficacy. The teaching-learning environment encompassed two 45-minute sessions and drew upon the design principles of cognitive engagement with worked examples, enhanced communication, and scaffolding. A class-wise randomized controlled trial was conducted in 14 classes (involving n = 310 students) with three treatment groups, and two intervention groups worked on estimation strategies in the teaching-learning environment. Both intervention groups significantly outperformed the control group in the post test. The intervention group with highly structured scaffolds only tended to explain the strategies slightly better than the intervention group with regular scaffolds, albeit not significantly. The findings show that estimation skills can be effectively fostered, with a modest indication that highly structured scaffolds might hold promise for longer interventions to enhance students’ discourse practices.
1. Introduction: Evidence Gap for Interventions on Estimation Skills
Many research studies have shown that students’ measurement estimation skills rely on two components: estimation strategies and factual knowledge of typical benchmarks (Bright, 1976; Joram et al., 1998; Mitchell et al., 1999; Weiher, 2019). Although limitations in students’ estimation skills were repeatedly shown in earlier research (Mitchell et al., 1999; Hoth et al., 2023), only a single intervention study with 44 third graders investigated how measurement estimation skills can be fostered in mathematics classrooms (Joram et al., 2005; no further studies reported by Subramaniam, 2014).
In this paper, we present a digital teaching-learning environment that was designed according to the design principles of cognitive engagement and enhanced communication to foster fifth graders’ estimation skills. In the randomized control trial, we pursued the following overall research question, which will be refined after the next two sections: To what extent can fifth graders’ estimation skills be fostered?
In the following sections, we present the current state of research on estimation skills and instructional approaches for fostering them (Section 2). We then introduce the instructional design of the digital teaching-learning environments studied (Section 3), the methodological framework of the randomized controlled trial (Section 4), the empirical results (Section 5), and a discussion (Section 6).
2. Background: State of Research on Fostering Estimation Skills
2.1. Components of Measurement Estimation Competence
Measurement is described as “the process of comparing an attribute of a physical object to some unit selected to quantify that attribute” (Bright, 1976, p. 88), e.g., the mass of a pumpkin on the market is weighed by two-kilogram blocks and three 100 g blocks on a balance scale. Mass is the quantity in view of this paper, as most existing research refers to length, area, and volume (Cheeseman et al., 2017; Battista, 2007).
Estimation is the process whereby a student “approximates, through rough calculations, the … size of an object or quantity that is present in a given situation” (Mitchell et al., 1999, p. 9). Bright (1976) emphasized that measures are estimated when no measurement tool (ruler, balance, etc.) is used, so it involves more mental activities. Given the lack of research on students’ thinking about mass in general (Cheeseman et al., 2017), only a few studies assessed students’ estimation skills of mass measures (Corle, 1963; Swan & Jones, 1980); nevertheless, our paper on estimating mass can borrow from the much more elaborate research on estimating length (Bright, 1976; Joram et al., 1998; Weiher, 2019).
In the mental processes of estimation, the object to be estimated is compared with other objects, for which the measures are known (Joram et al., 1998), e.g., the pumpkin might weigh 2 kg as it seems equally heavy as two milk cartons. The factual knowledge of such benchmarks (familiar objects together with their known measures, such as milk cartons being 1 kg) is critical in the estimation process.
Comparison with benchmarks can be applied in different estimation strategies (Hoth et al., 2023 for lengths; Hildreth, 1983 and Joram et al., 1998 for length and areas):
- In the benchmark direct comparison strategy, a benchmark object of a similar measure as the object to be estimated is directly compared to infer an estimated measure for the object (also called reference point strategy; Joram et al., 2005).
- The unit iteration strategy can be conducted with a standard unit (or a benchmark measure used as a unit), which is iterated multiple times to approximate the object. While unit iteration involves intuitive counting for estimating length, the estimation of area and volume (and also mass) involves higher complexities as the unit iteration strategy must take into account the two- or three-dimensional relations with higher powers (Battista, 2007; Huang, 2020).
- The de-/recomposing strategy decomposes the object or reference object into smaller parts, which can then be estimated by one of the preceding strategies.
- The squeezing strategy uses a heavier and a lighter benchmark object to provide an estimate interval (Hildreth, 1983).
Empirical findings on students’ estimation skills repeatedly found limited estimation accuracy due to restricted or false strategy use, induced partly by missing benchmark knowledge (Hildreth, 1983; Hoth et al., 2023; Joram et al., 1998; Mitchell et al., 1999, all for length and areas), and mass estimates were shown to be less accurate than length estimates (Corle, 1963; Swan & Jones, 1980).
Some students also have to learn about the nature of estimation, e.g., that wild guessing is not estimation (Bright, 1976). Instead, estimation must be underpinned by “some form of reasoning” (Van de Walle et al., 2010, p. 241), relating the object in view to other objects. Furthermore, especially younger students encounter discursive challenges in explaining and justifying their strategies (Forrester et al., 1990) because they are not aware that they need to explicate their reasoning beyond guessing or because they lack the language means to express their ideas, e.g., a visualization or lexical phrases for comparing measures (Prediger, 2022).
As various studies revealed, students’ benchmark knowledge, as well as their correct and accurate application of decomposition and unit iteration strategies, depends on the size and accessibility of the objects in view: the length of small and touchable objects is estimated more successfully than that of non-touchable or larger objects, with different students excelling in the three areas (Huang, 2020; Hoth et al., 2023). The authors discuss that benchmark knowledge and challenges in unit iteration or decomposition (but also, e.g., spatial skills) can be involved in this non-unidimensionality. For mass, we can also expect challenges as objects of the same size can have different masses (depending on the material they are composed of, as stated by Cheeseman et al., 2017). When assessing students’ estimation skills, tests should therefore comprise items with both large and small, either visible/touchable or non-visible/touchable objects (Weiher, 2019).
The quality of estimation is most commonly captured by the accuracy of students’ estimates, since an “estimate is a value that is deemed close enough” (Mitchell et al., 1999, p. 9); this has been realized with different, inconsistent accuracy ranges (cf. overview in Weiher, 2023, pp. 108–109). Due to the higher complexity, it seems that much larger ranges should be applied for mass than for length (Bright, 1976; Corle, 1963).
2.2. Interventions for Fostering Strategies: Worked Examples, Cognitive Engagement, Enhanced Communication, and Scaffolding
While multiple intervention programs for fostering students’ numerical estimation skills or computational estimation skills have been reported and evaluated (e.g., Lan et al., 2010; Loretan et al., 2024; Sowder, 1992), there is a persistent research gap on intervention programs fostering measurement estimation skills. Whereas factual knowledge of benchmarks can simply be memorized and familiarized in use, research in other strategy areas suggests that the acquisition of strategies needs more explicit focus (see below).
For measurement estimation skills, early guess-and-check interventions (restricted to immediate feedback after guessing) led to higher accuracy in students’ length estimates for easy objects, but not to more successful strategy use (as reported in the review by Joram et al., 1998). Body measurements were informally shown to support 19 science education students in length estimation (G. Jones et al., 2009). In the last 25 years, we only found one solid intervention study for measurement estimation strategies; it showed that 22 third graders who received explicit strategy instruction outperformed 22 third graders in a guess-and-check intervention (Joram et al., 2005). Their explicit strategy instruction used worked examples (Renkl, 2014) for introducing benchmark comparison strategies. Since 2005, authors called for further research, yet the research gap on strategy instruction for measurement estimation skills has persisted (as problematized by M. G. Jones et al., 2012; Subramaniam, 2014).
The design of such a strategy instruction for measurement estimation instruction can be informed by empirical findings on strategy instruction in other areas. In general, strategy instruction across different areas has compared inquiry-based approaches in which students invent strategies on their own (Rathgeb-Schnierer & Rechtsteiner, 2018) with explicit strategy instruction in which students are explicitly introduced to strategies in worked examples (Renkl, 2014). For multidigit calculation strategies, Heinze et al. (2020) showed that children who received explicit strategy instruction in worked examples used elaborate strategies more frequently than children who had to invent the strategies themselves and talked about their advantages. To ensure students’ cognitive engagement, two-phase approaches, in which students start with their own inquiries before they are exposed to worked examples, were effective (Loibl et al., 2017). With respect to self-regulation strategies across subjects, the survey by Dignath and Büttner (2018) showed that explicit strategy instruction is needed, possibly after a first inquiry phase, in which own strategies are invented and discussed; however, these discussions require scaffolding and focus by the teacher (Dignath & Veenman, 2021; Durkin et al., 2017). For computational strategies, Lan et al. (2010) showed that digital environments can effectively support the students’ explicit communication about strategies when it provides scaffolds. Lexical and discursive scaffolds are particularly relevant for monolingual and multilingual students with limited language proficiency to allow them to fully exploit learning opportunities (de Araujo & Smith, 2022; Gibbons, 2002; Prediger, 2022).
In summary, the following design principles for strategy instruction are worth investigation for their transferability to the instruction of measurement estimation strategies: collecting factual knowledge on benchmarks (Joram et al., 2005), starting with an inquiry phase for inviting students to invent own strategies (Rathgeb-Schnierer & Rechtsteiner, 2018) for high cognitive engagement, followed by a knowledge organization phase (Chi et al., 1994; Loibl et al., 2017) with explicit instruction through worked examples (Renkl, 2014; Heinze et al., 2020; Dignath & Büttner, 2018) with self-explanation prompts (Chi et al., 1994). Each of the phases can be scaffolded so that all students can engage in them (Hannafin et al., 1999; Lan et al., 2010). So far, little is known how these principles can be transferred to estimation strategies on measures (Subramaniam, 2014).
3. Materials: Design of the Digital Teaching-Learning Environment for Fostering Students’ Estimation Skills for Mass Measures
3.1. Learning Trajectory of the Digital Teaching-Learning Environment
Summing up the current state of research in the previous section, well-consolidated empirical findings reveal the necessity to foster students’ estimation skills more systematically, and consensus was achieved of what this entails (benchmark knowledge and strategies). However, not only research-based interventions fostering measurement estimation skills are scarce (besides Joram et al., 2005) but also curriculum coverage: in the German context in which the current study was conducted, Hoth et al. (2023) reports that, while consolidating benchmark knowledge is an active part of the enacted curriculum, measurement estimation strategies are still not systematically taught. Hence, estimation strategy interventions are urgently needed.
We decided to develop explicit strategy training for estimation strategies. Based on the proven efficacy of digital environments for computation estimation skills in quickly informing the teacher about students’ state of learning and the digitally assisted support of student communication (Lan et al., 2010), we also developed a digital teaching-learning environment (Bielinski et al., 2024). While the digital teaching-learning environment offers material for length, area and mass, the current controlled trial focuses on mass, because mass is the most under-researched measure (Cheeseman et al., 2017; Subramaniam, 2014).
Following approaches by Sacristán et al. (2010) to structure learning opportunities in digital learning environments along a learning trajectory, we sequenced learning goals for mass estimation skills, as depicted in Figure 1. The first learning goal is to consolidate students’ factual benchmark knowledge by working towards a list of benchmarks objects to be memorized together with their mass measures. The second learning goal comprises four estimation strategies, all based on benchmark knowledge: direct comparison, unit iteration, decomposing into parts, and squeezing (Hildreth, 1983; Hoth et al., 2023; Joram et al., 1998).

Figure 1.
Examples for the three sequenced learning goals along the learning trajectory.
This goal entails the understanding of the nature of estimation being different from guessing. As revealed in the examples in Figure 1, communicat ion about strategies induces a third learning goal, namely the discourse practices of explaining the applied strategy or justifying the adequacy of the estimate, which also entails the use of lexical phrases for expressing comparisons.
3.2. Activity Settings, Inputs and Scaffolds Along the Learning Trajectory in the Digital Teaching-Learning Environment
For the first of the sequenced learning goals from the learning trajectory, the teacher cognitively engages students by collecting their individual ideas about benchmarks which are then compared and systematized into a classroom list of benchmarks to memorize. Students can complement this classroom list by their (possibly corrected) individual benchmarks in a “knowledge store” of the digital teaching-learning environment.
The first and second learning goals (using benchmarks for estimation strategies) are then addressed in light of the design principle of cognitive engagement. The strategy instruction does not directly start with an input but with students’ inquiry before instruction (Loibl et al., 2017); a brief THINK phase invites them to spontaneously estimate the weight of an object and write down how they estimate it to activate students’ own inventions (Rathgeb-Schnierer & Rechtsteiner, 2018).
All three learning goals (including reporting and explaining estimation strategies) are then addressed simultaneously in a THINK–PAIR–SHARE activity setting (Lyman, 1981). According to the principles of enhanced communication, the necessity of communication is created from separated information: each of the four students is introduced to one of the four strategies by a worked example video on a fictitious student’s strategy (Renkl, 2014; Durkin et al., 2017) and is then invited to transfer it to the second task. In the PAIR phase, the four students report their video-introduced strategies to each other (and possibly their own ones) and collectively try to use them for further tasks. In the SHARE phase, the strategies are then systematized and consolidated in a teacher-moderated whole-class discussion (working towards their general explanations and some knowledge about affordances and limitations). After that, the strategies are practiced in further examples.
As the cognitive and discursive demands of this THINK–PAIR–SHARE sequence are quite high (especially for students with limited language proficiency in the language of instruction, Prediger, 2022), the principle of scaffolding (Hannafin et al., 1999; Gibbons, 2002) guided us to support students’ processes in different regards.
- Memory scaffold. In the first estimation attempts, a list of potential benchmarks is provided to choose from, to support students in overcoming memory challenges (example in Figure 1).
- Visual (conceptual and discursive) scaffold. The balance scale is provided as a dynamic visualization (Hillmayr et al., 2020; Sacristán et al., 2010) with drag-and-drop functions for benchmarks to support students’ understanding and discursive verbalization of their comparative strategies (e.g., a benchmark is dropped twice onto the balance scale to iterate it as a unit, as shown in Figure 1).
- Discursive and lexical scaffolds: The worked examples in the input videos provide a discursive model how to explain strategies and provide lexical support by offering phrases (later sometimes explicated as sentence frames, Gibbons, 2002) to support students’ discourse practices of explaining and justifying strategies (Figure 2).
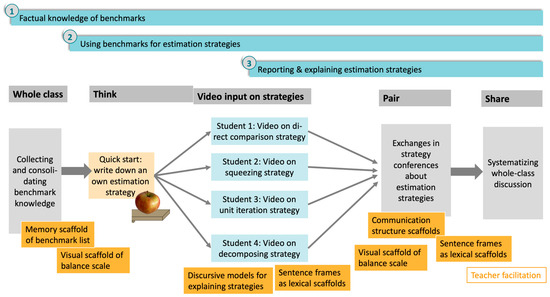 Figure 2. Activity settings for each sequenced learning goal of the learning trajectory in the intervention.
 - Communication structure scaffolds. In the PAIR phase, communication scripts lead the four students through their conversation (who speaks and who listens, at which moment?). In the SHARE phase, the teacher structures what to talk about in which moment. Teachers can also project students’ products produced in earlier phases on the whiteboard, so different digital affordances are supplied as communication scaffolds (Geiger et al., 2023).
The digital teaching-learning environment (on the platform called divomath) with different kinds of scaffolds for estimating mass measures was successively developed in iterative design experiment cycles and their qualitative analysis so that more students could engage in challenging discussions (overview in Bielinski et al., 2024). When offering scaffolds, empirical research is needed to determine what exactly to scaffold and in which degree of prestructuring (Lajoie, 2005). While highly structured scaffolds might serve some students (Gibbons, 2002; Corno, 2008), they might unnecessarily lower demands for others (de Araujo & Smith, 2022; Sacristán et al., 2010), so the effects of highly structured and regular scaffolding should be investigated.
3.3. Refined Research Questions and Hypothesis
To reduce the persistent research gap on effective interventions for measurement estimation skills (M. G. Jones et al., 2012; Subramaniam, 2014), a digital teaching-learning environment was developed to foster students’ estimation skills for mass measures. While the qualitative analysis of design experiments revealed promising learning processes, these learning gains are now captured quantitatively with the following research question:
RQ1.
How are students’ estimation skills, and how do they change after working in digital teaching-learning environments on mass units?
Beyond this descriptive research question, the current quantitative efficacy study evaluates the effects on students’ measurable learning gains with the following question:
RQ2.
To what extent can students’ estimation skills be effectively fostered in digital teaching–learning environments that guide students’ scaffolded communication to provide explicit yet cognitively demanding strategy instruction?
As scaffolds can be highly structured or more open (Corno, 2008; de Araujo & Smith, 2022), a particular research interest is in disentangling the potential effects of highly structured scaffolds on different sub-scales of estimation skills.
RQ3.
To which sub-learning goals of estimation skills can highly structured scaffolds contribute more effectively than regular scaffolds?
4. Methods of the Trial
4.1. Overview on the Research Design
To pursue the research questions under ecologically valid conditions, a class-wise randomized controlled trial was conducted with 14 classes, with a total intervention sample of n = 310 students who completed the pretest and posttest. As an advance organizer, Figure 3 presents the pre-post-control group design with three treatment conditions to which classes were randomly assigned, using estimation skills as the dependent variable. In the following subsections, the methods of data gathering and data analysis are described.
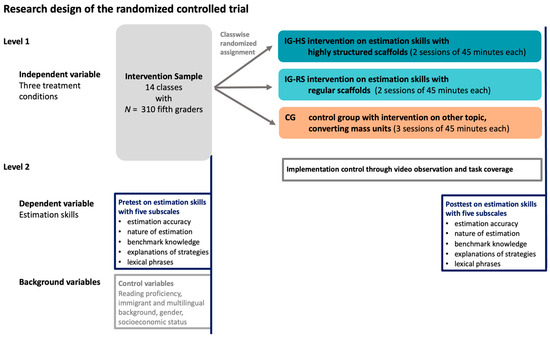
Figure 3.
Research design of the class-wise randomized controlled trial.
4.2. Dependent Variables: Treatment Conditions with Regular and Highly Structured Scaffolds
Three treatment conditions were compared as dependent variables: classes in all three conditions worked in a digital teaching-learning environment on mass units (with 22–32 students each), but only the classes in the intervention groups worked on estimating mass measures.
The control group, CG, also worked in a digital teaching-learning environment, but on another aspect of mass units, namely understanding mass unit conversions. This way, the motivational effects of working with digital environments were kept constant, and familiarity with mass units and explanations was also achieved, albeit without explicit learning opportunities on benchmarks or estimation.
Both intervention groups worked in digital teaching-learning environments along the learning trajectory on the estimation of mass measures, as detailed in Figure 1, with two kinds of scaffolds, which are exemplified in Figure 4.
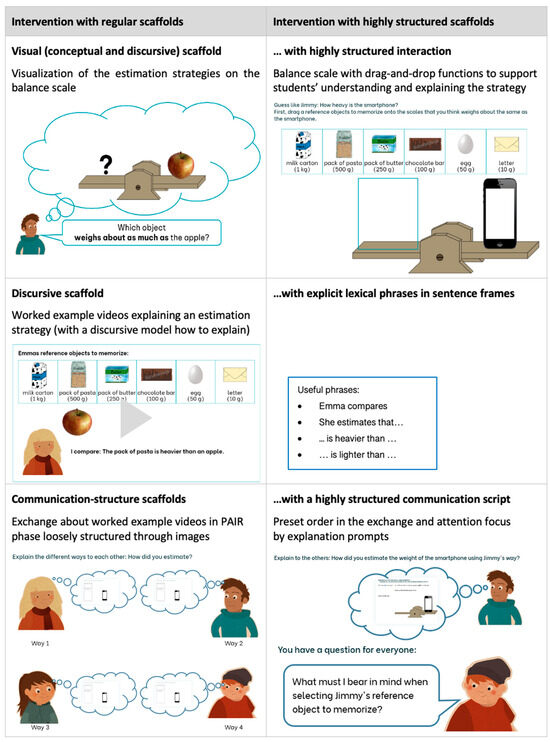
Figure 4.
Differences between intervention IG-RS with regular scaffolds and intervention IG-HS with highly structured scaffolds, both in divomath teaching-learning environments.
- Classes in the intervention group IG-RS with regular scaffolds worked through the learning trajectory and activity settings, as detailed in Figure 2, and only sentence frames as structured lexical scaffolds were not explicitly provided.
- Classes in the intervention group IG-HS with highly structured scaffolds worked through the same learning trajectory and activity settings, as detailed in Figure 2, but the scaffolds for the THINK and PAIR phases were consistently more structured. Figure 4 provides examples for the scaffolds and the differences through higher degrees of structuring for assuring adaptivity for students with lower language proficiency (Corno, 2008; Gibbons, 2002).
The classes of the intervention and control groups were taught by carefully prepared research-near teachers (from the university group) who were new to the classes but assured the comparability of the interventions. Treatment fidelity was controlled by video recordings and revealed the complete intended task coverage in all groups.
4.3. Measures for Dependent and Background Variables
Before and after working on the digital teaching-learning environments, several instruments were administered.
4.3.1. Dependent Variables: Estimation Skills in Pretest and Posttest
A 17-minute test of estimation skills with 28 items was conducted as a pretest and posttest with five sub-scales which cover different sub-learning goals in multi-faceted ways. Example items are documented in Figure 5.
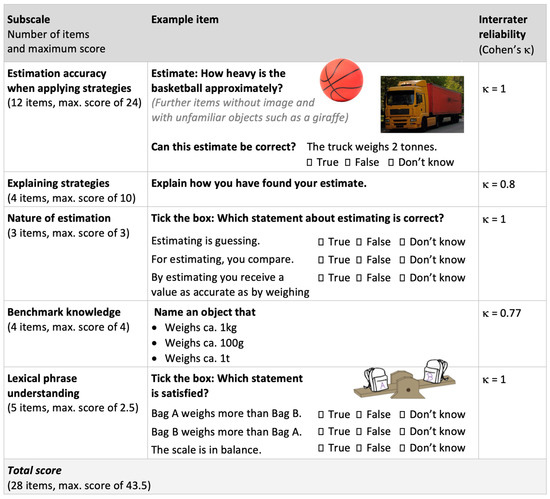
Figure 5.
Sub-scales with example items of the pretest and posttest on estimation skills.
- For the estimation accuracy of mass measures, the test adopted 12 items from other studies on length estimation to cover the estimation of mass of familiar and less familiar objects, with images or without (Bright, 1976; Hoth et al., 2023; Weiher, 2019). Six items demanded open estimations, and they were rated with a score of 3 when the accuracy was ±25%, a score of 2 for ±50%, a score of 1 for ±75%, and a score of 0.5 for –90% to + 1000% (i.e., within the range of factor 10). Four items asked for selecting among four estimates with the same scoring for accuracy intervals, and two items for agreeing/rejecting to a given estimate.
- Explaining strategies. For 4 out of the 12 accuracy items, students were asked to explain estimation strategies, in 2 items for open estimations and in 2 items for selections of given estimates. As we have not found any test in which written explanations of estimations were rated, we developed a rating system for mathematical correctness and the discursive elaboration of the argument according to the argumentative scheme of Toulmin (1969) with data, warrant, and conclusion. The explanation is structured as follows: (a) starts from helpful information or an explicit benchmark (datum); (b) substantiates the argumentation by explicating lexical phrases for comparing masses (warrant); (c) makes sense in itself and allows a conclusion to be drawn about a specific estimate (conclusion).
In total, a maximum score of 10 could be reached for explaining strategies. Inter-rater reliability was tested for 20% of the data and reached Cohen’s κ = 0.8. Beyond these scores, the explanations were also coded with respect to the articulated strategies to trace how the strategies developed from pretest to posttest; we coded no explanation of strategy and guessed and estimated without an explicit benchmark (e.g., “it looks like” and “because it is empty”), known by heart (e.g., “my father told me” and “I know the weight”), and an explicated estimation strategy comparing with benchmarks (i.e., the four target strategies from Figure 1).
- Nature of estimation. Students’ understanding of the nature of estimation, which was found to be relevant in qualitative studies, was assessed by three multiple-choice items asking for the correctness of meta-statements (in Figure 5), with a maximum score of 3.
- Benchmark knowledge. Following Bright (1976), students’ benchmark knowledge was tested with four items demanding students to name objects of given weights such as 1 kilogram. Students’ benchmarks were rated as fitting or unfitting with a tolerance of ±25% so that a maximum score of 4 could be reached. Inter-rater reliability was tested for more than 20% of the data and reached Cohen’s κ = 0.77.
- Lexical phrase understanding. To make sure students’ explanations were not hindered by their understanding of the balance scale as visualization and the lexical phrases needed to articulate comparisons, five multiple-choice items measured understanding by asking students to evaluate the correctness of comparative phrases about a balance scale situation, with a maximum score of 2.5.
These five sub-scales of estimation skills are intended to cover relevant aspects and their preconditions, without considering them as unidimensional. Earlier studies have shown that estimation accuracy is not one-dimensional (Huang, 2020; Hoth et al., 2023), and this was also reflected by the limited internal consistencies of Cronbach’s α = 0.53 for estimation accuracy, only α = 0.3 for benchmark knowledge, and α = 0.46 for explaining strategies (due to a high rate of non-responses). Acceptable was α = 0.63 for the nature of estimation, and very good α = 0.90 for understanding lexical phrases. In total, the complete test reached an acceptable internal consistency of α = 0.76.
According to the state of research, the sub-scales can also not be assumed as independent dimensions as the underlying cognitive models argue about the dependency of sub-learning goals (Joram et al., 1998; Hoth et al., 2023). Table 1 documents the correlations between the sub-scales. It confirms the state of research on estimating length that students’ estimation accuracy is correlated to students’ understanding of the nature of estimation (r = 0.364 ***), benchmark knowledge (r = 0.340 ***), and even understanding of lexical phrases (r = 0.240 ***), while the discursive demand of explaining strategies seems to be independent (r = 0.045). The highest correlation occurs between understanding the nature of estimation and understanding lexical phrases (r = 0.494 ***), whereas the understanding of lexical phrases does not correlate with their discursive embedding in explaining strategies (r = 0.052). These moderate (even if highly significant) correlations only show again why unpacking into several sub-scales might be beneficial to disentangle effects.

Table 1.
Correlations between sub-scales of the estimation skill pretest (Pearson’s r).
4.3.2. Measures of Background Variables
One reading proficiency test and a self-report questionnaire were administered for the background variables:
- Reading proficiency. As mathematical learning gains are often closely linked to reading proficiency (Paetsch et al., 2016), we administered the ELFE II sentence-level test, a standardized reading test covering reading speed and comprehension. In the standardization sample, the scale had high internal consistency (with Cronbach’s α > 0.90) and a retest reliability of r = 0.93 (Lenhard & Schneider, 2006).
The following background variables were chosen according to their relevance predicting achievement in the German school context in large-scale studies (OECD, 2023). They were collected in students’ self-report questionnaires preceding the pretest:
- Gender. As the German school context continues to produce a small (yet significant) gender gap in mathematics achievements (OECD, 2023, p. 33), the questionnaire captured self-identified gender by asking “Are you a girl/a boy/diverse/no answer”.
- Multilingual background. Students were asked for the languages spoken at home. Multilingual background was coded for students who reported to speak multiple family languages (or one non-German family language).
- Immigrant background. Students were asked for their and their parents’ countries of birth. Second-generation immigrant background was coded when one of their parents or the students themselves immigrated.
- Socioeconomic status. The family socioeconomic status was captured by the book-at-home index, which has proven to be an economic and reliable instrument (r = 0.80; Paulus, 2009). Low socioeconomic status was assigned to all students whose families have max. 100 books and high socioeconomic status for more than 100 books.
4.4. Sampling and Samples
The trial used a class-wise randomized assignment of classes to treatment conditions, not a student-wise randomized individual assignment. This quasi-experimental (rather than experimental) assignment procedure was applied to keep the learning groups intact for (a) increasing ecological validity, (b) assuring more intense communication among peers than in unfamiliar constellations (since engaging students in communication was one of the main goals), and (c) reducing classroom management challenges with the newly introduced digital technologies.
The class-wise randomized controlled trial started with an initial sample of originally 17 classes in grade 5 (students aged 10–12 years). These classes were randomly assigned to the three treatment conditions (see Figure 3) with an approximately equal distribution of students. Due to illness of teachers and other practical complications in the data gathering period, two classes of the intervention group IG-RS with regular scaffolds and one control class dropped out, so the trial had to be continued with an unequal distribution of students in the three treatment groups, as documented in Table 2. From originally 370 students in the remaining 14 classes, we included those n = 310 students in the intervention sample who completed the pretest and the posttest and whose parents gave written informed consent for the use of the anonymized data for research purposes.
Table 2.
Descriptive characteristics of the intervention sample and the three treatment groups.
Table 2 documents the descriptive characteristics of the three treatment groups in all relevant background variables. Chi2 tests for the background variables revealed a lower percentage of students with multilingual background and low socioeconomic status present in the control group (with both p = 0.005), but gender and immigrant background show no significant difference in pairwise comparisons between the groups (all p > 0.05). Welch tests identified higher reading proficiency in the control group (with p < 0.001) and higher results in the pretest scores compared to IG-RS (Tamhane’s-T2 p = 0.09). In total, the control group started with slightly better prerequisites.
4.5. Methods of Statistical Analysis
To pursue the descriptive research question RQ1, all student answers were rated, and scores were descriptively compared between the three treatment groups. For comparing the learning gains in sub-scales, intra-group effect sizes d were determined by normalizing the mean differences through the standard deviation (pretest across three groups). d is considered small when below 0.50, medium between 0.50 and 0.80, large between 0.80 and 1.2, and very large above 1.2. However, large effects can hardly be expected in short-term interventions in randomized trials (Cheung & Slavin, 2016).
Research questions RQ2 and RQ3 were treated by testing the following hypotheses:
H2a.
Learning outcomes in estimation skills are higher in the intervention groups than in the control group.
H2b.
Students with underprivileged socioeconomic, multilingual, and immigrant backgrounds profit equally from the intervention for their estimation skills.
H3a.
Students’ estimation skills benefit more from highly structured scaffolds than from regular scaffolds.
H3b.
In the sub-scale of explaining strategies, students benefit more from the intervention with highly structured scaffolds than from the control group and the intervention with regular scaffolds.
For testing these hypotheses, we calculated linear mixed models to account for the non-independence of our data. Before conducting the analyses, we considered the possibility of a higher multilevel structure to account for potential class effects from the 14 classes in the sample. However, the intraclass correlation coefficient (ICC) was very low (0.02), indicating that there were minimal variations between the levels of analysis, particularly regarding how much variance was explained by measurement repetitions, individual differences, and class differences. As a result, significant clustering effects were not detected, and including the class structure as a third level in the hierarchical regression model was deemed unnecessary.
This led us to decide on a two-level linear mixed model approach, with treatments and time between repeated measurements deemed as the group level and within students as the individual level. In the linear mixed models, we investigated the effects of the three treatment groups (control group CG, intervention group with regular scaffolds IG-RS, or intervention group with highly structured scaffolds IG-HS) on learning gains in estimation skills over time.
To control individual differences in the pretest scores, we set student as random effect, resulting in a random intercept for each individual. Individual differences within repeated measurements were accounted for by choosing the repeated measurement design in SPSS. In addition, both interaction terms, time × participation, in IG-RS or IG-HS were also included in the model to allow for group-specific learning gains over time. Therefore, we had to include time (0–1 coded) and participation in IG-RS or IG-HS, respectively, dummy-coded with control group CG as reference, as additional variables in the models. As fixed effects on the individual level, we entered several time-invariant predictors: gender, multilingual background, immigrant background, socioeconomic status, and reading proficiency.
Given the model structure, the intercept can easily be interpreted as a global mean when all other variables are zero. We tested the assumptions of a linear mixed model—normality of residuals, absence of collinearity, and homoscedasticity—following the guidelines of Meteyard and Davies (2020). Normality was assessed through the visual inspection of QQ-plots, while homoscedasticity was evaluated using residual plots. The absence of collinearity was confirmed by calculating the variance inflation factor (VIF). All assumptions were met. We grand-mean-centered values for reading proficiency before starting the modeling process.
Successive modeling was conducted with SPSS (IBM SPSS Statistics, Version: 28.0.1.0; 142), with ML estimation starting from a random-effect-only model to more complex mixed models with a scaled identity type of covariance for repeated measurements and unstructured covariance for random effects, allowing for the assumption-free estimation of covariances and, thus, highest flexibility. No convergence issues were faced during modeling.
Successive models were compared based on AIC, BIC, and LL (Appendix A for the comparison of different models). p-values were obtained using likelihood ratio tests on the full model against the null model. The final models were then recalculated with REML estimation to obtain more precise variance estimates (Meteyard & Davies, 2020).
Given the unequal group sizes of the three treatment groups, we also conducted propensity score matching, which reduced the three treatment groups to equal sizes of 50 each. All following analyses were also conducted with the matched data sets, and they revealed parallel results. For reasons of transparency, completeness, and test power, we decided to report the analysis with the full data set of the complete intervention set.
5. Results
5.1. Descriptive Findings on Learning Gains in Different Sub-Scales
The descriptive research question RQ1 (How are students’ estimation skills, and how do they change after working in digital teaching-learning environments on mass units?) can be disentangled into the sub-scale estimation accuracy and explaining strategies, as well as their precondition nature of estimation, benchmark knowledge, and lexical phrase understanding. Table 3 presents the descriptive data in all five sub-scales for the three treatment groups, which are first discussed with respect to the difference between the control and intervention groups, and in Section 5.3, with respect to differences between the two intervention groups.
Table 3.
Changes in students’ estimation skills from pretest to posttest—descriptive data for the three treatment groups in five sub-scales and intra-group effect sizes d.
5.1.1. Pretest Scores
The pretest scores on the estimation accuracy sub-scale document that, in all three groups, students obtained less than 30% (mean scores of 6.43 to 7.96, out of the maximum score of 24), i.e., the majority of estimates were inaccurate (an additional analysis revealed that, on average, students overestimated the mass by 460%). The low pretest scores for explaining strategies (mean scores of 0.56 to 1.41, out of max. 10) indicate that only very few students explicated the target strategies, while many relied on guessing; explained other non-targeted strategies without benchmarks; or did not explain their ideas (see below for further unpacking). Many students misunderstood the nature of estimation (mean scores of 0.95 to 1.18, out of max. 3) and had fragile benchmark knowledge (0.57 to 0.67 out of 4). In contrast to all these low mean scores, the understanding of lexical phrases were students’ assets in the pretest (mean scores of 1.49 to 1.57 out of 2.5).
5.1.2. Descriptive Changes from Pretest to Posttest Scores in the Sub-Scales
In the total scores of the posttest, substantial learning gains were found for the intervention groups IG-HS and IG-RS (with very large intra-group effect sizes of d = 1.23 in both intervention groups), yet a small effect size in the control group CG (d = 0.50). These differences between the control group and intervention groups are shown to be significant in Section 5.2.
The control group (who worked in a digital teaching-learning environment on converting mass units but not estimation) had no learning effect in estimation accuracy (d = 0.28), and even a negative one in explaining strategies (d = −0.18). The retest effects might account for a small effect size in understanding the nature of estimation with only three possibilities (d = 0.59), while the small effect sizes in benchmark knowledge and understanding lexical phrases might be traced back to some learning opportunities in the alternative treatment.
In contrast, in the intervention groups, the effect sizes differed substantially between the sub-scales. The benchmark knowledge in the intervention groups increased with very large effect sizes (d = 1.48 in IG-HS and d = 1.60 in IG-RS). The quality of explaining strategies increased with large effect sizes (d = 1.18 in IG-HS and d = 0.92 in IG-RS) and outstanding differences from the control group (d = −0.18). Estimation accuracy increased with comparable medium effect sizes (d = 0.56 in IG-HS and d = 0.69 in IG-RS) but still did not reach 50% of the maximum score. Medium effect sizes were also found in the understanding of the nature of estimation (d = 0.77 in IG-HS and d = 0.68 in IG-RS), while the understanding of lexical phrases might have had ceiling effects with only small effect sizes (d = 0.54 in IG-HS and d = 0.44 in IG-RS).
5.2. Efficacy of the Intervention
For evaluating the efficacy of explicit strategy instruction in the two intervention groups, according to research question RQ2, two hypotheses H2a and H2b were articulated. For testing the hypotheses while controlling for relevant background variables, linear mixed models with repeated measurements nested within subjects were determined with students’ pre- and posttest scores as dependent variables. Table 4 shows the estimates derived from the full model. Random effects of time and individual student level accounted for more than 25% of the variance in the data, representing a large change in scores over time, as well as substantial individual differences between learners (both with p < 0.001).
Table 4.
Linear mixed model (REML) for predicting students’ learning outcomes with respect to various background variables and treatment groups.
With respect to Hypothesis H2a (hypothesizing that learning outcomes in estimation skills are higher in the intervention groups than in the control group), the model in Table 4 reveals that the main effect of time was highly significant (p < 0.001), with test scores significantly increasing from pre- to post-test. In accordance with the descriptive data, participants of IG-RS and IG-HS seemed to show slightly lower pre-test scores than the CG, but not with statistical significance (both p > 0.05). The interaction term between time and participation in either one of the intervention groups revealed strong significant effects (both p < 0.001), indicating that both interventions resulted in substantially increased learning gain when compared to the CG. The estimates of 3.544 for participation in IG-RS × time and 3.847 for participation in IG-HS × time can be roughly interpreted as the average higher learning gains in the intervention groups after controlling for the other variables.
With respect to Hypothesis H2b (hypothesizing that students with underprivileged socioeconomic, multilingual, and immigrant backgrounds profit less from the intervention for their estimation skills), the model confirms the tendencies identified in Table 3 that students in both intervention groups had significantly higher learning gains than the control group. As estimates for both interaction terms are significant, Hypothesis H2a is confirmed.
In the same linear mixed model, students’ background variables were included, out of which only two were significant predictors. On average, female students scored 2.6 lower than their male classmates (p < 0.001), whereas an increased reading proficiency of one standard deviation predicted a 0.326 higher posttest score with strong significance (p < 0.001) yet low effect size. Meanwhile, migration background, multilingual background, and socioeconomic status had no significant effect on the posttest scores.
This means that Hypothesis H2 can be rejected: contrary to what was expected, students with underprivileged socioeconomic, multilingual, and immigrant backgrounds profit as much from the intervention as their more privileged peers for their estimation skills.
5.3. Comparing the Two Intervention Groups
5.3.1. Overall Benefits for the Total Test Score
Both interventions have shown significant efficacy for students’ learning gains in estimation skills. As research question RQ3 asks for the additional effects of the highly structured scaffolds, we compared the two intervention groups in this section.
For testing Hypothesis H3a (hypothesizing that students’ estimation skills benefit more from highly structured scaffolds than from regular scaffolds) while controlling for relevant background variables, a linear mixed model was determined for predicting students’ learning outcomes in the total posttest score (Table 5), albeit without the control group this time, only comparing the two different intervention groups with regular or highly structured scaffolds. Random effects of time and individual student level accounted for more than 24% of variance in the data. The effects of gender and reading proficiency remained strongly significant (both p < 0.001).
Table 5.
Linear mixed model (REML) predicting the learning outcomes for the total post-test score for comparing the intervention group IG-HS with highly structured scaffolds to the intervention group IG-RS with regular scaffold (without control group CG).
The estimate for participation in IG-HS reflects the slightly but not significantly better average pretest score compared to IG-RS (p > 0.05). Also, the learning gain from pre- to post-test was slightly steeper in IG-HS, again without statistical significance. Through this method, Hypothesis H3a cannot be formally confirmed by the data.
5.3.2. Changes with Respect to Benchmark Knowledge and Explaining Strategies
The descriptive data in Table 3 revealed that learning gains were equally high with very large effect scores in both intervention groups (d = 1.23 for both). However, increases seemed to have occurred in different sub-scales: students tended to have increased their benchmark knowledge slightly less in the intervention group with highly structured scaffolds than in the group with regular scaffolds (d = 1.48 in IG-HS and d = 1.6 in IG-RS), yet both with large effect sizes.
The largest difference between the two intervention groups occurred with respect to the quality of explaining strategies, which increased with large effect sizes, but were visibly larger in the intervention group with highly structured scaffolds (d = 1.18 in IG-HS) than in the intervention group with regular scaffolds (d = 0.92 in IG-RS in Table 3). This seems to resonate with Hypothesis H3b (hypothesizing that students benefit more from the intervention with highly structured scaffolds in the sub-scale of explaining strategies than from the control group and the intervention with regular scaffolds).
To formally test H3b, the third and fourth linear mixed models were determined for the sub-scale explaining strategies, including the same fixed and random effects as in the initial models. In Table A1 (in the Appendix A), the interventions groups were compared with the control group as a reference group (as in Table 4); in Table A2 (in the Appendix A), the intervention groups were compared to each other without the control group (as in Table 5), both for the sub-scale of explaining strategies.
When comparing intervention groups IG-HS and IG-RS to the control group (Table A1 in the Appendix A), similar to the overall test scores, pretest scores in explaining strategies were, on average, lower than in the CG (with p = 0.06 and p < 0.001). Similarly to the model for the total posttest score, learning gains on explaining strategies over time were significantly higher in students participating in either IG-RS or IG-HS (both p < 0.001). Considering the descriptive data and the estimate for time in this model, we concluded that only participants of IG-RS and IG-HS increased their test scores in explaining strategies, whilst test scores of CG decreased over time. Interestingly, neither one of the fixed predictors had a significant effect on this.
In Table A2 (in the Appendix A), no significant difference could be detected between the pretest scores of the two intervention groups (p = 0.580), with both groups significantly increasing their score from pretest to posttest (p < 0.001). While participants of IG-HS showed slightly higher learning gains in the descriptive comparison shown in Table 3, this difference was not significant in the linear model of Table A2 (p = 0.196). Random effects only explained 3.5% of variance.
In total, the first part of H3b can be confirmed, but the second cannot. In the sub-scale of explaining strategies, students benefit significantly more from the intervention with highly structured scaffolds than from the control group, but not significantly more than from the intervention with regular scaffolds. This calls for further unpacking of the changes in strategy explanations.
5.3.3. Unpacking the Changes in Strategy Explanations
To further unpack students’ learning gains on the sub-scale of explaining strategies, we zoom into one of its items that asked students to explain their mass estimation of a basketball (item in Figure 4). This sub-scale was chosen as the explanations count as a challenging part of the estimation skills, and the highly structured scaffolds in IG-HS especially supported these explanations. Through unpacking different strategies, the affordances and limitations can be better understood. The findings for the chosen item are comparable to the other items on the sub-scale.
Figure 6 visualizes the relative frequencies of codes for the 310 explanations in the pretest and posttest. For each of the treatment groups, these changes were statistically assessed using McNemar’s χ2-tests with continuity correction and two-tailed p values.

Figure 6.
Zooming into one explanation item: different learning gains between three treatments. (Note. * for increases with p < 0.05, *** for p < 0.001).
The control group started with more explicated estimation strategies based on comparing benchmarks than both intervention groups (16% in CG compared to 7% in IG-HS and in IG-RS). With 14% in the CG posttest, it stayed on a similar level. In contrast, the intervention group with regular scaffolds increased the frequency of explicated estimation strategies by a factor of 3.3, a significant increase (from 7% to 23% for IG-RS; Z = 2.250; p = 0.024 *), and the intervention group with highly structured scaffolds even by a factor of 4, a highly significant increase (from 7% to 28%; Z = 3.951; p < 0.001 ***).
Slight differences occurred with respect to non-explanations, which were reduced without statistical significance (from 23% to 20% in IG-HS; Z = 0; p = 1; and from 22% to 13% in IG-RS; Z = −0.866; p = 0.386). With respect to guessing, the highly structured scaffolds led to a significant reduction (from 22% to 13% in IG-HS; Z = 2.121; p = 0.034 *), whereas the group with regular scaffolds had a non-significant reduction (from 12% to 5% in IG-RS; Z = 1.225; p = 0.221).
The same tendencies occurred in the other three explanation items: the reduction in students who gave no explanation was comparable or minimally stronger for the intervention group with regular scaffolds, while the appropriateness of explanations (less guessing and more explicit explication of one of the target strategies) increased more in the intervention group with highly structured scaffolds.
6. Discussion
6.1. Summary and Embedding of Findings
6.1.1. Multidimensional Structure of Estimation Skills
Measurement estimation is challenging for children, and estimation skills have a multidimensional structure (Bright, 1976; Joram et al., 1998; Mitchell et al., 1999; Weiher, 2019; Hoth et al., 2023). These repeated findings from earlier studies were replicated in our pretest with respect to mass measure estimation, a quantity known to be less familiar to students than length (Swan & Jones, 1980; Cheeseman et al., 2017). In our pretest, only 10% of the demanded explanations explicated the estimation strategies by comparing with benchmarks, while 12% guessed and 29.5% gave no explanation. Estimation accuracy was very low; on average, children overestimated the mass by 460%. The (relatively low yet significant) correlations between the five sub-scales (Table 1) indicate that mass estimation skills are also not a unidimensional construct, but rather composed of several, intertwined knowledge domains and understandings.
6.1.2. Overall Efficacy of Fostering Estimation Skills
The main conclusion that this paper can contribute to the state of research is that estimation skills can be fostered with very large intra-group effect sizes (of d = 1.23), even in only 90-min interventions (Table 3), which was larger than usual in in educational short-term studies (Cheung & Slavin, 2016). When controlling for background variables in the linear mixed models, students in the two intervention groups showed highly significantly larger learning gains in estimation skills than in the control group, who also worked in a digital teaching-learning environment on mass units, but not on estimation (Table 4). For the first time since the intervention study on length estimation by Joram et al. (2005), and for the first time on mass estimation, empirical evidence for the efficacy of an intervention on mass estimation skills was, therefore, provided so that we can close an important research gap (M. G. Jones et al., 2012; Subramaniam, 2014). Beyond the overall evidence of efficacy, this study contributes to disentangling the evidence with respect to relevant (a) background variables, (b) scaffolds as key design features, and (c) sub-scales of estimation skills profiting from highly structured scaffolds.
6.1.3. Compensating Background Variables for a More Equitable Intervention
Two background variables repeatedly occurred in the linear mixed models (Table 4, Table 5, Table A1 and Table A2) as predictive for the learning outcomes, gender, and reading proficiency. Female students repeatedly showed slightly disadvantaged learning outcomes in the German school system (OECD, 2023), and this culturally stable effect could not be compensated in our intervention as well. The effect of reading proficiency is plausible as students were asked to read the worked examples and tasks in a digital teaching-learning environment, which is challenging for slow readers. In the future, the worked example videos should not be silent videos but also offer sound to compensate for this effect (even if it requires more technical equipment of headphones in classrooms). In contrast, the background variables, multilingual background, socioeconomic status, or immigrant background, which often contribute to the inequity of the German school system (OECD, 2023), seem to have been successfully compensated by the language-responsive design providing lexical and discursive scaffolds without lowering conceptual demands (de Araujo & Smith, 2022; Prediger, 2022).
6.1.4. Scaffolds as Key Design Features
In the design of the digital teaching-learning environment, we combined own strategy invention in the initial phase (Rathgeb-Schnierer & Rechtsteiner, 2018) with explicit strategy instruction through worked examples (Heinze et al., 2020; Durkin et al., 2017) and explicit communication about the strategies (Dignath & Veenman, 2021) in the systematization phase. For computational strategies, digital teaching-learning environments were shown to support students’ explicit communication about strategies (Lan et al., 2010), so we also developed a digital teaching-learning environment and substantially invested in determining the different kinds of scaffolds that can support student processes of understanding, applying, and explaining strategies (Bielinski et al., 2024; according to Hillmayr et al., 2020; Sacristán et al., 2010). While memory scaffolds (with knowledge storages for benchmark objects) and visual (conceptual and discursive) scaffolds were equally introduced in both teaching-learning environments (see Figure 2), the two versions used regular or highly structured scaffolding for the discursive and lexical scaffolds, including communication structure scaffolds (Figure 4).
We hypothesized that highly structured discursive and lexical scaffolds might better enhance students’ learning. This hypothesis had to be rejected for the overall learning gains, which held exactly the same effect sizes for regular and highly structured discursive and lexical scaffolds for the total test scores.
6.1.5. Sub-Scales of Estimation Skills Profiting from Highly Structured Scaffolds
The analysis then focused on one sub-scale, namely explaining strategies, for which the effect sizes were descriptively higher for the intervention with highly structured scaffolds than with regular scaffolds (Table 3), but the linear mixed model comparing IG-HS and IG-RS did not provide significant effects (Table A2). The disentanglement of effect sizes for different ways of explaining strategies (in Figure 6) revealed modest indications for one item (and similar phenomena in the other items). With caution, we dare to assume that these modest indications of the descriptively findable effect size might potentially stabilize into measurable significance of differences to the regular scaffolds, when the intervention will be extended to more time than only 90 min and implement more routinization in students’ communication. So far, significant evidence has not yet been given for the additional value of the highly structured scaffolds compared to the regular scaffolds, but the descriptive findings can still cautiously inform further design decisions; however, future research is still required.
6.2. Methodological Limitations and Future Research
Although this study reveals very interesting findings, these must be interpreted with caution due to methodological limitations. First, the intervention design was limited by relatively unexperienced teachers (although well prepared by the university team) who were not familiar with the classes, so they might not have fully exploited the potentials of the digital teaching-learning environment or compensated missing structures in the IG-RS by oral scaffold. In the future, the classroom videos should be analyzed to examine whether additional oral scaffolds were provided in the IG-RS so that its enactment was nearer to IG-HS than intended.
Second, the unequal group sizes and drop-outs in three classes reduced the statistical power of the data. To avoid bias in the findings, we conducted an alternative data analysis with propensity score matching, which yielded comparable results. In future replication studies, larger group sizes should be planned so that more effects can become significant. The disentanglement of one item (in Figure 6) might look like cherry picking, but we can confirm that, at least within our test, the other items also showed a similar pattern.
Third, the fact that the class-wise randomization procedure only distributed 14 classes to three treatment conditions is a limitation compared to randomized assignments of individual students, which was taken into account to keep the learning groups intact. Although the two-level model tried to minimize the influence of potential factors on the class level (such as group dynamics or teacher quality), future studies might aim for a student-wise instead of class-wise randomized design.
Fourth, the short time of the intervention (restricted to 90 min) does not allow for capturing long-term learning gains, and, in particular, the benefits of highly structured communication scaffolds might only unfold in longer terms, so future studies should try to replicate the findings with larger sample sizes and a longer intervention period.
Fifth, the findings might have been biased by only gathering and analyzing students’ written explanations. Even in the posttest, 30% of the students did not write explanations, although they might have had good justifications for their estimations in mind, so students’ estimation strategies might be systematically underscored. This limitation becomes apparent when comparing the written data with earlier interviews capturing students’ oral explanations in which the explanations were richer. Future intervention studies should, therefore, try to capture oral explanations more systematically to increase the validity of student assessments.
Finally, the reported findings are tightly connected to the particular teaching-learning environment and urgently need to be investigated for transferability (a) to other measures to be estimated such as length and areas, (b) to older students, and (c) to other classrooms to see whether the digital teaching-learning environment also works in scaled-up effectiveness studies under more ecologically valid conditions, with a larger group of teachers less acquainted with the university team (Wortman, 1983).
7. Conclusions with Implications for Classrooms
Within the discussed methodological limitations, this study provides highly interesting evidence that even a short-term intervention of 90 min can significantly foster fifth graders’ estimation skills and that this is necessary as initial estimation skills were low. As a consequence, we hope to implement the digital teaching-learning environment (or the underlying approach) in as many schools as possible. Beyond the concrete teaching-learning environment, its design principles of combing initial inquiries with explicit strategy instruction and structured communication about strategies can also be promising for other strategy instruction programs.
The combination of high conceptual demands and carefully designed support through different scaffolds can also be transferred to other programs. In planning these scaffolds, the integration of mathematical and language-related aspects should continue to be a guiding principle (Gibbons, 2002; Prediger, 2022). This way, students’ communication skills and language proficiency can be developed so that they can profit more from communication opportunities for their mathematical learning (Prediger, 2022; Paetsch et al., 2016).
Nearly 50 years after Bright (1976) emphasized fostering estimation skills as an important yet long-term task. Our teaching-learning environment offers a promising starting point to equip learners with the necessary tools for making estimates and to strengthen their estimation abilities. After this initial introduction, the estimation of measurement should be continuously addressed, drawing on the previously identified benchmarks and estimation strategies.
Author Contributions
Conceptualization, S.P. and N.P.; design of learning environment, N.P. and S.P.; data gathering and data curation, N.P.; methodology, validation, formal analysis, S.P., N.P. and J.W.; writing—original draft preparation, S.P. and N.P.; writing—review and editing, S.P., N.P. and J.W.; visualization, supervision, funding acquisition, S.P. All authors have read and agreed to the published version of the manuscript.
Funding
The design research project divomath was funded by the State Ministries of Education of North Rhine-Westphalia and Brandenburg (grant to S. Prediger/C. Selter) and the controlled trial conducted and analyzed for the project Startchancen (BMBF grant 01PL2401C to S. Prediger).
Institutional Review Board Statement
This study was conducted in full accordance with the Declaration of Helsinki of 1975 (on the ethics of the intervention with humans) and in cooperation with the State Department of Education of North Rhine-Westphalia. State authorities (FWU Medieninstitut der Länder and Datenschutz Nord) carefully controlled and approved that the digital teaching learning environment divomath fully complies with privacy and data security standards of the General Data Protection Regulation of the European Union. No other data than anonymous data in the digital teaching learning environment were used.
Informed Consent Statement
Written informed consent was obtained from all teachers and all students’ parents in this study.
Data Availability Statement
The data sets used and analyzed during the current study are available from the corresponding author upon reasonable request in the original German language.
Acknowledgments
We thank our project partners, especially C. Selter, M. Abraham, and S. Bielinski, as well as a huge team of student research helpers, especially V. Krishnar and D. Nunes Matias, who supported the data gathering and data analysis process. We thank Anke Wischgoll for the productive support in preparing the teaching.
Conflicts of Interest
The authors declare no conflicts of interest.
Appendix A
Table A1.
Linear mixed model (REML) predicting the learning outcomes in explaining strategies for comparing intervention groups to control group.
Table A1.
Linear mixed model (REML) predicting the learning outcomes in explaining strategies for comparing intervention groups to control group.
| Fixed Effects | Estimate | Standard Error SE | 95% Confidence Intervals | t | p |
|---|---|---|---|---|---|
| Intercept | 1.221 | 0.263 | 0.704–1.738 | 4.648 | <0.001 *** |
| Time | −0.256 | 0.171 | −0.592–0.081 | −1.495 | 0.136 |
| Group level | |||||
| Participation in IG-RS | −0.565 | 0.299 | −1.153–0.023 | −1.889 | 0.06 |
| Participation in IG-HS | −0.805 | 0.240 | −1.277–−0.333 | −3.349 | <0.001 *** |
| Participation in IG-RS × time | 1.345 | 0.316 | 0.723–1.966 | 4.259 | <0.001 *** |
| Participation in IG-HS × time | 1.866 | 0.259 | 1.356–2.376 | 7.200 | <0.001 *** |
| Individual level | |||||
| Genderfemale | 0.091 | 0.177 | −0.258–0.440 | 0.512 | 0.609 |
| Immigrant background | −0.078 | 0.204 | −0.4779–0.322 | −0.384 | 0.701 |
| Multilingual background | 0.101 | 0.215 | −0.323–−0.524 | −0.468 | 0.640 |
| Low socioeconomic status | 0.160 | 0.181 | −0.196–0.517 | 0.884 | 0.377 |
| Reading proficiency | 0.045 | 0.022 | 0.002–0.089 | 2.038 | 0.042 * |
| Random Effects | Variance | Standard Error SE | Wald Z | p | |
| Time | 1.973 | 0.163 | 12.083 | <0.001 *** | |
| Student (intercept) | 1.233 | 0.203 | 6.090 | <0.001 *** | |
| Model fit | −2LL2325 | AIC2329 | BIC2338 | ICCconditional | 0.39 |
Note. * for p < 0.05; *** for p < 0.001. p-values for fixed effects calculated using Satterthwaite’s approximations. Confidence intervals were calculated using the Wald method.
Table A2.
Linear mixed model (REML) predicting the learning outcomes in explaining strategies for comparing intervention group IG-HS with highly structured scaffolds to IG-RS with regular scaffolds (without CG).
Table A2.
Linear mixed model (REML) predicting the learning outcomes in explaining strategies for comparing intervention group IG-HS with highly structured scaffolds to IG-RS with regular scaffolds (without CG).
| Fixed Effects | Estimate | Standard Error SE | 95% Confidence Intervals | t | p |
|---|---|---|---|---|---|
| Intercept | 0.514 | 0.366 | −0.180–1.262 | 1.479 | 0.141 |
| Time | 1.089 | 0.323 | 0.451–1.728 | 3.369 | <0.001 *** |
| Group level | |||||
| Participation in IG-HS instead of IG-RS | −0.180 | 0.324 | −0.817–0.458 | −0.555 | 0.580 |
| Participation in IG-HS × time | 0.521 | 0.401 | −0.271–1.313 | 1.300 | 0.196 |
| Individual level | |||||
| Genderfemale | 0.065 | 0.243 | −0.415–0.544 | 0.266 | 0.790 |
| Immigrant background | −0.067 | 0.266 | −0.593–0.459 | −0.252 | 0.802 |
| Multilingual background | −0.013 | 0.277 | −0.561–0.534 | −0.048 | 0.962 |
| Low socioeconomic status | 0.366 | 0.247 | −0.122–0.854 | 1.483 | 0.140 |
| Reading proficiency | 0.025 | 0.028 | −0.031–0.081 | 0.888 | 0.376 |
| Random Effects | Variance | Standard Error SE | Wald Z | p | |
| Time | 2.927 | 0.329 | 8.888 | <0.001 *** | |
| Student (intercept) | 0.763 | 0.303 | 2.518 | 0.012 * | |
| Model fit | −2LL 1324 | AIC 1328 | BIC 1335 | ICCconditional | 0.21 |
Note. * for p < 0.05; *** for p < 0.001. p-values for fixed effects calculated using Satterthwaite’s approximations. Confidence intervals were calculated using the Wald method.
References
- Battista, M. T. (2007). The development of geometric and spatial thinking. In F. K. Lester (Ed.), Second handbook of research on mathematics teaching and learning (pp. 843–908). Information Age. [Google Scholar]
- Bielinski, S., Peters, N., & Prediger, S. (2024). Digital gestützte Lernpfade hin zum verständigen Umgang mit Gewichten: Design der divomath-Unterrichtsbausteine [Digitally-supported learning trajectories to understanding the use of weights: Design of the divomath teaching modules]. In F. Dilling, & I. Witzke (Eds.), Digitaler mathematikunterricht in forschung und praxis II: Tagungsband zur vernetzungstagung 2023 in Siegen (pp. 17–32). WTM. [Google Scholar] [CrossRef]
- Bright, G. W. (1976). Estimating as part of learning to measure. In D. Nelson, & R. E. Reys (Eds.), Measurement in school mathematics: 1976 yearbook (pp. 87–104). National Council of Teachers of Mathematics. [Google Scholar]
- Cheeseman, J., McDonough, A., & Golemac, D. (2017). Investigating children’s thinking about suspended balances. New Zealand Journal of Educational Studies, 52(1), 143–158. [Google Scholar] [CrossRef]
- Cheung, A. C. K., & Slavin, R. E. (2016). How methodological features affect effect sizes in education. Educational Researcher, 45(5), 283–292. [Google Scholar] [CrossRef]
- Chi, M. T. H., De Leeuw, N., Chiu, M.-H., & Lavancher, C. (1994). Eliciting self-explanations improves understanding. Cognitive Science, 18(3), 439–477. [Google Scholar] [CrossRef]
- Corle, C. G. (1963). Estimates on quantity by elementary teachers and college juniors. Arithmetic Teacher, 10, 347–357. [Google Scholar] [CrossRef]
- Corno, L. (2008). On teaching adaptively. Educational Psychologist, 43(3), 161–173. [Google Scholar] [CrossRef]
- de Araujo, Z., & Smith, E. (2022). Examining English language leaners’ learning needs through the lens of algebra curriculum materials. Educational Studies in Mathematics, 109(1), 65–88. [Google Scholar] [CrossRef]
- Dignath, C., & Büttner, G. (2018). Teachers’ direct and indirect promotion of self-regulated learning in primary and secondary school mathematics classes—Insights from video-based classroom observations and teacher interviews. Metacognition and Learning, 13(2), 127–157. [Google Scholar] [CrossRef]
- Dignath, C., & Veenman, M. V. J. (2021). The role of direct strategy instruction and indirect activation of self-regulated learning: Evidence from classroom observation studies. Educational Psychology Review, 33(2), 489–533. [Google Scholar] [CrossRef]
- Durkin, K., Star, J. R., & Rittle-Johnson, B. (2017). Using comparison of multiple strategies in the mathematics classroom: Lessons learned and next steps. ZDM—Mathematics Education, 49(4), 585–597. [Google Scholar] [CrossRef]
- Forrester, M., Latham, J., & Shire, B. (1990). Exploring estimation in young primary school children. Educational Psychology, 10, 283–300. [Google Scholar] [CrossRef]
- Geiger, V., Bennison, A., & Abidin, Z. (2023). Enhancing learner communication and collaboration through digital resources: Affordances, constraints, and possibilities. In B. Pepin, G. Gueudet, & J. Choppin (Eds.), Handbook of digital resources in mathematics education (pp. 1–27). Springer. [Google Scholar] [CrossRef]
- Gibbons, P. (2002). Scaffolding language, scaffolding learning. Teaching second language learners in the mainstream classroom. Heinemann. [Google Scholar]
- Hannafin, M., Land, S., & Oliver, K. (1999). Open learning environments: Foundations, methods, and models. In C. M. Reigeluth (Ed.), Instructional-design theories and models—A new paradigm of instructional theory (Vol. 2, pp. 115–140). Lawrence Erlbaum. [Google Scholar]
- Heinze, A., Arend, J., Grüßing, M., & Lipowsky, F. (2020). Systematisch einführen oder selbst entdecken lassen? Eine experimentelle Studie zur Förderung der adaptiven Nutzung von Rechenstrategien bei Grundschulkindern. Unterrichtswissenschaft, 48, 11–34. [Google Scholar] [CrossRef]
- Hildreth, D. J. (1983). The use of strategies in estimating measurements. Arithmetic Teachers, 30(5), 50–54. [Google Scholar] [CrossRef]
- Hillmayr, D., Ziernwald, L., Reinhold, F., Hofer, S. I., & Reiss, K. M. (2020). The potential of digital tools to enhance mathematics and science learning in secondary schools: A context-specific meta-analysis. Computers & Education, 153(103897), 1–25. [Google Scholar] [CrossRef]
- Hoth, J., Heinze, A., Huang, H.-M. E., Weiher, D. F., Niedermeyer, I., & Ruwisch, S. (2023). Elementary school students’ length estimation skills—Analyzing a multidimensional construct in a cross-country study. International Journal of Science and Mathematics Education, 21(6), 1841–1864. [Google Scholar] [CrossRef]
- Huang, H.-M. E. (2020). Effects of grade level and object size on students’ measurement estimation performance. Eurasia Journal of Mathematics, Science and Technology Education, 16(12), em1923. [Google Scholar] [CrossRef] [PubMed]
- Jones, G., Taylor, A., & Broadwell, B. (2009). Estimating linear size and scale: Body rulers. International Journal of Science Education, 31(11), 1495–1509. [Google Scholar] [CrossRef]
- Jones, M. G., Gardner, G. E., Taylor, A. R., Forrester, J. H., & Andre, T. (2012). Students’ accuracy of measurement estimation: Context, units, and logical thinking. School Science and Mathematics, 112(3), 171–178. [Google Scholar] [CrossRef]
- Joram, E., Gabriele, A. J., Bertheau, M., Gelman, R., & Subrahmanyam, K. (2005). Children’s use of the reference point strategy for measurement estimation. Journal for Research in Mathematics Education, 36(1), 4–23. [Google Scholar]
- Joram, E., Subrahmanyam, K., & Gelman, R. (1998). Measurement estimation: Learning to map the route from number to quantity and back. Review of Educational Research, 68(4), 413–449. [Google Scholar] [CrossRef]
- Lajoie, S. P. (2005). Extending the scaffolding metaphor. Instructional Science, 33(5–6), 541–557. [Google Scholar] [CrossRef]
- Lan, Y.-J., Sung, Y.-T., Tan, N.-C., Lin, C.-P., & Chang, K.-E. (2010). Mobile-device-supported problem-based computational estimation instruction for elementary school students. Journal of Educational Technology & Society, 13(3), 55–69. [Google Scholar]
- Lenhard, W., & Schneider, W. (2006). ELFE 1–6. Ein Leseverständnistest für Erst- bis Sechstklässler [ELFE 1–6: A reading comprehension test for first to sixth graders]. Hogrefe. [Google Scholar]
- Loibl, K., Roll, I., & Rummel, N. (2017). Towards a theory of when and how problem solving followed by instruction supports learning. Educational Psychology Review, 29(4), 693–715. [Google Scholar] [CrossRef]
- Loretan, C., Müller, A., Delaval, M., Roch, S., & Weiss, L. (2024). Understanding of size and scale and order-of-magnitude reasoning in secondary science: A teaching experiment with worked examples as educational scaffold. arXiv. [Google Scholar] [CrossRef]
- Lyman, F. (1981). The responsive classroom discussion. In A. S. Anderson (Ed.), Mainstreaming digest. University of Maryland College of Education. [Google Scholar]
- Meteyard, L., & Davies, R. A. I. (2020). Best practice guidance for linear mixed-effects models in psychological science. Journal of Memory and Language, 112, 104092. [Google Scholar] [CrossRef]
- Mitchell, J. H., Hawkins, E. F., Stancavage, F. B., & Dossey, J. A. (1999). Estimation skills, mathematics-in-context, and advanced skills in mathematics: Results from three studies of the National Assessment. National Center for Education Statistics, U.S. Department of Education, Office of Educational Research and Improvement. Available online: https://nces.ed.gov/nationsreportcard/pubs/main1996/2000451.aspx (accessed on 10 February 2025).
- OECD. (2023). PISA 2022 results. The state of learning and equity in education (Vol. I). OECD. [Google Scholar] [CrossRef]
- Paetsch, J., Radmann, S., Felbrich, A., Lehmann, R., & Stanat, P. (2016). Sprachkompetenz als Prädiktor mathematischer Kompetenzentwicklung von Kindern deutscher und nicht-deutscher Familiensprache [Students’ growth trajectories in mathematics: The role of language proficiency]. Zeitschrift für Entwicklungspsychologie und Pädagogische Psychologie, 48(1), 27–41. [Google Scholar] [CrossRef]
- Paulus, C. (2009). Die “Bücheraufgabe” zur Bestimmung des kulturellen Kapitals bei Grundschülern [The “book-at-home index” for capturing primary students’ cultural capital]. Available online: https://psycharchives.org/en/item/86adf598-cbdb-4aea-a096-8583959d07d9 (accessed on 10 September 2024).
- Prediger, S. (2022). Enhancing language for developing conceptual understanding: A research journey connecting different research approaches. In J. Hodgen, E. Geraniou, G. Bolondi, & F. Ferretti (Eds.), Proceedings of Twelfth Congress of the European Society for Research in Mathematics Education (CERME12) (pp. 8–33). University of Bolzano/ERME. Available online: https://hal.science/hal-03756062/ (accessed on 10 September 2024).
- Rathgeb-Schnierer, E., & Rechtsteiner, C. (2018). Rechnen lernen und Flexibilität entwickeln: Grundlagen–Förderung–Beispiele [Learning to calculate and developing flexibilty: Foundations–enhancement–examples]. Springer. [Google Scholar] [CrossRef]
- Renkl, A. (2014). Toward an instructionally oriented theory of example-based learning. Cognitive Science, 38(1), 1–37. [Google Scholar] [CrossRef]
- Sacristán, A. I., Calder, N., Rojano, T., Santos-Trigo, M., Friedlander, A., & Meissner, H. (2010). The influence and shaping of digital technologies on the learning—And learning trajectories—Of mathematical concepts. In C. Hoyles, & J.-B. Langrange (Eds.), Mathematics education and technology—Rethinking the terrain (pp. 179–226). Springer. [Google Scholar] [CrossRef]
- Sowder, J. (1992). Estimation and number sense. In D. Grouws (Ed.), Handbook of research on mathematics teaching and learning: A project of the National Council of Teachers of Mathematics (pp. 371–389). NCTM. [Google Scholar]
- Subramaniam, K. (2014). Prospective secondary mathematics teachers’ pedagogical knowledge for teaching the estimation of length measurements. Journal of Mathematics Teacher Education, 17(2), 177–198. [Google Scholar] [CrossRef]
- Swan, M., & Jones, O. E. (1980). Comparison of students’ percepts of distance, weight, height, area, and temperature. Science Education, 64(3), 297–307. [Google Scholar] [CrossRef]
- Toulmin, S. E. (1969). The uses of a Argument. Cambridge University Press. [Google Scholar]
- Van de Walle, J. A., Karp, K. S., & Bay-Williams, J. M. (2010). Elementary and middle school mathematics: Teaching developmentally. Pearson. [Google Scholar]
- Weiher, D. F. (2019). Framework for the parallelized development of estimation tasks for length, area, capacity, and volume in primary school—A pilot study. Journal of Research in Science, Mathematics and Technology Education, 2(1), 9–28. [Google Scholar] [CrossRef]
- Weiher, D. F. (2023). Das Schätzen von Längen, Flächeninhalten, Fassungsvermögen und Rauminhalten. Entwicklung und Auswertung eines Schätztests für Kinder der vierten, fünften und sechsten Klasse [Estimating lengths, area, capacity and volume. Development and evaluation of an estimation test for children in fourth, fifth and sixth grade] [Ph.D. thesis, Leuphana University]. Available online: https://pubdata.leuphana.de/bitstream/20.500.14123/764/1/Dissertation_2023_Weiher_Schaetzen.pdf (accessed on 13 February 2025).
- Wortman, P. M. (1983). Evaluation research: A methodological perspective. Annual Review of Psychology, 34(1), 223–260. [Google Scholar] [CrossRef]
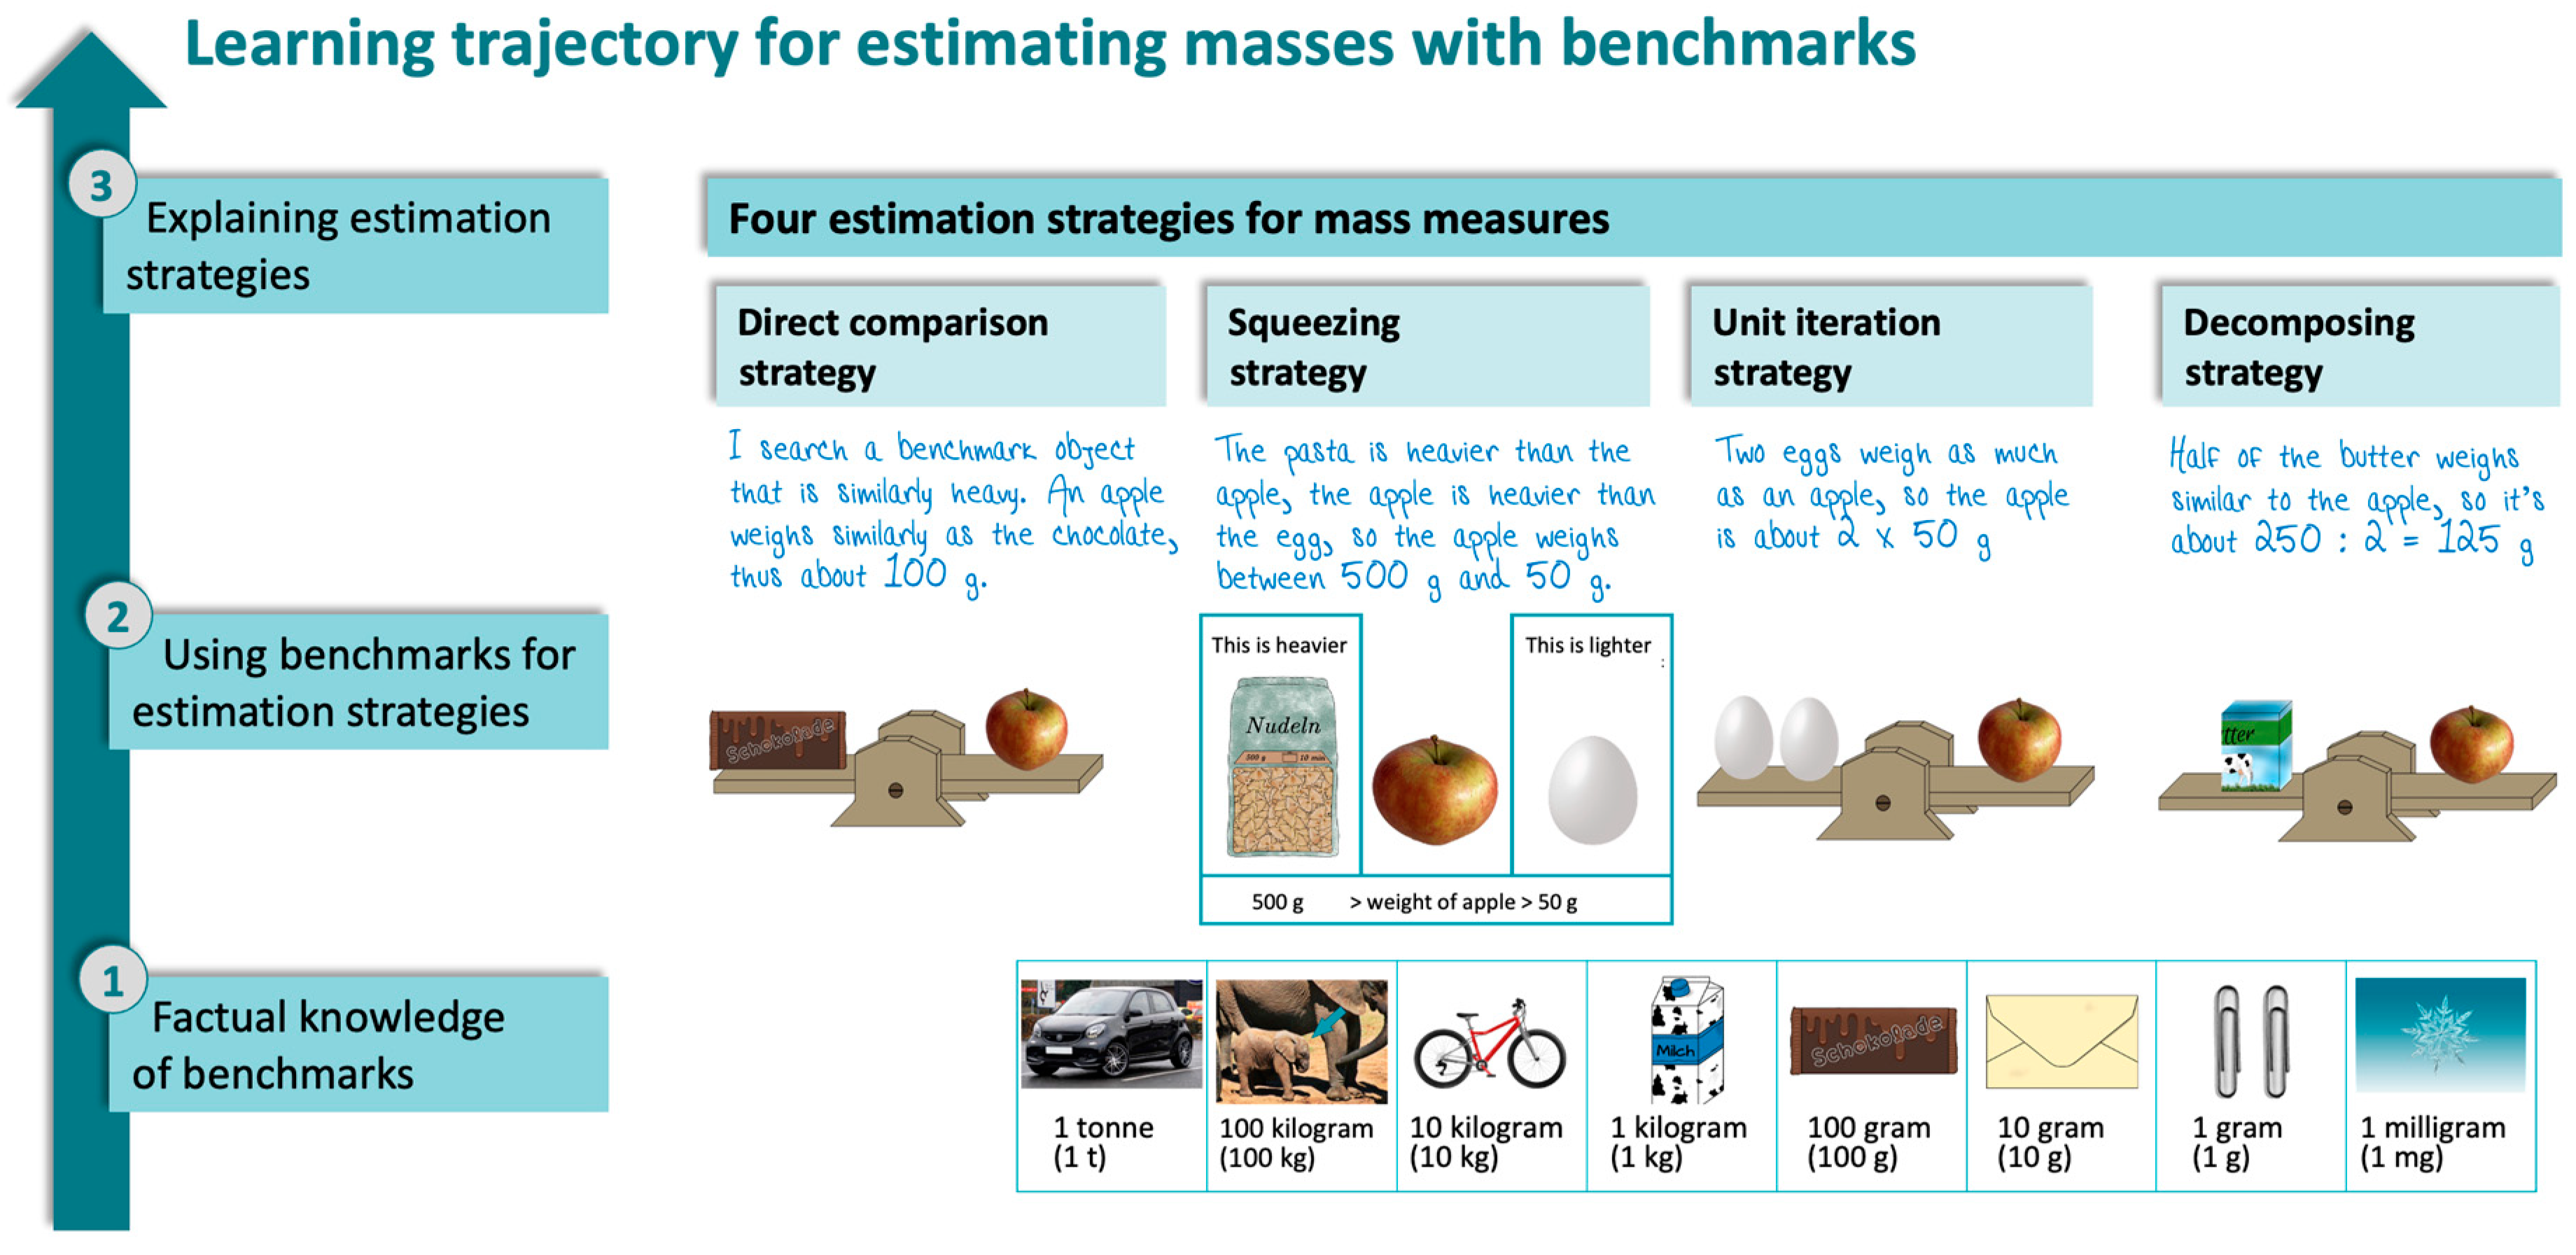
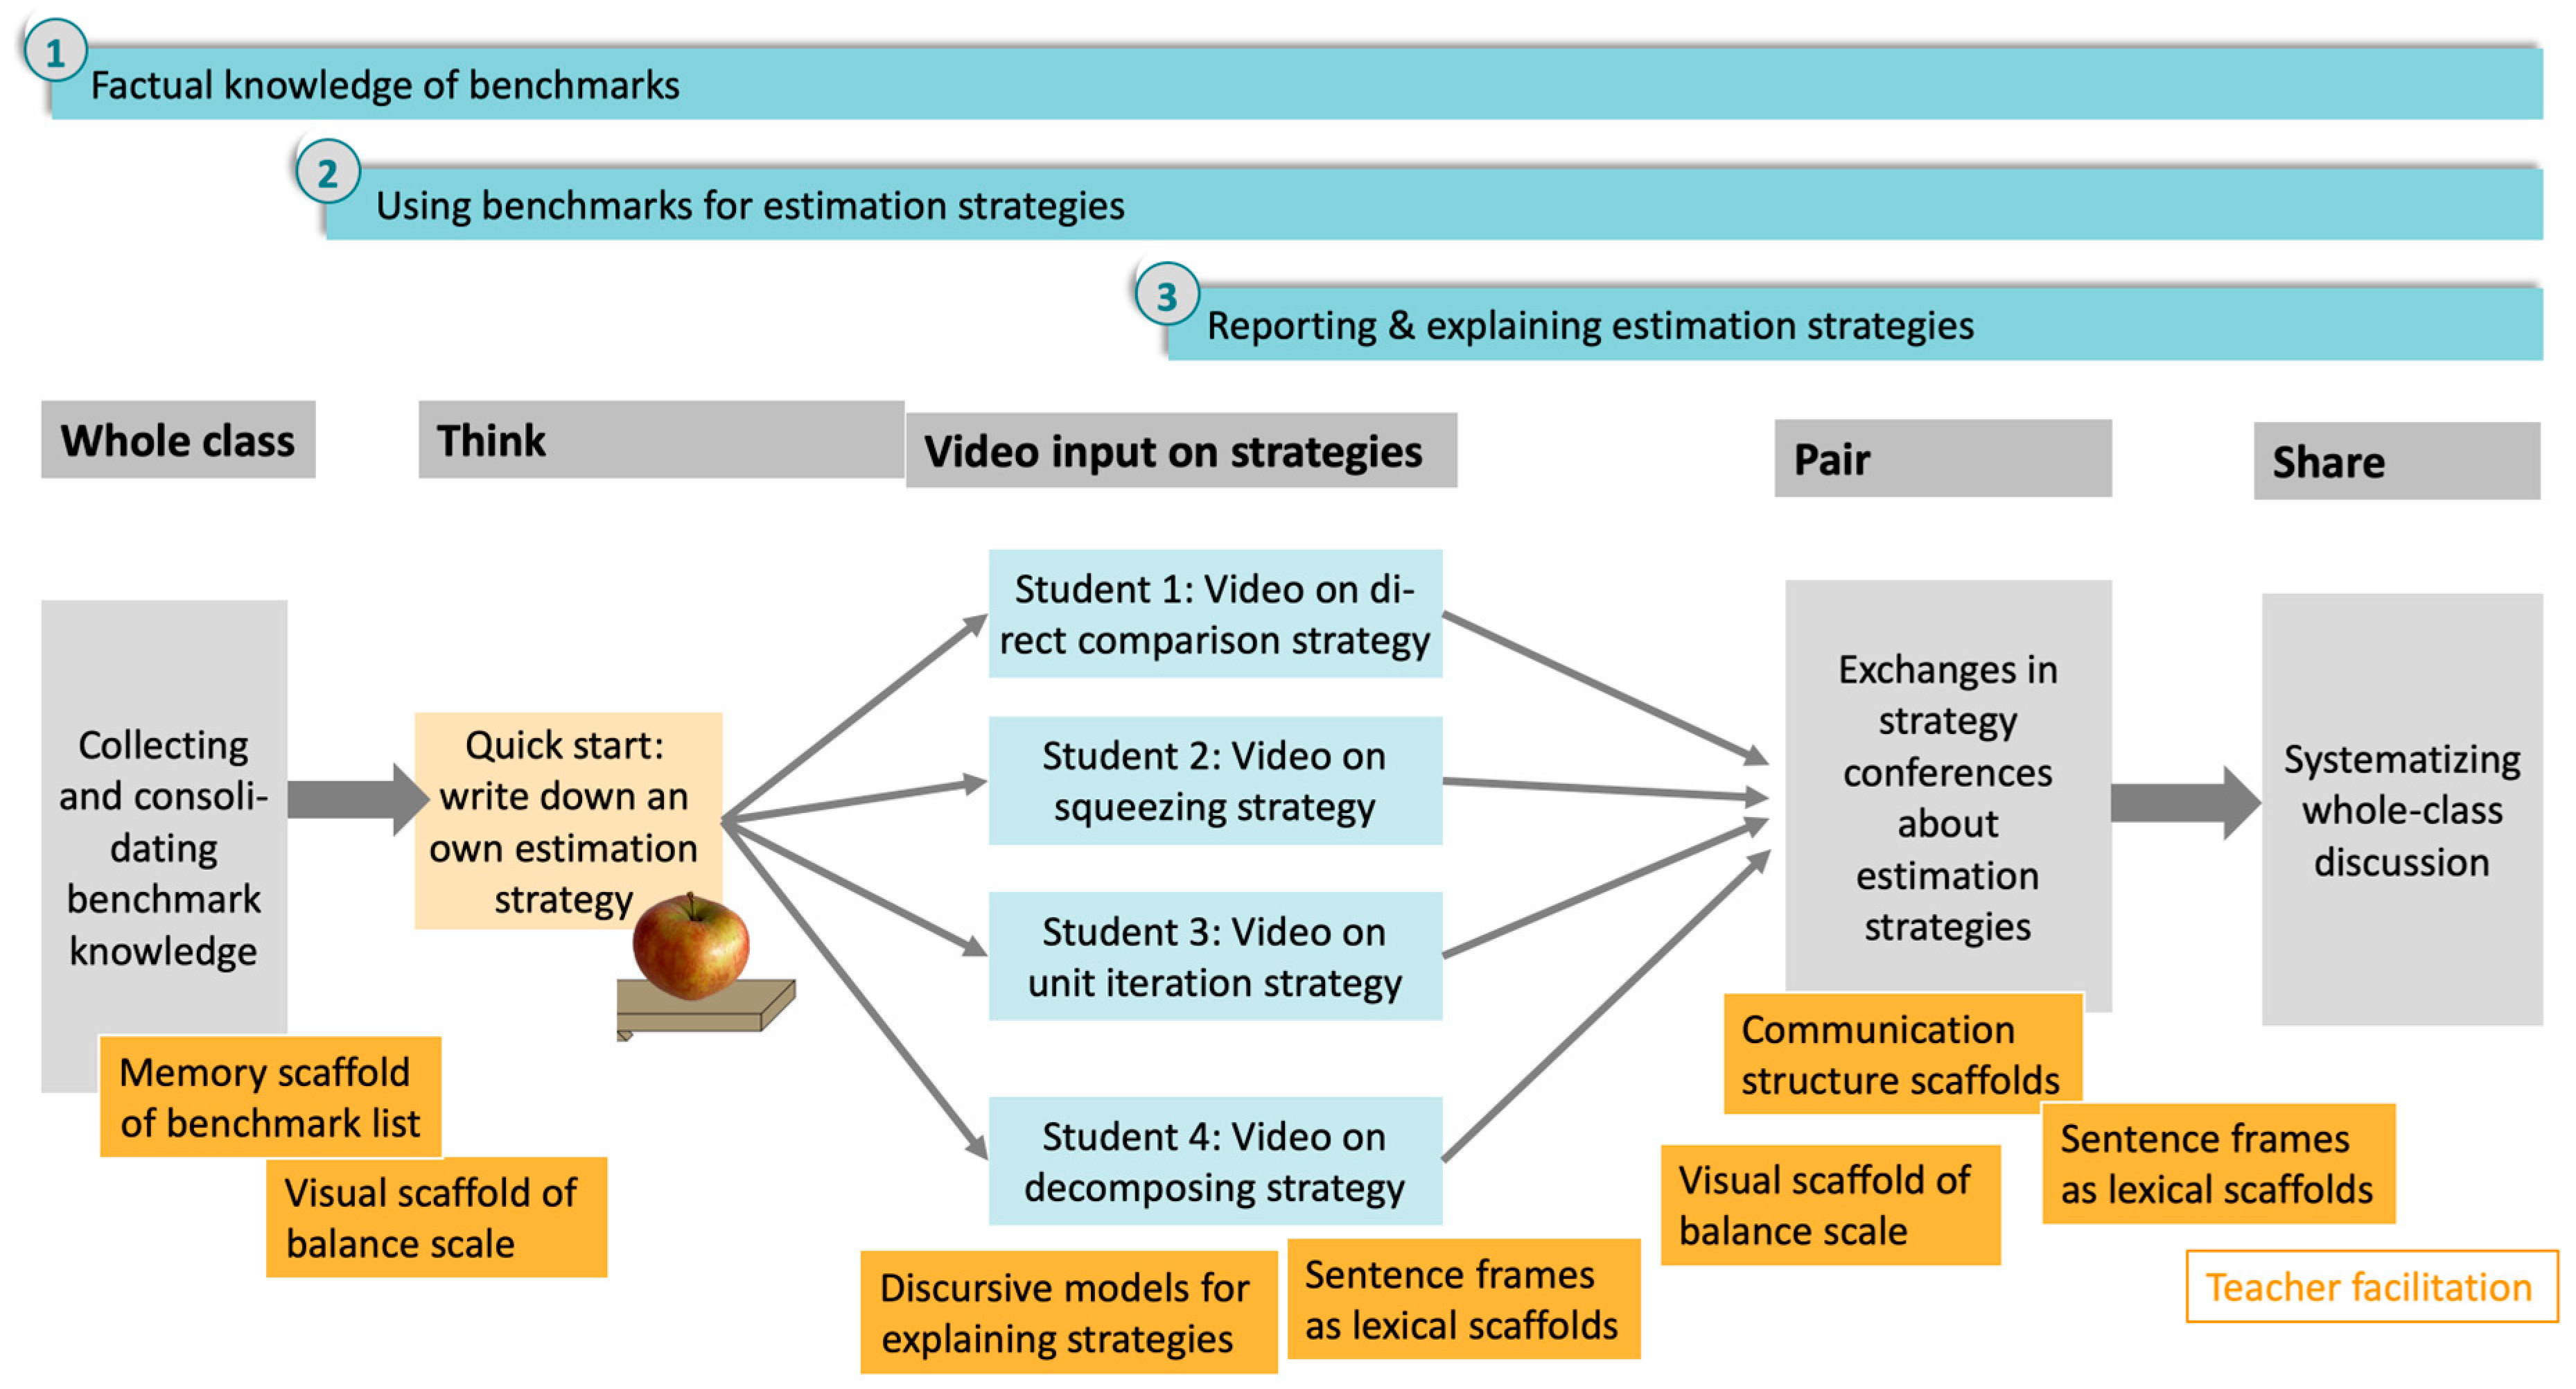
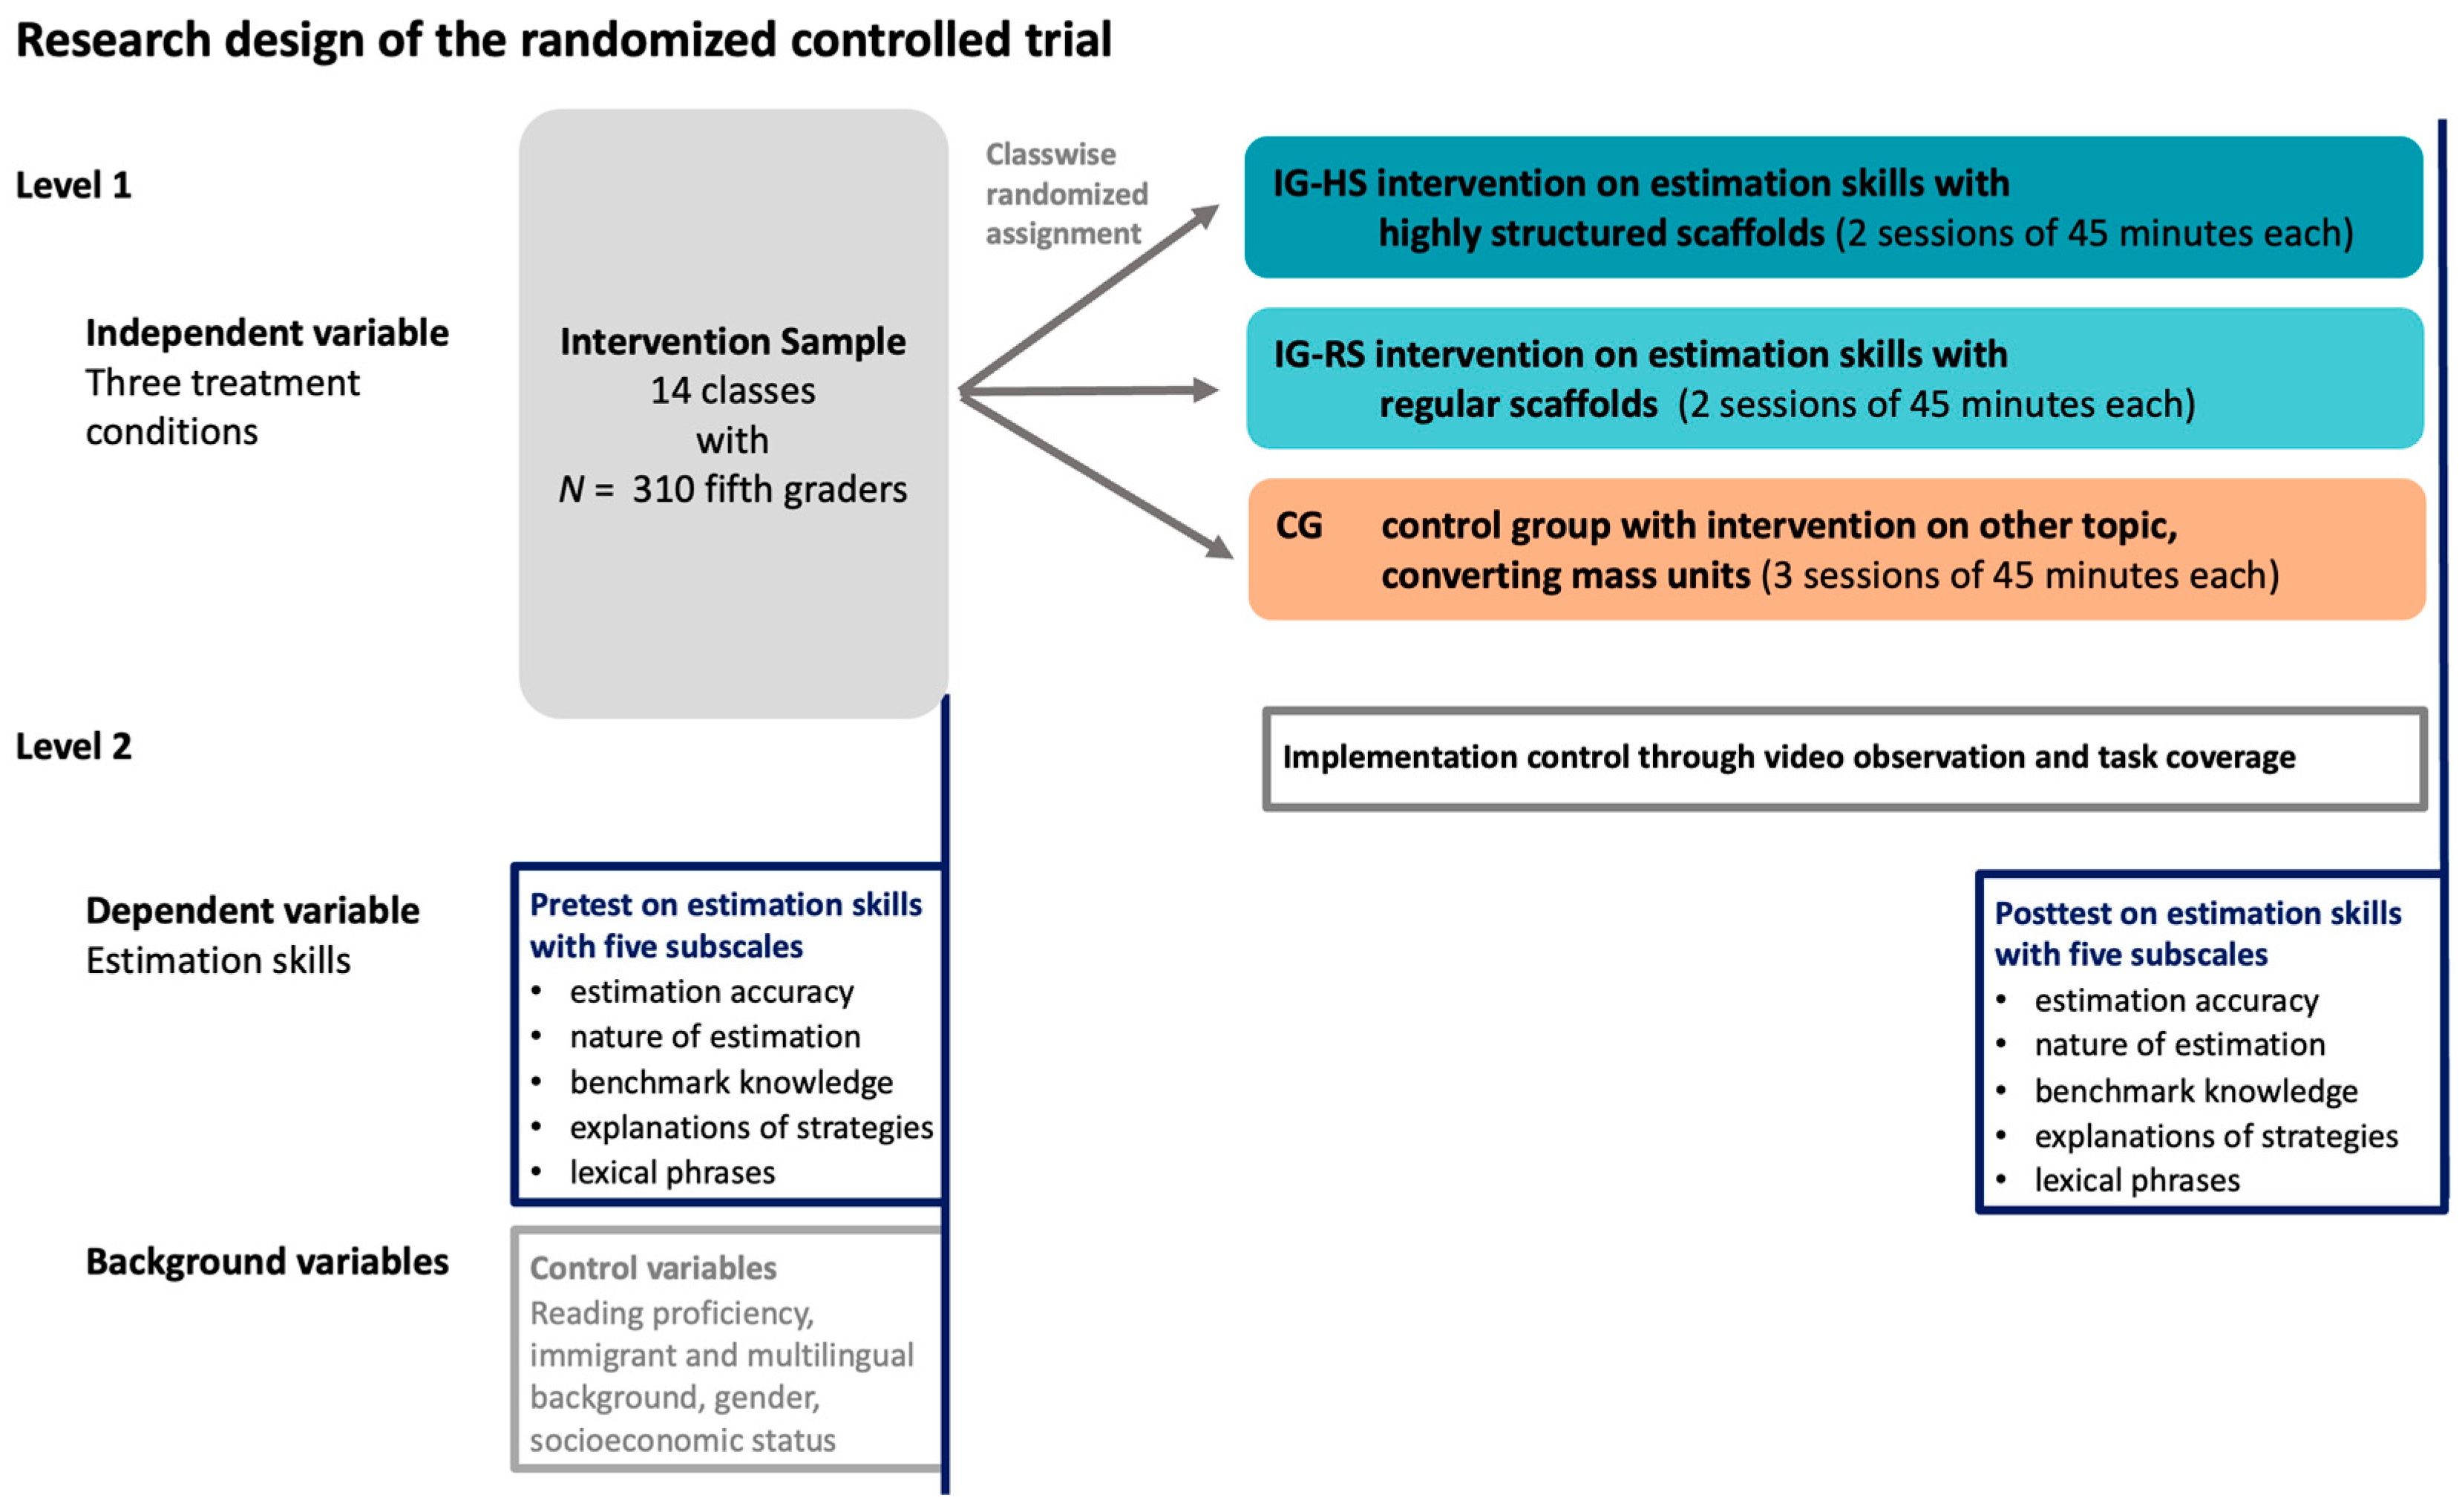

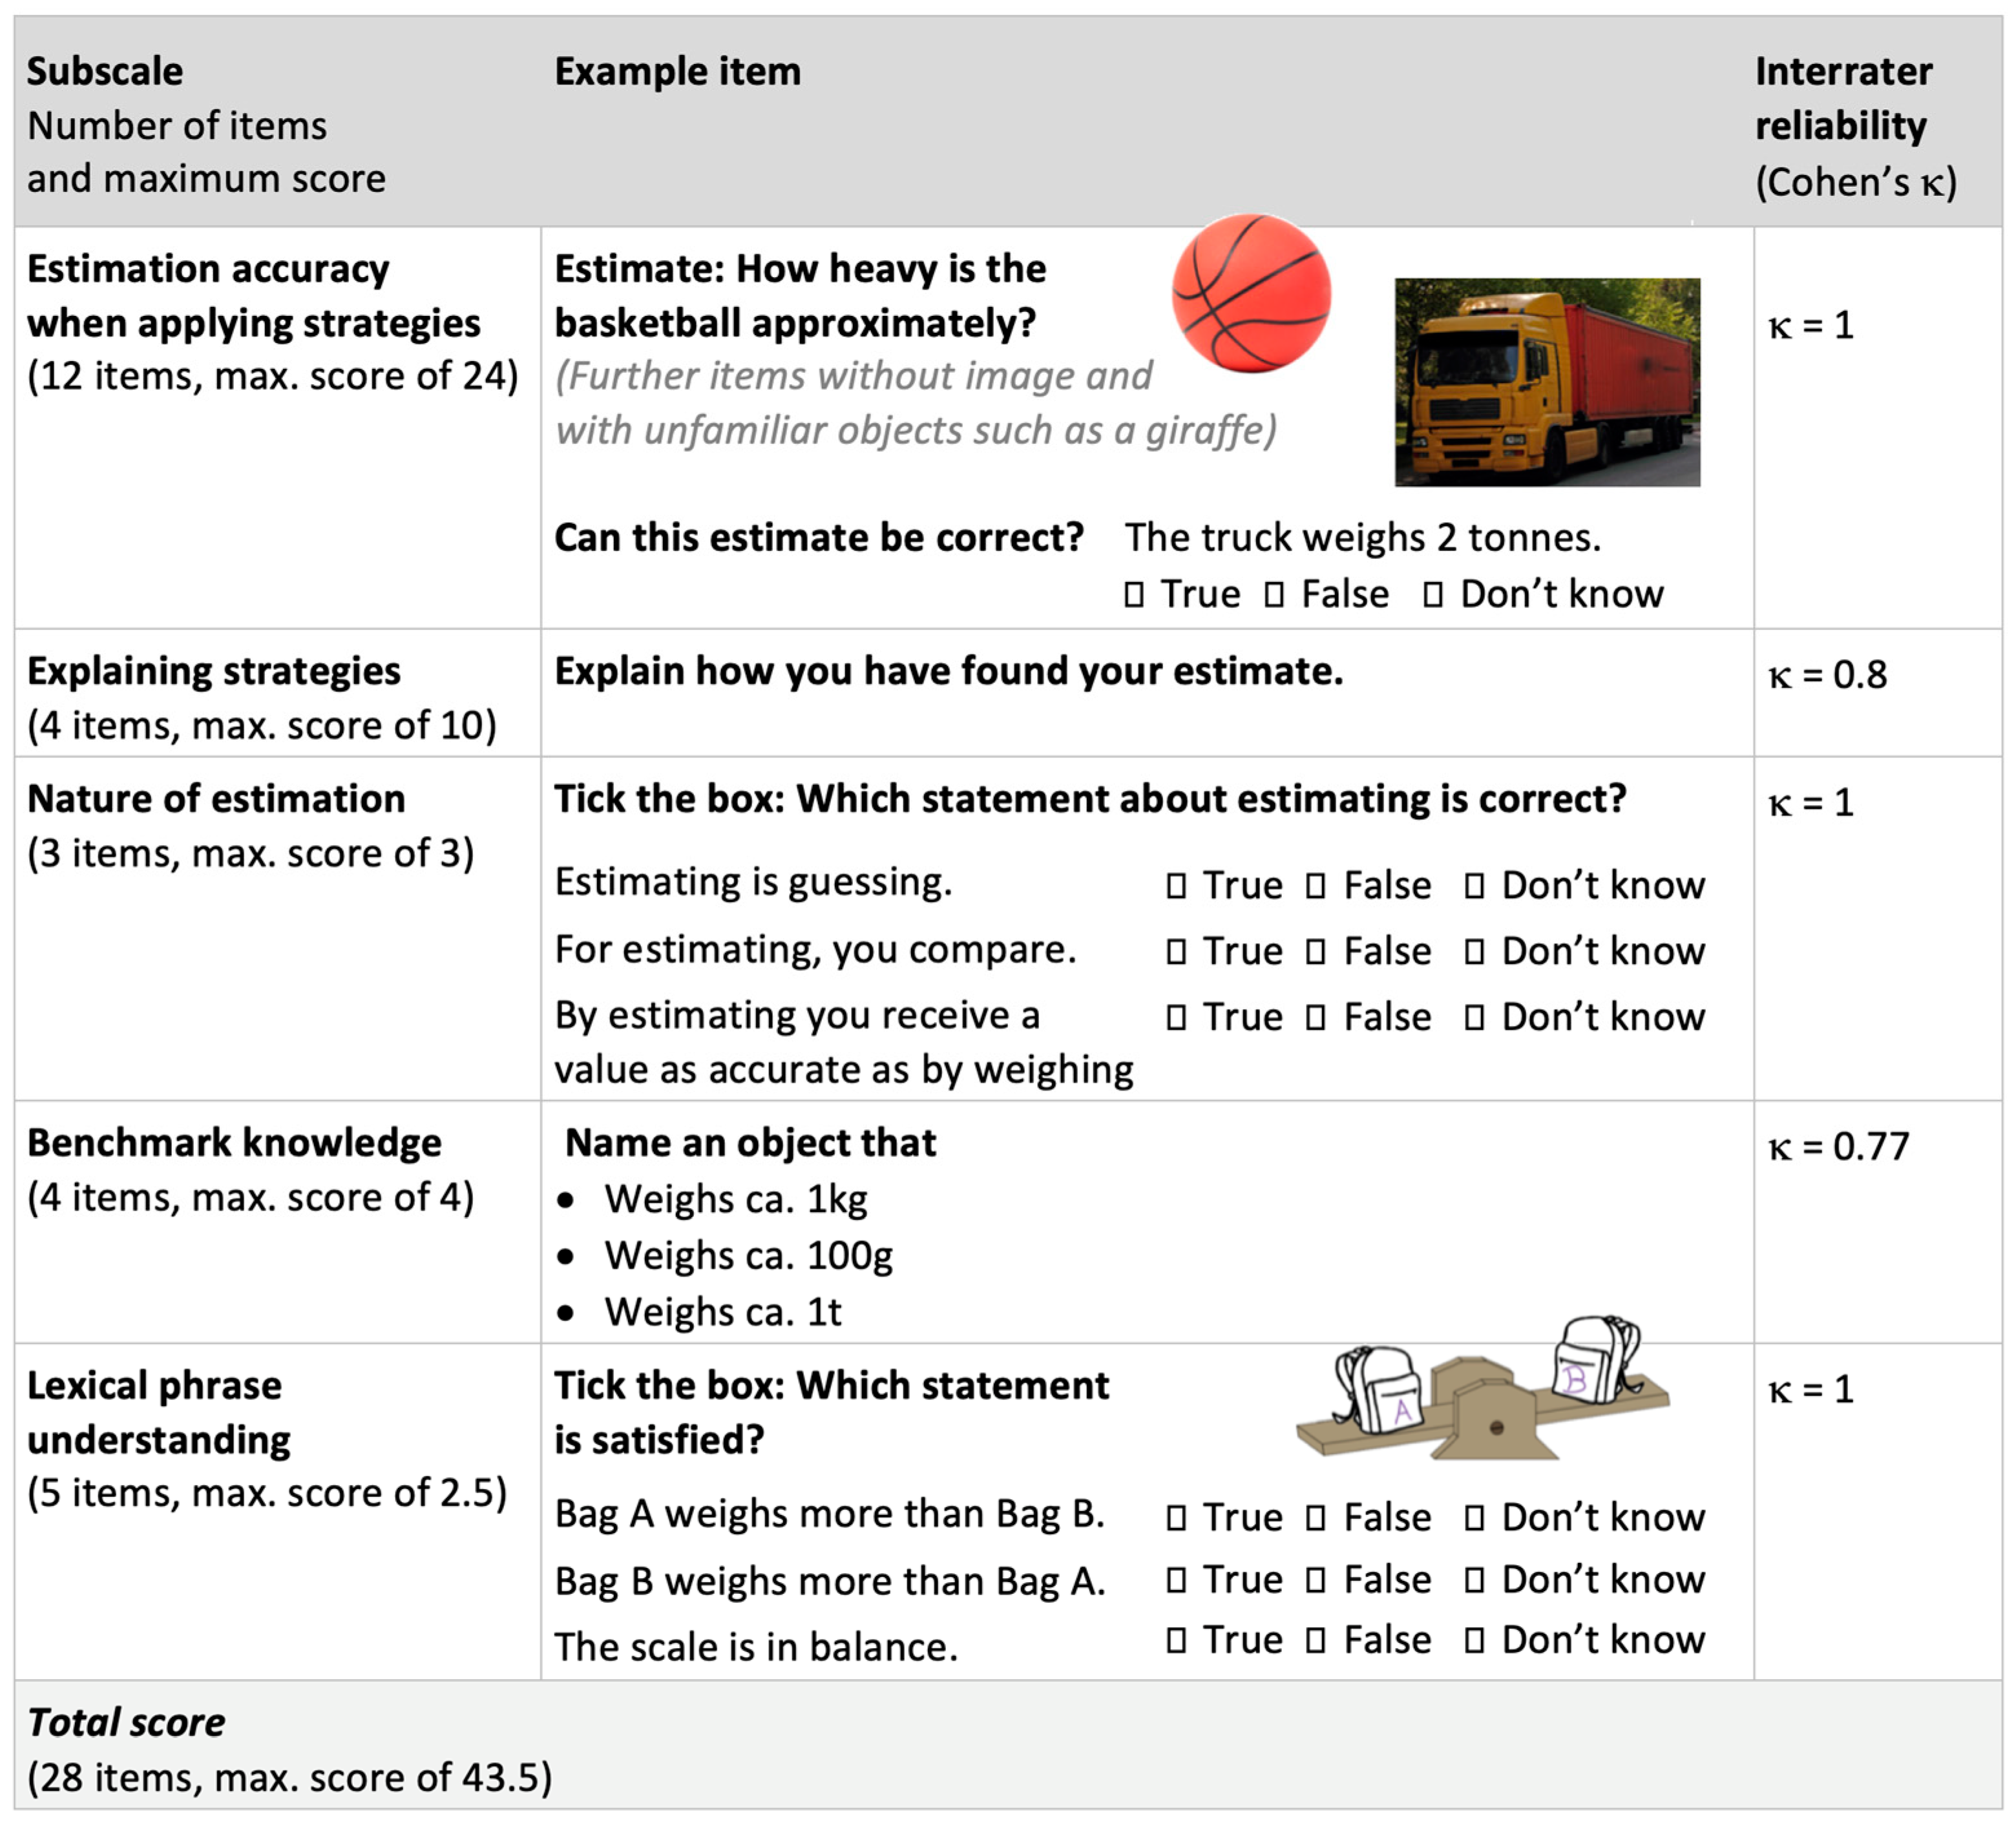
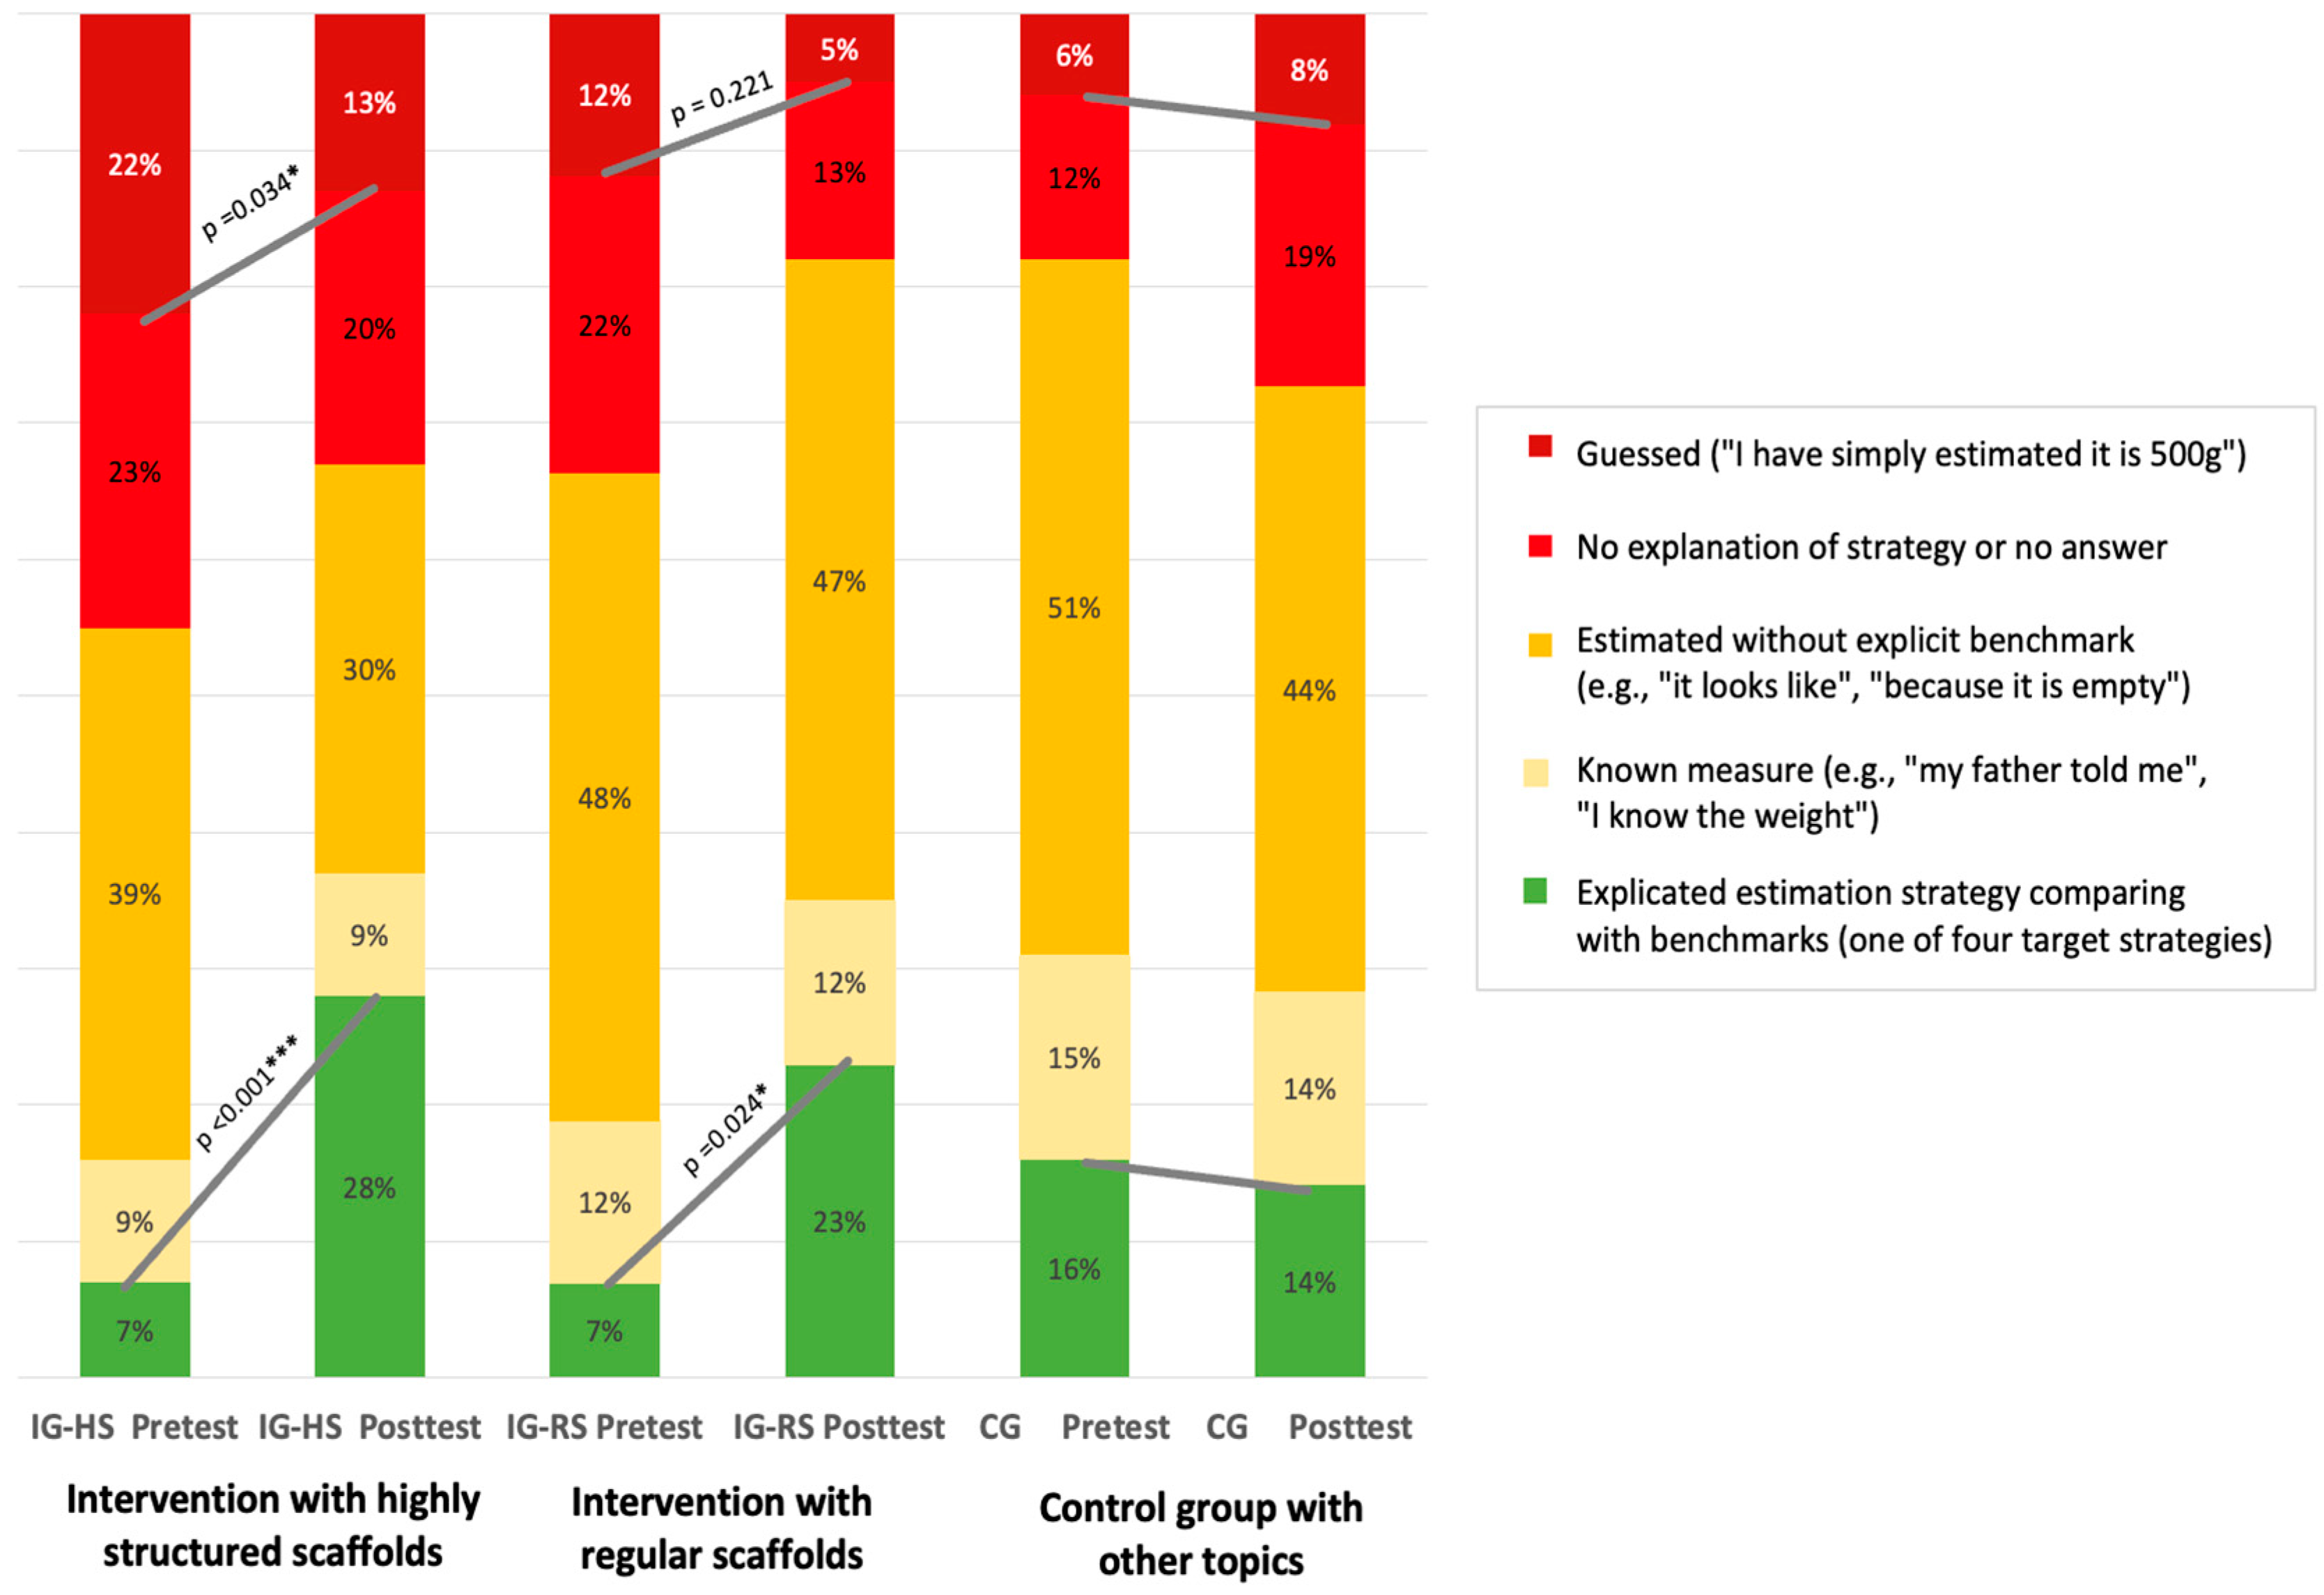
Disclaimer/Publisher’s Note: The statements, opinions and data contained in all publications are solely those of the individual author(s) and contributor(s) and not of MDPI and/or the editor(s). MDPI and/or the editor(s) disclaim responsibility for any injury to people or property resulting from any ideas, methods, instructions or products referred to in the content. |
© 2025 by the authors. Licensee MDPI, Basel, Switzerland. This article is an open access article distributed under the terms and conditions of the Creative Commons Attribution (CC BY) license (https://creativecommons.org/licenses/by/4.0/).