Article

Theoretical Foundation and Validation of the Record of Decision-Making (RODM)

by
Emily M. Rodgers
1,* and
Jerome V. D’Agostino
2,*
1
Department of Teaching and Learning, The Ohio State University, Columbus, OH 43210, USA
2
Department of Educational Studies, The Ohio State University, Columbus, OH 43210, USA
*
Authors to whom correspondence should be addressed.
Educ. Sci. 2025, 15(11), 1483; https://doi.org/10.3390/educsci15111483
Submission received: 15 August 2025 / Revised: 25 October 2025 / Accepted: 29 October 2025 / Published: 4 November 2025
(This article belongs to the Special Issue Advances in Evidence-Based Literacy Instructional Practices)

Abstract

This study presents the development and validation of the Record of Decision-Making (RODM), a formative assessment designed to measure beginning readers’ use of phonic elements to decode unknown words while reading. Grounded in overlapping wave theory and theories of early reading development, the RODM captures adaptive strategy use during oral reading, including rereading and subword analysis. Using multifaceted Rasch modeling, the authors demonstrate that RODM scores align with a unidimensional reading proficiency scale and reflect predictable patterns of strategy use across proficiency levels. Findings indicate that as reading proficiency increases, students employ a broader range of phonic elements and shift from basic strategies (e.g., initial letter use) to more sophisticated ones (e.g., medial and final letter use). Additionally, proficient readers exhibit greater self-correction and reduced reliance on rereading. Generalizability analysis yielded strong interrater reliability and accuracy with minimal training, suggesting its practical utility for frequent classroom use. Implications for instruction include the need to teach flexible, efficient decoding strategies that adapt to task difficulty. Future research should explore score consistency with educators in classroom settings and instructional impact.

1. Introduction

A growing corpus of empirical evidence supports the view that reading development involves more than learning grapheme–phoneme correspondences; it also involves the use of word solving strategies (see, for example, Johnson et al., 2024; Lindberg et al., 2011). Not only do beginning readers need to learn letter-sound relationships, but they must also develop strategies using the print to solve or decode unknown words (Vellutino & Scanlon, 2002).
This strategy use has been documented with readers from five years old (Farrington-Flint & Wood, 2007) to fourth grade (Lindberg et al., 2011), with struggling readers (Johnson et al., 2024) and proficient readers (Kaye, 2006), and with students reading continuous text or words in isolation (Lindberg et al., 2011). Researchers have identified various kinds of word solving strategies in use including re-reading, using analogies to known words, and searching for and using word parts of varying grain sizes from individual letters to rimes.
Despite the general acceptance that reading involves the use of word solving strategies however, we know of no formative assessment for beginning reading that systematically documents strategies used to solve unknown words. This lack of a formative assessment for word solving strategies is a problem for at least two reasons. First, there is an urgent need to improve students’ reading skills. Research has documented a significant drop in reading scores following the widespread disruption to learning brought about by the COVID-19 public health emergency (Kuhfeld et al., 2023; National Assessment of Educational Progress, 2024). At the same time, there is convincing evidence that formative assessments can improve achievement (Yao et al., 2024; Yan & Chiu, 2023), likely because they provide real-time diagnostic feedback about what a student can and cannot yet do; information that a teacher can use to immediately adjust instruction.
Thus, the purpose of this paper is to describe our work developing the Record of Decision-Making (RODM), a formative assessment of oral reading that provides a standard task, a standard way of administering, scoring, and interpreting strategies that students employ to decode unknown words. To our knowledge, the RODM is the first formative assessment for beginning readers that is designed to systematically document backup strategy usage when students encounter unknown words. If teachers can track how their students utilize backup strategies, they can gear instruction toward the promotion of effective and efficient strategy use (Steffler et al., 1998).
Though the RODM currently is used by some reading specialists in the US, heretofore we have not provided reliability and validity information about the device. A critical step in the validation process of a formative assessment measure is to document the degree to which the scores are useful for teachers to guide their instruction and provide their students with constructive feedback, that, in turn, improve student learning. As Messick (1995) articulated, however, the validity of test score use is predicated on the construct validity of the scores. Thus, for the RODM, it must be shown that the backup strategies it purports to measure reflect student reading proficiency before usefulness in the classroom can be documented.
We first describe the theoretical and empirical underpinnings of the RODM and then we describe the items themselves, as well as how it is used to code and interpret oral reading. Following that, we provide reliability and validation evidence to support the use of the RODM as a formative assessment of beginning oral reading.

1.1. Theoretical Frame

The RODM is founded on two developmental psychological frameworks: overlapping wave theory (Siegler, 1996, 2016) and theories of beginning reading (Adams, 2004; Ehri, 1998; Gibson & Levin, 1975). Siegler’s theory describes cognitive development in general while Gibson and Levin and others describe the visual perceptual demands that reading places on the beginning reader who is learning how to identify words while reading.

1.1.1. Overlapping Wave Theory

Overlapping wave theory posits that humans develop domain proficiency through adaptive strategy use; characterized by learners using multiple approaches, flexibly, over long periods of time, with a gradual ebbing and flowing of alternative ways of using the strategies (Siegler, 1995, 2005). According to this view of learning, as humans develop, we use automatic retrieval strategies (solutions available automatically from memory) to solve tasks we already know, and we rely on backup strategies when the solution is not automatically available from memory. From this perspective, the learner is a problem-solver, learning from each attempt and adapting strategy-use to the task.
Siegler (2005) defined effective strategy use as having four characteristics. (1) The learner can adapt their use of strategies to new problems as needed and (2) can apply multiple strategies to reach a solution. (3) Effective strategy use is also characterized as becoming more efficient over time so that what once was slow decision-making becomes faster with time. (4) Lastly, effective strategy use is characterized by generalization in that the learner can generalize the strategy to new situations. Siegler (1996) theorized that six types of change contribute to the development of effective strategy use: learning new strategies, change in the frequency of using existing strategies, change in the speed and accuracy of using the strategy, and change in the range of problems to which each strategy use is applied.
For example, a young student might use fingers on both hands to sum simple math such as 4 + 3, holding up four fingers on one hand and three on the other and then counting them all starting with one to seven. Eventually, the sums will be known automatically, and the backup strategy of using two hands may no longer be used. Yet not all addition problems can be solved with automatic retrieval and using two hands is not an efficient strategy for adding large numbers, thus the learner needs to further adapt the counting strategy. To solve 102 + 9, for example, the learner might start by saying “102 + 103, 104, 105…” until nine fingers are held up and the sum is then known (Siegler, 1984; Siegler & Robinson, 1982). Thus, development is characterized as having flexible ways to solve a problem, not just a few, and choosing amongst them the most efficient way to solve the problem (Siegler, 1996).
Another key feature of overlapping wave theory is that even after the learner has developed sophisticated strategies to solve a problem, the earlier more primitive strategies can still be accessed as the task difficulty changes. Siegler (2005) offers the example of a toddler adjusting descent strategies to the incline of a ramp, returning to crawling when the incline becomes too steep for safe walking.
Overlapping wave theory has been applied to study development within several different domains, including writing (Harmey et al., 2019), spelling (Sharp et al., 2008) and math (Siegler, 1996), all with similar descriptions of variable and flexible strategy use at difficulty that could be associated with domain proficiency.

1.1.2. Visual Perceptual Demands of Beginning Reading

Although clearly critical to beginning reading development, phonological processing skill does not entirely account for all variance in word recognition; orthographic processing skills add to predictions of individual differences in reading ability (Cunningham et al., 2001; Stanovich et al., 2013; Stanovich & West, 1989). According to Ehri (1998, 2005) proficient reading can be characterized as either retrieving known words from memory (akin to Siegler’s automatic retrieval strategies) or analyzing subword units in unfamiliar words (Siegler’s backup strategies). This orthographic mapping of grapheme–phoneme or grapho-syllabic units in unfamiliar words allows the reader to store the word in memory where the information can be available for future decoding (Miles & Ehri, 2019).
Research and strong theory have long indicated that there is a developmental trajectory with orthographic processing of print, starting with using individual letters to chunks of letters (Ehri, 1998); a progression that has been described as using letter-sound strategies first and later, word or sub-word strategies (Davis & Evans, 2021). Moreover, letters in the initial position of a word (ascending letters) and those in the final position (descending letters) are used first by beginning readers before letters in the medial position (Fagan & Eagan, 1986; Savage & Stuart, 2006); a finding established decades earlier by Marchbanks and Levin’s (1965) experiments.
Explanations have been offered as to why this developmental hierarchy with using print exists; it may be, for example, as simple as the fact that the white space in text that comes before and after initial and final letters makes those letters more readily differentiated to the reader from the rest of the word (Savage et al., 2001). It may have something to do with the fact that consonants in the initial and final positions produce stable sounds while vowels, which often occur in the medial position, are very inconsistent with their pronunciations and are influenced by the letters around them (Goswami, 1988). Thus, it makes sense that developmentally, the reader might start using initial and final letters before those in the medial position and before using subword chunks.
In the next section, we describe the kinds of strategy use to solve words that have been observed in the context of reading. The findings from these next studies informed our choice of items for the RODM.

1.1.3. Observed Strategies in Use

In a cross-sectional study, Lindberg et al. (2011) used video analysis and student self-reports to describe decoding strategy use as second and fourth grade students read 32 words, (common words, uncommon words, and pseudowords). They found that students in both grades used multiple strategies across and within the 32 words; and their use varied in flexible, adaptive ways in response to whether the word was a common word, an uncommon word, or a pseudoword. Lindberg and colleagues identified multiple categories of strategy use: using word parts, using analogies to known words, using syllables, and letter by letter reading. There were also significant grade-related differences, with fourth graders making better skilled adaptive choices, suggesting a growing proficiency with word solving strategies.
Johnson et al. (2024) used a longitudinal design and microgenetics methods to describe the word solving strategies of six-to-nine-year-old students, all reading below grade level expectations, over a nine-week-period as they read aloud narrative genre passages, a different passage each time, approximately three times a week for about 10 min each time. The level of text was increased according to the students’ improving reading proficiency over the nine weeks with the goal of keeping accuracy at around 90 percent (see Rodgers et al. (2018) for a rationale); this was to ensure that students were stimulated to use word solving strategies but not frustrated by the difficulty of the task. The unit of analysis was a word solving cycle, defined as units of time that began with the student stopping at a word they could not retrieve automatically and ending when reading automatically resumed. All reading was videoed (n = 296) and word solving cycles (n = 1367) transcribed so that everything the student said while solving could be analyzed.
Johnson et al. (2024) observed the following reading behaviors at difficulty: (1) attempting a whole word (saying either a real or nonsense word), attempting a part of the word (sometimes correctly or incorrectly), (2) asking for help (3) omitting a word, (4) inserting a word (5) fixing an error, and rereading text before attempting to solve. They also observed increasing sophistication and variability in strategy use during word solving cycles over the nine-week period; lending support to the view that changes in strategy use may be a valid characterization of reading proficiency or change over time.
Johnson and colleagues’ 2024 study extends Lindberg et al.’s (2011) because students read passages instead of words in isolation. Thus, rereading as a backup strategy became apparent, one that could not be observed when reading words in isolation. Johnston et al. noted intra- and inter-individual differences in terms of how much material was reread, listed here in increasing sophistication in terms of the efficiency involved: rereading a whole line, rereading multiple words, rereading the previous word, the same word, or simply parts of the word. Students were observed using combinations of these strategies with inter-individual and intra-individual differences observed across the word solving cycles.
Kaye’s (2006) longitudinal observational study of proficient second-grade students reading revealed similar patterns of adaptive and variable strategy use as Johnson and colleagues, even though the students in Kaye’s study were proficient older readers. Kaye analyzed more than 2500 word solving attempts and observed many of the same word solving strategies as Johnson et al.—substituting whole words, rereading, omitting and inserting words, and using these strategies in variable ways from one unfamiliar word to the next. Unlike Lindberg et al. (2011) whose students read words in isolation, Kaye (2006) did not observe a single instance of a second grader using individual letters to identify unknown words; instead, they usually worked with larger sub-word level units.
In sum, strong theory and empirical evidence support the idea that beginning readers learn how to perceive the orthographic information on the page in a common way, starting with using letters in the initial position, then final letters, and finally, using letters in the medial position. They progress on to using letter chunks such as blends, syllables and rimes, because these are more efficient word solving strategies that involve fewer grapheme-phoneme connections to store the word in memory (Ehri, 1975, 2022).
Adams (1990) provides a very useful example to make the point that skilled readers use larger chunks of words than individual letters, inviting the reader to identify these unfamiliar words: trypsinogen, anfractuosity, prolegomenous, and interfascicular (p. 25). The preferred backup strategy of a skilled reader may be to use larger units than individual letters to decode these long words. With the help of Microsoft CoPilot (2025), we take the example one step further to embed the words in text, to make the flexible use of multiple backup strategies more apparent:
The prolegomenous study of pancreatic enzymes revealed that trypsinogen plays a key role in digestion, its activation sparking a cascade of chemical reactions. Yet, the path to understanding its behavior was anything but straightforward, marked by the anfractuosity of cellular structures and the intricacies of interfascicular signaling within tissues.
No doubt readers will have applied a variety of word solving strategies to read the preceding passage, using automatic retrieval to read the known words, and noticing and stopping to identify words that are not available with automaticity, looking for familiar parts, trying syllables, looking closely to make sure all parts of the word in the initial, medial and final positions are used while preserving serial order of the letters, making multiple attempts, and rereading parts of the word and even parts of sentences.
In the next section, we describe the backup strategies that are included with the RODM. These strategies were informed by our review of the empirical and theoretical literature just presented and checked against several hundred records of oral reading, collected as part of an extant dataset maintained by the second author as part of a separate project.

1.2. Administering and Interpreting the RODM

Using the RODM involves two steps: using standard coding to produce a written record of all oral reading and then interpreting the errors to determine the frequency of using each backup strategy.

1.2.1. RODM Backup Strategies

In our development of the RODM, we focused on two broad backup strategy categories that were evident in the research we reviewed: rereading, and using parts of words, which we refer to as phonic elements. In the next sections we define them and describe how we ordered them in terms of proficient use. For each, the assessor makes a decision as to the frequency of use, on a three-point scale, from 0 to 2, with “0” meaning the element was never used, “1” denoting sometimes used, and “2” meaning often used.
In general, if the RODM provides valid results aligned with overlapping wave theory and our understanding about development in orthographic processing, we should find proficiency associated with adaptive strategy use. This means we should see more proficient readers using multiple strategies and adapting them to new problems presented by increasing text difficulty.
Using Phonic Elements (Sub-Word Parts) as a Backup Strategy
The theories and the empirical evidence cited in the previous section led us to identify the following items for the RODM phonic elements: letters in the initial position only (for example, saying tall for tree), letters in the initial and medial positions (something for sometimes), letters in the initial and final positions (faster for first), letters in the initial, medial and final position (waked for walked), medial letters only (lot for dog), final letters only (can’t for shouldn’t), and medial and final letters only (taller for smaller).
After categorizing errors by phonic elements present, the assessor then, in a secondary examination of the errors, categorizes which errors contain (1) rimes that were present in the word and (2) initial blends and initial digraphs. We did not examine blends and digraphs that appear in other positions because letters in that position would be captured by one of the other phonic elements and so would be redundant and burdensome. While it is true that coding initial blends or initial digraphs is also duplicative with coding initial position match, we wanted to note this milestone of going beyond just the first letter to using letters that commonly appear together in the initial position, in the English language. Serial order had to be kept when comparing the error to the word in the text.
Given the research and theory we reviewed, we expected to find in our validation analysis that readers would use a greater number and variety of phonic elements as proficiency increased. We also expected that as proficiency increased, readers would use larger grain sizes of print to decode the unfamiliar words, starting with initial letters and moving on to larger subword units and using letters at the end and medial positions.
Using Rereading as a Backup Strategy
As described, Johnson and colleagues (2024) observed students rereading at difficulty when they encountered words they did not know with automatic retrieval. In some cases, readers simply repeated a part of the word they were trying to solve, while in other cases, they went back to the beginning of a line.
One reason posited for rereading at difficulty is that it gives the reader an opportunity to rehear what was just read and that such rehearing might bolster or amplify the reader’s linguistic comprehension at a time of difficulty (Gaskins, 2010). As such, rereading when a difficult word is encountered is likely a key backup strategy. These are some examples of behaviors that counted as rereading:
Text: Jack and Jill went up the hill
Example 1 (rereading a line): “Jack and Jill went up the hill, Jack and Jill went up the hill.”
Example 2 (rereading multiple words): “Jack and Jill, Jack and Jill”
Example 3 (rereading a single word): “Jack, Jack,”
Example 4 (rereading a subword part): “ Ja- Ja-,
In our validation work for the RODM, we studied the frequency, not the grain size of rereading, so all of the preceding examples count as rereading. We expected to find that rereading as a backup strategy would fade with proficiency. We also expected more successful outcomes when backup strategies were employed. In other words, we expected that as proficiency increased self-correction, the successful outcome of using backup strategies, would increase too.

1.2.2. Other Oral Reading Behaviors Included

In addition to judging the frequency of using backup strategies to decode unfamiliar words, we also included other observed behaviors on the RODM: using backup strategies without success (being unable to decode the word) and using backup strategies with success (self-correcting errors). These behaviors are not backup strategies but the two possible outcomes of applying backup strategies.
Outcomes of Applying Backup Strategies: Unsuccessful or Successful Outcomes
We included instances of a student using backup strategies without solving accurately as an item to study because we viewed changes in this item as representing increasing proficiency. We called this action, “noticing but not self-correcting.”
The unsuccessful use of backup strategies was defined as instances when a reader noticed they did not know a word (as evidenced by pausing for more than three seconds, stopping, or asking for help) and then using backup strategies to decode but without a successful result. Here is an example:
Text: Jerry was the fastest runner in the whole school.
Student: “Jerry was the fastest runner in the /wuh/, /wuh/. Jerry was the fastest runner in the, in the wole school.”
In the preceding example, the student tried several backup strategies to decode the word “whole”; here they are in the order they occurred: trying the first letter, (/wuh/, /wuh/), rereading the sentence, rereading multiple words, and then using the rime to produce an inaccurate response: /wole/.
The frequency of noticing but not solving is also scored on a three-point scale, with the caveat that “often” noticing but not solving is not as proficient as “never;” in the latter case, “never” means that all errors that the student made were solved successfully with backup strategies. With growing proficiency, students should more frequently solve words with greater success.
Correcting an Error: Successful Use of Backup Strategies
Errors that were resolved successfully by the student were counted as self-corrections. These were characterized as the successful use of backup strategies. Research has shown that self-correcting behavior significantly and positively predicts early reading progress (D’Agostino et al., 2019) and so it is an important behavior to note when assessing oral reading. In the following example, the reader self-corrected the error of /wole/ for “whole” after applying multiple backup strategies.
Text: Jerry was the fastest runner in the whole school.
Student: “Jerry was the fastest runner in the /wuh/, /wuh/. Jerry was the fastest runner in the, in the wole school. In the whole school.”
Teachers can judge the frequency of self-correcting by first calculating a self-correction ratio (errors self-corrected compared to all errors made) and then judging the frequency of self-correcting: “often” for ratios between 1:1–and 1:4; “sometimes” for self-correcting ratios at or greater than 1:5, and “never” for a self-correction ratio of nil (no errors self-corrected).

1.2.3. Observed Reading Behaviors Excluded from Analysis

In developing a formative assessment, there must be a balance between including as many items as possible to maximize reliability and efficiency in completing an assessment that by design will be administered frequently. Thus, it is important to consider the inclusion of the most important and malleable behaviors that provide useful instructional information. For that reason, even though the following reading behaviors are part of the written record produced when administering the RODM, we excluded them from analysis: inserting words, omitting words, and asking for help.
Teaching students to skip or add words or ask for help at difficulty while reading is unlikely to be an efficient backup strategy and thus not included as part of this formative assessment; instead, beginning reading instruction ought to focus on teaching students how to orthographically map unknown words, not avoid them (see Miles and Ehri (2019) for the rationale).
Nor did we include accurate reading in our analysis because by definition, accurate reading is a result of using automatic retrieval strategies, not backup strategy use. As we will describe, however, the RODM includes codes for omissions, insertions, appeals for help, and self-corrections when administering the assessment to have a complete record of the reading.

1.3. Theory-Driven Validation Analysis

Because we developed the RODM to reflect certain reading and human development theories, we designed a series of psychometric analysis to test if the pattern of RODM scores aligned with the assumptions of the theories. The theories underpinning the RODM articulate how students progress along a reading proficiency continuum, so if the RODM reflects the expected pattern of student performance, teachers can gauge the current status of the student’s strategy use and plan instruction around what the student has to accomplish to progress forward. Given the tenets of overlapping wave theory, we expected that all readers in our study would employ a variety of backup strategies but that backup strategy use would progress in a predictable manner. More specifically, we made the following assumptions that guided our validation analysis:
Assumption 1.
As proficiency increases, readers will use more phonic element backup strategies, thus, the advanced reader will use a greater variety of strategies than average and lower proficiency students.
Assumption 2.
As proficiency increases, readers will progressively focus more on different parts of the word, moving from less efficient strategies such as using only the initial letters to using larger parts of words including blends, digraphs, endings, and rimes, to focusing more on the ending and middle of word.
Assumption 3.
As more proficient students read more fluently and with greater automaticity, such as when reading an easy text, they will shift away from the less efficient strategies and rely almost entirely on the medial and end of words, demonstrating greater flexibility in backup strategy use than less proficient readers.
Assumption 4.
As proficiency increases, students will shift away from rereading and noticing but not self-correcting and increase the degree to which they self-correct.
Assumption 5.
More proficient students will revert to rereading and noticing but not self-correcting on demanding text but will continue to self-correct.
Before testing if RODM scores supported these hypotheses, we examined if raters could code oral reading records with a sufficient degree of interrater reliability and accuracy. We also explored if the RODM response options were more distinguishable when coded polytomously (never, sometimes, always) or dichotomously (never, and sometimes or always).

2. Materials and Methods

2.1. Data Sources

We used two data sources to examine the reliability and validity of RODM scores. Four graduate students who were all experienced teachers, with some RODM experience, were trained more thoroughly to code oral reading records. During the first phase of training, however, before the students were fully prepared to reliably score records, we computed estimates of their interrater reliability and accuracy. We computed the values at an early stage of training to provide reasonable estimates on the consistency and accuracy of teachers with minimal training and experience using the RODM.
Following the completion of training, the coders scored oral reading records that were compiled for another study (D’Agostino & Briggs, 2025). Detailed descriptions of the sample and procedures of the extant data set were provided by D’Agostino and Briggs (2025), so we will describe the data more briefly here. Eight assessors were trained to test 129 (65 male) six-seven year-old students in 13 schools located in one of nine school districts in five USA states from mid-schoolyear to spring in 2022–2023.
Using an array of 75 first-grade books from multiple publishers that covered the range of proficiency expected at first grade, assessors asked each student to read passages aloud. The starting story was intended to be easy for the student to read; this information was obtained from their teachers. Reading continued until oral reading accuracy fell below 90%; thus, each student read a range of passages that represented for them easy (e.g., 97–100% accuracy) to difficult (below 90% accuracy) levels. The maximum number of books ready by any student was seven. The assessors used standard coding procedures to record accurate reading, rereading, fixing, sounding out, and asking for help to produce a complete record of each oral reading. Assessors also scored students’ fluency of each read using the NAEP holistic rubric (United States Department of Education, 1995).

2.2. Scoring the Oral Reading Records

Four graduate students, who were also experienced teachers, were trained to identify and tally phonic elements and backup strategies over four sessions. Three of them had some experience using the RODM in a university reading lab. The graduate students were provided with a detailed codebook that explained each phonic element and described how to recognize them in student errors. The codebook explained how to score: (1) no initial, medial, or final (No IMF); (2) initial; (3) initial and medial; (4) initial and final; (5) initial, medial, and final (IMF); (6) final; (7) blends/digraphs; and (8) rimes. During training, the graduate students were not asked to score medial and final, and medial (those elements were added after training). The codebook also explained how to score rereading, and the two outcomes (noticing but not self-correcting, and self-correcting).
They began the first training session by scoring 16 practice oral reading records that were not from the 129 students in the study. We considered the graduate students comparable to a group of teachers who participated in nominal RODM training after coding the first 16 practice records. The first author also scored the practice records. The graduate students’ codes on the 16 records were compared for accuracy to the first author’s responses as a check on rater accuracy. Thus, we used the data from the 16 practice records to estimate interrater reliability and accuracy among teachers with some experience with the device.
After the graduate student coded the practice records, they met with the first author to discuss their degree of agreement and to reconcile scoring differences. They completed three more training sessions following the same procedure of scoring more practice records and convening with the first authors to discuss their progress and work through scoring idiosyncrasies. By the fourth and final training session, the coders had scored 40 practice records in total, (none of which came from the data set from the 129 students), and reached 90 percent or greater accuracy on all coded items.
The oral reading records from the 129 students were masked (i.e., student names removed) and randomly assigned to the four coders, each receiving an equal number of completed reading records. The records were not double scored because our goal was to achieve accuracy with the anchor, not agreement across coders.

2.3. Data Analysis

Though there have been numerous studies conducted in multiple fields to test overlapping wave theory, the statistical modeling applied in most studies can be characterized as rather basic and not particularly confirmatory. Many studies have relied on simple frequency counts, and thus, have not captured more accurately the ebbing and flowing of waves, which are a cornerstone of the theory.
The Rasch model can be applied to capture cumulative waves, in that, if the model fits the data, lower proficient students are expected to use fewer and the more basic backup strategies, while more proficient students are expected to use the full array of basic to more advanced strategies. Thus, we applied Multifaceted Rasch Analysis using FACETS software (Linacre, 2021) to address Assumptions 1 and 2, and to examine if polytomous or dichotomous scoring best distinguished among proficiency levels.
A cumulative probability model, however, will not properly reflect the notion of overlapping wave theory that postulates the reduction in basic, less efficient strategies by the more advanced student. That tenet of overlapping wave theory is best modeled by the ideal point process, which was first conceived by Thurstone (1927) and advanced as the unfolding model by Coombs (1964). The ideal point process stipulates that a person is most likely to use or endorse items closest to the person on the scale, and least likely to use or endorse items that are farthest from the person (see Roberts et al., 1999, for a more detailed explanation).
Thus, the unfolding model was best suited to test Assumptions 3–5, but unfortunately, to date there are no unfolding software models available to handle the multiple facets that comprised the data set we analyzed. To mimic the unfolding model, we used FACETS software, and reverse coded the more basic elements. By reverse coding the basic elements, the more proficient students were expected to not use many of the basic items (coded 1 or 2) while continuing to use the more advanced items (also coded 1 or 2).
Using SPSS Version 29.0.1.0, we examined interrater reliability by conducting a generalizability analysis with a module developed by Mushquash and O’Connor (2006). We generated G coefficients based on the 16 practice records completed by the four coders. To gauge rater accuracy, we computed the average percentage of matching scores between the first author’s and the coders scores on each of the 11 scored phonic elements and strategies across the 16 practice records. We also computed the overall agreement percentage by computing the average agreement on the 11 elements and strategies.
We started with the proficiency scale that resulted from subjecting students’ accuracy and fluency scores on the books to a FACETS analysis (explained in detail in D’Agostino & Briggs, 2025) to examine the degree to which students’ use of phonic elements, rereading, noticing but not solving, and self-correcting reflected their proficiency in reading. We summed up the number of phonic elements, rereading, and noticing but not solving instances per oral reading record. Then we computed the proportion of the total for each item by dividing the frequency of each one by the sum for each record. We then recoded each proportion into a three-point scale (never, sometimes, often) in multiple ways, such as 0 = 0, 0.01–0.15 = 1, 0.16–1.00 = 2, and 0 = 0, 0.01–0.20 = 1, 0.21–1.00 = 2. We also recoded the proportions into a dichotomous scale of 0 = 0, 0.01–1.00 = 1. For self-corrections, we created a polytomous scale by recoding the proportion of errors self-corrected on each record as 0 = 0, 0.01 to 0.24 = 1, and 0.25–1.00 = 2. We also computed a dichotomous scale by recoding values of 1 and 2 as 1.
After anchoring the students’ reading proficiency values and book calibration difficulties derived from the production of the reading proficiency scale, we added the phonic elements in a subsequent Rasch analysis to examine the degree to which the items fit on the scale. We then ran a separate analysis for rereading and the two outcomes (noticing but not solving and self-correcting). We started the analysis by examining the fit of the polytomous and dichotomous scoring schemes.

3. Results

The reading proficiency Rasch scale produced from the analysis of the accuracy and fluency scores of the 129 students and 75 books (Figure 2 in D’Agostino & Briggs, 2025) is reproduced here as Figure 1. The distribution of students and books (each student or book is represented with an asterisk in their respective columns) is displayed vertically in the figure, with the more proficient students and more difficult books at the top of the figure. As expected from the sampling scheme that was designed to maximize student variance, there is considerable spread among the 129 first-grade students on the proficiency scale. Indeed, the dispersion of students is greater than the spread of the book difficulties. The books were selected to cover multiple grade levels, but without a student sample that represented multiple grades, it was not possible to estimate with a sufficient degree of accuracy the grade-level span of the books from the analyses presented in Figure 1.
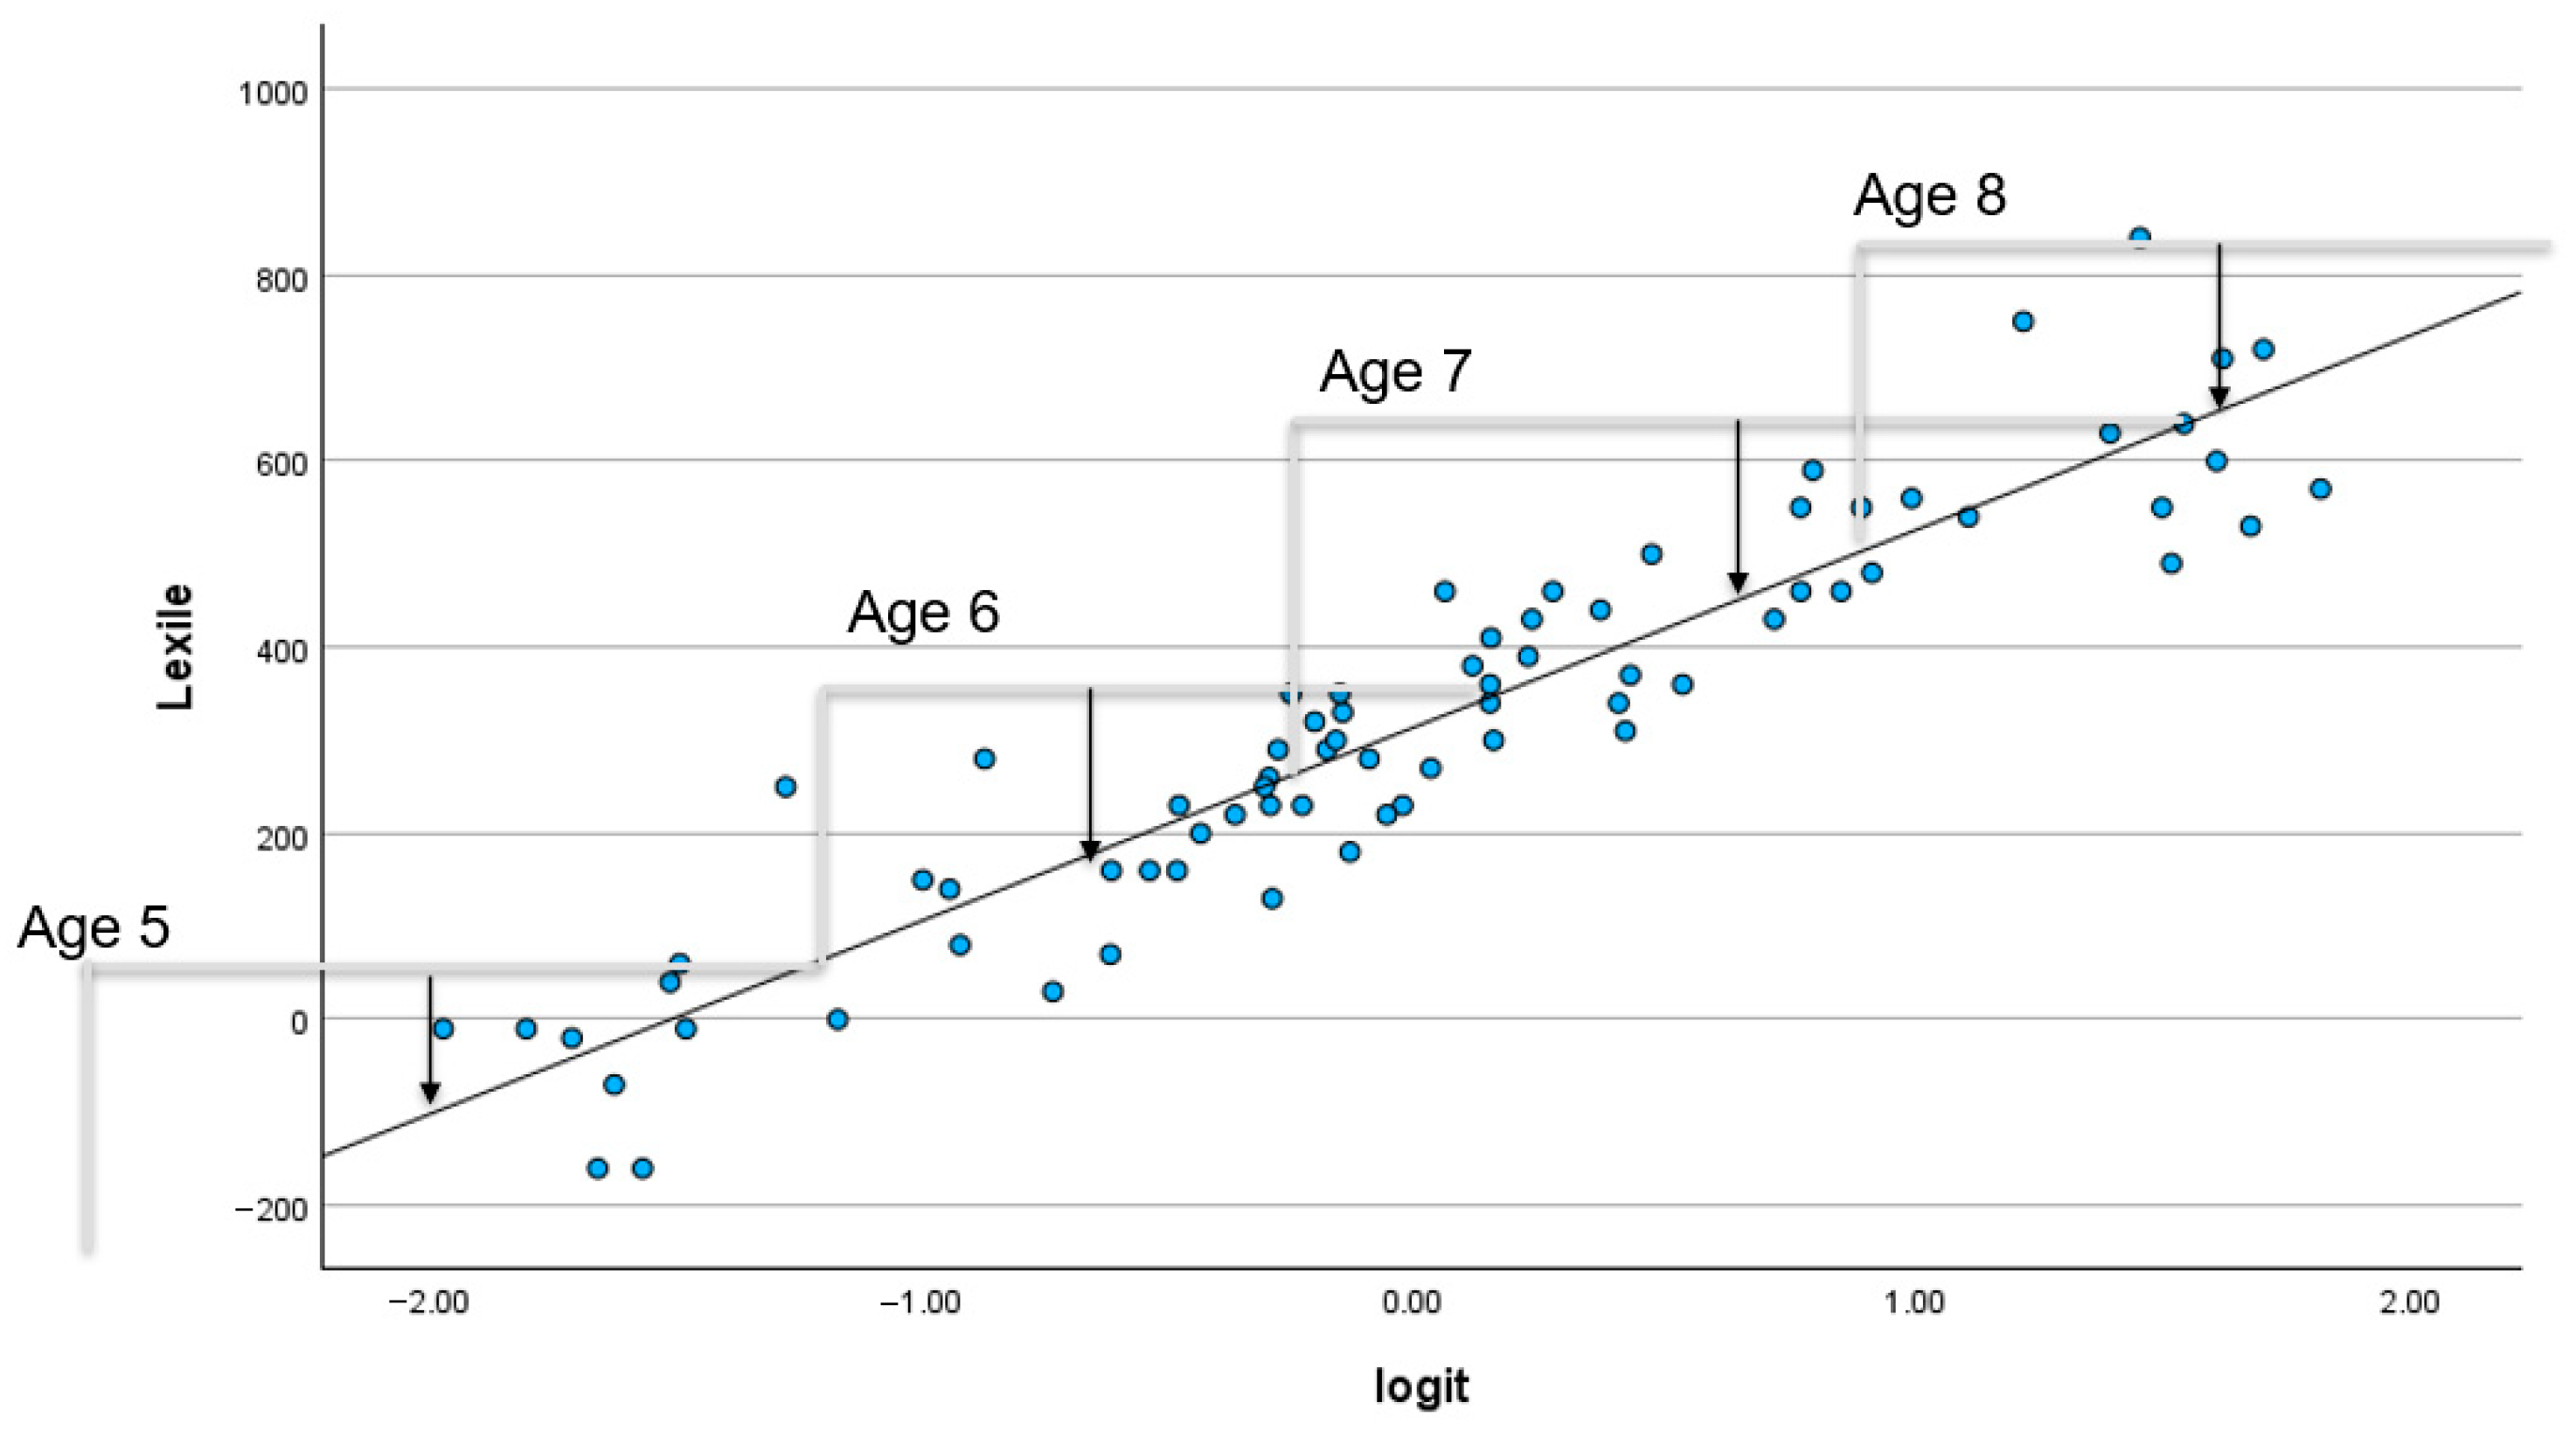
To obtain a better sense of the normative span of books, we obtained the Lexile values for each of the 75 books. The book Lexile and Rasch scale values are plotted in Figure 2. The correlation between the metrics was r = 0.94. The figure also shows the Spring interquartile range (gray lines) and median Lexile scores (arrows) for Ages 5 through 8, which translate to grades K-3 in the US (MetaMetrics, 2024). It is evident from the figure that the books adequately cover the upper half of Age 5 to the lower half of Age 8.

3.1. Identifying the Optimal Response Scale

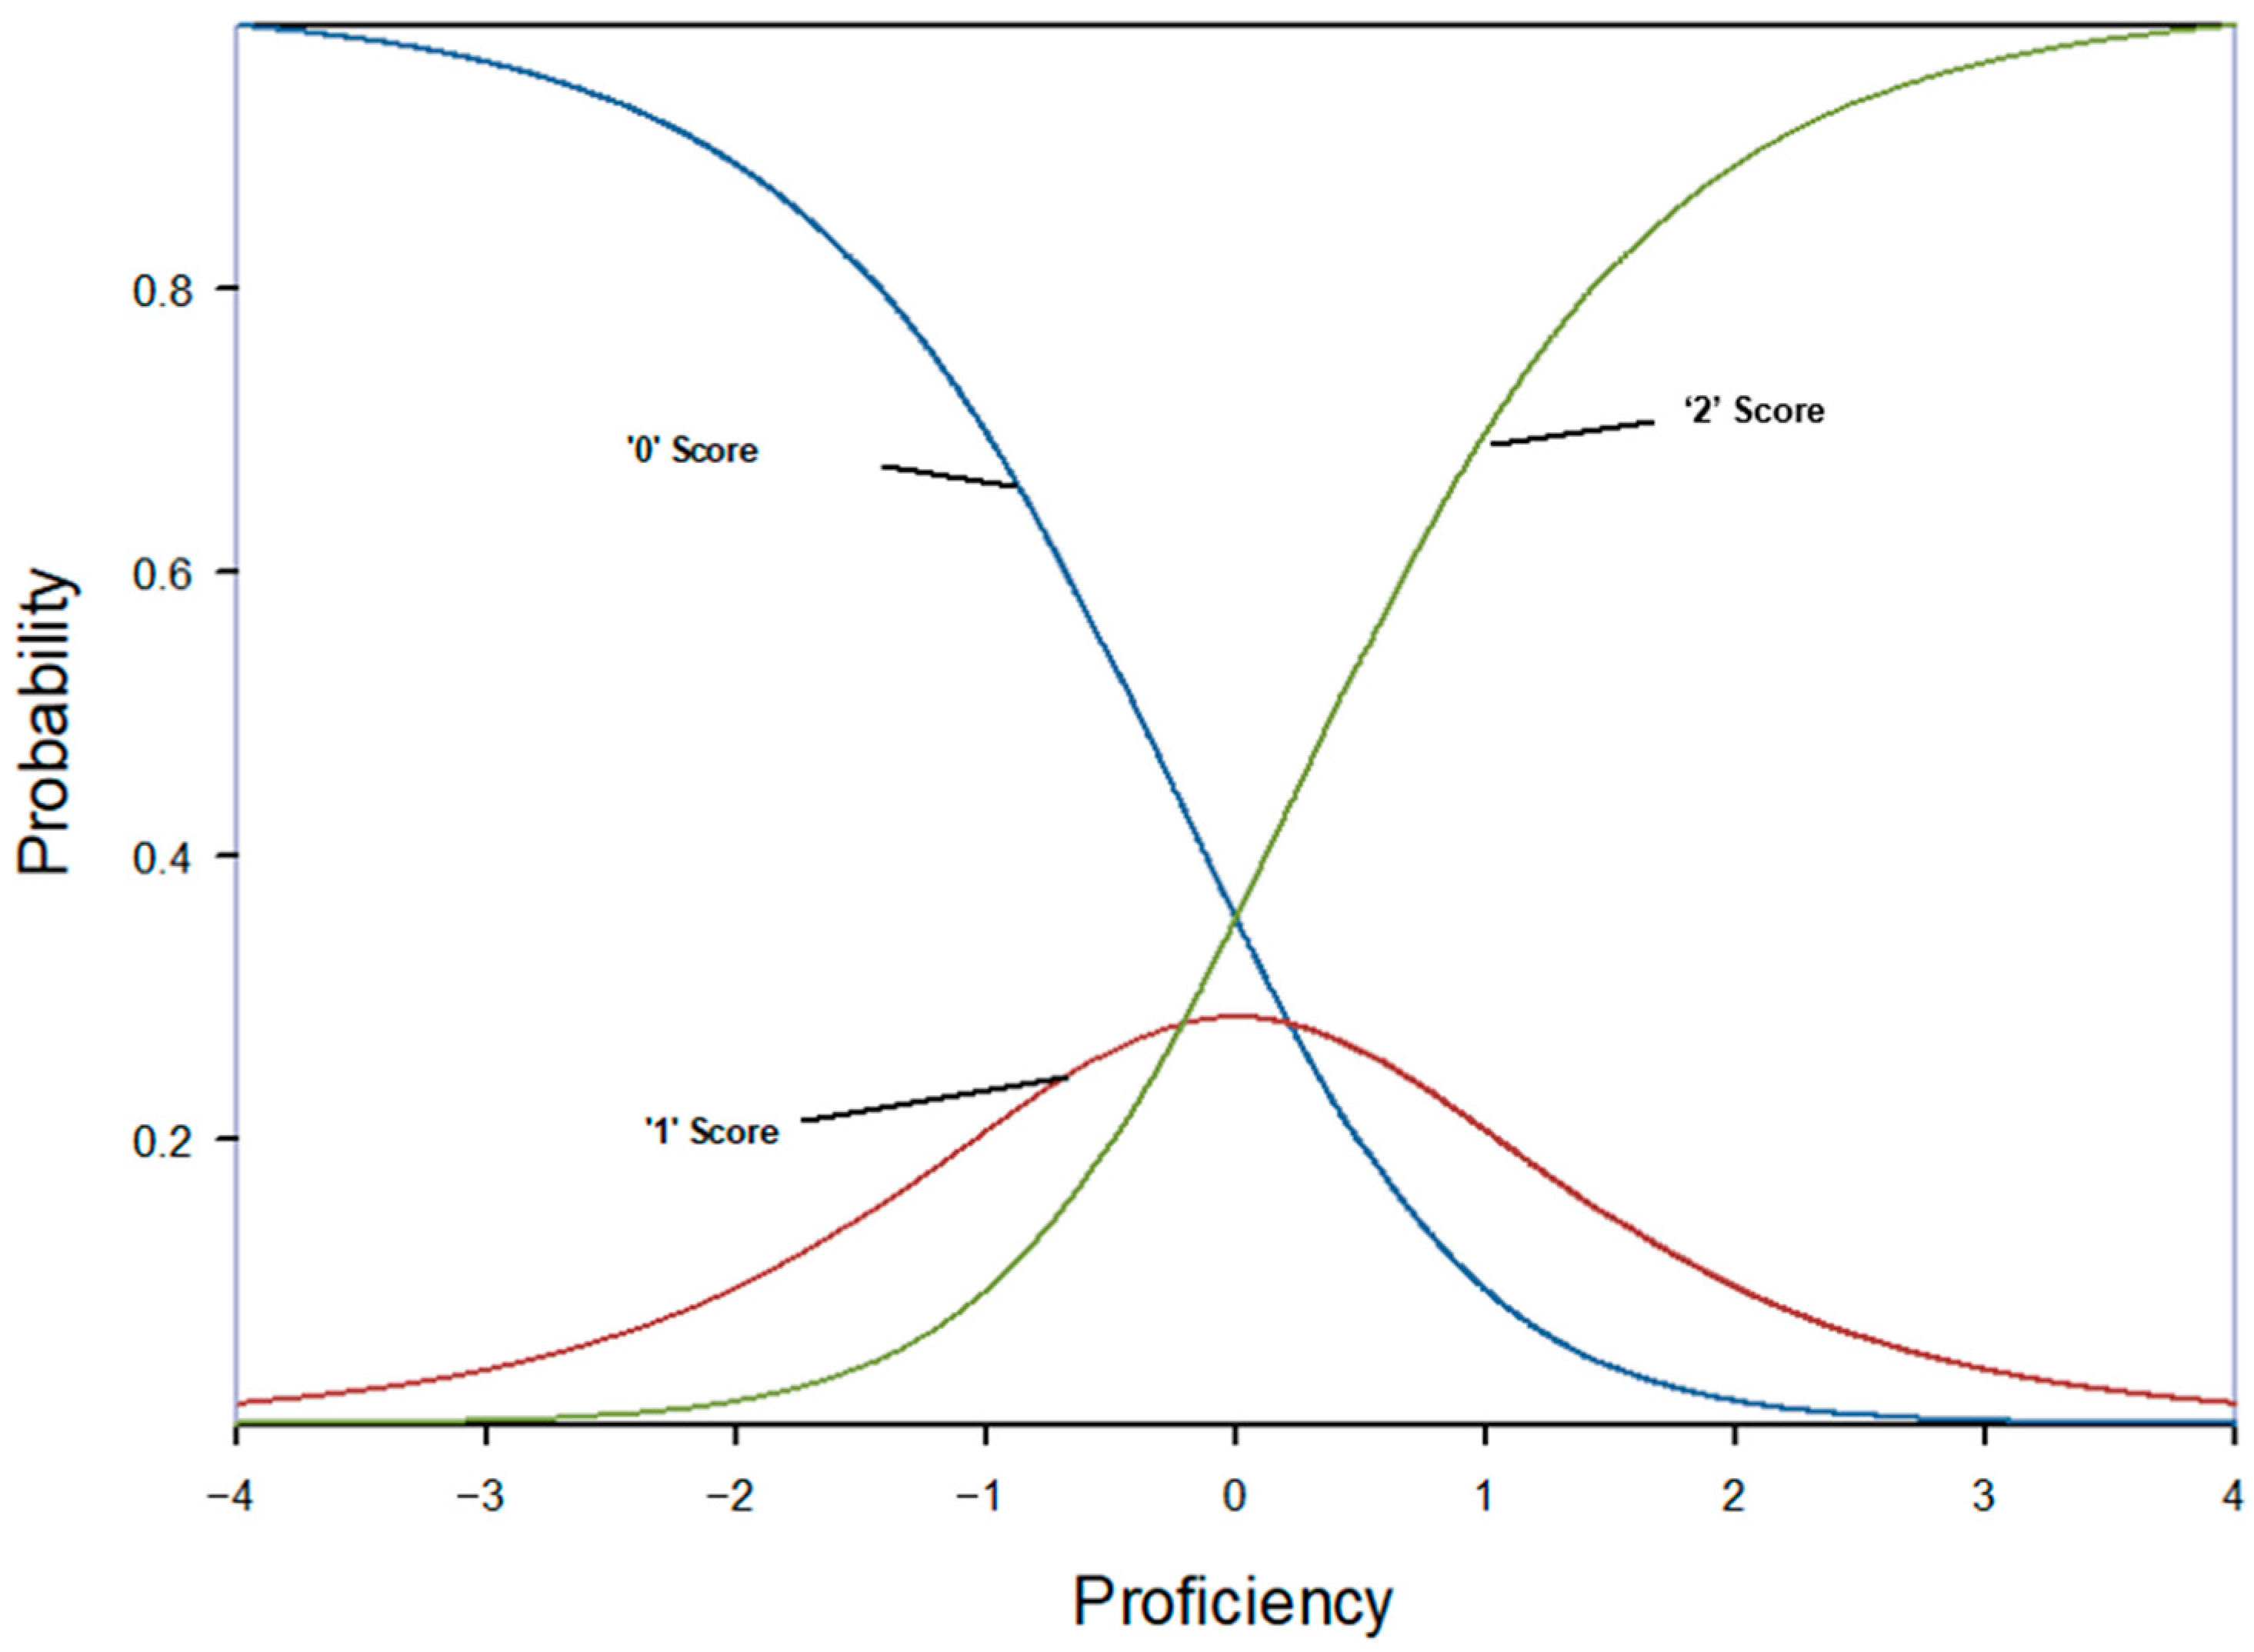
With the student proficiency and book difficulty values anchored, we added the polytomously scored (0–2) phonic elements following a partial credit model. The item outfit and infit statistics indicated poor model fit. Figure 3 displays the typical response category curves for one of the phonic element items. Along the proficiency scale, a score of “1” was never the most probable response, indicating that three scale points were not distinguishable on the scale. The same result occurred after attempting to fit the polytomous rating scale model. We then recoded the “2” values to “1′s” and reran the program with the phonic element items dichotomously scored. The model fit the data well, so we decided to use the dichotomously scored phonic element items for subsequent analyses. The polytomously scored (0–2) rating scale model fit the model that included the rereading, noticing but not self-correcting, and SC Ratio items well, and thus, we treated those items for all analyses as polytomously scored.

3.2. Interrater Reliability and Accuracy

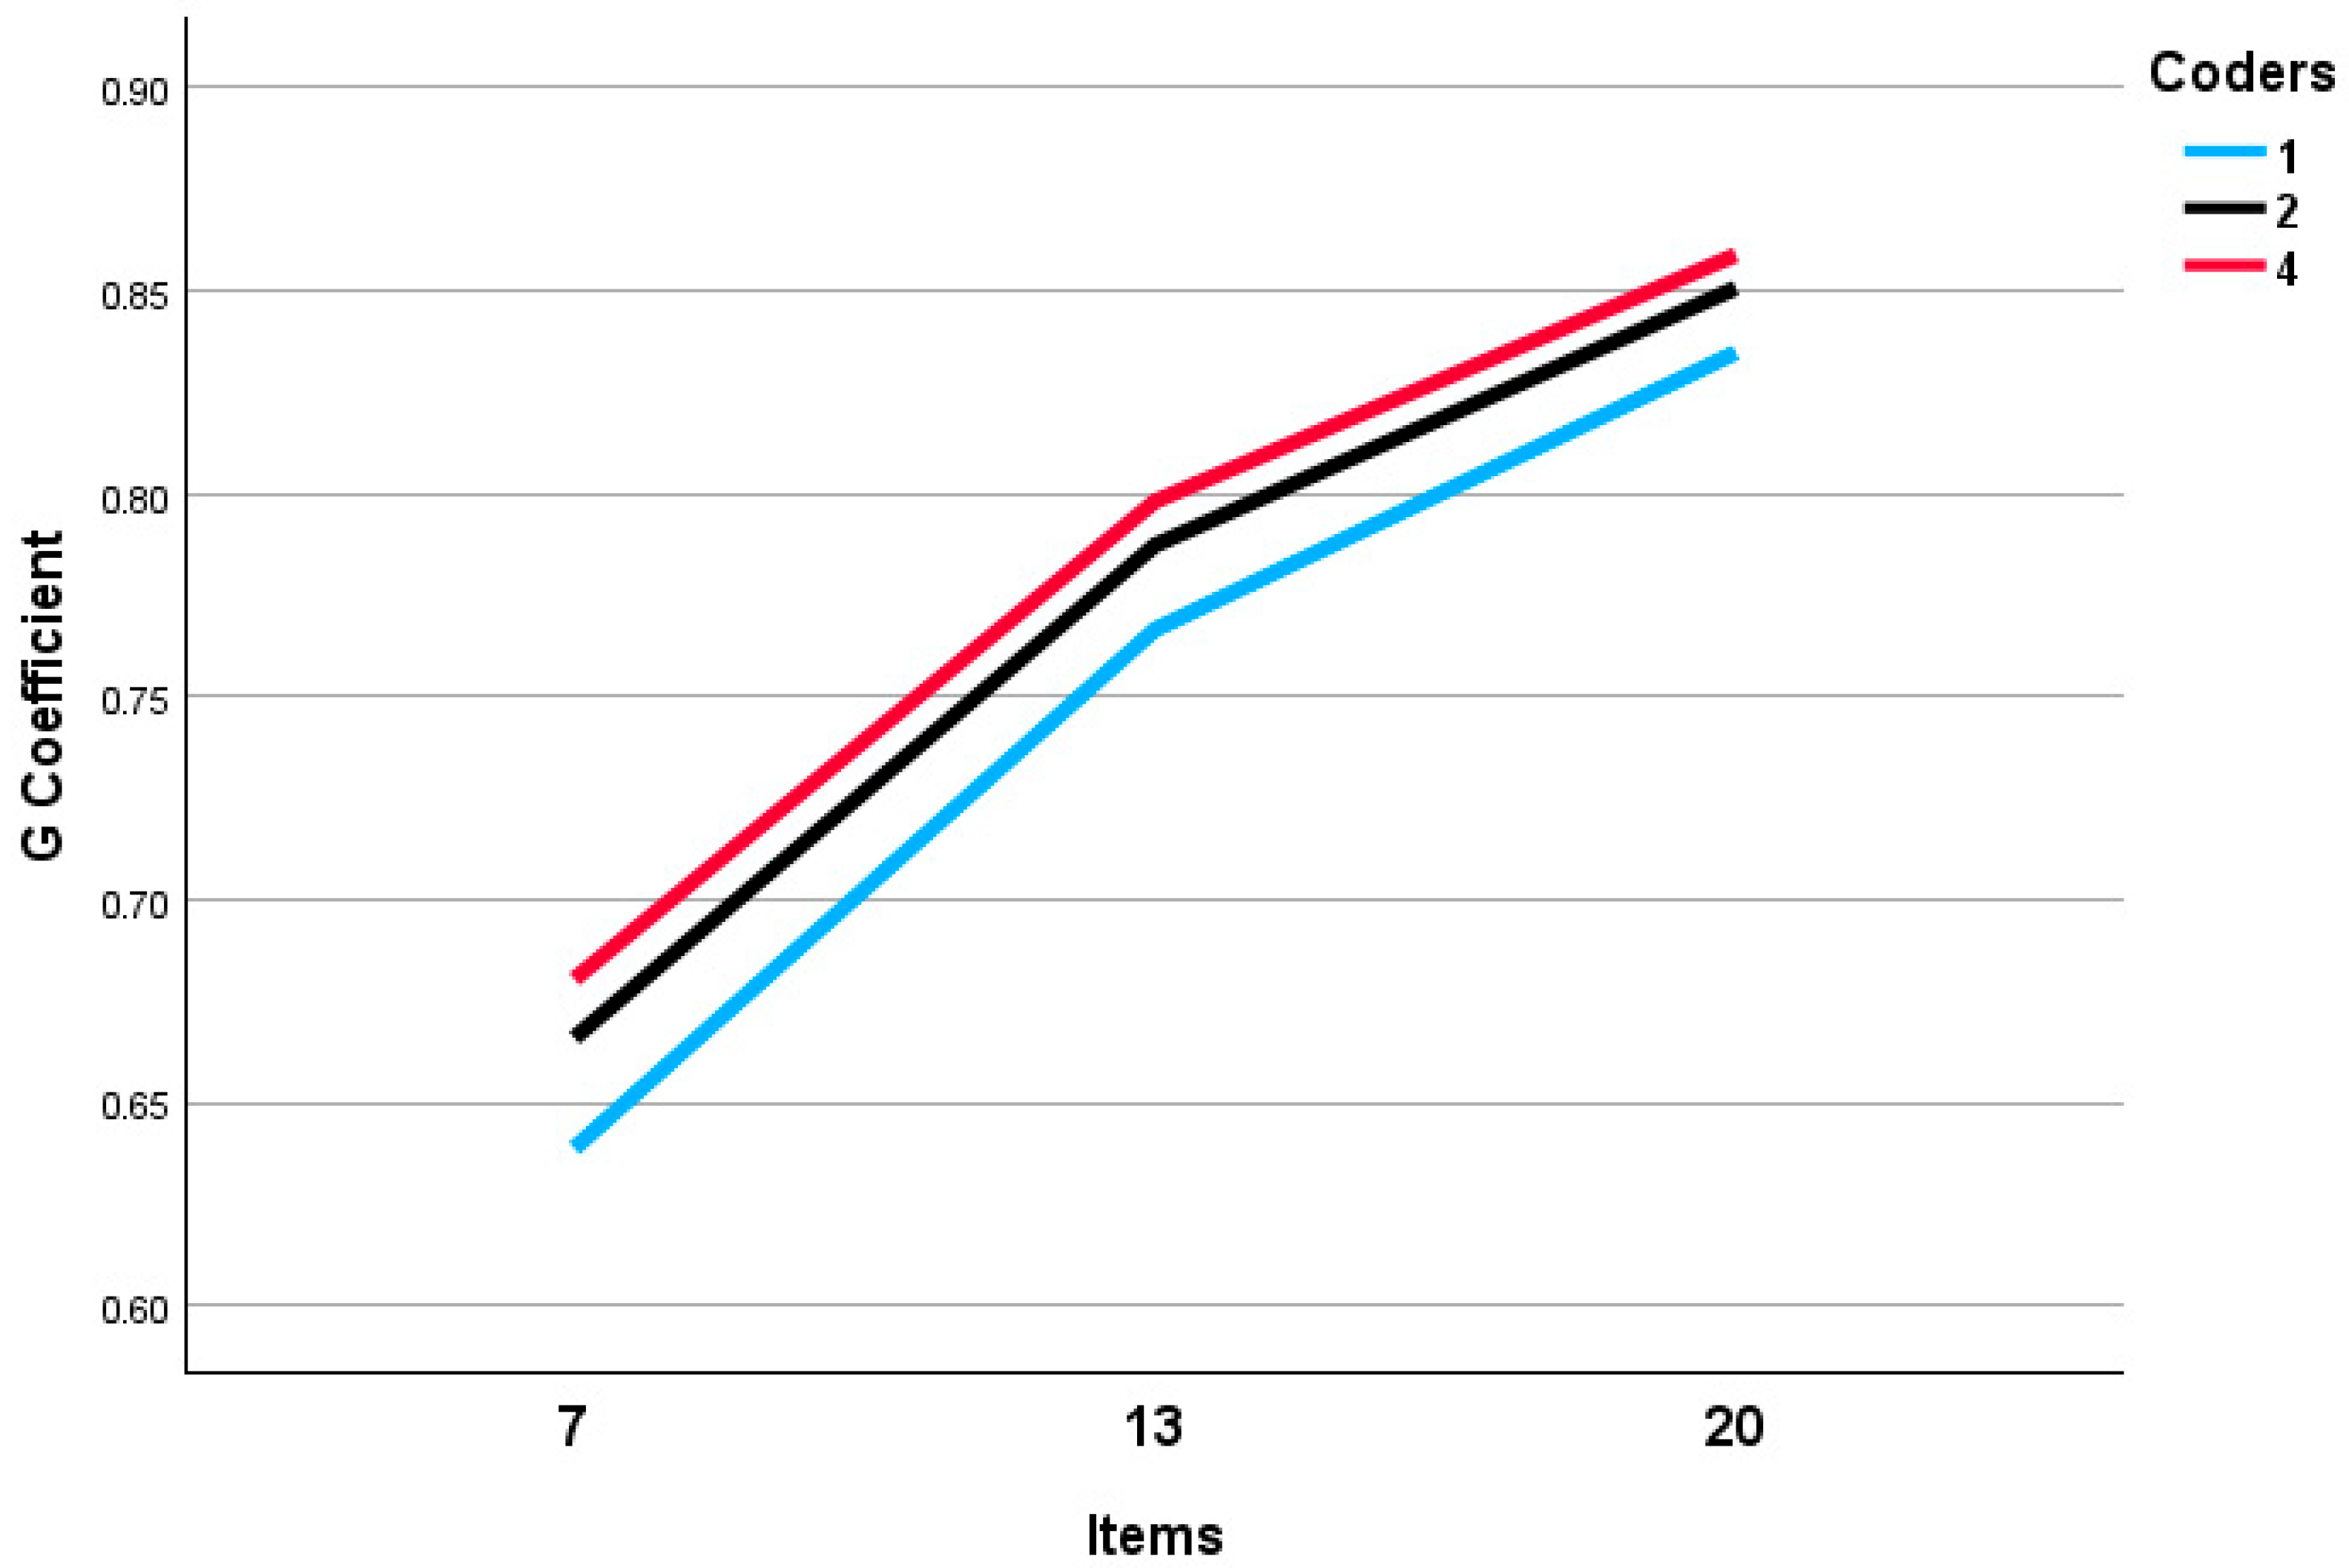
Following the same coding scheme (dichotomous for the phonic elements and polytomous for the other items), we examined the degree of interrater reliability on the practice data using generalizability analysis. Figure 4 presents the results. G-coefficient estimates are plotted by the three possible scenarios of item count (x-axis) and three possible number of coders (lines). For the practice data, the reliability estimate for four coders and 13 items was g = 0.80. If there was one coder, hypothetically, the reliability estimate was predicted to be g = 0.77. Reducing the number of coders to two was expected to yield a g estimate of 0.79. Reducing the number of items coded to almost half (7 items) yielded an estimate of less than g = 0.70, even with four coders. Adding seven more items, hence increasing the number of items by about a 1.5 factor, was predicted to increase the reliability estimate to g = 0.85.
Table 1 provides the degree of agreement between the criterion rater (first author) and the graduate student coders. The agreement rate on the seven items that mostly entailed coding the initial letters was 90% or greater. Initial Final, Final, and Rimes were the phonic elements that were most difficult for raters to score accurately, given that the agreement rate was below 80% on those items. Overall, the agreement rate was 88% after the first practice phase. Training continued until the agreement rate on a set of practice oral records was greater than 90% on all items.

3.3. Testing Assumptions 1 and 2

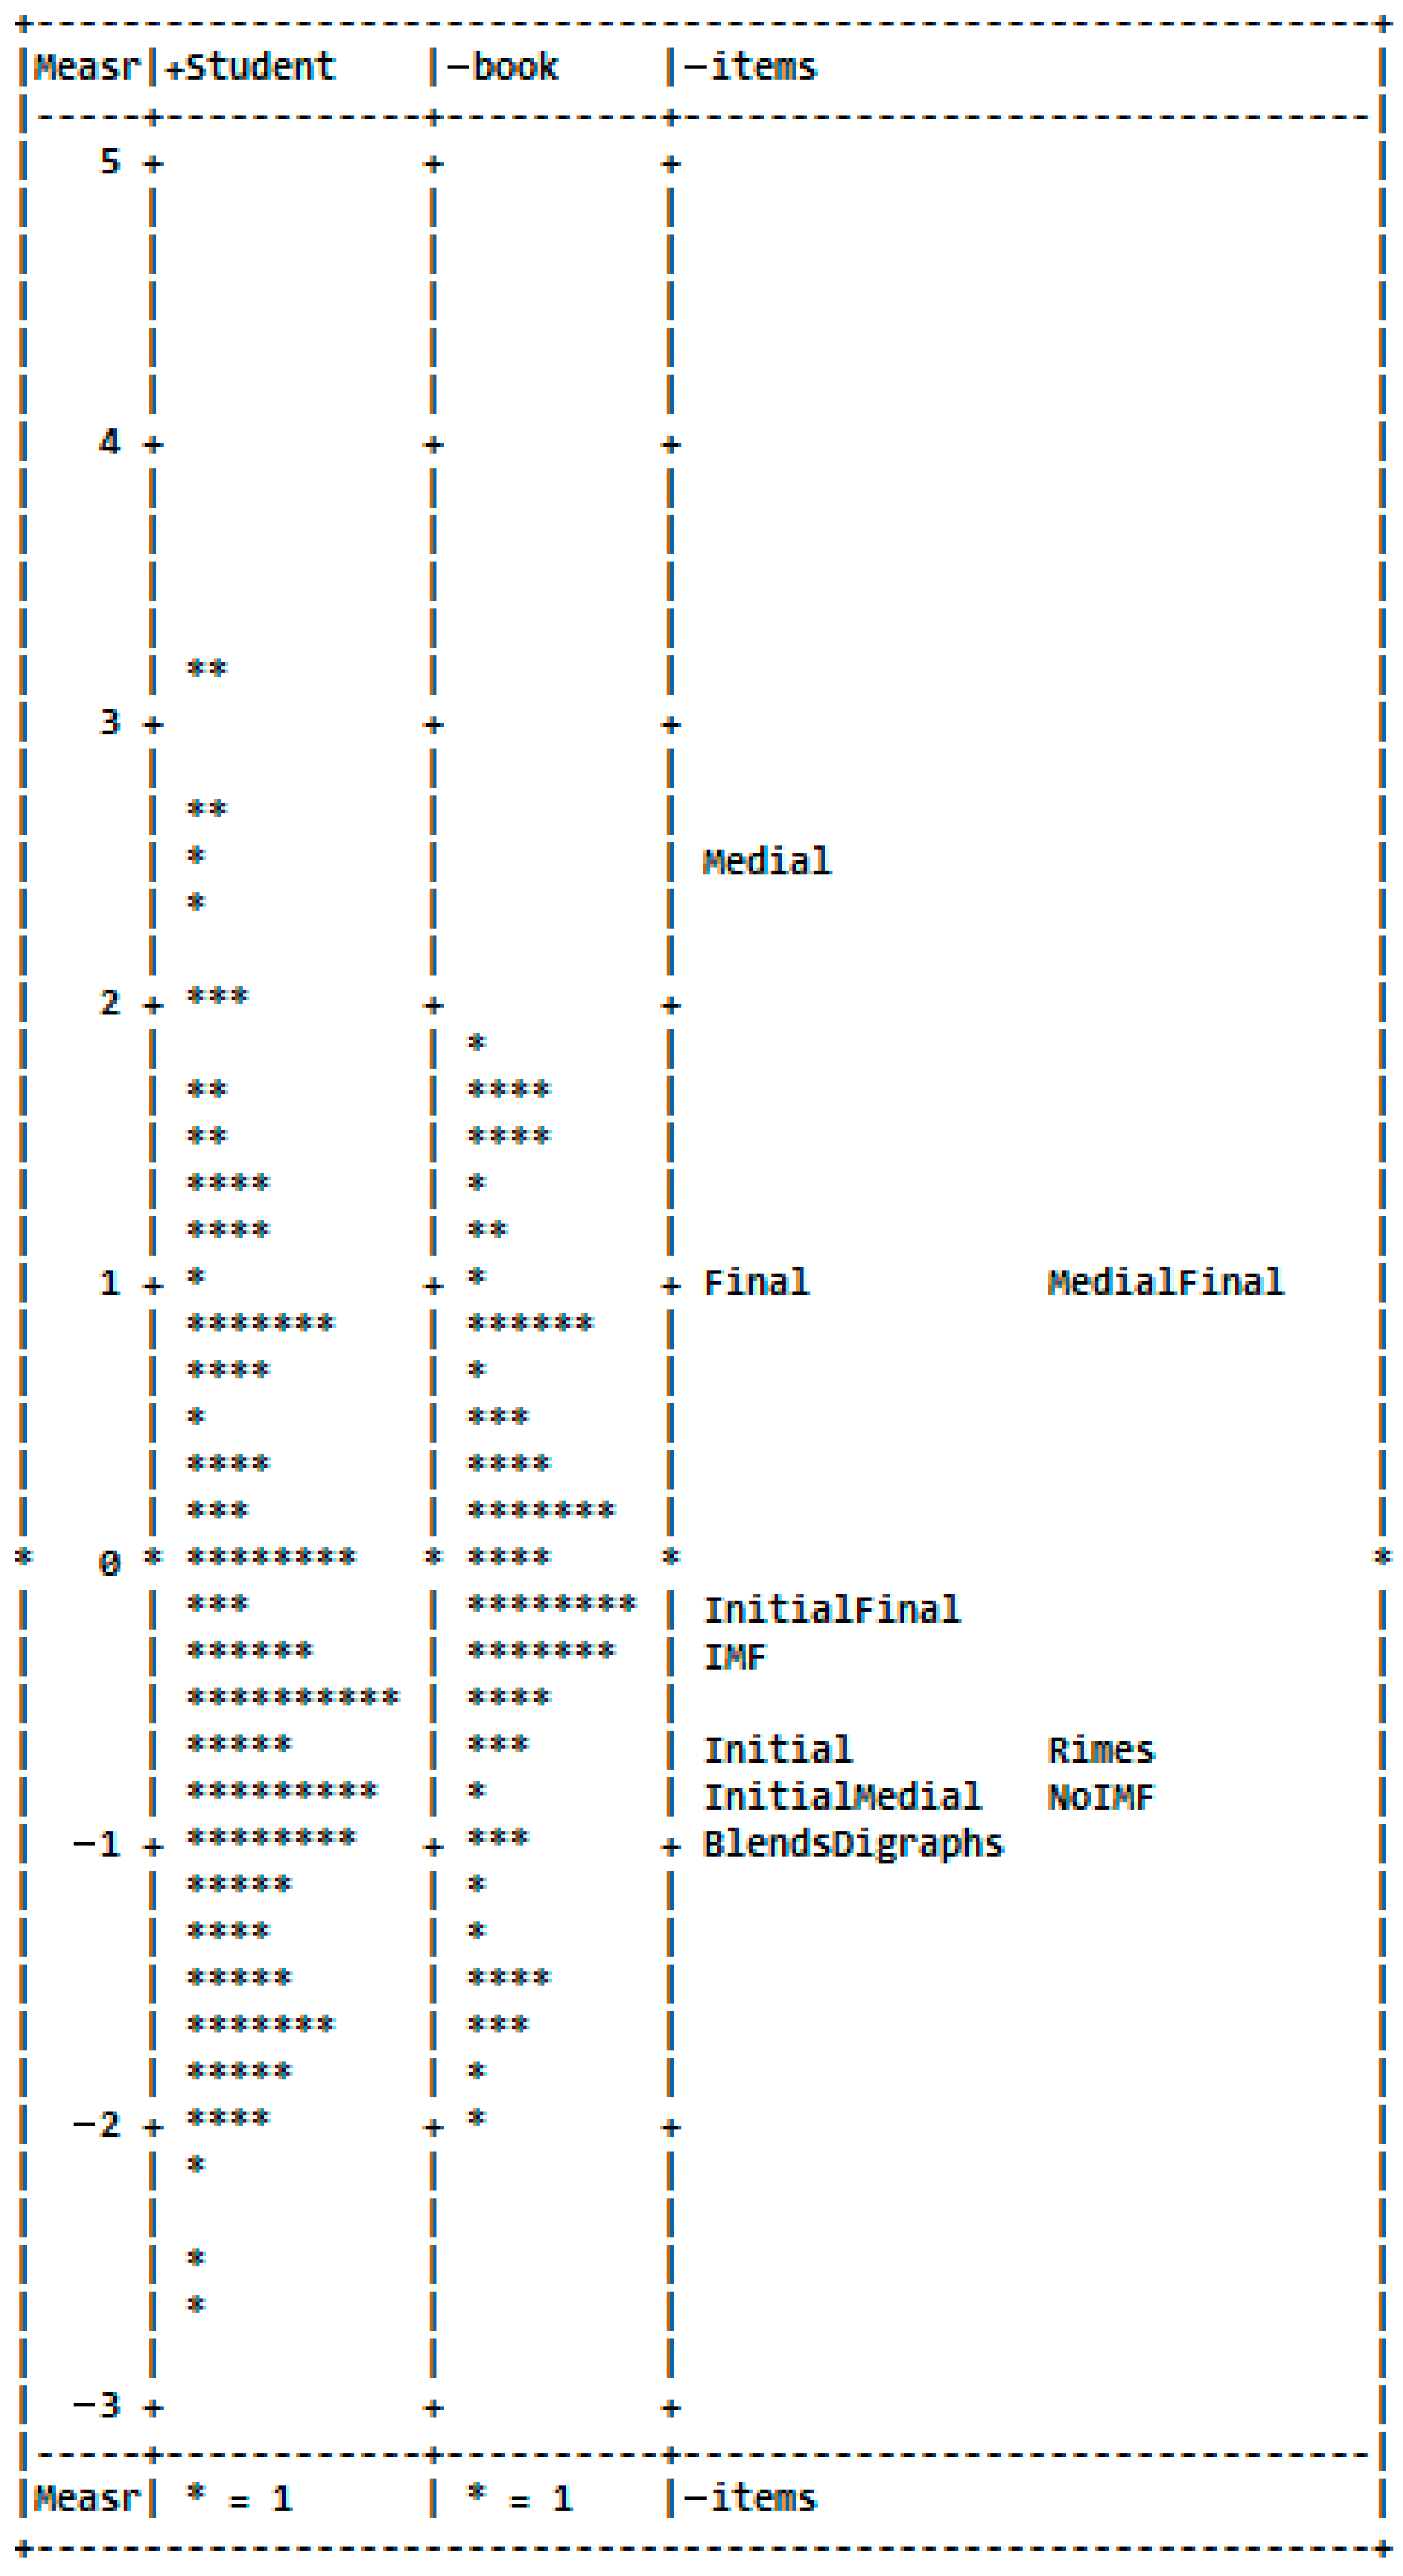
The Wright map of the dichotomously scored phonic elements appears in Figure 5. After coding began, it became evident that students were using medial-final and medial parts of words, so we decided to code the records on those elements as well. The item span across most of the proficiency scale is evident in the Wright map. Items on the scale at the same position as students indicate that students at the items score level had about a 50 percent chance of using that element when word solving. Note that not using initial, medial, or final (No IMF), is indicative of early reading proficiency, as are using the initial parts of words. The most basic elements, such as No IMF, Initial, Initial Medial, Blends/Digraphs, and Rimes, cluster together at the lower end of the scale. The next batch of items are using all three parts of the word (IMF) and initial-final. Following a gap on the scale final and medial appear at a higher level of proficiency, and after another gap, medial appears at the higher end of the scale.
The claim that phonic elements reflect a unidimensional reading proficiency scale is warranted only when there is evidence that the elements fit the Rasch model. Table 2 provides the element scale measures, standard errors (SE), and infit and outfit MNSQ values. Fit values close to 1.00 indicate excellent fit of the Rasch model to the data. Values of 2.00 or greater are evidence of lack of fit, and values from 1.50 to 1.99 arguably demonstrate fit but are less preferred and do not contribute to claims of unidimensionality. Values less than 1 reveal redundancy in the data but do not degrade the fit of the Rasch model to the data. MNSQ stands for mean square residuals, which is the cumulation of residual from the expected student score for an item based on the item difficulty, person proficiency, and book difficulty and the observed student score. Infit MNSQ is weighs response on books and items closer to the student on the scale, whereas outfit weighs responses to items and books farther from the student. All phonic element fit values are within 0.85 to 1.56, revealing good fit of the Rasch model to the phonic elements on the reading proficiency scale.
The phonic element item characteristic curves (ICCs) are presented in Figure 6. The curves follow from left to right the item difficulties. The median Lexile scores for Ages 5–8 are displayed on the proficiency scale (x-axis). Based on the curves, certain inferences can be drawn. Students performing at a median 5-year-old reading level typically have a less than 50 percent chance of using the most basic phonic elements. Between Ages 5 and 6, the more basic elements start to be used more readily, and by the time a student reads a typical Age 6 level, the student demonstrates the use of the basic cluster of phonic elements, mainly focusing on the initial letters in words, most of the time. The median Age 6 student also begins to use medial-final about half the time. From reading levels between Age 6 and 7, students begin to use medial-final and final mor frequently, and by the time the student reads at an Age 8 typical level, medial only becomes more prevalent.
Given that the Rasch model is a cumulative probability model, it can be inferred that as students become more proficient, they tend to add phonic elements into their repertoire. That is, across all the books, the most proficient students had a high probability of using all or nearly all the elements. As student proficiency decreases, the probability of using more elements decreases. Hence, there is less flexibility in using phonic elements among lower proficient students and greater flexibility among more proficient students.

3.4. Testing Assumption 3

Our next step was to examine the pattern of phonic element use when students read more challenging and easier books. To examine shifts in phonic element use as a function of task difficulty, we examined the fit of items to books that were easier and more difficult for students. To partition the data, we first computed the scale difference in logits between the student proficiency score and book difficulty calibration. The median overall difference was 0.06 logits. All oral records above the median difference were considered less challenging for students, and all books below the median were considered challenging for students.
On the more demanding books, the phonic element measures, ICCs, and fit statistics were comparable to those that resulted from the overall analyses. The measures and fit statistics (Columns 4 and 5) for the phonic elements on easier books are provided in Table 3. The phonic element fit deteriorates sharply for all items below Initial-Final on the scale. The pattern of misfit, especially given the large outfit values on the more basic phonic elements, reveals that more proficient students tended to not use those elements on easier books. We then reverse coded all items below Initial-Final on the scale. The last two columns of Table 3 present the resulting fit values for the phonic elements after the run with the basic elements reverse coded. The improved fit values for the reverse coded items were within expectations of a unidimensional scale.
Figure 7 presents the ICC values for the phonic elements on the easier books. Students functioning between Ages 5 and 6 continue to focus on the beginning of the word when word solving, whereas the more proficient students who are reading at an Age 6 or greater level tend to shift away from focusing on the beginning of words when word solving and move toward focusing on the medial and final parts of words almost entirely.

3.5. Testing Assumptions 4 and 5

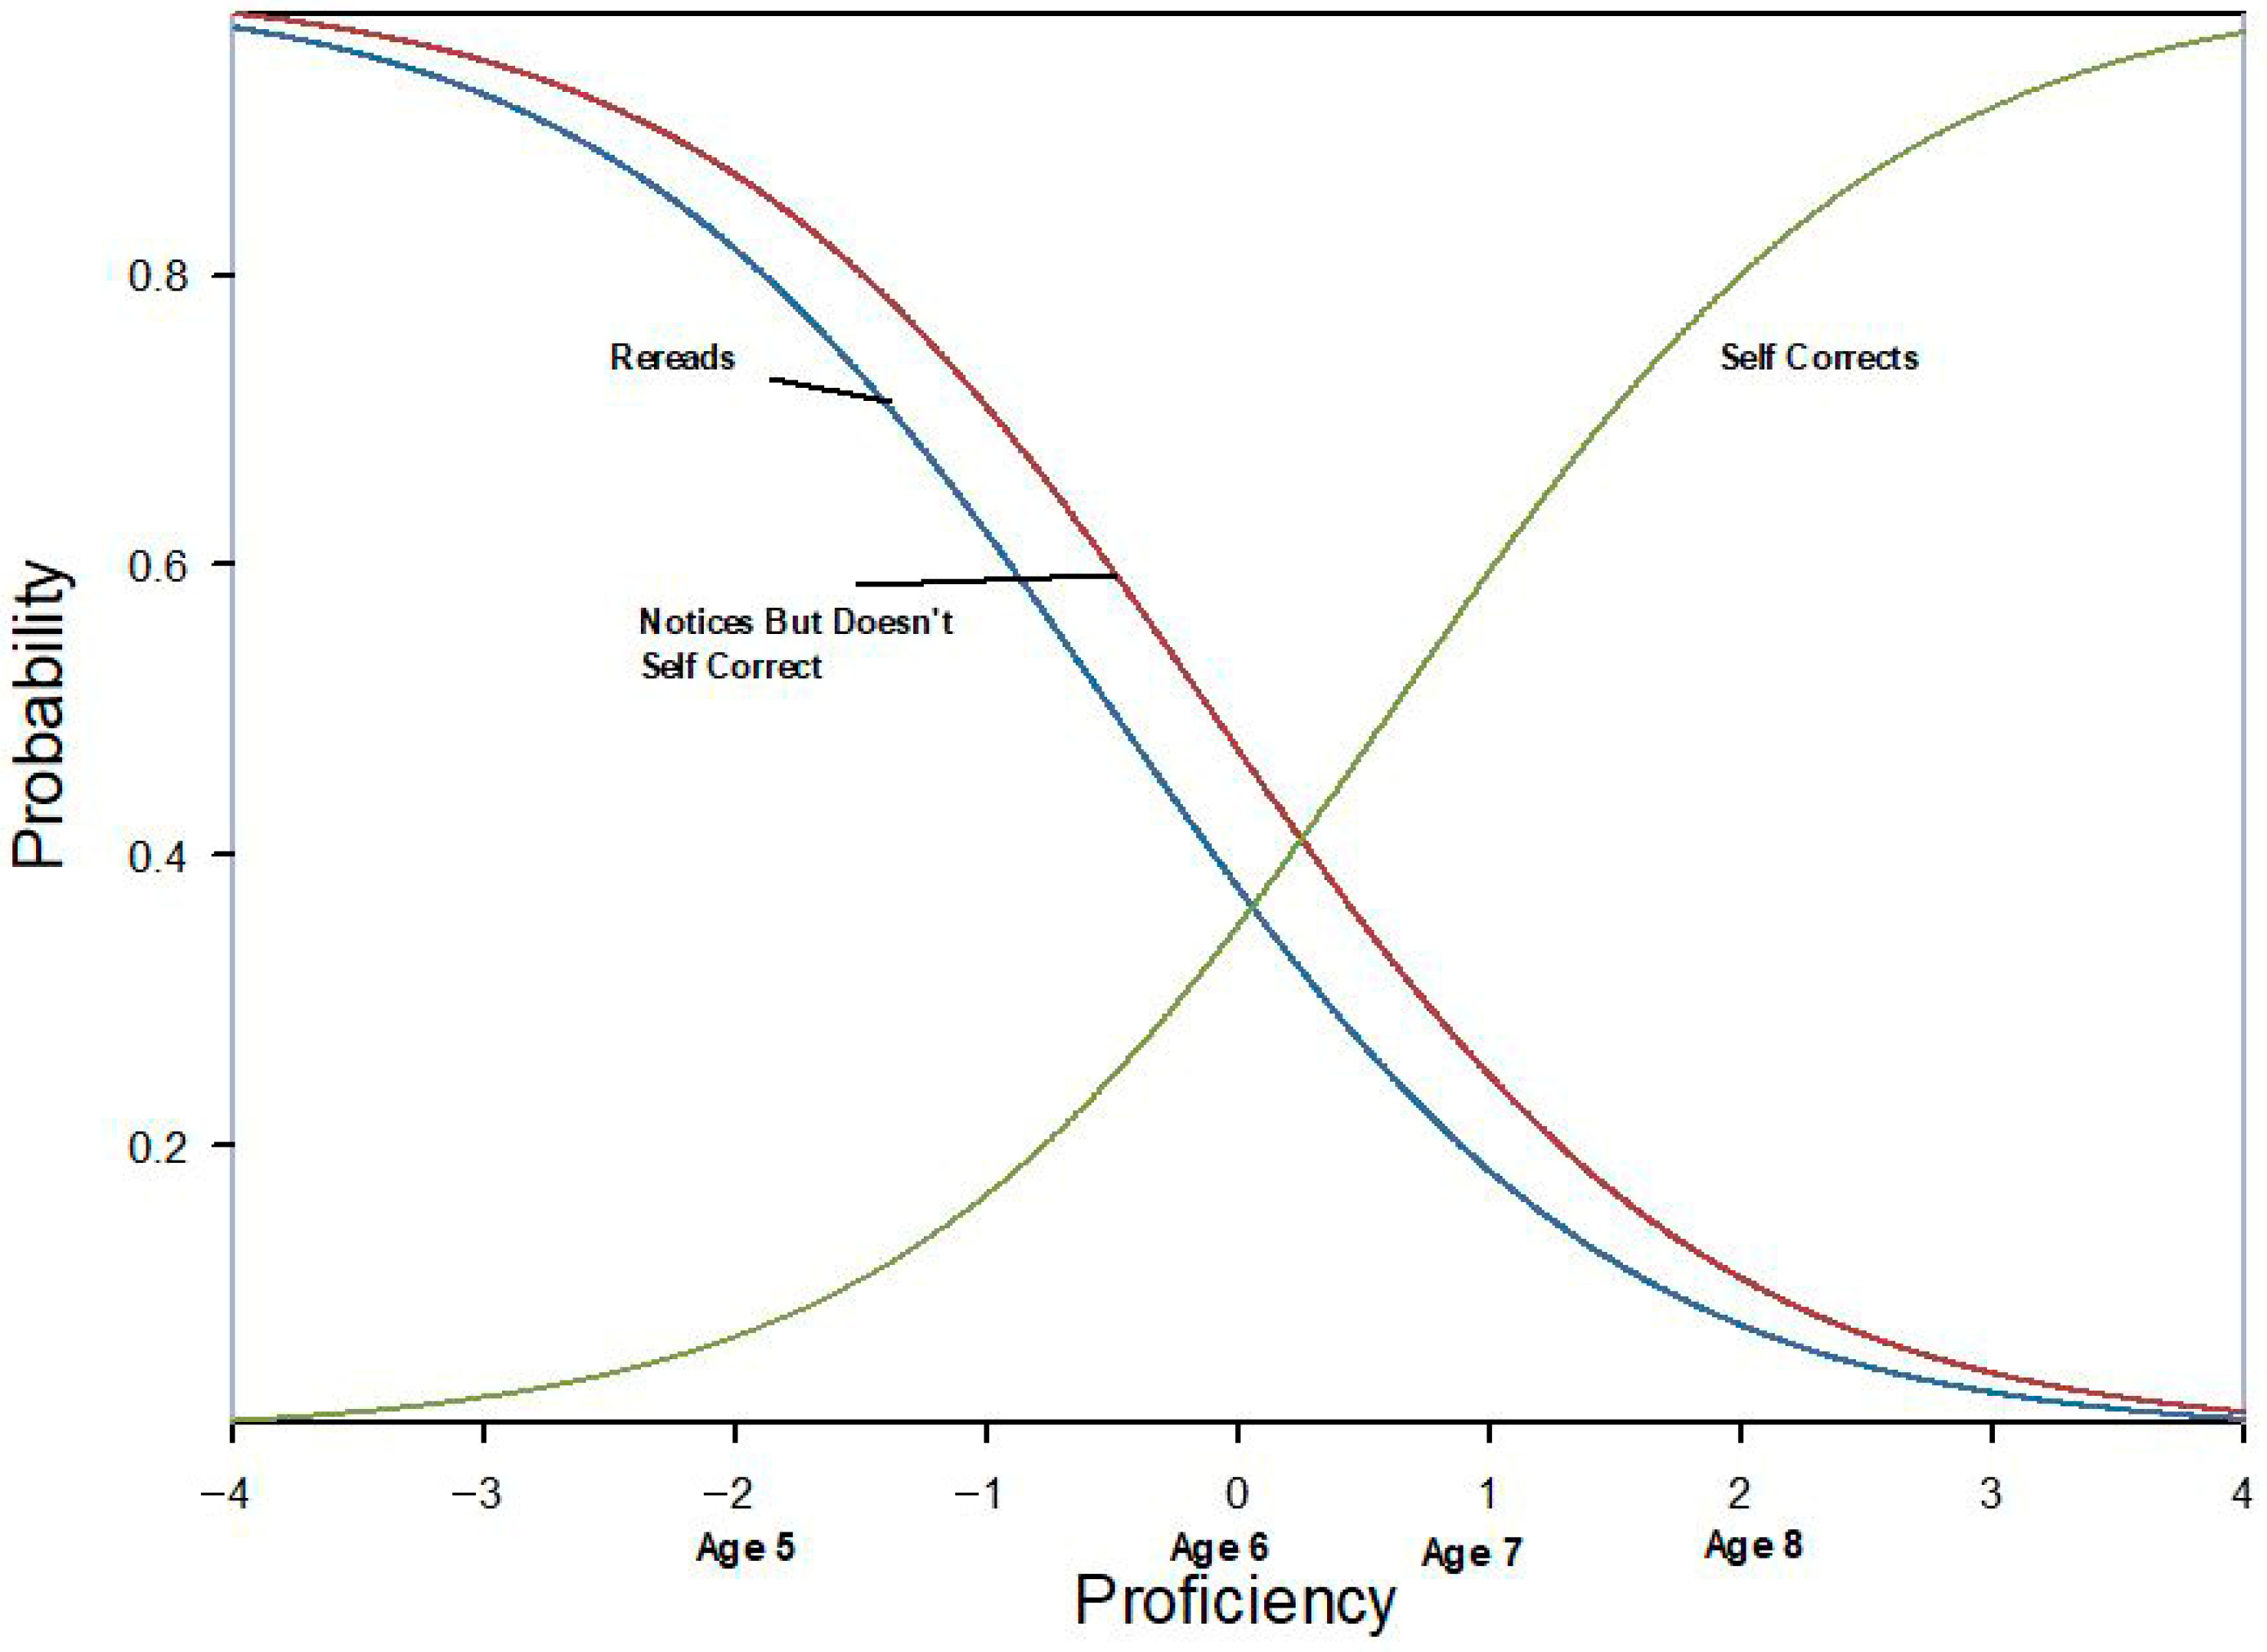
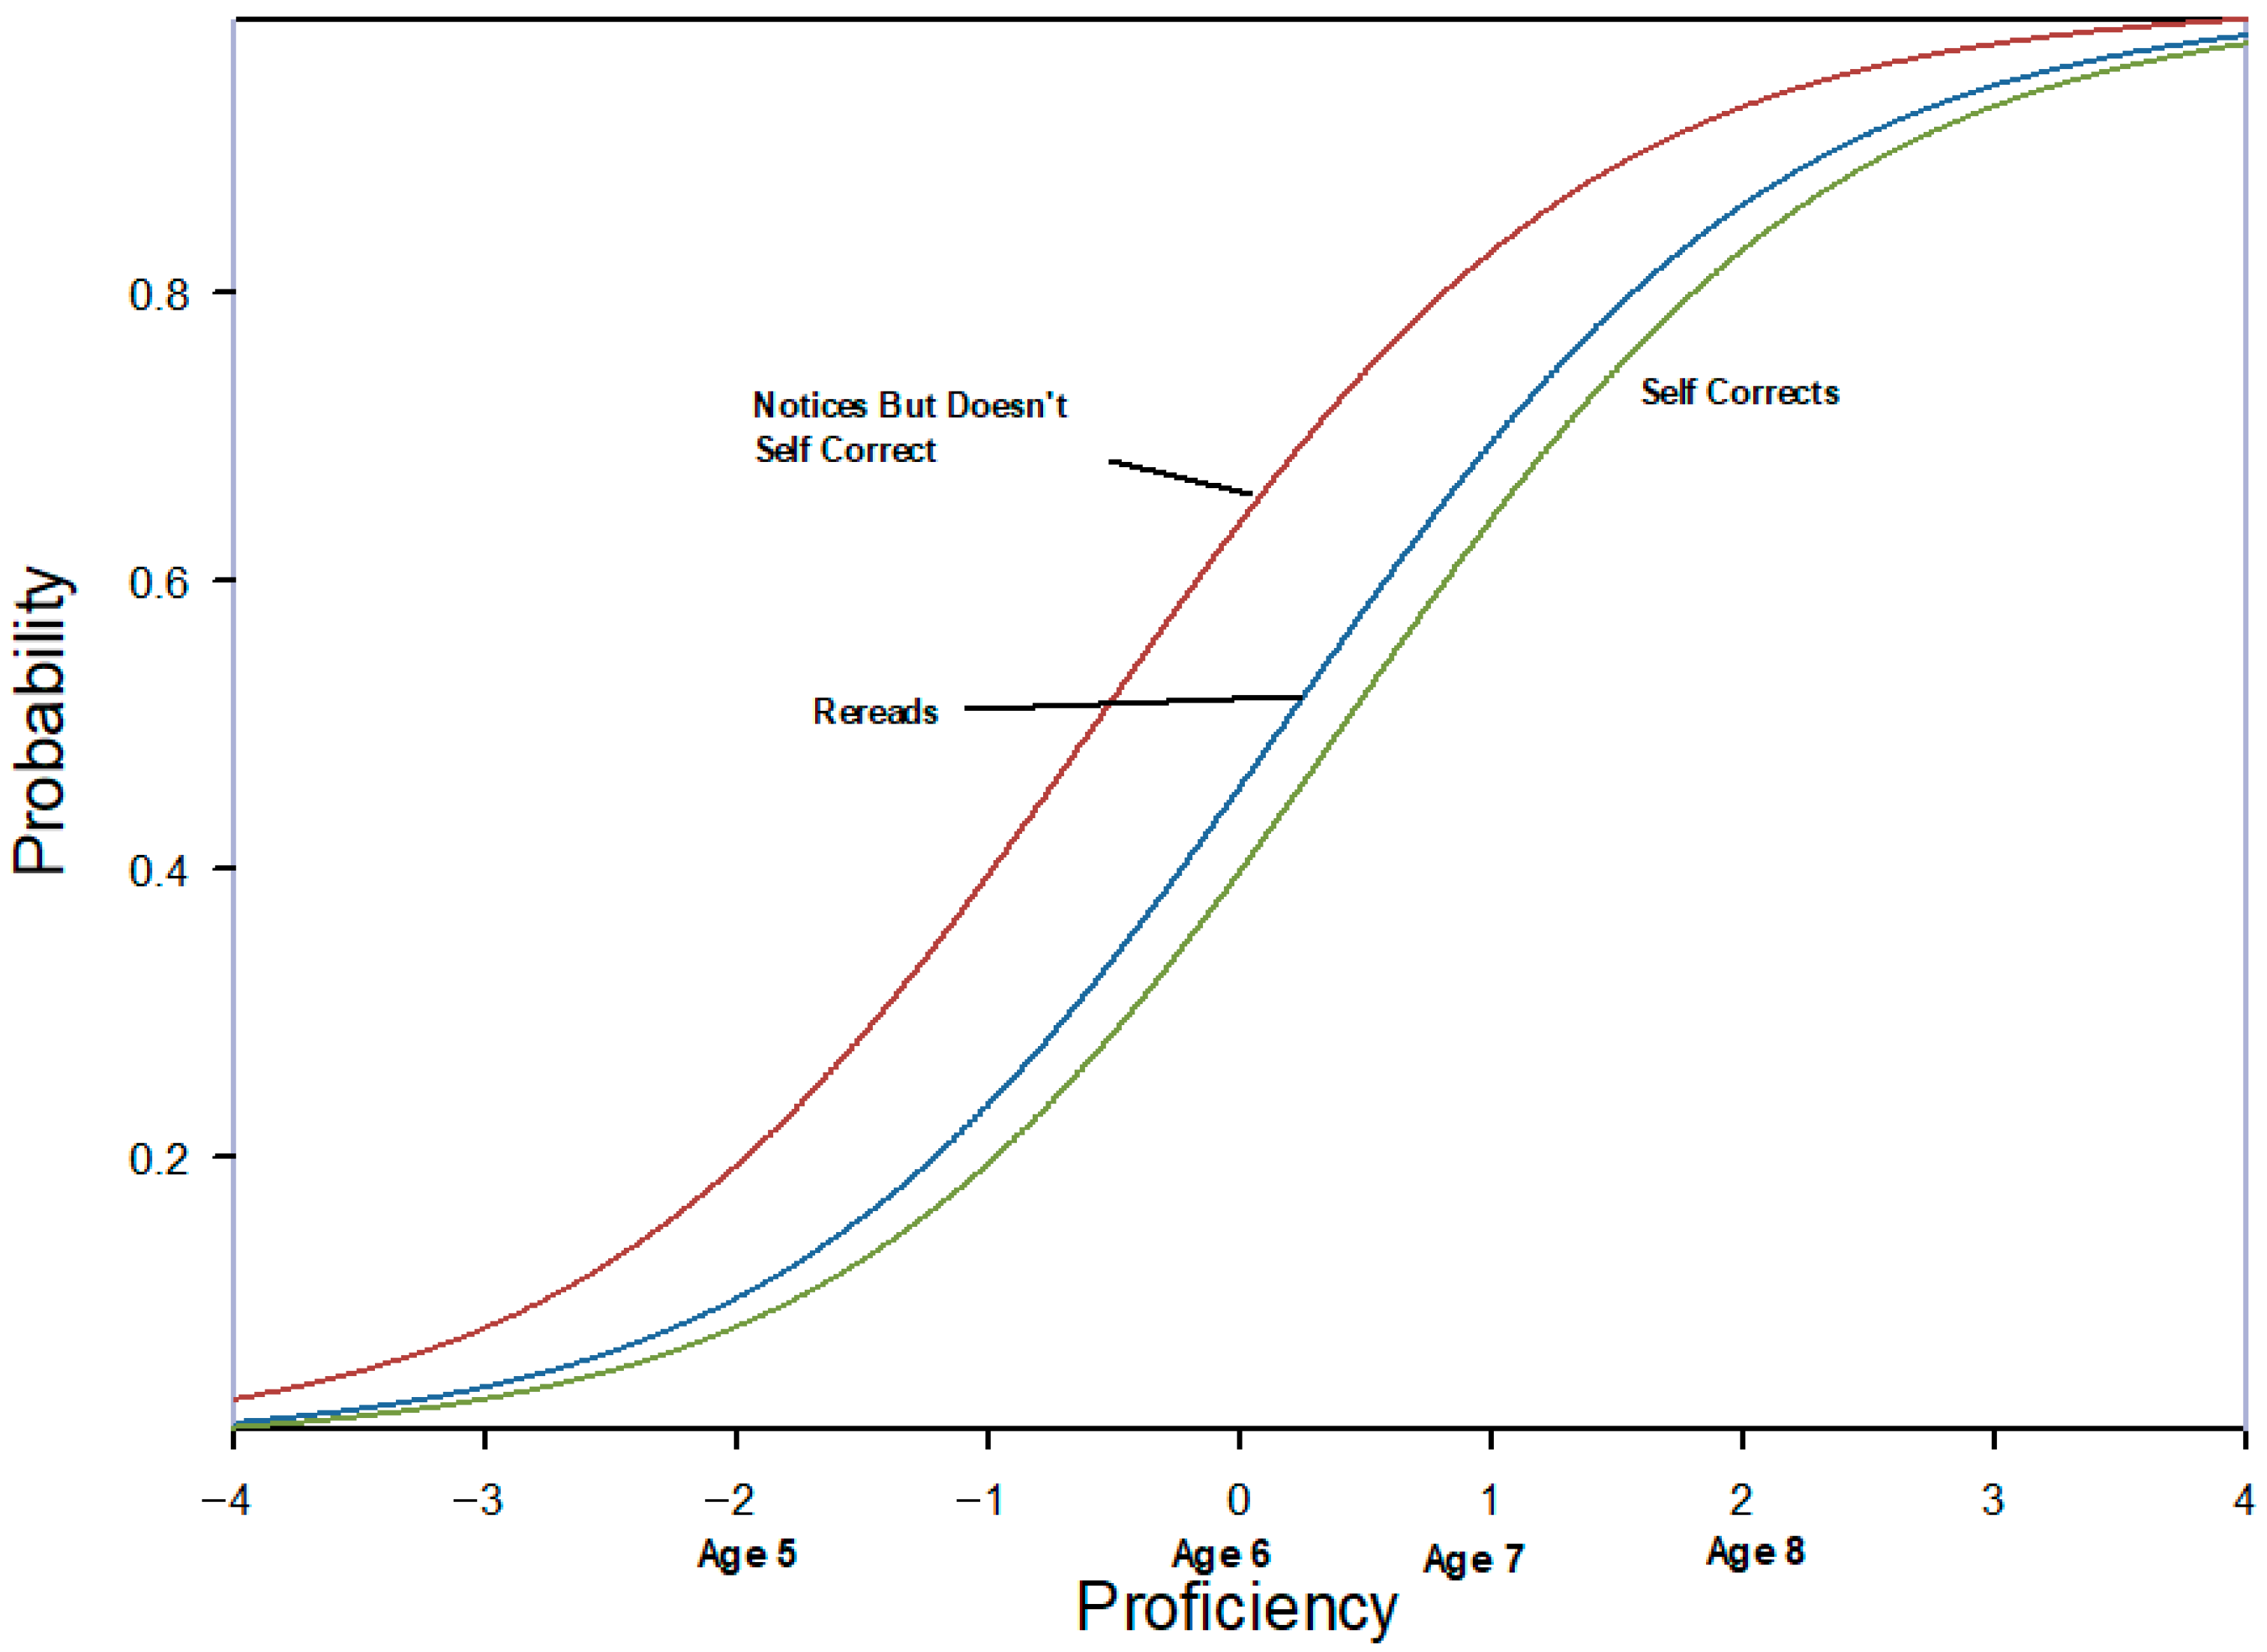
We then turned to modeling the rereading, noticing but not self-correcting, and SC Ratio items. The former two items did not fit when positively coded, so we reverse- coded them and created a new model. Table 4 presents the measures, SEs, and fit statistics for the three items (Wright map not included) from the run with rereading and noticing but not self-correcting reverse coded. As can be seen, all three items fit the data very well. The item ICCs are presented in Figure 8. Because noticing and not self-correcting and rereading were reversed coded, a score of 2 (indicating those strategies were used often) were more probable among the lower proficient students, as students become more proficient, the probability decreases that they reread and notice but do not self-correct. Between Age 6 and 7 reading levels, the probability of noticing but not self-correcting and self-correcting are about equal, and as students become more proficient, they begin to self-correct more than notice without correcting.
On less challenging books, the rereading, noticing but not solving, and SC Ratio item measures, ICCS’s, and fit statistics were similar to the values on all books. On more challenging texts, the Rasch model fit well when all three items were positively coded. Figure 9 presents the resulting ICCs of the strategy and self-correction items on more difficult books. As can be seen from the figure, more proficient students reverted to rereading and noticing but not correcting when the task became more challenging. They self-corrected at the same rate regardless of the degree of book difficulty.

4. Discussion

A corpus of research and theory suggests that reading development includes a growing proficiency with using subword elements to decode unfamiliar words starting first with using individual letters, to using word or subword strategies (Davis & Evans, 2021; Ehri, 1998). Moreover, empirical research has documented students using various kinds of word solving strategies to use these subword elements to decode; they include rereading, using analogies to known words, and searching for and using word parts of varying grain sizes from individual letters to rimes. The development of these strategies is aligned with an overlapping wave theory which describes efficient strategy use as adaptive, variable, and generative.
This study presents the development and validation of the Record of Decision-Making (RODM), a formative assessment designed to measure beginning readers’ use of phonic elements to decode unknown words while reading. Grounded in overlapping wave theory and theories of early reading development, the RODM captures adaptive strategy use during oral reading, including rereading and subword analysis.

4.1. Summary of Findings

To be useful for teachers, RODM scores must reflect various levels of reading proficiency as expected from the theoretical foundations of the device. Within a theory-driven validation framework, we tested five assumptions that specified expected strategy use as a function of reading proficiency based on the theoretical foundations of the RODM. Our first assumption specified that students would utilize more strategies as they became more proficient. The additive Rasch model fit the phonic element usage data when we added to reading proficiency scale, indicating that as students’ proficiency increased, they tended to use an increasing number of phonic elements to solve words that were not read automatically. We also assumed that phonic element usage would follow a predictable pattern from beginning letters in words, to larger word parts, to final and medial letters (Assumption 2). The elements indeed were placed along the proficiency scale in a meaningful way as predicted by theory. The most basic and widely used elements related to the beginning letters of words. The next level of element difficulty pertained to chunks of letters at the beginning and middle of words, and elements related to the ending then middle of words represented more advanced elements.
We also tested if students would eschew the more basic elements when they read books that were relatively easy for them (Assumption 3). Following an ideal point process, we found that more advanced students tended to rely almost exclusively on the middle and end of words when encountering words not retrieved automatically, but less proficient students continued to use the more basic elements. Indeed, the probability was slight on all books that less proficient students focused on the middle and end of words.
We also empirically supported Assumptions 4 and 5 that pertained to rereading, noticing but not self-correcting, and self-correcting. Rereading, and noticing but not self-correcting were more prevalent among less proficient readers, while self-correcting became increasingly more likely as proficiency increased, as predicated by Assumption 4. When reading became more demanding, however, even more proficient students reverted to rereading. They also tended to notice but not self-correct to a much greater extent (Assumption 5).
For the RODM to be used effectively by teachers, it was important to demonstrate that with minimal training, oral records could be scored reliably and accurately. We estimated a reliability coefficient of g = 0.77 for one rater on a single RODM containing 13 items. Because the RODM is designed to be used on a frequent basis, such as once per lesson, the degree of reliability for multiple scores over a short time frame is anticipated to be very high. We also demonstrated that after a brief training session, raters displayed an acceptable degree of accuracy when comparing their scores to those of the first author.

4.2. Practical Implications

The practical implications that arise from overlapping wave theory and our understandings about the visual perceptual demands of reading, is that beginning readers should be taught variable, multiple backup strategies that can be used in flexible ways to solve words and to learn how to choose from them in adaptive ways, with increasing efficiency, to decode an unknown word at difficulty while reading.
Automatic retrieval of words, in the reading domain defined as knowing words with automaticity, is always the preferred strategy to use; but when that is not possible, the reader needs to efficiently choose from multiple approaches to decode with accuracy.
Moreover, earlier more primitive strategies to solve may be used less but they do not disappear entirely; instead, they are always there for the learner to use. A skilled reader, for example, might try subword chunks to decode a word but, if that is not successful, like the toddler who resorts to crawling, they can always resort to individual letters if needed.

4.3. Future Considerations Based on the Findings

The generalizability and response scale analyses provided important information to consider in terms of potential modifications to the RODM.

4.3.1. Response Scale Findings

We examined the fit of various polytomous and dichotomous models to the data. For the phonic elements, the best fitting model was the dichotomous rating scale. The polytomous partial credit and rating scale models led to item misfit and a middle response category that did not present as the most likely response at any point on the proficiency scale. Currently, the RODM instructions ask teachers to rate phonic element use on a three-point scale. The findings suggest that we should modify the instructions and have teachers code the elements as either never occurring or occurring at least sometimes. There may still be value, however, of retaining the three-point scale if it encourages teachers to consider micro changes to student progress, which may hold instructional value. We plan to collect additional data from teachers to ascertain if retaining the three-point model provides meaningful information for instruction.

4.3.2. Including Medial-Final and Medial Items

The current version of the RODM does not require teachers to interpret the degree to which students use the medial-final and medial parts of words. Those two items were added as we were coding the oral records from the 129 students in the data set when it became apparent that students were using those parts of words. For the validation analyses, those two elements were critical because they defined the higher end of the proficiency scale and were used almost exclusively by more proficient students. Before adding them to the RODM, however, we must consider the balance of the number of items with the time it takes to complete the assessment. Further, we must consider the targeted students for the RODM. We developed the measure for teachers who primarily work with struggling readers and given that lower achieving students tend to not rely on those elements, teachers may find it superfluous to include those items on RODM.

4.3.3. Adding More Items to Increase Reliability

As can be seen from the generalizability analysis in Figure 4, adding additional items beyond 13 increases reliability by about g = 0.01 per item regardless of the number of coders. The estimations provided in Figure 4 assume that each item added is from the same universe of items as the existing ones, and that each added item is equally as reliable. We focused on the chosen phonic elements because they do not require a high degree of inference-making for the teacher to identify, nor are they particularly tedious to code.
The items included on the RODM require low inference on the part of the observer; the items that are interpreted are observable behaviors. As such, some behaviors that were documented in research cited previously, and are included when coding oral reading on the RODM, were excluded from the interpretation step because they would have relied on high inference.
Coding Multiple Attempts
When students made multiple attempts to solve a single word, we examined only the last attempt. If a reader said: “I want to go on the, ring, the ride” for the word “road” we would only analyze the match between ride and road (in this case, letters in the initial and final positions were used). Examining changes in attempts may provide insight as to how a student is visually processing the print; however, we decided to analyze the final attempt only because that was the culmination of all backup strategies used. Additionally, analyzing each attempt, in this case, “ring” and then “ride” for the word “rode” would make interpreting the assessment more burdensome and yield little value that we know of.
Analogies
Readers use many other word solving strategies to decode unfamiliar words besides rereading and using subword parts. For example, Goswami (1988, 2013) provides evidence that readers use orthographic analogies to solve words and that this use increases with reading proficiency, a strategy that was apparent in the Lindberg et al. (2011) study in which children reported thinking of a word like the target word to decode it. We did not include analogy use as a strategy because it would be impossible to determine whether a child’s error resulted from using an analogy (something already known) unless the child was asked what they were thinking when they made the error. We do however include the use of rimes as a backup strategy to interpret because of the strong evidence produced by Goswami that rimes are important units of orthography for beginning readers of English, the assertion that rimes are likely the source of analogy-making, and the low inferencing required to make the decision as to whether a rime used in an error was included in the printed word.
Appealing for Help
Nor did we include the behavior of asking for help as a backup strategy. Yet, stopping at difficult words and waiting for or asking for help may well be a backup strategy.
Much extant research has examined help-seeking behaviors and concluded that knowing when to ask for help may be a very strategic behavior, indicating an awareness on the learner’s part that trying any longer will not result in success (Wood & Wood, 1999). A sign of a less proficient reader, on the other hand, might be continuing to use the same strategies repeatedly to decode a word, without the awareness that everything that the reader knows how to do has been applied and there is little chance of success.
In short, knowing when to ask for help might be a very strategic decision. However, we found no way to distinguish it from the behavior of giving up too soon and not trying, thus we categorize appealing for help as a high inference item and unsuitable for interpretation by the assessor. Nevertheless, appeals are all coded and counted for the record and can be used for instructional decision-making.
Meaning and Structure Cues
We did not include the use of meaning and structure cues as strategy use for several reasons. We assume meaning and structure are usually contained in reading errors (Rumelhart, 2004); in fact, Stanovich’s (2004) review of research shows that all readers, struggling or skilled, use context to similar degrees to support word identification. Additionally, Rodgers et al. (2023) reported low agreement and accuracy with interpreting whether meaning is present in an error; it appears it is difficult to achieve agreement on whether meaning is used. Finally, and perhaps most importantly, we focus on how the reader is using the orthography because that is the task facing the beginning reader: learning how to use the print (Cunningham et al., 2001), knowing where to look and how to see the parts. Relying on meaning and structure at difficulty is a characteristic of struggling readers (Stanovich, 1980), and thus not a strategy that should be taught to students learning to read. Final Comments on Omitted Strategies
Although the RODM does not examine whether a reader is using analogies, semantics, or smaller units of print such as vowel teams, blends and digraphs not in the initial position of a word; these exclusions should not lead one to conclude those items should not be taught. An affordance of the RODM is that it indicates in a standard way the reader’s use of orthography; whether letters in the initial, medial or final positions are being used. Based on that information, instructional decisions can be made about explicit teaching and those decisions will vary depending on the instructional emphases in place in the local setting.
For example, a reader whose errors typically ignore all letters in a word when they make an error will need to learn to notice and use the letters; it seems likely that teaching such a reader to notice and use the initial letter will be a better starting place than teaching them to use rimes or medial letters, for example. Readers who show a pattern of using initial letters but ignoring initial blends and digraphs, would likely benefit from instruction focused on those larger chunks of print. Likewise, readers using letters in the initial and final position, would benefit from instruction focused on using the medial position.

4.4. Next Steps

As validation analysis is an ongoing, iterative process, the results from this study provided some specifications on the evidence that should be gathered in future RODM studies to further bolster the meaning of the RODM scores. In the current study, we focused on the reliability of raters rather than students. What we do not know is the consistency of student scores across repeated measures, particularly the repeatability of scores yielded from different books at the same difficulty level.
We also did not address the reliability of scores when raters take an oral reading record and interpret the recording. In the current generalizability study, coders analyzed previously completed oral records. As test users must take and code a record, the error in taking a record must be considered as well in computing the overall reliability of the scores.
Documenting as we have in this study that RODM scores converge with reading proficiency is essential if the device will serve as an useful formative assessment tool, but more information will be required if teachers are to use the tool effectively to improve instruction and student learning. Norms, for example, will be required so that teachers can compare their students’ scores and progress relative to similar and all students. It also will be critical to demonstrate that teachers who use the RODM provide more beneficial instruction than teachers who do not use the device, and that instructional improvements result in improved student reading outcomes. Describing how teachers effectively use the RODM will be an important goal of future studies. The inclusion of case examples, teacher feedback, or observational data would significantly strengthen the claim that the tool is viable and impactful in instructional settings. Future research could also examine how the instrument performs across varied educational contexts or with diverse student populations and examine whether the 0–2 rating scale model has greater validity.

5. Conclusions

The RODM provides feedback on the process of reading—information about what the focus of instruction could be for a student. Several processes are thought to be involved for successful lexical access to occur, including phonological, orthographical, contextual, and semantics (Seidenberg et al., 2020; Seidenberg & McClelland, 1989). Researchers posit that these processes might interact with each other while decoding, although whether they do or how is not a settled science (Lupker et al., 2012; Stanovich et al., 2013).
Finally, it is important to note that reading instruction should be informed by more than how students are orthographically mapping unfamiliar words. As Shanahan (2019) notes, reading instruction should cover many other areas of learning important for reading proficiency, such as vocabulary, comprehension, fluency, and enhancement for prior knowledge, among others. For this formative reading assessment, we focused on one process: the orthographic processing of print.

Author Contributions

Conceptualization, E.M.R. and J.V.D.; methodology, E.M.R. and J.V.D.; software, E.M.R. and J.V.D.; validation, E.M.R. and J.V.D.; formal analysis, E.M.R. and J.V.D.; investigation, E.M.R. and J.V.D.; resources, E.M.R. and J.V.D.; data curation, E.M.R. and J.V.D.; writing—original draft preparation, E.M.R. and J.V.D.; writing—review and editing, E.M.R. and J.V.D.; visualization, E.M.R. and J.V.D.; supervision, E.M.R. and J.V.D.; project administration, E.M.R. and J.V.D.; funding acquisition, E.M.R. and J.V.D. All authors have read and agreed to the published version of the manuscript.

Funding

This research received no external funding.

Informed Consent Statement

Not applicable.

Data Availability Statement

The original contributions presented in this study are included in the article. Further inquiries can be directed to the corresponding authors.

Conflicts of Interest

The authors declare no conflicts of interest.

References

  1. Adams, M. A. (1990). Beginning to read: Thinking and learning about print. MIT Press. [Google Scholar]
  2. Adams, M. A. (2004). Modeling the connections between word recognition and reading. In R. B. Ruddell, & N. Unrau (Eds.), Theoretical models of reading (pp. 1219–1243). International Reading Association. [Google Scholar]
  3. Coombs, C. H. (1964). A theory of data. Wiley. [Google Scholar]
  4. Cunningham, A. E., Perry, K. E., & Stanovich, K. E. (2001). Converging evidence for the concept of orthographic processing. Reading and Writing, 14(5), 549–568. [Google Scholar] [CrossRef]
  5. D’Agostino, J. V., & Briggs, C. (2025). Validation analysis during the design stage of text leveling. Education Sciences, 15(5), 607. [Google Scholar] [CrossRef]
  6. D’Agostino, J. V., Kelly, R. H., & Rodgers, E. (2019). Self-corrections and the reading progress of strugglingbeginning readers. Reading Psychology, 40(6), 525–550. [Google Scholar] [CrossRef]
  7. Davis, B. J., & Evans, M. A. (2021). Children’s self-reported strategies in emergent reading of an alphabet book. Scientific Studies of Reading, 25(1), 31–46. [Google Scholar] [CrossRef]
  8. Ehri, L. C. (1975). Word consciousness in readers and prereaders. Journal of Educational Psychology, 67(2), 204–212. [Google Scholar] [CrossRef]
  9. Ehri, L. C. (1998). Grapheme-phoneme knowledge is essential for learning to read words in English. In J. L. Metsala, & L. Ehri (Eds.), Word recognition in beginning literacy (pp. 41–63). Routledge. [Google Scholar]
  10. Ehri, L. C. (2005). Learning to read words: Theory, findings, and issues. Scientific Studies of Reading, 9(2), 167–188. [Google Scholar] [CrossRef]
  11. Ehri, L. C. (2022). What teachers need to know and do to teach letter–sounds, phonemic awareness, word reading, and phonics. The Reading Teacher, 76(1), 53–61. [Google Scholar] [CrossRef]
  12. Fagan, W. T., & Eagan, R. L. (1986). Cues used by two groups of remedial readers in identifying words in isolation. Journal of Research in Reading, 9(1), 56–68. [Google Scholar] [CrossRef]
  13. Farrington-Flint, L., & Wood, C. (2007). The role of lexical analogies in beginning reading: Insights from children’s self-reports. Journal of Educational Psychology, 99(2), 326–338. [Google Scholar] [CrossRef]
  14. Gaskins, I. W. (2010). Interventions to develop decoding proficiencies. In A. McGill-Franzen, & R. Allington (Eds.), Handbook of reading disability research (pp. 289–306). Routledge. [Google Scholar]
  15. Gibson, E. J., & Levin, H. (1975). The psychology of reading. MIT Press. [Google Scholar]
  16. Goswami, U. (1988). Orthographic analogies and reading development. The Quarterly Journal of Experimental Psychology, 40(2), 239–268. [Google Scholar] [CrossRef]
  17. Goswami, U. (2013). The role of analogies in the development of word recognition. In J. L. Metsala, & L. Ehri (Eds.), Word recognition in beginning literacy (pp. 41–63). Routledge. [Google Scholar]
  18. Harmey, S., D’Agostino, J., & Rodgers, E. (2019). Developing an observational rubric of writing: Preliminary reliability and validity evidence. Journal of Early Childhood Literacy, 19(3), 316–348. [Google Scholar] [CrossRef]
  19. Johnson, T., Rodgers, E., & D’Agostino, J. V. (2024). Learning to read: Variability, continuous change and adaptability in children’s use of word solving strategies. Reading Psychology, 45(2), 105–142. [Google Scholar] [CrossRef]
  20. Kaye, E. L. (2006). Second graders’ reading behaviors: A study of variety, complexity, and change. Literacy Teaching and Learning, 10(2), 51–75. [Google Scholar]
  21. Kuhfeld, M., Lewis, K., & Peltier, T. (2023). Reading achievement declines during the COVID19 pandemic: Evidence from 5 million US students in grades 3–8. Reading and Writing, 36(2), 245–261. [Google Scholar] [CrossRef]
  22. Linacre, J. M. (2021). FACETS (Many-Facet Rasch measurement) software (Version 3.83.6). [Computer software]. FACETS.
  23. Lindberg, S., Lonnemann, J., Linkersdörfer, J., Biermeyer, E., Mähler, C., Hasselhorn, M., & Lehmann, M. (2011). Early strategies of elementary school children’s single word reading. Journal of Neurolinguistics, 24(5), 556–570. [Google Scholar] [CrossRef]
  24. Lupker, S. J., Acha, J., Davis, C. J., & Perea, M. (2012). An investigation of the role of grapheme units in word recognition. Journal of Experimental Psychology: Human Perception and Performance, 38(6), 1491. [Google Scholar] [CrossRef]
  25. Marchbanks, G., & Levin, H. (1965). Cues by which children recognize words. Journal of Educational Psychology, 56(2), 57. [Google Scholar] [CrossRef]
  26. Messick, S. (1995). Validity of psychological assessment: Validation of inferences from persons’ responses and performances as scientific inquiry into score meaning. American psychologist, 50(9), 741. [Google Scholar] [CrossRef]
  27. MetaMetrics. (2024). Lexile grade level charts. Available online: https://hub.lexile.com/account-membership/ (accessed on 22 July 2025).
  28. Microsoft CoPilot. (2025). Prompt: “Use these words in a passage: Trypsinogen, anfractuosity, prolegomenous, and interfascicular”. Available online: https://copilot.microsoft.com/ (accessed on 25 June 2025).
  29. Miles, K. P., & Ehri, L. C. (2019). Orthographic mapping facilitates sight word memory and vocabulary learning. In D. Kilpatrick, R. Joshi, & R. Wagner (Eds.), Reading development and difficulties. Springer. [Google Scholar] [CrossRef]
  30. Mushquash, C., & O’Connor, B. P. (2006). SPSS and SAS programs for generalizability theory analyses. Behavior Research Methods, 38(3), 542–547. [Google Scholar] [CrossRef]
  31. National Assessment of Educational Progress. (2024). 2024 NAEP reading assessment. Available online: https://www.nationsreportcard.gov/reports/reading/2024/g4_8/?grade=4 (accessed on 22 July 2025).
  32. Roberts, J. S., Laughlin, J. E., & Wedell, D. H. (1999). Validity issues in the Likert and Thurstone approaches to attitude measurement. Educational and Psychological Measurement, 59(2), 211–233. [Google Scholar] [CrossRef]
  33. Rodgers, E., D’Agostino, J. V., Berenbon, R., Johnson, T., & Winkler, C. (2023). Scoring Running Records: Complexities and affordances. Journal of Early Childhood Literacy, 23(4), 665–694. [Google Scholar] [CrossRef]
  34. Rodgers, E., D’Agostino, J. V., Kelly, R. H., & Mikita, C. (2018). Oral reading accuracy: Findings and implications from recent research. The Reading Teacher, 72(2), 149–157. [Google Scholar] [CrossRef]
  35. Rumelhart, D. E. (2004). Toward an interactive model of reading. In R. B. Ruddell, & N. Unrau (Eds.), Theoretical models of reading (pp. 1149–1179). International Reading Association. [Google Scholar]
  36. Savage, R., & Stuart, M. (2006). A developmental model of reading acquisition based upon early scaffolding errors and subsequent vowel inferences. Educational Psychology, 26(1), 33–53. [Google Scholar] [CrossRef]
  37. Savage, R., Stuart, M., & Hill, V. (2001). The role of scaffolding errors in reading development: Evidence from a longitudinal and a correlational study. British Journal of Educational Psychology, 71(1), 1–13. [Google Scholar] [CrossRef]
  38. Seidenberg, M. S., Cooper Borkenhagen, M., & Kearns, D. M. (2020). Lost in translation? Challenges in connecting reading science and educational practice. Reading Research Quarterly, 55, S119–S130. [Google Scholar] [CrossRef]
  39. Seidenberg, M. S., & McClelland, J. L. (1989). A distributed, developmental model of word recognition and naming. Psychological Review, 96(4), 523. [Google Scholar] [CrossRef]
  40. Shanahan, T. (2019). Why children should be taught to read with more challenging texts. Perspectives on Language and Literacy, 45(4), 17–19. [Google Scholar]
  41. Sharp, A. C., Sinatra, G. M., & Reynolds, R. E. (2008). The development of children’s orthographic knowledge: A microgenetic perspective. Reading Research Quarterly, 43, 206–226. [Google Scholar] [CrossRef]
  42. Siegler, R. S. (1984). Strategy choice in addition and subtraction: How do children know what to do. Origins of Cognitive Skills, 229–294. [Google Scholar]
  43. Siegler, R. S. (1995). How does change occur: A microgenetic study of number conservation. Cognitive Psychology, 28(3), 225–273. [Google Scholar] [CrossRef] [PubMed]
  44. Siegler, R. S. (1996). Emerging minds: The process of change in children’s thinking. Oxford University Press. [Google Scholar]
  45. Siegler, R. S. (2005). Children’s learning. American Psychologist, 60(8), 769. [Google Scholar] [CrossRef]
  46. Siegler, R. S. (2016). Continuity and change in the field of cognitive development and in the perspectives of one cognitive developmentalist. Child Development Perspectives, 10(2), 128–133. [Google Scholar] [CrossRef]
  47. Siegler, R. S., & Robinson, M. (1982). The development of numerical understandings. In H. W. Reese, & L. P. Lipsitt (Eds.), Advances in child development and behavior (Vol. 16, pp. 242–312). Academic Press. [Google Scholar]
  48. Stanovich, K. E. (1980). Toward an interactive-compensatory model of individual differences in the development of reading fluency. Reading Research Quarterly, 16, 32–71. [Google Scholar] [CrossRef]
  49. Stanovich, K. E. (2004). Mattew effects in reading: Some consequences of individual differences in the acquisition of literacy. In R. B. Ruddell, & N. Unrau (Eds.), Theoretical models of reading (pp. 454–516). International Reading Association. [Google Scholar]
  50. Stanovich, K. E., & West, R. F. (1989). Exposure to print and orthographic processing. Reading Research Quarterly, 24, 402–433. [Google Scholar] [CrossRef]
  51. Stanovich, K. E., West, R. F., & Cunningham, A. E. (2013). Beyond phonological processes: Print exposure and orthographic processing. In S. A. Brade, & D. P. Shankweiler (Eds.), Phonological processes in literacy (pp. 219–236). Routledge. [Google Scholar]
  52. Steffler, D. J., Varnhagen, C. K., Friesen, C. K., & Treiman, R. (1998). There’s more to children’s spelling than the errors they make: Strategic and automatic processes for one-syllable words. Journal of educational psychology, 90(3), 492. [Google Scholar] [CrossRef]
  53. Thurstone, L. L. (1927). A law of comparative judgment. Psychological Review, 34, 273–286. [Google Scholar] [CrossRef]
  54. United States Department of Education. (1995). Listening to children read aloud (Vol. 22). National Center for Education Statistics. [Google Scholar]
  55. Vellutino, F. R., & Scanlon, D. M. (2002). The interactive strategies approach to reading intervention. Contemporary Educational Psychology, 27(4), 573–635. [Google Scholar] [CrossRef]
  56. Wood, H., & Wood, D. (1999). Help seeking, learning and contingent tutoring. Computers & Education, 33(2–3), 153–169. [Google Scholar] [CrossRef]
  57. Yan, Z., & Chiu, M. M. (2023). The relationship between formative assessment and reading achievement: A multilevel analysis of students in 19 countries/regions. British Educational Research Journal, 49(1), 186–208. [Google Scholar] [CrossRef]
  58. Yao, Y., Amos, M., Snider, K., & Brown, T. (2024). The impact of formative assessment on K-12 learning: A meta-analysis. Educational Research and Evaluation, 29(7–8), 452–475. [Google Scholar] [CrossRef]
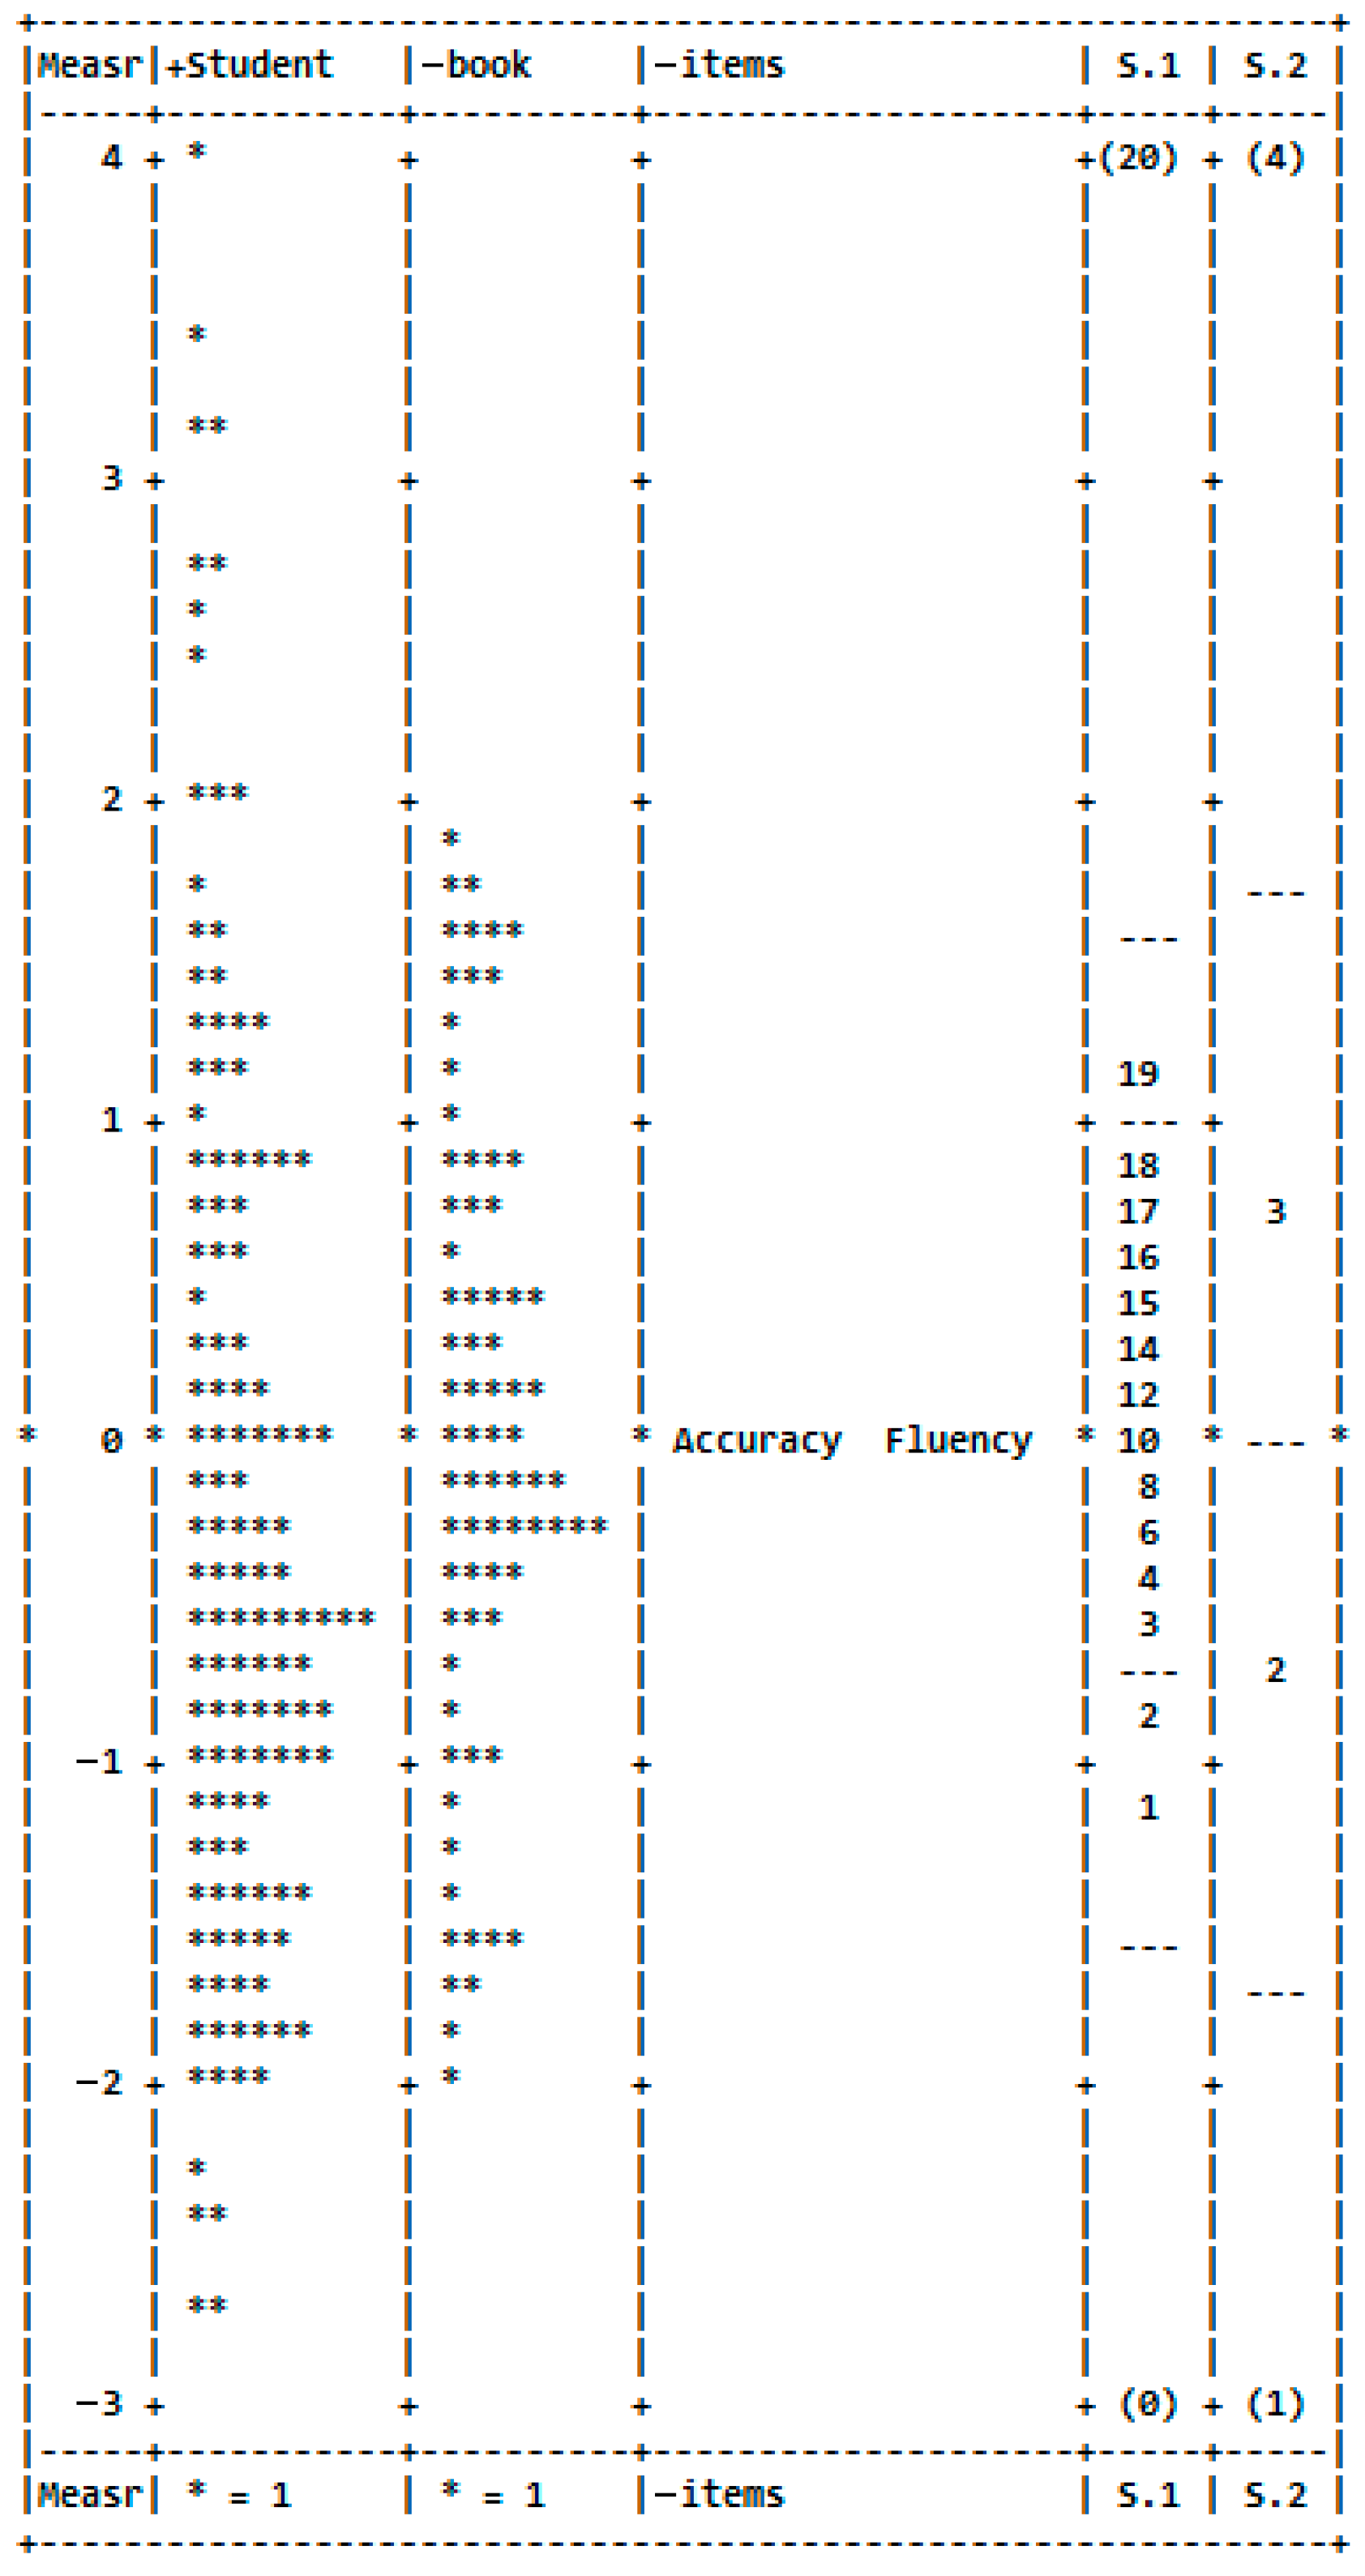
Figure 1. Facet Reading Proficiency Scale.
Education 15 01483 g001
Figure 2. Book Lexile Scores with Age Quartiles Regressed onto Book Rasch Difficulties.
Education 15 01483 g002
Figure 3. Response Probabilities for Polytomous Scoring of Phonic Elements.
Education 15 01483 g003
Figure 4. Decision Analysis from Generalizability Study.
Education 15 01483 g004
Figure 5. Proficiency Scale with Phonic Elements Added.
Education 15 01483 g005
Figure 6. Phonic Element Item Characteristic Curves.
Education 15 01483 g006
Figure 7. Phonic Element Item Characteristic Curves, Easy Books.
Education 15 01483 g007
Figure 8. Rereading, Noticing, and Correcting Item Characteristic Curves.
Education 15 01483 g008
Figure 9. Rereading, Noticing, and Correcting Item Characteristic Curves, Difficult Books.
Education 15 01483 g009
Table 1. Coder Agreement Rates with Criterion Score.
ElementAverage Agreement
Reread100%
Notices But Does Not SC92%
No IMF98%
Initial94%
Initial Medial94%
Initial Final75%
IMF86%
Final77%
Blends Digraphs90%
Rimes65%
SC Ratio96%
Total88%
Table 2. Measure, Standard Error (SE), and Fit Statistics for Phonic Elements.
ElementMeasureSEInfit MNSQOutfit MNSQ
Medial  2.560.130.851.12
Final  1.080.081.041.13
Medial Final  0.960.081.011.04
Initial Final−0.090.071.241.32
IMF−0.400.071.231.35
Initial−0.600.071.341.56
Rimes−0.710.081.221.32
Initial Medial−0.890.081.291.51
No IMF−0.890.081.321.54
Blends Digraphs−1.010.091.251.44
Table 3. Measure, Standard Error (SE), and Fit Statistics for Phonic Elements, Easy Books.
ElementMeasureSEInfit
MNSQ
Outfit
MNSQ
Infit
MNSQ
Reversed
Outfit MNSQ
Reversed
Medial  2.670.170.530.54
Final  1.260.110.780.78
Medial Final  0.860.110.920.93
Initial Final−0.060.111.401.55
Initial−0.390.111.601.861.251.26
IMF−0.470.121.591.831.431.50
No IMF−0.870.131.782.111.191.22
Rimes−0.870.131.741.901.341.45
Initial Medial−0.890.131.822.121.211.26
Blends Digraphs−1.240.181.982.421.211.24
Table 4. Measure, Standard Error (SE), and Fit Statistics for Rereading, Noticing, and Correcting.
ElementMeasureSEInfit MNSQOutfit MNSQ
SC Ratio  0.610.051.271.33
Notices But Does Not SC
(reversed)
−0.110.050.870.85
Reread (reversed)−0.500.051.211.23
Disclaimer/Publisher’s Note: The statements, opinions and data contained in all publications are solely those of the individual author(s) and contributor(s) and not of MDPI and/or the editor(s). MDPI and/or the editor(s) disclaim responsibility for any injury to people or property resulting from any ideas, methods, instructions or products referred to in the content.