Abstract
To ensure the success of early childhood education and further studies and to formulate interventions, the early diagnosis of childhood socioemotional and behavioral problems is essential. In this study, we analyzed socioemotional and behavioral difficulties in a sample of 501 Hungarian minority children (primary school children from Grades 1, 2, 3, and 4) residing in five administrative regions of Slovakia. Teachers’ and parents’ ratings on the Strengths and Difficulties Questionnaire (SDQ) were used for the assessment, and teacher–parent agreement (ICCs) from a total of 501 parents and 107 teachers were calculated to validate cross-informant convergence. The SDQ assessment tool includes a total of 25 items, which are divided into five subscales: emotional symptoms, conduct problems, hyperactivity, peer problems, and prosocial behavior. Hyperactivity was the problem most frequently reported by teachers, showing abnormal scores, while emotional symptoms were most frequently reported by parents. Demographic information, such as school grade, GPA (grade point average), and maternal education, was significantly related to the children’s SDQ scores. GPA showed a significant negative correlation with difficulties and a positive correlation with prosocial behavior. Significant differences in socioemotional and behavioral problems were also found across different grades. Inter-rater reliability analysis using intraclass correlation coefficients (ICCs) revealed fair-to-good agreement between teachers and parents (ICC range: 0.45–0.61). These findings reveal the importance of incorporating multiple informants in behavioral assessments, highlighting the need for early diagnosis and family-informed interventions to address socioemotional and behavioral problems within culturally diverse educational settings.
1. Introduction
Early childhood education and care (ECEC) plays a crucial role in promoting socioemotional and behavioral development (Mathis & Bierman, 2015). Identifying socioemotional and behavioral difficulties in early childhood is essential, as they can lead to serious problems later in life if left unaddressed (Myers & Pianta, 2008) and are linked to poor academic outcomes. Children with these difficulties often show lower performance in language and numeracy tests, which can persist and affect their long-term academic success (Chen et al., 2022). Ruby (2021) also demonstrated that socioemotional competence in early childhood is a strong predictor of future social adjustment and mental health. Children who develop strong socioemotional skills are better equipped to handle the demands of school and are less likely to experience behavioral problems later in life. Therefore, early identification of socioemotional and behavioral difficulties is essential to provide support and reduce the risk of negative outcomes (Jaspers-van der Maten & Rommes, 2024).
Children’s socioemotional and behavioral difficulties can be assessed using various tools and by analyzing ratings from multiple informants. While tools like the SDQ (Strengths and Difficulties Questionnaire) (Spang et al., 2022), ECBI (Eyberg Child Behavior Inventory) (Sorsa et al., 2019), and CBCL (Child Behavior Checklist) (Kamara et al., 2020) are widely used, discrepancies between reports from parents, teachers, and children highlight the complexity of accurately measuring these difficulties. In this study, we employed the SDQ tool to measure the socioemotional and behavioral difficulties of Hungarian children living in Slovakia.
Several studies utilizing the SDQ have only taken teacher ratings into account (Bell et al., 2024; Downs et al., 2012; Petermann et al., 2010); however, interpreting these results is challenging due to method variance, low sensitivity for certain disorders, low inter-rater reliability, and the influence of socioeconomic factors. Multi-informant approaches, including both parent and teacher ratings, are recommended to provide a more accurate and comprehensive assessment of children’s socioemotional and behavioral problems (Johnson et al., 2014; Mieloo et al., 2012; Smid et al., 2020); we therefore aim to use both of these perspectives to analyze Hungarian children residing in Slovakia. This study is guided by Bronfenbrenner’s ecological systems theory (Bronfenbrenner, 1979), which emphasizes that children’s behavior is expressed differently within home and school environments, and by Achenbach’s cross-informant framework (Achenbach, 2006; Grigorenko et al., 2010), which interprets teacher–parent discrepancies as meaningful reflections of setting-specific behavior rather than simple measurement error. Together, these perspectives provide a conceptual basis for predicting systematic variation in SDQ ratings across informants and for examining how background factors may influence the agreement.
2. Literature Review
2.1. Overview of the Strengths and Difficulties Questionnaire (SDQ)
Although different tools are used to assess children’s socioemotional and behavioral difficulties, the Strengths and Difficulties Questionnaire (SDQ) is most commonly used. It consists of 25 items and is applicable to individuals aged 4 to 16 years (Dubiel et al., 2024; J. Yu et al., 2016). The SDQ is utilized in various contexts, including clinical, educational, and research settings, and can be completed by parents, teachers, and the children themselves (Bell et al., 2024). It has a five-factor structure, assessing (1) emotional symptoms, (2) conduct problems, (3) hyperactivity/inattention, (4) peer problems, and (5) prosocial behavior (Sheel et al., 2025).
The first factor (emotional symptoms) assesses the presence of emotional distress and symptoms such as anxiety, depression, and fears, e.g., children’s feelings of sadness, nervousness, and worries about various aspects of life (Hoffmann et al., 2020). The second factor (conduct problems) measures children’s behavioral issues related to rule-breaking, aggression, and antisocial behavior, e.g., frequent temper tantrums, lying, stealing, and fighting (J. Yu et al., 2016). The third factor (hyperactivity/inattention) evaluates children’s symptoms of hyperactivity and difficulties with attention and concentration, e.g., restlessness, fidgeting, difficulty staying focused, and impulsive actions (Bell et al., 2024). The fourth factor (peer problems) assesses difficulties in interacting with peers, including issues with making and maintaining friendships, e.g., being bullied, preferring to play alone, and having few friends (Ortuño-Sierra et al., 2016). The last factor (prosocial behavior) measures positive social behaviors such as empathy, kindness, and cooperation, e.g., helping others, sharing, and showing concern for others’ feelings (Hoffmann et al., 2020).
Children’s strengths and difficulties have been widely studied across the world (Bryant et al., 2020; Hobbs & Laurens, 2020), with the SDQ adapted for use in Hungary, Slovakia, the UK, various European countries (e.g., Finland, France, the Netherlands, Belgium, Germany, Spain, Sweden), and globally in culturally diverse regions, such as Australia, Brazil, Canada, and parts of the Middle and Far East (Barriuso-Lapresa et al., 2014; Booth et al., 2023; Jaspers-van der Maten & Rommes, 2024; J. Yu et al., 2016). These studies have consistently demonstrated the tool’s validity and its successful application in both research and practice (Dubiel et al., 2024; Hoffmann et al., 2020; Keilow et al., 2019). Moreover, the structure of the SDQ allows for comparison across informants. The tool’s reliability is therefore not merely a statistical property but a reflection of whether behaviors are consistently expressed across a child’s environments, making it essential to interpret scores to understand the reasons for discordance.
2.2. Challenges in Interpreting SDQ Results Due to Discrepancies Between Informants (Parents vs. Teachers)
Interpreting SDQ scores can be challenging due to discrepancies between informants, such as teachers and parents. These discrepancies may arise from various factors, such as contextual differences, the effects of age or gender, and parental education. Behaviors observed at home may differ significantly from those seen at school. For example, hyperactivity tends to be consistent across settings, but emotional symptoms and conduct problems may vary due to the different environments and expectations (Dubiel et al., 2024). Parents generally report higher levels of symptoms across all SDQ domains compared to teachers (Murray et al., 2021), as they might observe behaviors at home that teachers do not see in the school setting, leading to different ratings (Brandenburg et al., 2021). Different raters (parents, teachers, self-reports) often provide varying assessments of a child’s behavior. For instance, only moderate inter-rater agreements were found between self- and parental reports, while teacher reports showed higher reliability (Turi et al., 2011). However, some studies (Boman et al., 2016; Fält et al., 2018) have suggested that teacher ratings tend to align more closely with parent ratings than self-reports, with another (Mieloo et al., 2013) confirming that inter-rater correlations between teachers and parents ranged from 0.20 to 0.41, with higher correlations for Dutch children compared to non-Dutch children. These contextual effects underscore the importance of considering the environment in which behaviors are observed.
2.3. Research Findings of SDQ Scores
Distinct findings have been shown regarding the contextual factors of SDQ studies. Some studies have explored how various sociodemographic factors, including parental education, influence SDQ scores (Boman et al., 2016; Rothenberger et al., 2008). Lower levels of parental education are consistently associated with higher total difficulty scores on the SDQ, indicating greater behavioral and emotional symptoms in children (Fuchs et al., 2013). Specifically, children whose parents have lower educational attainment tend to exhibit more hyperactivity/inattention, conduct problems, and emotional symptoms (Fuchs et al., 2013; Klein et al., 2013). Socioeconomic disadvantage, often linked to lower parental education, is a significant predictor of higher SDQ scores; children from socioeconomically disadvantaged backgrounds are more likely to have higher scores on total difficulties (Hjern et al., 2021). The influence of parental education on SDQ scores is also evident in the context of family dynamics and parental involvement. For instance, high parental education levels can sometimes exacerbate the impact of children’s mental health problems on daily life, suggesting complex interactions between education, family environment, and child behavior (Kozlova et al., 2023).
Children’s gender can also influence these discrepancies, with boys generally having higher total-difficulty scores compared to girls (for example, in a Japanese community sample), in addition to higher scores related to conduct problems and hyperactivity, while girls show more prosocial behaviors and emotional symptoms (Booth et al., 2023). The impact of age on SDQ scores also varies by gender. For example, the self-reported scores of younger boys in the domains of peer problems, hyperactivity, conduct problems, and prosocial behavior were more likely to disagree with those of their parents compared to those given by same-aged girls (Gray et al., 2021).
Age also affected SDQ scores in a study of teacher-reported results (Ortuño-Sierra et al., 2016). Younger children often scored higher on SDQ scale variants compared to older children, suggesting more reported difficulties. For example, younger children in a Spanish sample scored higher on behavioral problems and hyperactivity (Barriuso-Lapresa et al., 2014), while another study (Rothenberger et al., 2008) showed that children aged 7–10 years scored higher on various SDQ scales compared to children aged 11–16 years. Research has also shown that preschoolers (aged 36–60 months) can also be effectively assessed using the SDQ (Petermann et al., 2010). As children grow older, the level of difficulties reported tends to decrease. This trend is consistent across different informants, including teachers and parents (Rothenberger et al., 2008; Speyer et al., 2023).
Moreover, higher SDQ scores, especially those related to emotional and behavioral problems, are consistently associated with lower academic performance or GPA (grade point average) scores (Keilow et al., 2019; W. Yu et al., 2022). Another study also demonstrated that issues related to externalizing (e.g., conduct problems, hyperactivity) and internalizing (e.g., emotional symptoms) behaviors both negatively impact academic performance; students with higher externalizing and internalizing scores perform worse academically (Atoum et al., 2018).
As a distinct factor, children with officially diagnosed behavioral or special educational needs show distinct and elevated profiles and higher scores on the SDQ compared to their non-diagnosed peers. For example, children with special educational needs (SENs) are more likely to score within the abnormal range on the SDQ subscales, particularly for peer problems and conduct problems (Schwab et al., 2016). This indicates higher levels of behavioral difficulties compared to their non-diagnosed peers. Moreover, another study (Charman et al., 2015) pointed out that peer problems are notably higher in children with SENs, especially those with autism spectrum disorder (ASD). This suggests that these children struggle more with social interactions and forming peer relationships. Hyperactivity and attention difficulties are common in children with diagnosed conditions/behavioral disorders, particularly those with attention deficit hyperactivity disorder (ADHD), and as such, these children often show higher scores on the hyperactivity/inattention subscale of the SDQ (Russell et al., 2013). Charman et al. (2015) found that children with SENs showed higher scores related to emotional and conduct problems on the SDQ scales.
While SDQ research has expanded considerably, several theoretical debates remain unresolved. First, there is disagreement over whether parent–teacher discrepancies reflect measurement errors or meaningful, context-specific perspectives (Achenbach, 2006; Grigorenko et al., 2010). Second, findings are inconsistent regarding sociodemographic moderators: some studies report strong effects of gender, parental education, and academic performance (Booth et al., 2023; Keilow et al., 2019), while others find weaker associations (Fuchs et al., 2013; Ortuño-Sierra et al., 2016). Third, most evidence has been sourced from Western majority populations, raising questions about the generalizability of minority and non-Western groups (Hornby, 2011). By analyzing matched parent–teacher ratings in a Hungarian minority sample and testing demographic influences, this study directly addresses these debates and broadens the cultural scope of SDQ research.
2.4. Background of the Study
Slovakia is a landlocked country situated in Central Europe (Act No. 131/2002 Coll., 2002), sharing borders with Austria, the Czech Republic, Poland, Ukraine, and Hungary. As of 2024, its population is approximately 5.4 million people. In terms of international comparisons, Slovakia maintains a relatively high standard of living, with a Human Development Index (HDI) of 0.857, positioning it among the “very high” human development countries. The ethnic composition of the country is predominantly Slovak (approximately 80.7%), with significant minorities including Hungarians (8.5%), Roma (2%), and others (Statistical Office of the Slovak Republic, 2021). The Hungarian minority represents the largest ethnic minority group, numbering around 460,000 individuals, primarily residing in the southern regions bordering Hungary (Committee for National Minorities and Ethnic Groups, 2023). This demographic context is especially relevant to the present study, which investigates developmental and educational outcomes among Hungarian minority children living in Slovakia.
2.4.1. The Slovak Educational System
In Slovakia, the elementary school system (základná škola) is the main primary education institution, spanning a total of nine years. According to the Constitution of the Slovak Republic (Act No. 460/1992 Coll., 1992), compulsory schooling begins in the calendar year in which a child reaches the age of six by August 31. However, at the request of a parent—and with supporting documentation from a psychologist and the consent of the child’s general practitioner—the child may repeat their final year of kindergarten and begin school one year later (Centrum vedecko-technických informácií SR, 2021). The Slovak elementary school system is divided into two levels: the lower primary (Grades 1–4) and the upper primary (Grades 5–9) (Ministry of Education, Science, Research and Sport of the Slovak Republic, 2023a). Throughout Slovak primary and secondary education, academic performance is graded on a five-point scale in which lower numbers denote higher achievement: 1 (excellent), 2 (very good), 3 (good), 4 (pass), and 5 (fail) (Ministry of Education, Science, Research and Sport of the Slovak Republic, 2023b).
2.4.2. Educational Rights and Context of the Hungarian Minority
The right of citizens belonging to national or ethnic minorities to education and instruction in their native language is guaranteed in the Education Act (Act No. 245/2008 Coll., 2008). It affirms the rights of children and pupils from national minorities to receive education in schools and classes using their minority language. This framework is aimed at preserving and developing their cultural and linguistic identity. These provisions reflect the broader constitutional guarantee of minority rights contained in Article 34, paragraph 2(a) of the Constitution of the Slovak Republic. According to data from the Statistical Office of the Slovak Republic, in September 2023, there were 31,893 Hungarian-national pupils enrolled in Slovak elementary schools, in comparison to 441,775 Slovak pupils (Committee for National Minorities and Ethnic Groups, 2023). Other ethnic groups did not exceed 1000 students in total. As of 15 September 2022, there were 281 Hungarian-language kindergartens and one special Hungarian-language kindergarten operating in the country. Alongside 2069 Slovak-language elementary schools, there were 207 Hungarian-language schools and 27 bilingual elementary schools (offering both Hungarian and Slovak classes).
2.5. Rationale of the Study
Despite numerous studies examining students’ strengths and difficulties, most rely on clinical data or teacher assessments (Bell et al., 2024; Petermann et al., 2010); fewer have incorporated parents’ perspectives, often due to the perception that parents lack professional expertise and offer biased or subjective views (Smith, 2015), with their input often being undervalued by professionals as noted by Hornby (2011). Research comparing teacher and parent assessments is especially limited, despite the evidence that such comparisons provide a more comprehensive understanding of children’s socioemotional and behavioral difficulties and the fact that parental perspectives are essential for capturing behavior in the home environment, which can offer predictive insights for diagnosis and intervention (Brown, 2009). Therefore, involving both teachers and parents—as recommended by Achenbach (2006) and Grigorenko et al. (2010)—can enhance early identification and support. Discrepancies between evaluators may highlight areas requiring further collaboration, contributing to more effective, individualized educational strategies.
Differences between teacher and parent SDQ ratings often reflect contextual and demographic factors. The gender, age, parental education, and academic performance of a child all influence how their behavior is perceived (Booth et al., 2023; Ortuño-Sierra et al., 2016; Fuchs et al., 2013; Keilow et al., 2019). In a prior review, it was found that boys typically scored higher on externalizing problems, with lower parental education linked to more difficulties being reported. Academic struggles also correlated with higher SDQ scores (Atoum et al., 2018). Exploring these background variables can help clarify differences between informants and support more accurate assessment and intervention. Therefore, in the present study, we aim to (a) quantify informant agreement, (b) test which background variables predict informant differences, and (c) examine how agreement varies across early grades. In doing so, we will address identifiable empirical and geographical gaps in knowledge, such as the lack of multi-informant SDQ studies in the educational landscape, multi-informant agreement on SDQ scores, the identification of influencing factors, and differences in scores across age or grade level. Accordingly, the following research questions and hypotheses were explored:
- RQ1:
- How are children’s strengths and difficulties rated by teachers and parents?
- RH1:
- Parents will report higher mean total SDQ scores than teachers (Brandenburg et al., 2021).
- RQ2:
- How do children’s background variables—such as gender, parental education, and academic performance—relate to SDQ scores as reported by teachers and parents?
- RH2:
- Lower parental education and lower GPA will be associated with higher total difficulty scores on the SDQ given by both informants (Hjern et al., 2021).
- RQ3:
- Are there systematic differences in teacher–parent agreement and SDQ scores across school grade levels (1st to 4th Grades)?
- RH3:
- Teacher–parent agreement (ICCs) will increase with grade level (Mieloo et al., 2013).
- RQ4:
- Do children with officially diagnosed behavioral or special educational needs show distinct SDQ profiles compared to their non-diagnosed peers?
- RH4:
- Children with official diagnoses (SEN/behavioral disorders) will have significantly higher SDQ scores across subscales than their non-diagnosed peers (Schwab et al., 2016).
- RQ5:
- To what extent do teachers and parents agree in their assessments of children’s socioemotional and behavioral difficulties across the five SDQ subscales?
- RH5:
- Agreement will be domain-specific, hypothesizing higher agreement for observable behaviors (hyperactivity) and lower agreement for emotional and prosocial behavioral domains (Boman et al., 2016; Fält et al., 2018).
3. Materials and Methods
3.1. Participants
The study sample comprised a total of 501 children in Grades 1–4 (ages 6–10), with matched SDQ forms completed by both parents and teachers (Table 1). The average age in each grade was M = 6.89 for Grade 1, M = 7.82 for Grade 2, M = 8.90 for Grade 3, and M = 9.97 for Grade 4. Data collection was carried out in Hungarian-language elementary schools across multiple Slovak regions. Out of the eight administrative regions in Slovakia (subdivided into 79 districts), Hungarian-language schools are present in five: Bratislava, Trnava, Nitra, Banská Bystrica, and Košice. The data were collected in all five regions. Class sizes at the selected schools ranged from 18 to 23 pupils. Printed questionnaires were delivered in person by members of the university research team. Following the distribution of an introductory letter to school principals, researchers provided in-person instructions to teachers working in the lower primary grades (1st to 4th) regarding the procedures for data collection and the rules for completing the questionnaires. Since the study relied on two informants per child providing responses—the parent and the teacher—teachers completed questionnaires only for those children whose parents had previously filled out the parental version of the questionnaire. Importantly, teachers were not given access to the parents’ responses to ensure the objectivity of their own evaluations. In total, data were obtained for 501 pupils, based on responses from 501 parents and 107 teachers. All participating teachers were native Hungarian speakers teaching in lower primary grades during the 2024/25 school year.

Table 1.
Demographic variables of the sample.
3.2. Diagnostic System in Slovakia
Within the total sample (N = 501), a portion of the children were identified as having diagnosed developmental disorders (N = 38, exact percentage: 7.60%). The process of diagnosing developmental disorders and establishing special educational needs in Slovakia is generally long and complex, typically initiated by the parent. The referral may stem from the parent’s own concerns, suggestions from a teacher, or the opinion of another specialist, such as a school psychologist. Based on an official diagnosis made by psychologists or special educators working in state counseling and prevention centers, or by psychiatrists in the medical field, children become eligible for support measures in kindergartens or schools—provided they can be educated partially or fully in an inclusive classroom setting.
3.3. Instrument
The Strengths and Difficulties Questionnaire (SDQ) was used in this study to evaluate children’s behavioral and psychological symptoms. Developed by Goodman (2000), the SDQ is designed to investigate emotional and behavioral difficulties and other psychological challenges in children aged 6 to 10. The SDQ consists of 25 items/statements in total, each contributing to one of five core areas: (1) emotional symptoms (five items), (2) conduct problems (five items), (3) hyperactivity (five items), (4) peer problems (five items), and (5) prosocial behavior (five items). For each statement, participants responded using a three-point scale: 0 points (not true), 1 point (somewhat true), and 2 points (certainly true). Scores for each domain were summed to determine overall severity.
The SDQ is available in three formats: teacher-report, parent-report, and self-report questionnaires. For this study, the teacher and parent versions were utilized. The score thresholds for both teacher and parent ratings are classified in Table 2. Notably, the teacher’s questionnaire allows for one additional point in the normal range compared to the parent assessment. A total difficulty score, ranging from 0 to 40, can be calculated from the subscale scores (excluding prosocial behaviors) (Coulthard & Sudom, 2023; Goodman, 1997). In the SDQ, Prosocial Behavior is a strengths scale; higher scores indicate more prosocial behavior.
Table 2.
SDQ score classifications.
3.4. Analysis and Procedures
Prior to analysis, all reverse-keyed SDQ items were reverse-scored. Accordingly, for the four difficulty subscales—emotional symptoms, conduct problems, hyperactivity, and peer problems—higher scores indicate greater difficulties, whereas on the prosocial behavior strengths scale, higher scores indicate more prosocial behavior. The total difficulties score was computed as the sum of the four difficulty subscales (range = 0–40). Similarly, school grades in Slovakia (1 = Excellent, 2 = Very good, 3 = Good, 4 = Pass, 5 = Fail) were recoded to a GPA variable such that higher values reflected better academic performance; all continuous predictors were z-standardized prior to modeling. To gather preliminary information, descriptive statistics were analyzed using IBM SPSS Statistics 23 (Oo et al., 2023). To compare SDQ scores and subscales between teachers’ and parents’ ratings, a multivariate analysis of variance (MANOVA) was conducted; for each omnibus test, Wilks’ Λ, F(df1, df2), p, and partial η2 were reported. Pearson correlations and multiple regression analyses were also employed to identify associations between children’s background variables (e.g., grade, age, GPA, and parental education) and their SDQ scores. The appropriateness of model fit was examined using commonly recommended indices, such as χ2/df < 5, RMSEA < 0.06, SRMR < 0.08, and CFI > 0.90 (Oo et al., 2023). Measurement invariance was evaluated through changes in fit indices, with ∆CFI < 0.01, ∆SRMR < 0.03, and ∆RMSEA < 0.015 used as the criteria for establishing evidence of metric and scalar invariance (Bravo et al., 2021). Moreover, intraclass correlation coefficients (ICCs) were created with the Jamovi 2.6.25 software to assess inter-rater agreement at the subscale and total scale levels (continuous). A two-way random-effects model with average measures and absolute agreement was applied, as recommended for rater-based assessments. Agreement was evaluated using the ICC’s 95% confidence interval (Koo & Li, 2016). ICCs were classified as <0.40 (poor), 0.40–0.59 (fair), 0.60–0.74 (good), or >0.75 (excellent) (Cicchetti, 1994). A significance level (two-tailed) of p < 0.05 was used.
4. Results
4.1. Preliminary Information of the Study
Descriptive statistics were first analyzed to gather preliminary information concerning children’s socioemotional and behavioral characteristics, which both teachers and parents assessed. Table 3 shows the internal consistency reliability (Cronbach’s alpha), means (M), standard deviation (SD), skewness (Sk), and kurtosis (K) for each subscale of the instrument. The SDQ showed acceptable reliability across each subscale, with Cronbach’s alpha values ranging from 0.715 to 0.842 for teacher ratings and from 0.709 to 0.777 for parent ratings. Regarding the mean scores, both teachers and parents reported higher scores for prosocial behavior (M = 7.53, SD = 2.35 for teachers; M = 8.12, SD = 1.95 for parents) compared to other problems. Conduct problems and peer problems showed lower mean scores, suggesting fewer concerns in these areas. Skewness and kurtosis values for most variables were within acceptable ranges (±2.00) (Oo et al., 2025), indicating approximate normality in the distribution of responses. Using the alternative threshold of ±1.00 for skewness (Tabachnick & Fidell, 2019), only the “conduct problems” subscale indicated a deviation. For the total SDQ scores, skewness values were within a narrow range (−0.03 to 0.19) for both teacher and parent ratings, suggesting a high degree of consistency between the two assessments. Descriptive results indicated broadly similar patterns across informants.
Table 3.
Descriptive statistics.
4.2. Measurement Invariance of SDQ Assessment Between Informants
Multiple-group confirmatory factor analysis (MG-CFA) was used to test the measurement invariance of the SDQ across informants (teachers vs. parents) using four nested models (configural, metric, scalar, and partial scalar). As shown in Table 4, the configural model demonstrated acceptable fit (χ2(506) = 1119.61, CFI = 0.904, SRMR = 0.062, RMSEA = 0.052 [0.048, 0.056]), indicating that the five-factor SDQ structure was comparable across informants—that is, teachers and parents conceptualized the SDQ domains similarly. Constraining factor loadings (metric invariance) left the model fit essentially unchanged relative to the configural model (χ2(526) = 1258.69 (ΔCFI = 0.000, ΔSRMR = 0.004, ΔRMSEA = 0.001)), supporting metric invariance and permitting a comparison of factor variances and covariances. Adding intercept constraints (scalar invariance) also yielded an acceptable fit (χ2(546) = 1411.38 (ΔCFI = −0.002, ΔSRMR = 0.003, ΔRMSEA = 0.003)), with the changes within recommended cutoffs. Nevertheless, inspection of modification indices indicated intercept non-invariance on a subset of items; therefore, a partial scalar model was estimated by freeing six item intercepts, which improved fit relative to the full scalar model (χ2(540) = 1188.68, CFI = 0.902, SRMR = 0.066, RMSEA = 0.046 [0.042, 0.050]). The partial scalar solution met the change-in-fit criteria (e.g., ΔCFI ≤ 0.010; ΔRMSEA ≤ 0.015) and was retained for latent mean comparisons across informants.
Table 4.
Measurement invariance across informants (teacher vs. parent).
4.3. Latent Mean Differences Between Informants
After establishing the scalar invariance of SDQ between informants, latent mean differences (LMDs) were examined using teachers as the reference group. As shown in Table 5, parents reported significantly higher levels of conduct problems (LMD = 0.370, SE = 0.084, z = 4.385, p < 0.001, d = 0.37) compared to teachers, representing a small-to-moderate effect size. Parents also rated children as showing more prosocial behavior than teachers (LMD = 0.344, SE = 0.088, z = 3.904, p < 0.001, d = 0.34), with a small effect. For emotional symptoms, the LMD was slightly significant, but the effect size was too small (d = 0.15), indicating little practical difference between teacher and parent reports. No significant latent mean difference was reported for peer problems (LMD = −0.025, SE = 0.098, z = −0.255, p > 0.05); the effect was negligible. Hyperactivity/inattention likewise showed no significant latent mean difference (LMD = 0.137, SE = 0.083, z = 1.651, p > 0.05), indicating that parents and teachers rated these domains similarly.
Table 5.
Latent mean differences between informants.
4.4. Strength and Difficulty Levels
As shown in Section 3, strength and difficulty levels of SDQ scores were categorized into three groups (normal, borderline, and abnormal), and then compared based on five specific SDQ subscales (Table 6).
Table 6.
Distribution of SDQ band classifications (Normal, Borderline, Abnormal) by rater and subscale.
According to teachers’ ratings, the majority of students were classified in the normal range across all five SDQ subscales. Specifically, over 80% of students fell within the normal category for emotional symptoms (83.36%), conduct problems (84.76%), peer problems (88.02%), hyperactivity (74.65%), and prosocial behavior (81.04%). The abnormal range was highest for hyperactivity (18.36%), followed by emotional symptoms (9.78%) and prosocial behavior (9.58%), suggesting that teachers identified these as the most common areas of difficulty. The borderline range remained relatively low across all subscales, ranging from 6.79% to 9.38%. In terms of parents’ ratings, most students were categorized as normal based on SDQ scores; the percentage of students in the borderline group was the lowest for all subscales based on these ratings, ranging from 5.99% to 13.79%. Finally, as rated by parents, emotional symptoms were the most common subscale within the abnormal range (21.16%), followed by hyperactivity (15.77%), peer problems (14.77%), conduct problems (12.57%), and prosocial behavior (5.59%).
Multi-group analysis of variance (MANOVA) was also employed to compare teachers’ and parents’ ratings of SDQ scores. Consistent with the LMD tests, reports of hyperactivity/inattention and peer problems showed no rater differences, whereas reports of emotional symptoms, conduct problems, and prosocial behavior differed between raters. Total difficulty scores were also quantified by excluding the prosocial scale. Overall, parents gave slightly more favorable ratings, though both groups identified a comparable proportion of clinically significant difficulties, suggesting the need for inter-rater agreements (intraclass correlation coefficients, ICCs) between teachers and parents to confirm the results from both informants.
4.5. Relationships Between Background Variables and SDQ Scores in Both Teachers’ and Parents’ Ratings
Table 7 presents the correlations between background variables (grade level, age, GPA, and parental education levels) and children’s SDQ scores, rated by both teachers and parents. Based on teachers’ ratings, several background variables were significantly correlated with SDQ subscales. For example, grade and age showed small but significant positive correlations with emotional symptoms (r = 0.11, r = 0.09, p < 0.05), suggesting that teachers observed more emotional symptoms in older students. GPA has a significant negative correlation with several SDQ domains (conduct problems (r = −0.16, p < 0.01), hyperactivity (r = −0.20, p < 0.01), and peer problems (r = −0.15, p < 0.01)), and a significant positive correlation with prosocial behavior (r = 0.09, p < 0.05). This demonstrates that higher academic achievement is consistently related to lower behavioral and emotional difficulties and to higher prosocial behaviors. Maternal education level was negatively correlated with conduct problems (r = −0.13, p < 0.05) and hyperactivity (r = −0.20, p < 0.01), suggesting that it may be a protective factor against behavioral problems.
Table 7.
Relationships between background variables and SDQ scores.
Based on parent ratings, grade and age were both positively correlated with emotional symptoms (r = 0.10, r = 0.09, p < 0.05, respectively), indicating that older children were perceived to have more emotional symptoms. Although paternal education showed no significant relationships, maternal education was negatively correlated with peer problems (r = −0.08, p < 0.05), highlighting a small protective effect. As with teacher ratings, GPA also showed negative correlations with emotional symptoms (r = −0.12, p < 0.01), conduct problems (r = −0.20, p < 0.05), hyperactivity (r = −0.11, p < 0.01), and peer problems (r = −0.11, p < 0.01), and a positive correlation with prosocial behavior (r = 0.19, p < 0.01). This suggests that higher academic achievement is related to lower levels of socioemotional and behavioral problems and higher levels of prosocial behavior.
4.6. Impact of Demographic Variables (e.g., Parental Education and Gender) on SDQ Scores
We also investigated the impact of demographic variables (gender, age, grade, GPA, and parental education) on SDQ scores based on both teachers’ and parents’ ratings. For teachers, the multiple regression model was statistically significant (R2 = 0.370, p = 0.005, F = 48.35), indicating that approximately 37% of the variance in teachers’ SDQ ratings can be explained by the included demographic variables. Table 8 shows that grade level had a significant positive effect (β = 0.24, p < 0.05), suggesting that higher grade levels were associated with more socioemotional and behavioral problems. GPA had a significant negative effect (β = −0.19, p < 0.001), indicating that higher achievement can lead to lower SDQ scores. Other variables, such as gender, age, and parental education, showed no significant effects on children’s SDQ scores.
Table 8.
Impacts of demographic variables on SDQ scores (multiple regression analysis).
In parents’ ratings, the included predictors explained 19.70% of the variance in SDQ scores. Grade had a significant positive effect (β = 0.23, p < 0.05), meaning that parents perceived more difficulties in children at higher grades. GPA also significantly and negatively affected children’s SDQ scores, as with the teachers’ ratings. Gender and parental education showed no significant effects on children’s SDQ scores.
4.7. Variations Across Grade Levels in Both SDQ Scores
When investigating variations in SDQ scores (emotional symptoms, conduct problems, hyperactivity, peer problems, and prosocial behavior) using ANOVA, teacher ratings demonstrated significant differences (F(3, 497) = 6.19, p < 0.001, partial η2 = 0.036) across grade levels (Grades 1, 2, 3, and 4). Specifically, for emotional symptoms (p = 0.001), Grade 4 (M = 2.97, SD = 2.31) and Grade 2 students showed the highest teacher scores (M = 2.90, SD = 2.04), followed by Grade 3 and Grade 1. For conduct problems, teachers’ ratings were also significant (p = 0.006), with the highest scores seen in Grade 4 and Grade 2, followed by Grade 3 and Grade 1 (Figure 1).
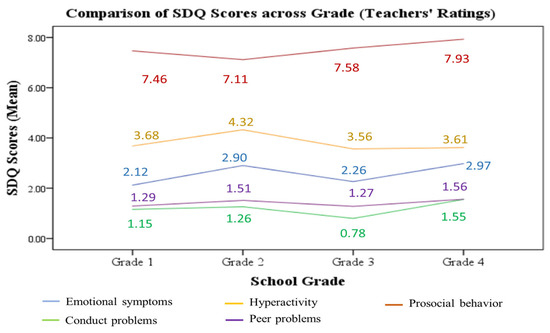
Figure 1.
Comparisons of SDQ scores across grade levels by teacher ratings.
However, based on parents’ ratings, no significant difference was found (F(3, 497) = 1.40, p = 0.139, partial η2 = 0.014) across grades in students’ SDQ scores (Figure 2). This shows that students in all grades demonstrated similar social and emotional symptoms in this regard.
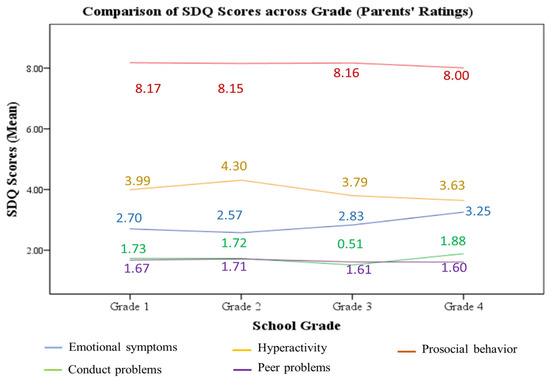
Figure 2.
Comparisons of SDQ scores across grade levels by parent ratings.
4.8. Comparison of SDQ Scores Between Diagnosed and Non-Diagnosed Children
One-way multivariate analysis of variance (MANOVA) was employed to explore whether children with officially diagnosed behavioral or special educational needs showed distinct SDQ profiles compared to their non-diagnosed peers. In teacher ratings (Table 9), significant differences were found in all five SDQ subscales (emotional symptoms, conduct problems, hyperactivity, peer problems, and prosocial behavior) between diagnosed and non-diagnosed children (Wilks’ Lambda = 0.911, F(5, 499) = 9.71, p < 0.001, partial η2 = 0.089, showing that children with officially diagnosed behavioral or special education needs have greater difficulties and lower prosocial strengths than non-diagnosed children. Similarly, parent ratings also showed significant differences between these groups (Wilks’ Lambda = 0.947, F(5, 499) = 9.47, p < 0.001, partial η2 = 0.053).
Table 9.
One-way MANOVA.
4.9. SDQ Score Agreement Between Teachers and Parents
4.9.1. Inter-Rater Agreement Between Teachers and Parents on SDQ Scores
To ensure the above results were correct, we confirmed the agreement levels on SDQ and subscale scores between teachers and parents using intraclass correlation coefficients (ICCs), which were calculated using absolute agreement and a two-way random-effects model in Jamovi 2.6.25 software (Table 10). ICC values ranged from 0.45 to 0.61 across SDQ subscales, and the total SDQ score was 0.62. Prosocial behavior showed the lowest agreement (ICC = 0.45), indicating fair agreement between teachers and parents, while hyperactivity had the highest agreement (ICC = 0.61), showing good agreement between both raters. All ICCs were statistically significant (p < 0.001), confirming that teachers’ and parents’ ratings were meaningful and showed either fair or good agreement.
Table 10.
ICC analysis for all SDQ and subscale scores.
4.9.2. Inter-Rater Agreement Between Teachers and Parents on SDQ Scores by Grade Levels
Table 11 shows levels of inter-rater agreement between teachers and parents on SDQ scores based on grade levels (ICC scores). Grade 4 demonstrated the highest agreement across most SDQ dimensions, with ICCs ranging from 0.63 to 0.79, including excellent agreement for conduct problems (ICC = 0.79) and for total SDQ scores (ICC = 0.75). This suggests a strong agreement between teacher and parent perceptions of older students’ socioemotional and behavioral difficulties.
Table 11.
ICC analysis for SDQ scores by children’s grades (Grades 1, 2, 3, and 4).
Grades 1 and 2 showed fair to good agreement, particularly for emotional symptoms and hyperactivity, with ICCs mostly ranging between 0.40 and 0.63. Notably, Grade 2 had a good level of agreement for total SDQ scores (ICC = 0.64), while Grade 1 had fair agreement overall (ICC = 0.51). In contrast, Grade 3 had the weakest inter-rater agreement, with several subscales showing poor ICCs (prosocial behavior ICC = 0.32, peer problems ICC = 0.34), and only moderate agreement on hyperactivity (ICC = 0.54). The total score agreement in Grade 3 was also low (ICC = 0.35), showing low agreement between teachers and parents. To further understand these low ICCs, subgroup analyses were conducted for boys and girls. Both showed similarly low agreement on the total SDQ scores (ICC = 0.41 for boys, and ICC = 0.31 for girls), with slightly higher consistency for hyperactivity only. This suggests that the weak agreement in Grade 3 is not due to gender differences but may reflect developmental transitions at this age. However, these findings show that inter-rater reliability improves at higher grade levels, which may be because behavioral patterns are more observable in these older students, leading to increased agreement in adult perceptions as students mature.
5. Discussion
In this study, we investigated socioemotional and behavioral problems among Hungarian minority children in Slovakia by comparing teacher and parent ratings using the SDQ. Both teachers and parents gave valuable perspectives on children’s SDQ scores, with good agreement being reached in most cases. Based on their ratings, we addressed five main research questions.
The first research question related to how children’s strengths and difficulties were rated by teachers and parents. One of the distinct findings was the higher average total SDQ scores in parents’ reports compared to teachers’ reports, consistent with the stated hypothesis that parents tend to report more emotional and behavioral problems (Brandenburg et al., 2021; Murray et al., 2021). This may be because parents are more likely to witness behaviors at home, particularly those related to internalizing symptoms, such as sadness, worry, or fear, which may be less visible in structured classroom environments. Conversely, teachers may find it difficult to identify such challenges or emotional symptoms in school settings. Hyperactivity was the one distinct domain of SDQ problems, with higher agreement than other SDQ subscales between teachers and parents. This means that such externalizing behaviors may be observable in both home and school environments (Booth et al., 2023). These informant differences can be better understood through Bronfenbrenner’s ecological systems theory and Achenbach’s cross-informant framework. The home and school represent distinct microsystems with different norms and expectations: parents observe children in emotionally intimate contexts, while teachers assess behavior within structured settings (Bronfenbrenner, 1979). Therefore, parents’ higher ratings of emotional symptoms and teachers’ emphasis on hyperactivity reflect setting-specific behavioral expressions. Moreover, the increasing teacher–parent agreement in higher grades suggests that as children mature, behavioral patterns become more consistent across microsystems. This supports Achenbach’s view that cross-informant differences are not errors but meaningful reflections of ecological variation (Achenbach, 2006; Grigorenko et al., 2010).
The second research question concerns the relationship between children’s demographic variables and SDQ scores. The results showed that age and grade level had significant relationships with both teachers’ and parents’ ratings of children’s emotional and conduct problems, suggesting that older children begin to experience more complex emotional symptoms and peer-related problems. This finding is in line with previous studies showing that SDQ scores can increase with age, particularly for internalizing behaviors (Rothenberger et al., 2008; Ortuño-Sierra et al., 2016). As children’s academic performance (GPA) had a positive relationship with their prosocial behavior, it could be assumed that students with higher academic achievement may have more prosocial behavior. Moreover, when exploring the predictive effects of children’s demographic variables, we found that GPA was a significant negative predictor of SDQ scores in both informants’ ratings. Specifically, in both ratings, GPA showed negative relationships with most of the SDQ subscales—emotional symptoms, conduct problems, hyperactivity, and peer problems—but a positive correlation with the prosocial behavioral scale. This may indicate that higher academic achievement is related to lower levels of socioemotional problems and better prosocial behaviors (Keilow et al., 2019; W. Yu et al., 2022). Maternal education also showed a significant predictive effect on children’s SDQ scores, reducing problems with conduct and peers, consistent with findings from Fuchs et al. (2013) and Hjern et al. (2021).
The third research question explored SDQ profiles by grade level (in Grades 1, 2, 3, and 4). It was found that only teachers’ ratings showed significant differences in SDQ scores, particularly in the subscales assessing emotional and conduct problems. This aligns with the stated hypothesis that age differences would affect SDQ scores (Ortuño-Sierra et al., 2016). These differences suggest that teachers perceive developmental changes in behavior more distinctly due to their broader exposure to classroom settings. The absence of significant differences in parents’ ratings may reflect a more static view of children’s behavior or a lesser sensitivity to developmental progress across primary grades (Mao et al., 2020).
The fourth research question was used to investigate the difference in SDQ ratings between children with officially diagnosed behavioral or special education needs (SENs) and those without. Children with an official diagnosis scored significantly higher across all SDQ subscales as reported by both informants. This aligns with previous studies (Charman et al., 2015; Schwab et al., 2016), confirming the stated hypothesis that children with SENs had higher levels of emotional, conduct, and attention problems. However, the prosocial behavioral scores for diagnosed children were lower in teachers’ ratings but did not show a significant difference in parents’ ratings, showing a disagreement between the two informants. A possible reason for this may be that teachers hold higher expectations for active classroom participation from normal students, but fail in the specific context of this study.
The final research question related to inter-rater agreement on SDQ scores between teachers and parents. The inter-rater agreement values ranged from fair to good (ICC = 0.45 to 0.61), in line with the existing literature on the moderate agreement levels between teachers and parents (Turi et al., 2011). However, the subscale of prosocial behavior showed the lowest agreement between teachers’ and parents’ ratings; this may be because assumptions of positive behaviors differ between teachers and parents. As an example, a parent may see a child’s willingness to help at home as a sign of empathy or emotion, while a teacher might assess this domain based on peer interaction or collaboration. However, in terms of the reliability and consistency of our research findings, both teachers and parents showed moderate to high agreement for all grades, except for Grade 3. In our sample, Grade 3 demonstrated the lowest inter-rater agreement, with poor ICCs for total SDQ scores (ICC = 0.35) and several subscales. This may reflect the specific developmental stage of children in Grade 3 (aged 8–9 years old). At this age, behavioral patterns are more variable across contexts, including home and school, and peer influence and self-regulation skills are still emerging (Speyer et al., 2023). Additionally, differences in teachers’ and parents’ interpretations of behaviors at this age may contribute to low agreement. Future research could examine these low ICCs more closely through sensitive analyses, such as controlling for child age, gender, or specific subscale variability, to better understand the contextual and methodological factors affecting inter-rater reliability. As this study did not collect detailed contextual or qualitative data, the interpretation of this Grade 3 anomaly should therefore be considered exploratory. Future research should examine whether curriculum transitions, increased academic demands, or peer dynamics at this grade level contributed to the lower teacher–parent agreement observed.
As for practical implications, we highlight several areas for targeted, low-cost interventions in Hungarian minority schools. First, because prosocial behavior showed the weakest teacher–parent agreement, schools could introduce a short “home-school social skills card.” Teachers and parents would each record weekly examples of behaviors, such as helping, sharing, and cooperating. If large differences in reports emerged, this could prompt a short, solution-focused conversation with the child to better understand context-specific behavior. To facilitate consistent communication between parents and teachers (who may differ in language proficiency), the information from this social skills card should be adapted to the bilingual context of Hungarian minority families in Slovakia. Second, given that higher maternal education was associated with fewer conduct problems, parental workshops could be co-developed with local NGOs and offered in both Hungarian and Slovak. These workshops would provide concrete strategies for consistent behavioral management routines, modeled in both languages to support bilingual family environments. Finally, the particularly low teacher–parent agreement observed in Grade 3 suggests that this may be a transitional period where perceptions diverge. Schools could, therefore, consider brief orientation sessions for parents and teachers at the start of Grade 3 to align expectations, explain developmental changes, and strengthen communication.
This study also has some limitations. We based our assessments on teachers’ and parents’ ratings, but not students’ self-assessments, which are based on their crucial experiences. While the SDQ has been validated across multiple cultural contexts (Dubiel et al., 2024; Booth et al., 2023), the specific experiences of minority populations, such as language barriers, integration challenges, or perceived discrimination, may influence both children’s socioemotional and behavioral problems. Moreover, the assessment raters (both teachers and parents) might share cultural values that influence their expectations of a child’s socioemotional and behavioral norms. The analyses did not fully account for the nested structure of children within classrooms. The absence of multilevel modeling means that potential classroom-level clustering effects were not controlled for, possibly leading to underestimations in standard errors and overestimations in significance values. Therefore, future research should apply multilevel models to account for clustering effects. In addition, the opt-in sampling approach used may have introduced selection bias, limiting the generalizability of the findings; families who agreed to participate may have differed from those who declined, potentially limiting the representativeness of the sample. Subsequent studies should consider strategies to minimize model selection effects. Additionally, only a small proportion of pupils in the sample (7.6%) had a formal diagnosis of behavioral or special educational needs, which may limit the generalizability of our findings to children with diagnosed conditions.
6. Conclusions
In this study, both teachers and parents rated socioemotional and behavioral problems among Hungarian minority children in Slovakia. The findings showed that although most of the children fell within the normal range, hyperactivity and low prosocial behavior (fewer strengths) were the most commonly identified problems. Background variables, such as grade level, GPA, and maternal education, were significantly associated with children’s SDQ scores. Teachers, but not parents, reported significant differences across grade levels, with greater difficulties observed in older children. Moreover, children with officially diagnosed SENs or behavioral problems showed significantly higher SDQ scores in all domains. The inter-rater agreement between teachers and parents was moderate in overall SDQ assessments. Therefore, the findings of this study not only confirm previously established patterns in SDQ research (e.g., investigating informant differences, domain-specific agreement levels, and the impact of demographic factors) but also offer valuable insights for educators and future researchers.
Author Contributions
Conceptualization, K.J., D.B., A.N., and T.Z.O.; methodology, K.J., and T.Z.O.; validation, K.J., and T.Z.O.; formal analysis, K.J., and T.Z.O.; investigation, D.B., A.N.; resources, D.B., and A.N.; data curation, K.J., D.B., and A.N.; writing—original draft preparation, K.J., D.B., A.N., and T.Z.O.; writing—review and editing, K.J., and T.Z.O.; supervision, K.J.; project administration, D.B., and A.N.; funding acquisition, A.N. All authors have read and agreed to the published version of the manuscript.
Funding
The funding was supported by J. Selye University Grant for young researchers and doctoral students (2025).
Institutional Review Board Statement
The study was conducted in accordance with the Declaration of Helsinki and approved by the Institutional Review Board of the Institute of Education, Hungarian University of Agriculture and Life Sciences (protocol code 5/2024, approved on 13 March 2024).
Informed Consent Statement
Informed consent was obtained from all subjects involved in the study through the respective principals.
Data Availability Statement
Data are unavailable due to privacy or ethical restrictions.
Acknowledgments
Tun Zaw Oo gratefully acknowledges the support provided by the Scientific Foundations of Education Research Program of the Hungarian Academy of Sciences. The authors also express their sincere gratitude to the participating teachers and parents for their valuable contribution in completing the SDQ questionnaires used in this study.
Conflicts of Interest
The authors declare no conflicts of interest. The authors alone are responsible for the content and writing of the paper.
References
- Achenbach, T. (2006). As others see us: Clinical and research implications of cross-informant correlations for psychopathology. Current Directions in Psychological Science, 15, 94–98. [Google Scholar] [CrossRef]
- Act No. 131/2002 Coll. (2002). On higher education and on amendments and supplements to certain acts. Available online: https://www.slov-lex.sk/ezbierky/pravne-predpisy/SK/ZZ/2002/131/20250201.html (accessed on 23 May 2025).
- Act No. 245/2008 Coll. (2008). On upbringing and education (education act) and on amendments and supplements to certain acts. Available online: https://www.slov-lex.sk/ezbierky/pravne-predpisy/SK/ZZ/2008/245/20250630.html (accessed on 20 May 2025).
- Act No. 460/1992 Coll. (1992). Constitution of the slovak republic. Available online: https://www.slov-lex.sk/ezbierky/pravne-predpisy/SK/ZZ/1992/460/20250101.html (accessed on 15 May 2025).
- Atoum, M., Alhussami, M., & Rayan, A. (2018). Emotional and behavioral problems among Jordanian adolescents: Prevalence and associations with academic achievement. Journal of Child and Adolescent Psychiatric Nursing, 31(2–3), 70–78. [Google Scholar] [CrossRef]
- Barriuso-Lapresa, L. M., Hernando-Arizaleta, L., & Rajmil, L. (2014). Reference values of the Strengths and Difficulties Questionnaire (SDQ) version for parents in the Spanish population, 2006. Actas Espanolas de Psiquiatria, 42(2), 43–48. [Google Scholar]
- Bell, B. A., Taylor, S. G., Roberts, A. M., Shi, D., Burgess, K., Hough, C., & Flory, K. (2024). Factor structure of the teacher strengths and difficulties questionnaire in a large community-based sample: An investigation of alternative measurement models. Assessment, 31(2), 291–303. [Google Scholar] [CrossRef]
- Boman, F., Stafstrom, M., Moghadassi, M., Ostergren, P. O., Lundin, N., & Tornhage, C. J. (2016). Comparing parent and teacher assessments of mental health in elementary school children. Scandinavian Journal of Public Health, 44(2), 168–176. [Google Scholar] [CrossRef]
- Booth, C., Moreno-Agostino, D., & Fitzsimons, E. (2023). Parent-adolescent informant discrepancy on the strengths and difficulties questionnaire in the UK millennium cohort study. Child and Adolescent Psychiatry and Mental Health, 17(1), 57. [Google Scholar] [CrossRef] [PubMed]
- Brandenburg, J., Hartmann, D., Visser, L., Schwenck, C., & Hasselhorn, M. (2021). Differentielle Stabilität und Interrater-Dependenzen bei der Beurteilung psychischer Auffälligkeiten: Längsschnittliche Analysen mit dem SDQ bei Kindern mit und ohne Lernstörungen [Differential stability and interrater-dependencies in the assessment of psychopathological symptoms: Longitudinal analyses based on the SDQ in children with and without specific learning disabilities]. Praxis Der Kinderpsychologie Und Kinderpsychiatrie, 70(4), 282–297. [Google Scholar] [CrossRef] [PubMed]
- Bravo, D. M., Suárez-Falcón, J. C., Bianchi, J. M., Segura-Vargas, M. A., & Ruiz, F. J. (2021). Psychometric properties and measurement invariance of the Maslach Burnout Inventory—General Survey in Colombia. International Journal of Environmental Research and Public Health, 18(10), 5118. [Google Scholar] [CrossRef] [PubMed]
- Bronfenbrenner, U. (1979). The ecology of human development: Experiments by nature and design. Harvard University Press. [Google Scholar]
- Brown, T. E. (2009). ADD/ADHD and impaired executive function in clinical practice. Current Attention Disorders Reports, 1(1), 37–41. [Google Scholar] [CrossRef]
- Bryant, A., Guy, J., Holmes, J., & Team The CALM. (2020). The Strengths and Difficulties Questionnaire predicts concurrent mental health difficulties in a transdiagnostic sample of struggling learners. Frontiers in Psychology, 11, 112–119. [Google Scholar] [CrossRef]
- Centrum vedecko-technických informácií SR. (2021). Regional education. Available online: https://www.cvtisr.sk/cvti-sr-vedecka-kniznica/informacie-o-skolstve/skolstvo/regionalne-skolstvo.html?page_id=10267 (accessed on 15 May 2025).
- Charman, T., Ricketts, J., Dockrell, J. E., Lindsay, G., & Palikara, O. (2015). Emotional and behavioral problems in children with language impairments and children with autism spectrum disorders. International Journal of Language and Communication Disorders, 50(1), 84–93. [Google Scholar] [CrossRef]
- Chen, C.-C., Cheng, S.-L., Xu, Y., Rudasill, K., Senter, R., Zhang, F., Washington-Nortey, M., & Adams, N. (2022). Transactions between problem behaviors and academic performance in early childhood. International Journal of Environmental Research and Public Health, 19(15), 9583. [Google Scholar] [CrossRef]
- Cicchetti, D. V. (1994). Guidelines, criteria, and rules of thumb for evaluating normed and standardized assessment instruments in psychology. Psychological Assessment, 6(4), 284–290. [Google Scholar] [CrossRef]
- Committee for National Minorities and Ethnic Groups. (2023). Evaluation report of the Committee for National Minorities and Ethnic Groups on the support of national minority cultures, the state of minority education, and the use of minority languages for the period 2021–2022. Available online: https://www.narodnostnemensiny.vlada.gov.sk/site/assets/files/3564/hodnotiaca_sprava_vnmes_2021-2022-_final_-_s_ms.pdf (accessed on 13 May 2025).
- Coulthard, J., & Sudom, K. (2023). Factor structure of the parent-rated strengths and difficulties questionnaire in a sample of Canadian children from military families. Frontiers in Psychology, 14, 1101407. [Google Scholar] [CrossRef]
- Downs, A., Strand, P. S., Heinrichs, N., & Cerna, S. (2012). Use of the teacher version of the Strengths and Difficulties Questionnaire with German and American preschoolers. Early Education and Development, 23(4), 493–516. [Google Scholar] [CrossRef]
- Dubiel, S., Cohen, F., & Anders, Y. (2024). German parents and educators of two to four-year-old children as informants for the Strengths and Difficulties Questionnaire (SDQ). Child Psychiatry and Human Development. [Google Scholar] [CrossRef]
- Fält, E., Wallby, T., Sarkadi, A., Salari, R., & Fabian, H. (2018). Agreement between mothers’, fathers’, and teachers’ ratings of behavioral and emotional symptoms in 3–5-year-old children. PLoS ONE, 13(11), e0206752. [Google Scholar] [CrossRef]
- Fuchs, S., Klein, A. M., Otto, Y., & Von Klitzing, K. (2013). Prevalence of emotional and behavioral symptoms and their impact on daily life activities in a community sample of 3 to 5-year-old children. Child Psychiatry and Human Development, 44(4), 493–503. [Google Scholar] [CrossRef]
- Goodman, R. (1997). The strengths and difficulties questionnaire: A research note. Child Psychology & Psychiatry & Allied Disciplines, 38(5), 581–586. [Google Scholar] [CrossRef]
- Goodman, R. (2000). The extended version of the Strengths and Difficulties Questionnaire as a guide to children psychiatric caseness and consequent burden. Journal of Child Psychology and Psychiatry, 40(5), 791–799. [Google Scholar] [CrossRef]
- Gray, E. J., Scott, J. G., Lawrence, D. M., & Thomas, H. J. (2021). Concordance between adolescents and parents on the strengths and difficulties questionnaire: Analysis of an Australian nationally representative sample. Australian and New Zealand Journal of Psychiatry, 55(11), 1058–1070. [Google Scholar] [CrossRef]
- Grigorenko, E. L., Geiser, C., Slobodskaya, H. R., & Francis, D. J. (2010). Cross-informant symptoms from CBCL, TRF, and YSR: Trait and method variance in a normative sample of Russian youths. Psychological Assessment, 22, 893–911. [Google Scholar] [CrossRef]
- Hjern, A., Bergström, M., Fransson, E., Lindfors, A., & Bergqvist, K. (2021). Birth order and socioeconomic disadvantage predict behavioral and emotional symptoms at age 3 years. Acta Paediatrica, International Journal of Paediatrics, 110(12), 3294–3301. [Google Scholar] [CrossRef]
- Hobbs, J., & Laurens, R. K. (2020). Psychometric comparability of self-report by children aged 9–10 versus 11 years on the Strengths and Difficulties Questionnaire (SDQ). Child Indicators Research, 13, 301–318. [Google Scholar] [CrossRef]
- Hoffmann, M. D., Lang, J. J., Guerrero, M. D., Cameron, J. D., Goldfield, G. S., Orpana, H. M., & de Groh, M. (2020). Evaluating the psychometric properties of the parent-rated strengths and difficulties questionnaire in a nationally representative sample of Canadian children and adolescents aged 6 to 17 years. Health Reports, 31(8), 13–20. [Google Scholar] [CrossRef]
- Hornby, G. (2011). Parental involvement in childhood education: Building effectiveness school—Family partnerships. Springer. [Google Scholar]
- Jaspers-van der Maten, M. L., & Rommes, E. W. M. (2024). Early identification of social, emotional, and behavioral difficulties in primary schools: Explanations for special educational needs coordinators’ different practices. School Mental Health, 16(4), 1247–1260. [Google Scholar] [CrossRef]
- Johnson, S., Hollis, C., Marlow, N., Simms, V., & Wolke, D. (2014). Screening for childhood mental health disorders using the Strengths and Difficulties Questionnaire: The validity of multi-informant reports. Developmental Medicine and Child Neurology, 56(5), 453–459. [Google Scholar] [CrossRef]
- Józsa, G., Oo, T. Z., Amukune, S., & Józsa, K. (2022). Predictors of the intention of learning in higher education: Motivation, self-handicapping, executive function, parents’ education and school achievement. Education Sciences, 12(12), 906. [Google Scholar] [CrossRef]
- Kamara, D., Walton, K., & Witwer, A. N. (2020). Socioemotional and autism spectrum disorder screening for toddlers in early intervention: Agreement among measures. Journal of Early Intervention, 42(4), 359–380. [Google Scholar] [CrossRef]
- Keilow, M., Sievertsen, H. H., Niclasen, J., & Obel, C. (2019). The strengths and difficulties questionnaire and standardized academic tests: Reliability across respondent type and age. PLoS ONE, 14(7), e0220193. [Google Scholar] [CrossRef]
- Klein, A. M., Otto, Y., Fuchs, S., Zenger, M., & Von Klitzing, K. (2013). Psychometric properties of the parent-rated SDQ in preschoolers. European Journal of Psychological Assessment, 29(2), 96–104. [Google Scholar] [CrossRef]
- Koo, T. K., & Li, M. Y. (2016). A guideline of selecting and reporting intraclass correlation coefficients for reliability research. Journal of Chiropractic Medicine, 15(2), 155–163. [Google Scholar] [CrossRef] [PubMed]
- Kozlova, E. A., Petrenko, E. N., Varshal, A. V., Leto, I. V., Grishkevich, M. E., Rezun, E. V., Kornienko, O. S., & Slobodskaya, H. R. (2023). The contribution of family factors to the mental health of primary schoolchildren before and during the COVID-19 Pandemic. Psychology, Journal of the Higher School of Economics, 20(4), 757–772. [Google Scholar] [CrossRef]
- Mao, M., Zang, L., & Zhang, H. (2020). The effects of parental absence on children development: Evidence from left-behind children in China. International Journal of Environmental Research and Public Health, 17(18), 6770. [Google Scholar] [CrossRef]
- Mathis, E. T. B., & Bierman, K. L. (2015). Effects of parent and child pre-intervention characteristics on child skill acquisition during a school readiness intervention. Early Childhood Research Quarterly, 33, 87–97. [Google Scholar] [CrossRef]
- Mieloo, C. L., Bevaart, F., Donker, M. C. H., Van Oort, F. V., Raat, H., & Jansen, W. (2013). Validation of the SDQ in a multi-ethnic population of young children. European Journal of Public Health, 24(1), 26–32. [Google Scholar] [CrossRef]
- Mieloo, C. L., Raat, H., van Oort, F., Bevaart, F., Vogel, I., Donker, M., & Jansen, W. (2012). Validity and reliability of the Strengths and Difficulties Questionnaire in 5–6 year olds: Differences by gender or by parental education? PLoS ONE, 7(5), e36805. [Google Scholar] [CrossRef]
- Ministry of Education, Science, Research and Sport of the Slovak Republic. (2023a). State educational program for primary education. Available online: https://www.minedu.sk/statny-vzdelavaci-program-pre-zakladne-vzdelavanie-2023/ (accessed on 12 May 2025).
- Ministry of Education, Science, Research and Sport of the Slovak Republic. (2023b). Summary report on primary schools. Available online: https://www.minedu.sk/data/files/12231_3-01.pdf (accessed on 12 May 2025).
- Murray, A. L., Speyer, L. G., Hall, H. A., Valdebenito, S., & Hughes, C. (2021). Teacher versus parent informant measurement invariance of the Strengths and Difficulties Questionnaire. Journal of Pediatric Psychology, 46(10), 1249–1257. [Google Scholar] [CrossRef]
- Myers, S. S., & Pianta, R. C. (2008). Developmental commentary: Individual and contextual influences on student-teacher relationships and children’s early problem behaviors. Journal of Clinical Child and Adolescent Psychology, 37(3), 600–608. [Google Scholar] [CrossRef]
- Oo, T. Z., Habók, A., & Józsa, K. (2023). Empowering educators to sustain reflective teaching practices: The validation of instruments. Sustainability, 15(9), 7640. [Google Scholar] [CrossRef]
- Oo, T. Z., Kadyirov, T., Kadyjrova, L., & Józsa, K. (2025). Enhancing design skills in art and design education. Frontiers in Education, 10, 1521823. [Google Scholar] [CrossRef]
- Ortuño-Sierra, J., Fonseca-Pedrero, E., Inchausti, F., & Sylvia Sastre i, R. (2016). Assessing behavioral and emotional difficulties in the child-adolescent population: The strengths and difficulties questionnaire (SDQ). Papeles Del Psicologo, 37(1), 14–26. [Google Scholar]
- Petermann, U., Petermann, F., & Schreyer, I. (2010). The German Strengths and Difficulties Questionnaire (SDQ) validity of the teacher version for preschoolers. European Journal of Psychological Assessment, 26(4), 256–262. [Google Scholar] [CrossRef]
- Rothenberger, A., Becker, A., Erhart, M., Wille, N., & Ravens-Sieberer, U. (2008). Psychometric properties of the parent strengths and difficulties questionnaire in the general population of German children and adolescents: Results of the BELLA study. European Child and Adolescent Psychiatry, 17(Suppl. 1), 99–105. [Google Scholar] [CrossRef]
- Ruby, F. J. M. (2021). Identifying preschool children’s social emotional and mental health difficulties: Validation of the Early Years Boxall Profile (EYBP). Emotional and Behavioral Difficulties, 26(4), 425–435. [Google Scholar] [CrossRef]
- Russell, G., Rodgers, L. R., & Ford, T. (2013). The strengths and difficulties questionnaire as a predictor of parent-reported diagnosis of autism spectrum disorder and attention deficit hyperactivity disorder. PLoS ONE, 8(12), e80247. [Google Scholar] [CrossRef]
- Schwab, S., Gebhardt, M., Hessels, M. G. P., & Nusser, L. (2016). Predicting a high rate of self-assessed and parent-assessed peer problems—Is it typical for students with disabilities? Research in Developmental Disabilities, 49–50, 196–204. [Google Scholar] [CrossRef]
- Sheel, H., Suárez, L., & Marsh, N. V. (2025). The factor structure of the Strengths and Difficulties Questionnaire (SDQ) in India. Journal of Psychoeducational Assessment, 43(3), 296–309. [Google Scholar] [CrossRef]
- Smid, S. C., Hox, J. J., Heiervang, E. R., Stormark, K. M., Hysing, M., & Bøe, T. (2020). Measurement equivalence and convergent validity of a Mental Health Rating Scale. Assessment, 27(8), 1901–1913. [Google Scholar] [CrossRef]
- Smith, J. (2015). Parent-professional collaboration when a child presents with potential shunt malfunction. Nursing Children and Young People, 27(1), 22–27. [Google Scholar] [CrossRef]
- Sorsa, J., Fontell, T., Laajasalo, T., & Aronen, E. T. (2019). Eyberg Child Behavior Inventory (ECBI): Normative data, psychometric properties, and associations with socioeconomic status in Finnish children. Scandinavian Journal of Psychology, 60(5), 430–439. [Google Scholar] [CrossRef]
- Spang, K. S., Thorup, A. A. E., Ellersgaard, D., Hemager, N., Christiani, C., Burton, B. K., Gantriis, D., Greve, A., Gregersen, M., Mors, O., Nordentoft, M., Jepsen, J. R. M., Obel, C., & Plessen, K. J. (2022). The Strengths and Difficulties Questionnaire is of clinical significance regarding emotional and behavioral problems in 7-year-old children with familial risk of schizophrenia or bipolar disorder and population-based controls the Danish High Risk and Resilience Study–VIA 7; A population-based cohort study. Frontiers in Psychiatry, 13, 861219. [Google Scholar] [CrossRef]
- Speyer, L. G., Auyeung, B., & Murray, A. L. (2023). Longitudinal invariance of the Strengths and Difficulties Questionnaire across ages 4 to 16 in the ALSPAC sample. Assessment, 30(6), 1884–1894. [Google Scholar] [CrossRef] [PubMed]
- Statistical Office of the Slovak Republic. (2021). Publication compiled based on the results of the 2021 Population and Housing Census. Available online: https://www.scitanie.sk/publikacia-zostavena-na-zaklade-vysledkov-sodb2021 (accessed on 15 May 2025).
- Tabachnick, B. G., & Fidell, L. (2019). Using multivariate statistics (7th ed.). Pearson. [Google Scholar]
- Turi, E., Tóth, I., & Gervai, J. (2011). A Képességek és Nehézségek Kérdőív (SDQ-Magy) további vizsgálata nem-klinikai mintán, fiatal serdülők körében [Further examination of the Strengths and Difficulties Questionnaire (SDQ-Magy) in a community sample of young adolescents]. Psychiatria Hungarica, 26(6), 415–426. [Google Scholar] [PubMed]
- Yu, J., Sun, S., & Cheah, C. S. L. (2016). Multitrait–multimethod analysis of the Strengths and Difficulties Questionnaire in young Asian American children. Assessment, 23(5), 603–613. [Google Scholar] [CrossRef] [PubMed]
- Yu, W., Abbey, C., Qian, Y., Wang, H., Rozelle, S., & Singh, M. K. (2022). Behavioral strengths and difficulties and their associations with academic performance in math among rural youth in China. Healthcare, 10(9), 1642. [Google Scholar] [CrossRef]
Disclaimer/Publisher’s Note: The statements, opinions and data contained in all publications are solely those of the individual author(s) and contributor(s) and not of MDPI and/or the editor(s). MDPI and/or the editor(s) disclaim responsibility for any injury to people or property resulting from any ideas, methods, instructions or products referred to in the content. |
© 2025 by the authors. Licensee MDPI, Basel, Switzerland. This article is an open access article distributed under the terms and conditions of the Creative Commons Attribution (CC BY) license (https://creativecommons.org/licenses/by/4.0/).