1. Introduction
Soft and future skills are vital for graduates (
Ehlers, 2021;
OECD, 2018). However, many students underestimate their importance and believe that domain competencies are sufficient
Succi and Canovi (
2020). Students who recognize the importance of soft skills achieve higher salaries, whereas graduates with lower wages focus primarily on hard skills
Lamberti et al. (
2023). Additionally, the authors of
Gnecco et al. (
2024) predict that after COVID-19, changes in working conditions will further increase the demand for soft skills of employees. Higher education institutions (HEIs) need not only to provide students with appropriate domain competencies, but also to help them develop inter-domain and interpersonal skills. Therefore, HEIs have to modify the teaching methodologies accordingly. Many approaches have been proposed to address the mentioned demands. Most of them are based on active learning, problem solving, and group-work methods (
Chen et al., 2021;
Estrada-Molina, 2022;
Van Den Beemt et al., 2020;
Whewell et al., 2022).
Active learning and problem-based methods are easily applicable in an educational institution, but these methods alone are not enough to increase cooperation and communication skills, such as empathy. Moreover, real-life working environment, IT specialists often have to cooperate with non-technical people
Frezza et al. (
2019). Unfortunately, incorporating multidisciplinary and intercultural aspects into classroom teaching is not straightforward. In this paper, we present an approach to teaching soft and future skills in an international cooperation project between HEIs and analyse its effect on students’ self-assessed competencies with regard to communication, cooperation, flexibility, digital skills, creativity, critical thinking, willingness to learn, and self-reflection. In the project, during a 10-day intensive course, students worked in interdisciplinary teams with other students from different (academic) cultures, different languages, and different backgrounds. The result of increased soft and future skills in the participating students is measured using the KYSS questionnaire (
Chaoui et al., 2022;
De Bruyne et al., 2023). The development of KYSS (see
Section 4) focused on correspondence between survey questions, language, and its understanding by participants, as well as on measuring soft and social skills. This paper assesses whether the project increases students’ future and soft skills. This can be expressed as the hypothesis that ’the results for a given category of post-tests are statistically better than those from pre-tests’. This hypothesis is assessed using the Wilcoxon one-sided test.
This paper is structured as follows: In
Section 2 we discuss the problem of soft- and future-skills in modern education. The next section is dedicated to the description of the project. Later we introduce the KYSS survey.
Section 5 and
Section 6 focus on the results and interpretation of KYSS surveys conducted during the project. At the end of the paper, we present the Conclusions.
3. Intensive Project Description
Within an Erasmus+ cooperation partnership, six European HEIs developed and implemented an intensive 10-day course to teach soft and future skills. The methodology implemented important elements of the MIMI methodology
Dowdall et al. (
2021) and developed it further. The 60 students and 10 lecturers from the six participating institutions met at the event venue in one of the HEIs. The students, all volunteers aged 19–26 and from the first and second cycles of study, were required to be proficient in English. The participants came from six different countries: Belgium, Finland, Germany, Ireland, Poland, and Portugal. The participating students, as well as the lecturers, represented different fields of study: less than half had a computer science background, and others pursued degrees in management, tourism, chemistry, and production engineering. The students were assigned to six-person teams with members from the six participating HEIs and at least three disciplines. The team had to contain a minimum of one computer science and business student, as these competencies are core to fulfill task requirements. The task of the groups was to create a prototype of an application or service related to the event theme:
Digital Entrepreneurship and the Climate. As a result, groups had to prepare a working prototype focused on real-life local needs, create a business potential assessment, and present the idea to internal and external audiences. The organizers assigned a staff member to each group as their mentor. The role of the mentor was to support the team and assume the role of an advisor. In addition to providing technical support, the mentors were responsible for overseeing and resolving any ethical issues that arose within their teams. This included continuously monitoring work ethics, such as the equitable distribution of duties and the proper use of intellectual property, as well as addressing group dynamics like bullying or other inappropriate behaviors. Teams should have been self-driven, and all decisions must have been made by student members. The intensive course was divided into three stages; each stage ended with a group presentation. The first two days were devoted to team building and brainstorming. On the second day, the teams presented their ideas as a pitch speech. The second part was dedicated to the development of the idea. The teams worked on prototypes and development of the application’s content and on business elements, such as stakeholders, user personas, cost assessments, Business Model Canvas, and SWOT analysis. On the fifth day of the event, the groups presented their proposition again. During the last stage, the teams polished their business ideas and prototypes. On the ninth day of the project, more formal presentations were made with invited external partners who also provided independent feedback to the teams. In all presentations during the project, every member of the team had to take an active role. The soft and future skills were self-assessed by the students using the KYSS questionnaire
Chaoui et al. (
2022).
The students filled out the questionnaire on the first and last days of the intensive course. Thus, the pre-test is filled out before participants take any real activity in the project. The post-test is gathered after the last activity in the project. The students are asked to fill out tests electronically while still in the common area, for example, in the auditorium, before the event starts or after the final presentations. An important difference from the MIMI methodology
Dowdall et al. (
2021) was that we did not conduct lectures or workshops during the intensive course. However, short, motivating, interactive sessions, similar to TED talks, aligned the students’ knowledge on project goals, teamwork, software and service design, as well as business potential assessment. These talks allowed participating students to get acquainted with staff members who could help them later with specific problems in the course of the project.
The course was not set up as a contest; there was no winning team. It was explicitly suggested that teams help each other if possible. At the beginning of each day, the assigned mentor met with the team to conduct an assessment of the tasks completed, plan the day and the next days, and discuss the idea developed by the team. Often, mentors met with their teams several times a day. The frequency and length of the meetings depended on the stage of the project and the needs of the team. In the first days, the mentor helped moderate brainstorming or improve the focus on idea development. Later, the mentor coached the team to complete the tasks that allowed the team to achieve its goals.
4. KYSS Survey
The design and evaluation of didactic methodologies require a qualitative and quantitative evaluation of the results
McKenney and Reeves (
2018). In our project, we need a measurement tool that can help measure the impact on the soft and future skills of the participants. The measurement of future and soft skills is not easy or obvious. The KYSS survey
Chaoui et al. (
2022) fits our needs. Therefore, we have decided to use this approach. The method allows for measuring the level of soft and future skills in selected categories.
KYSS comes from
Kickstart Your Soft Skills and was developed within the European Social Fund project under that name. The approach divides soft skills into four domains: interaction, problem solving, information processing, and personal. For each domain, some categories were defined, such as communication, cooperation, critical thinking, etc. The creators of the KYSS survey developed a self-report questionnaire to estimate soft and future skills. It can be used as a self-assessment tool for everyone. The questionnaire results in a score that is recorded and described in an individual feedback report. In addition to the scores, this feedback report also contains score-based feedback for each of the recorded skills. In the process, they used standardization and validation procedures to estimate the importance of responses and correspondence to the measured skills (
Chaoui et al., 2022;
De Bruyne et al., 2023). The KYSS survey was prepared in Dutch. At first, the creators developed a vocabulary that corresponded with selected soft skills. On this basis they created a set of questions and measured if a survey participant understood the question in a proper way. The work with local government institutions for unemployed people, as well as VDAB, one of the biggest recruitment companies in Belgium, allowed us to build an adequate and verified questionnaire. All questions were connected to selected soft skills, and the correlation was assessed in a real-life environment. In our case, we used the translation of the original Dutch questions into English.
KYSS allows respondents to self-assess these skill categories using a survey questionnaire. In this project, we have decided to measure the effects using forty-six questions divided into eight categories: communication, cooperation, digital skills, creativity, flexibility, critical thinking, willingness to learn, and self-reflection.
The KYSS survey can be taken as an online survey. We asked all students to do the survey twice, at the beginning and at the end of the 10-day intensive course. We applied statistical tests to the data to determine if there was a significant statistical difference between pre- and post-tests. Differences would suggest that there is an effect on participants’ skills. Moreover, we were interested to see if the post-test results were better than the pre-test ones. Therefore, we used a one-sided statistical test to evaluate whether improvement in the selected skills could be observed.
5. Results
During the project, we assessed the project’s effects in two ways. We asked participants to fill out a simple questionnaire to map the students’ reception of the project. In addition, we used the KYSS method to measure the impact on students’ soft and future skills.
In the basic questionnaire, participants generally expressed positive reactions to the event (
Table 1). The answers show only a general assessment of the method given by the participants. This cannot be used as a real verification. Nevertheless, the positive feedback shows that there is some interest and acceptance for the approach.
As we can see, the students evaluated the learning experience and learning gains very positively. As mentioned above, the results of this simple questionnaire give only general information. In order to make a real assessment, we use a very different and more sophisticated tool. The KYSS survey provides a deeper and more reliable understanding of the effects of the project on the soft and future skills of the participants.
During the event, we measured students’ soft and future skills using KYSS surveys. One survey was completed on the first day of the project, and the other on the last day. Both answers were connected, and we were able to pair up the pre- and post-test answers. Students answered the questions on a five-level Likert scale: ‘Strongly agree’, ‘Agree’, ‘Neither agree nor disagree’, ‘Disagree’, ‘Strongly disagree’. We assign values of 2, 1, 0, −1, and −2 for each answer. This allows us to apply statistical tests and test the hypothesis of whether the project improves the students’ skills.
We could have analyzed the effect on the basis of individual questions, but we decided to work on categories, as the questions individually are less informative than when combined. In order to assess the effect on a given category, we have summed up all the answers of a given student. We can say that the students obtained some points for answers in each of the categories for the pre- and post-tests. For each category, we have the null hypothesis
that both sets of results for a given category have the same statistics. Additionally, we believe that the results of the post-test are better than those of the pre-test. We test the hypothesis
that the results for a given category of post-tests are statistically better than those from pre-tests. In all categories the results of post-tests have a higher mean and median than in the pre-test, but it is not enough to validate the increase in skills. Therefore, we use a statistical test to verify our hypothesis. One-sided rank statistical tests are much more appropriate for hypothesis testing in similar scientific problems (
Blair & Higgins, 1980;
Conover, 1999). In this research, we use the Wilcoxon one-sided test (
Cureton, 1967;
Wilcoxon, 1945), implemented in the Python scipy library
Virtanen et al. (
2020). For all tests, we used a significance level
equal to
, which means that if the
p-value obtained for a given statistical test is lower than the significance level, we can reject the null hypothesis in favor of hypothesis
. On the other hand, if the
p-value is higher than the significance level, we have no reason to reject the null hypothesis
.
In the following subsections, the results are presented for each category independently.
5.1. Category: Communication
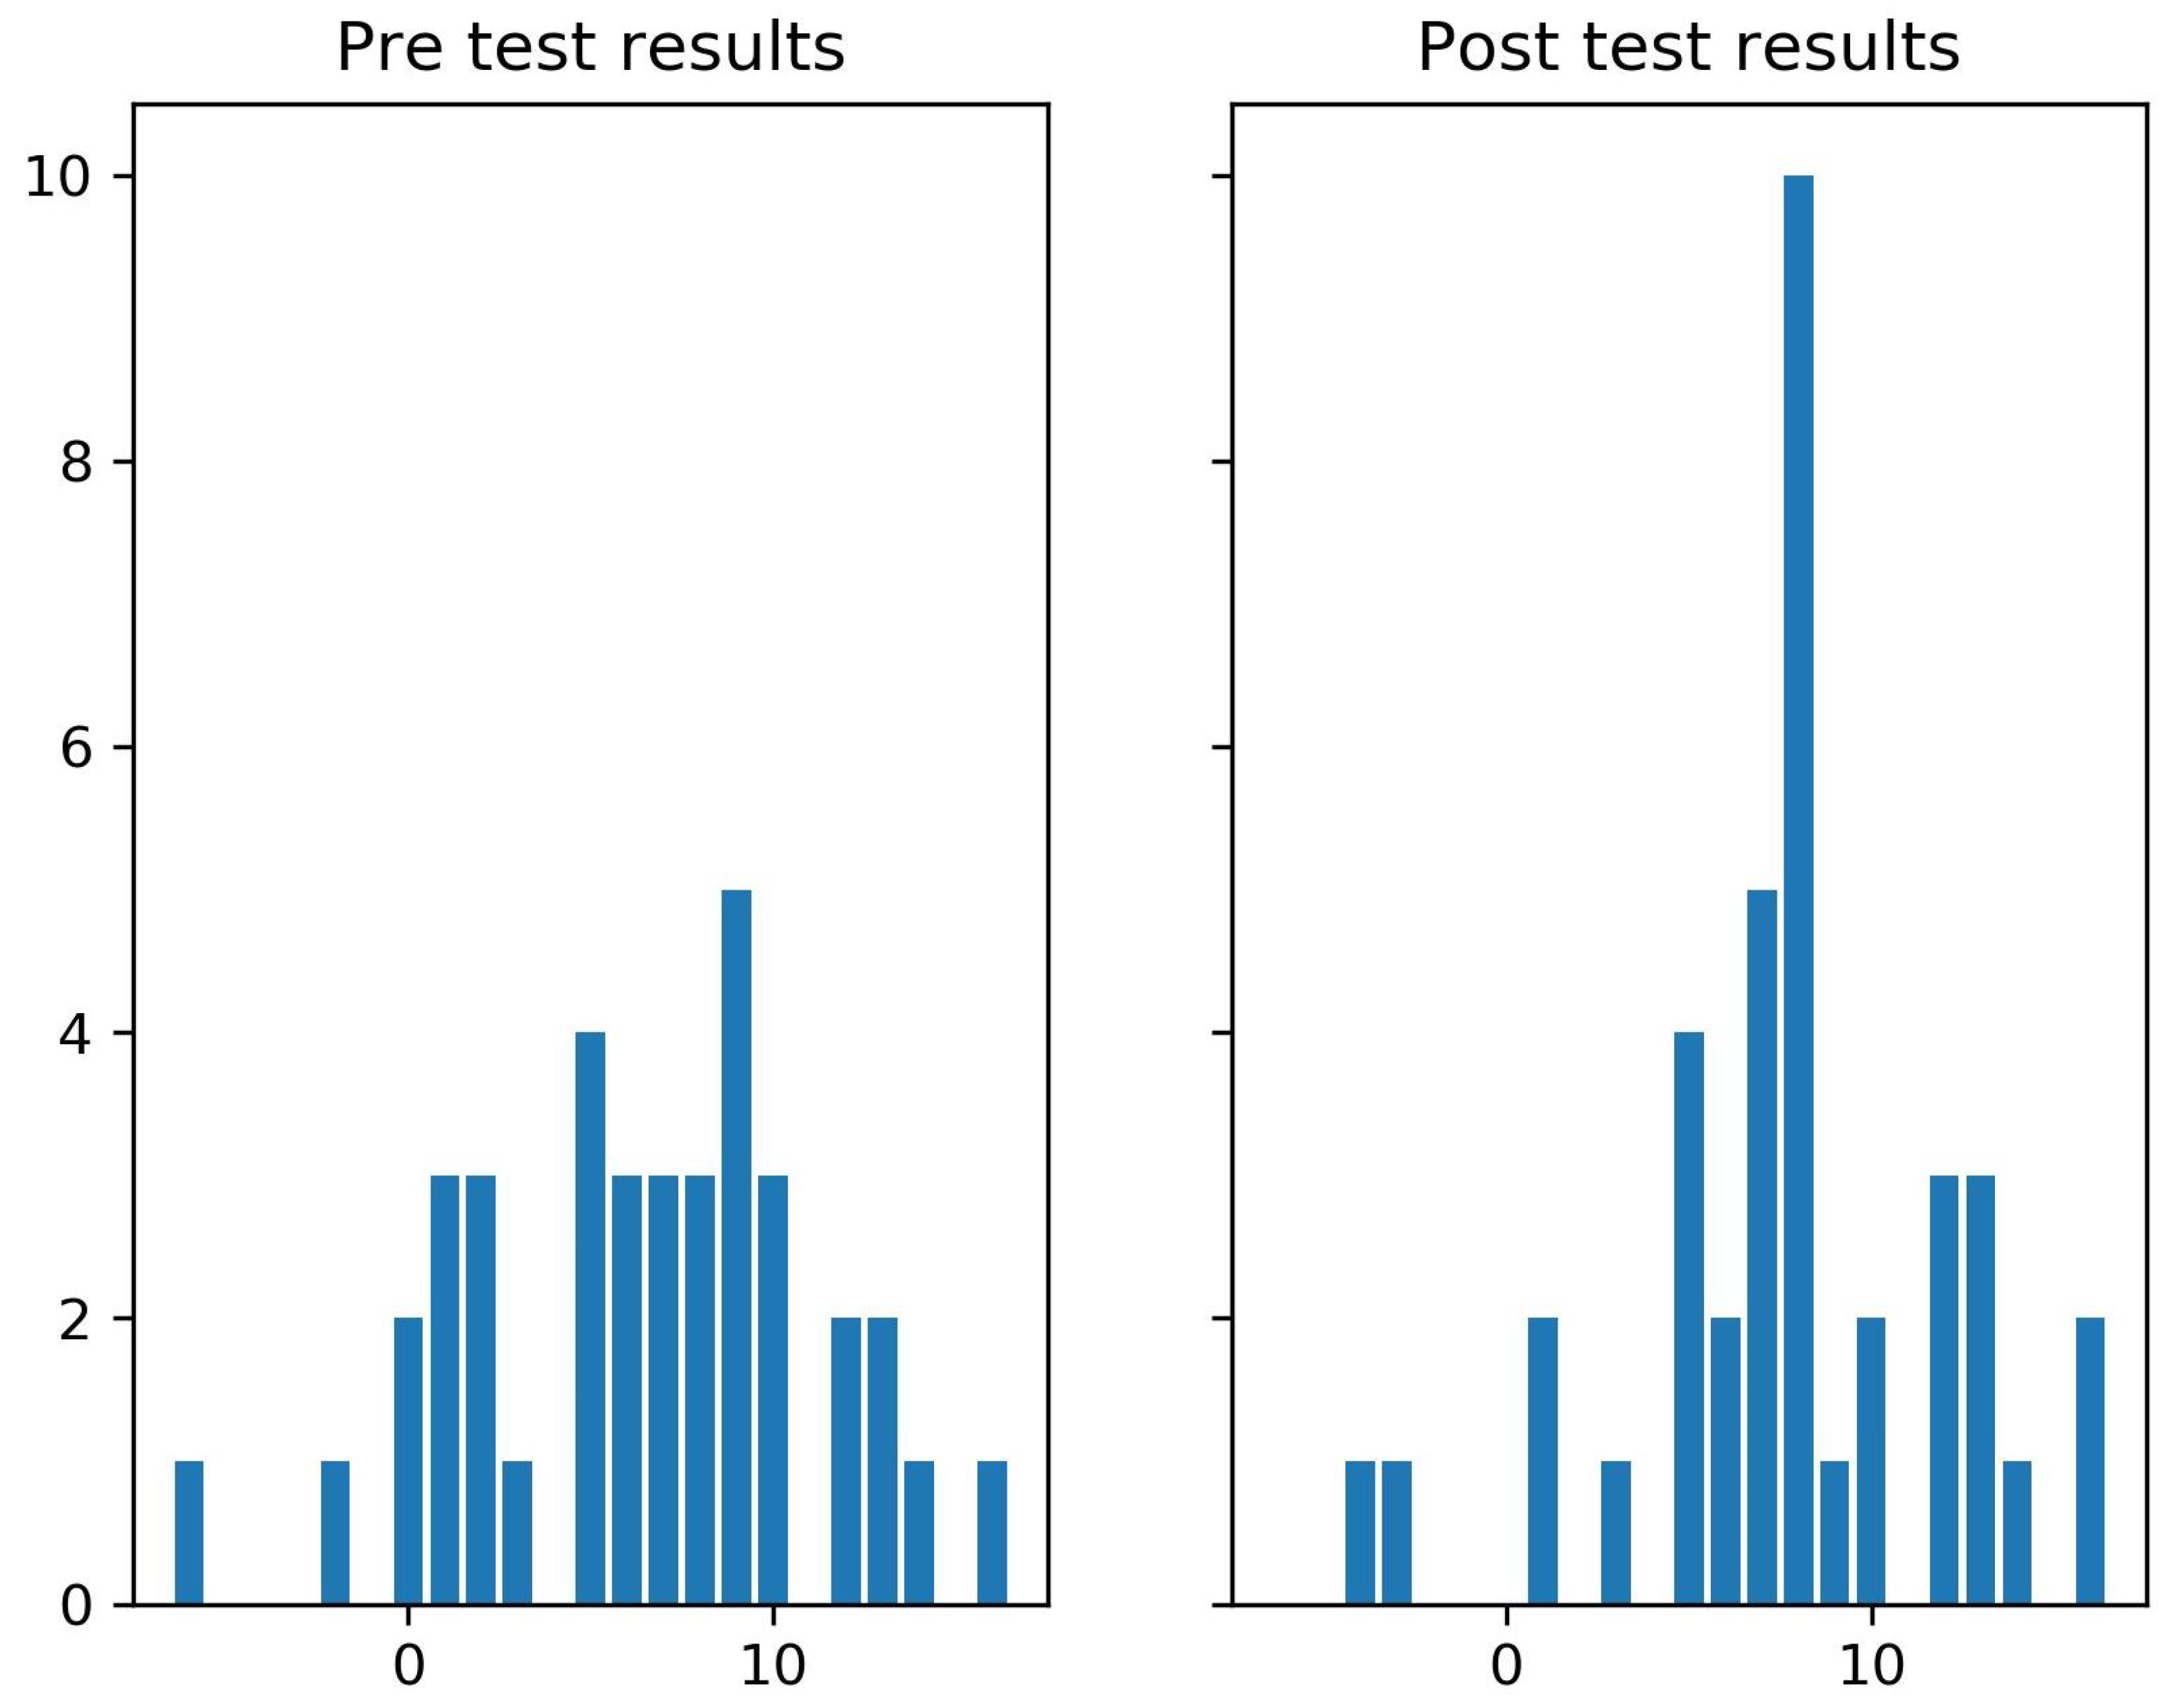
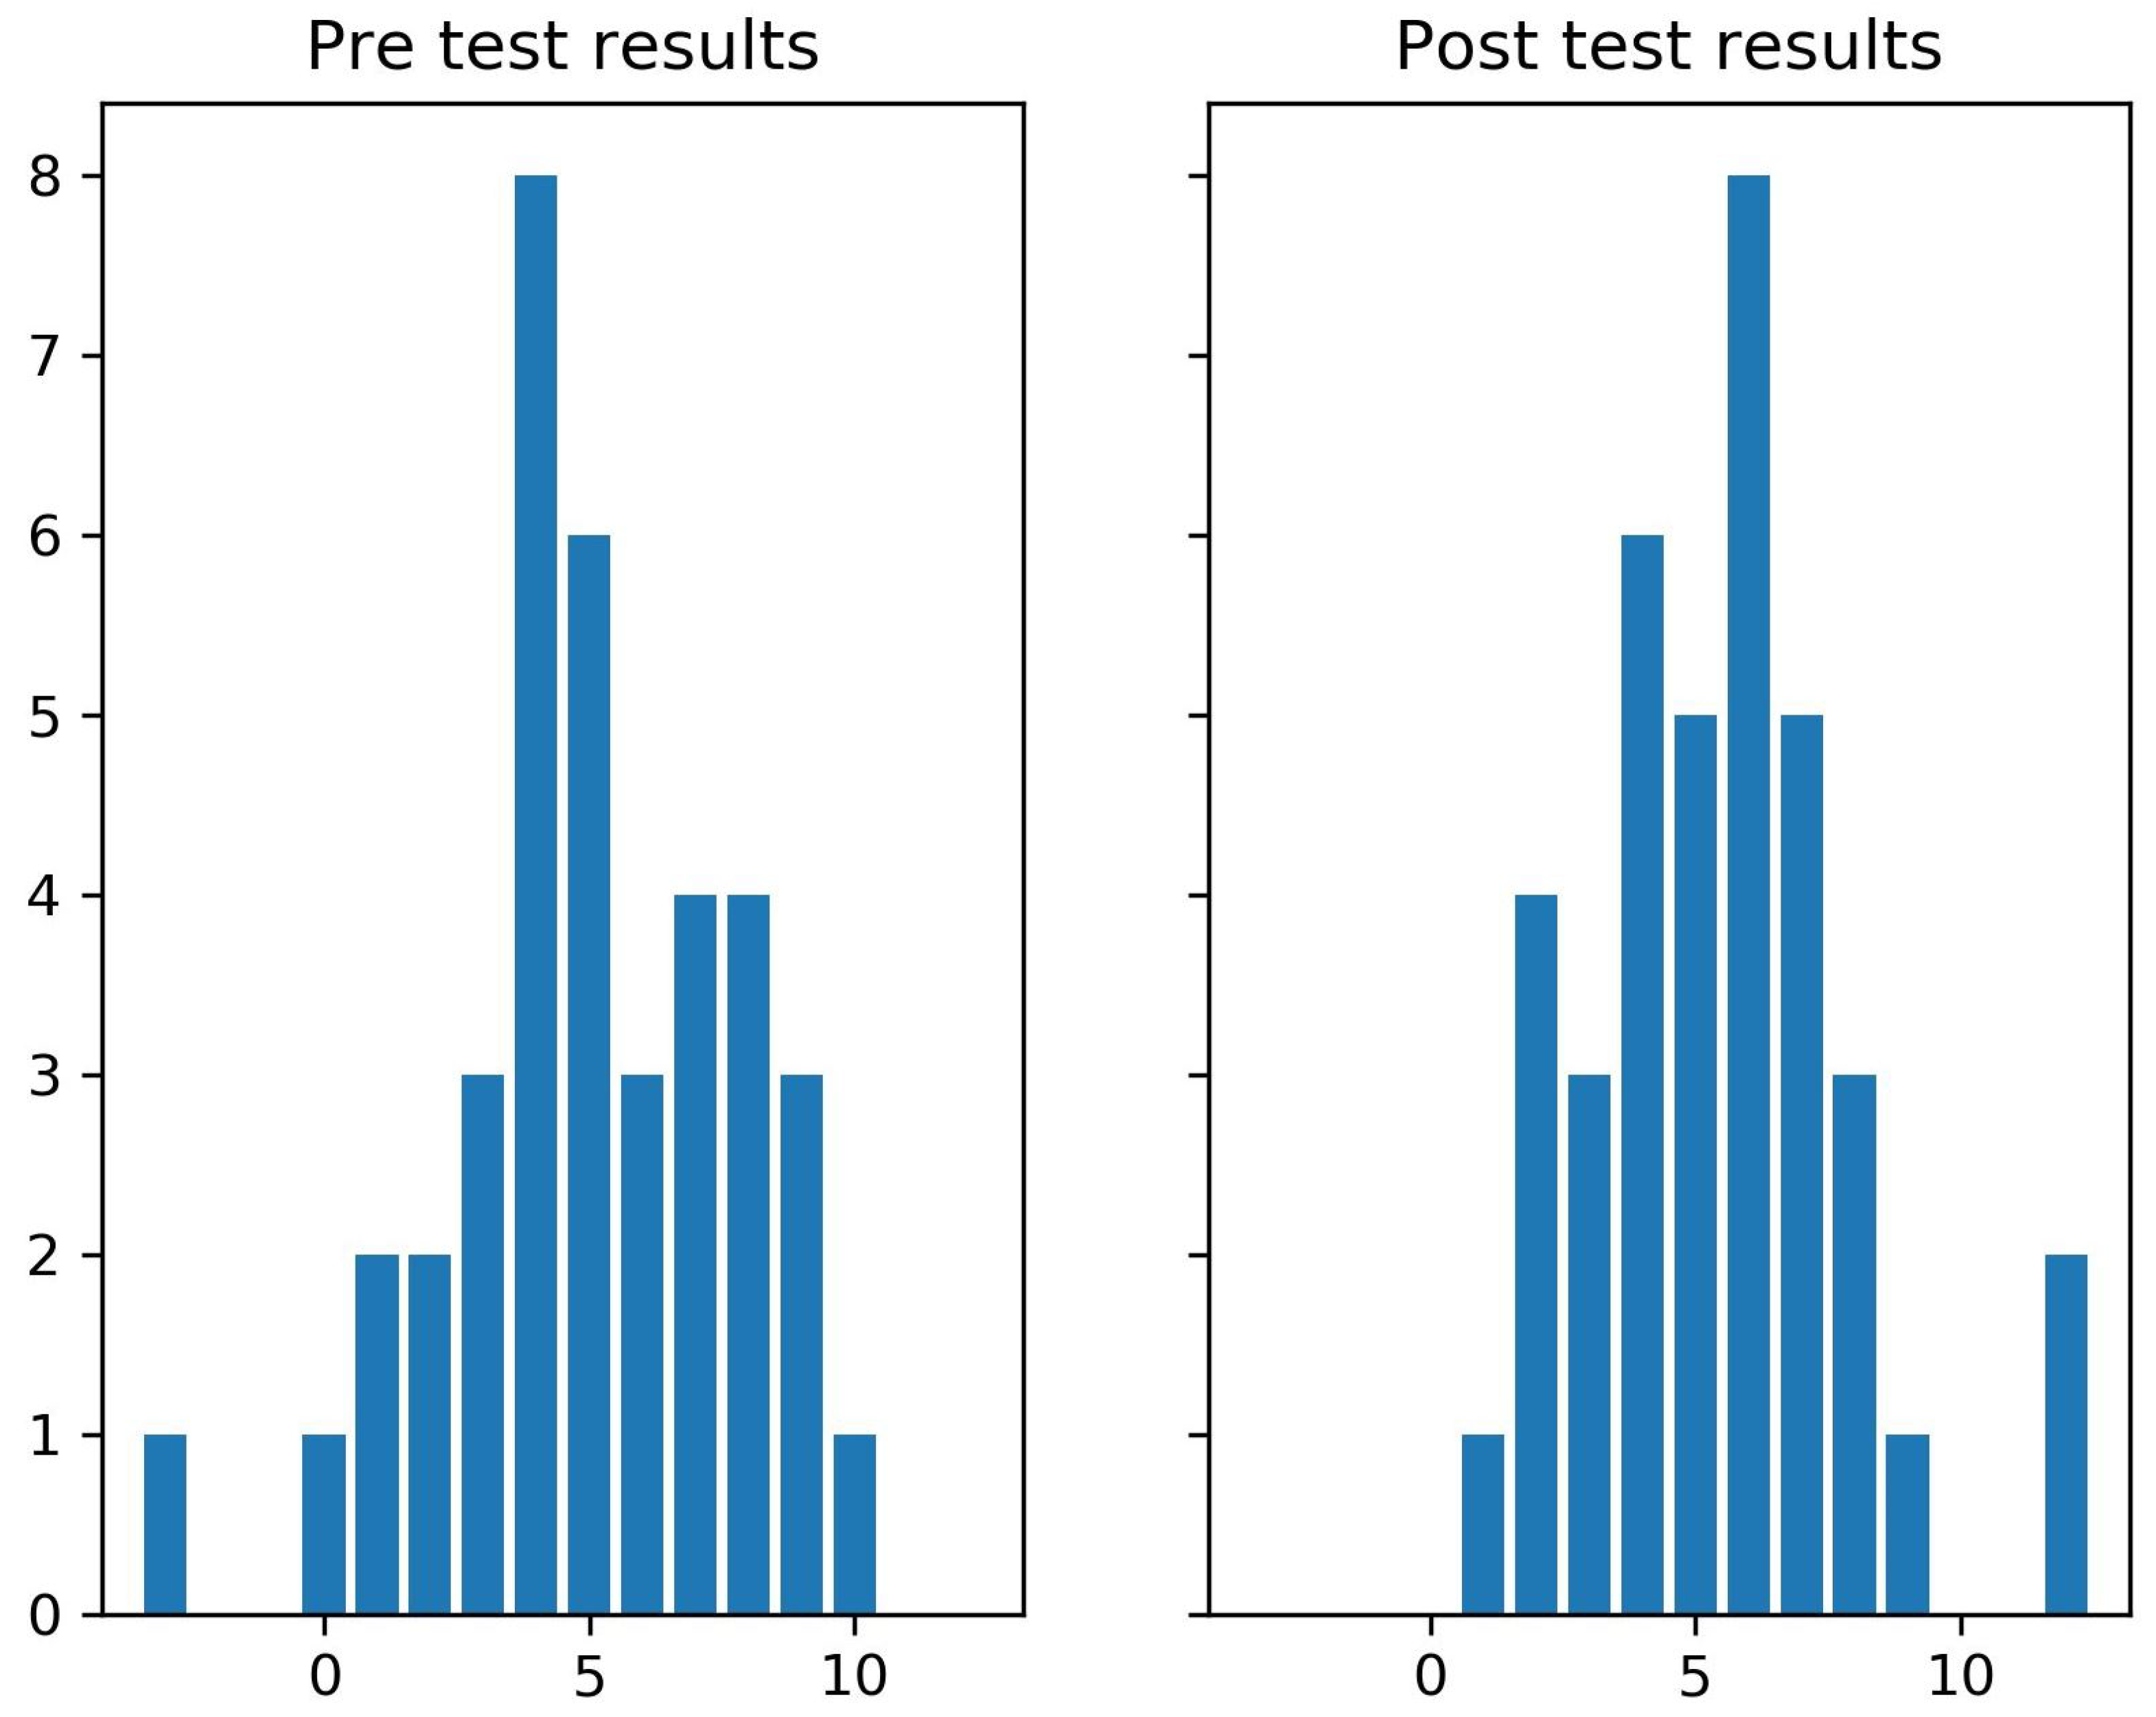
This category contains eight questions. All answers for a student were summarized and paired. A histogram of the results of the pre- and post-surveys is presented in
Figure 1. The histogram presents the sum of scores for all questions in the category. Each answer is assigned an integer value from −2 to 2. Each bar represents how many participants gave answers for the category communication with a given sum of scores. The parameters of the distribution of the results are shown in
Table 2.
Using the Wilcoxon one-sided test, we obtained a p-value equal to . As this is lower than , we can reject the hypothesis of . Therefore, we accept the hypothesis that the results of the post-event test are statistically better than those obtained by a student in the pre-test.
5.2. Category: Cooperation
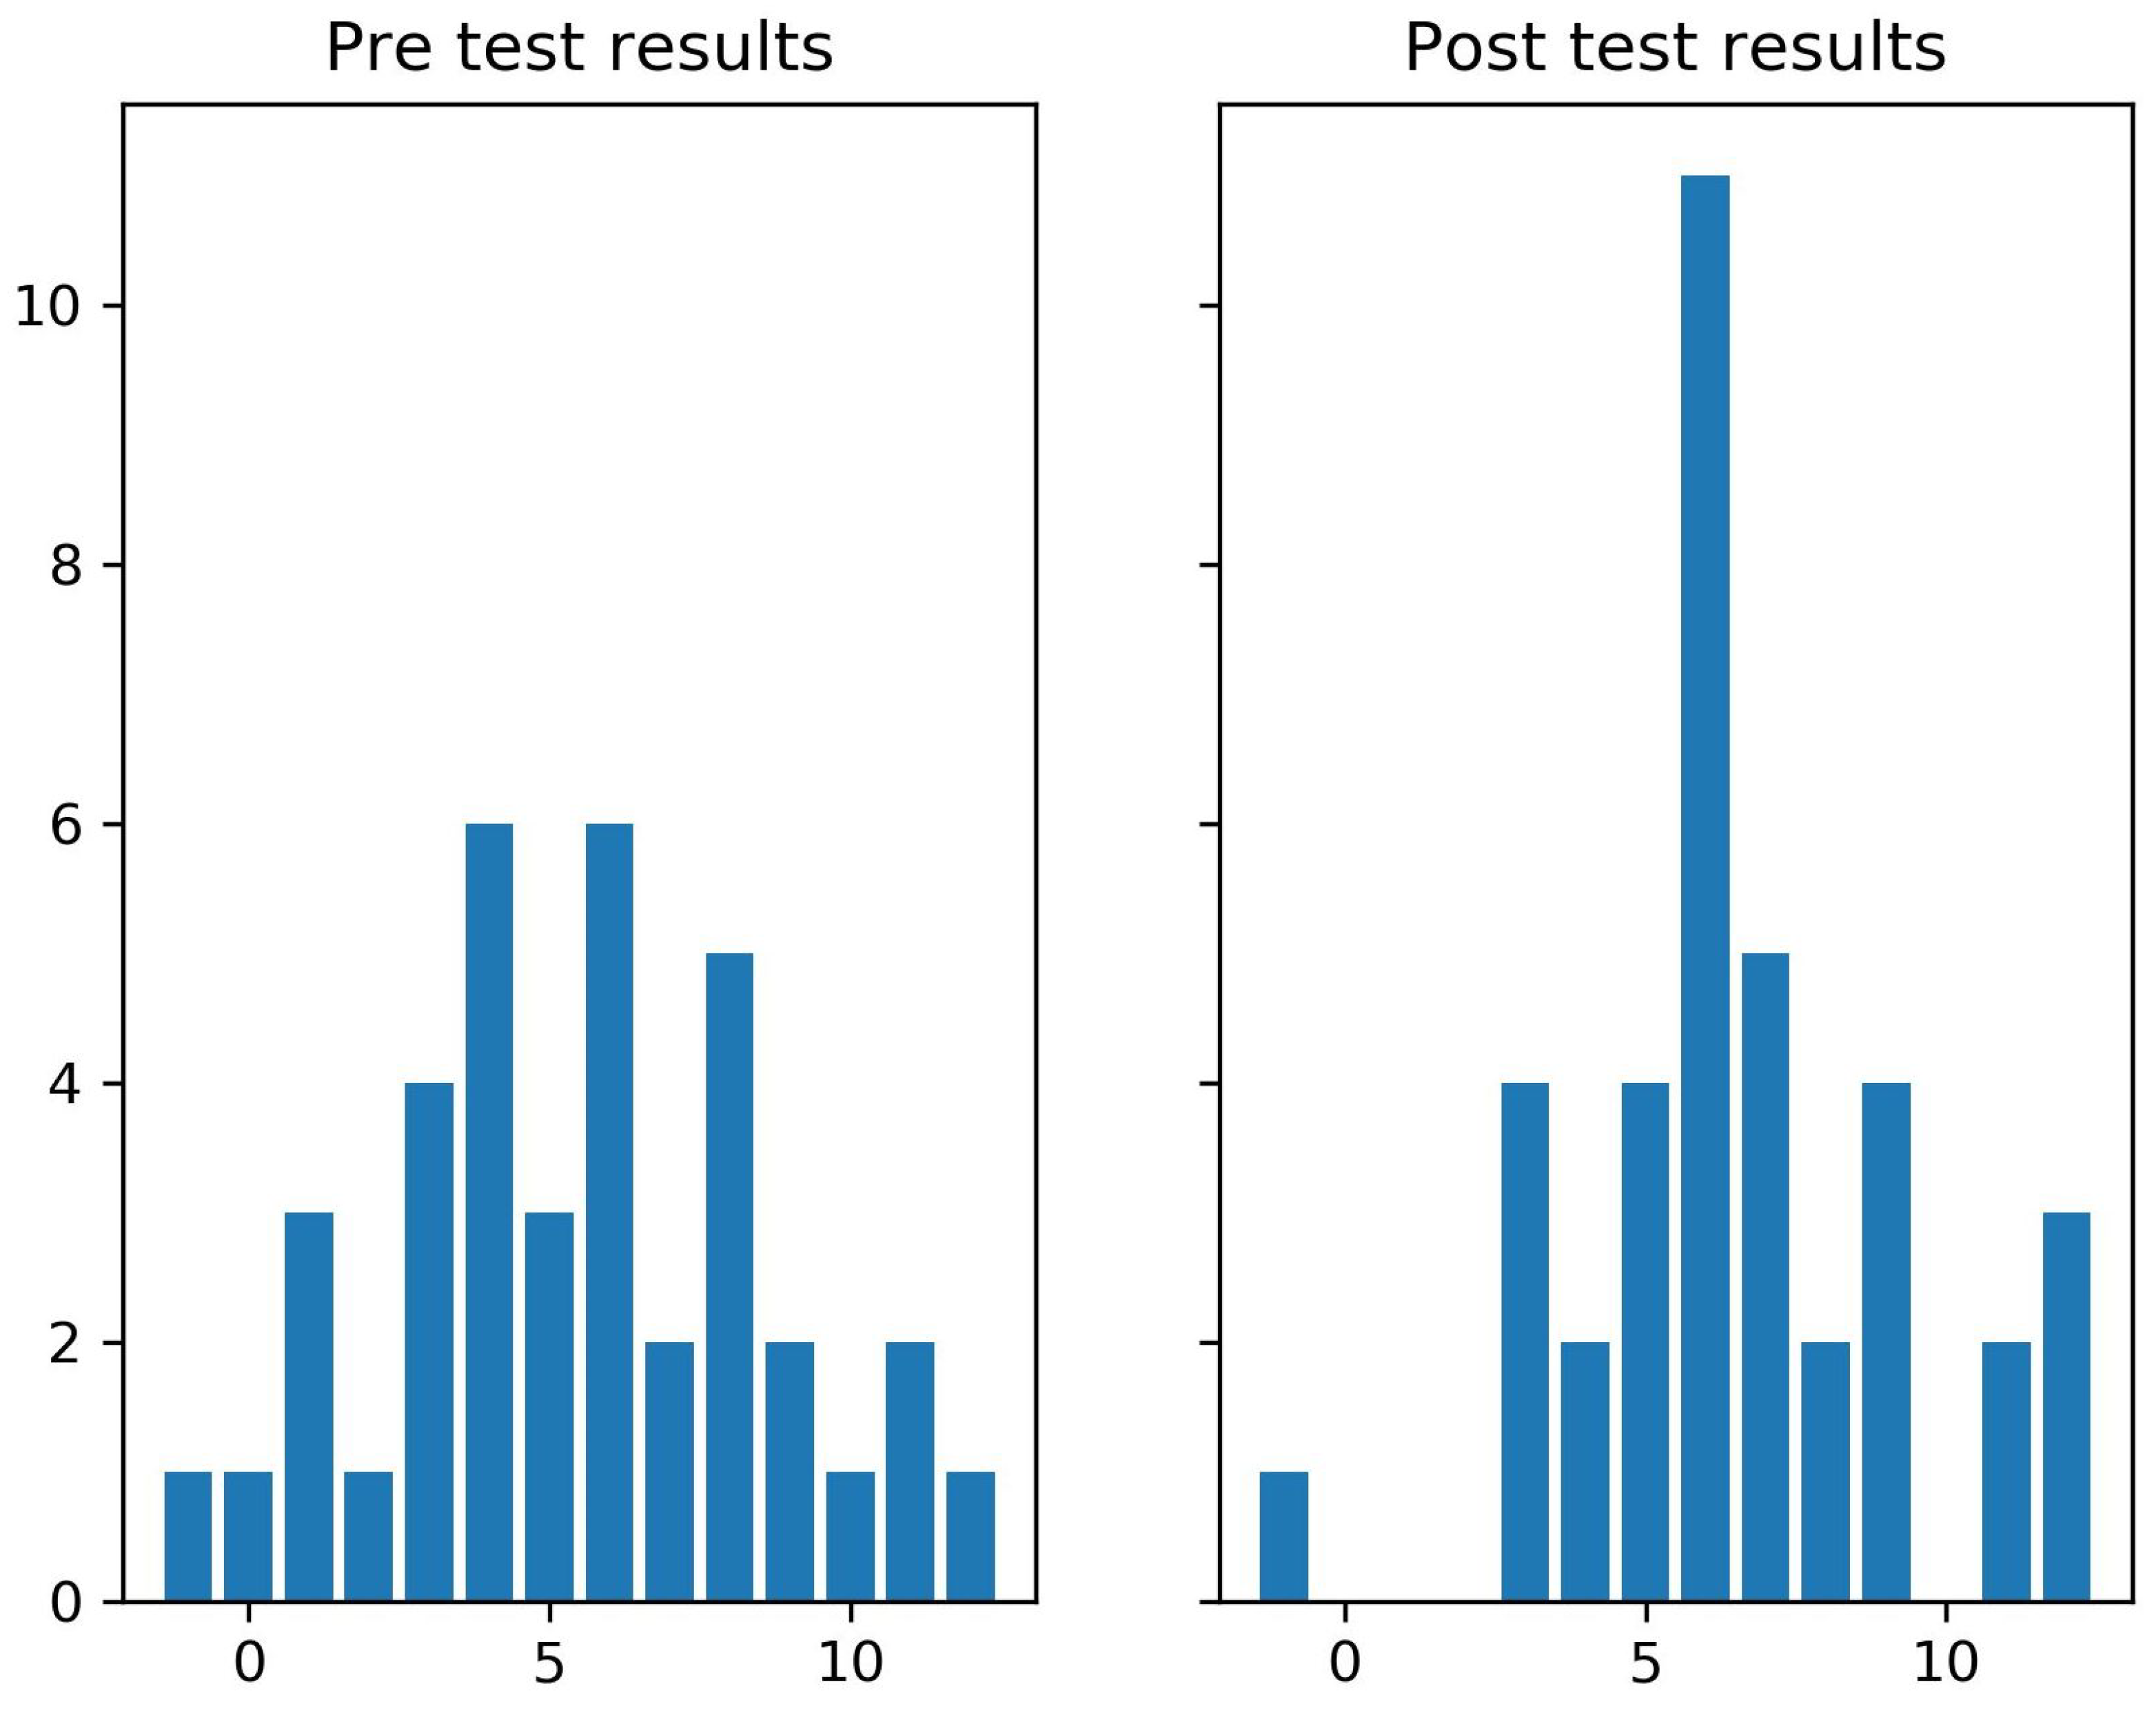
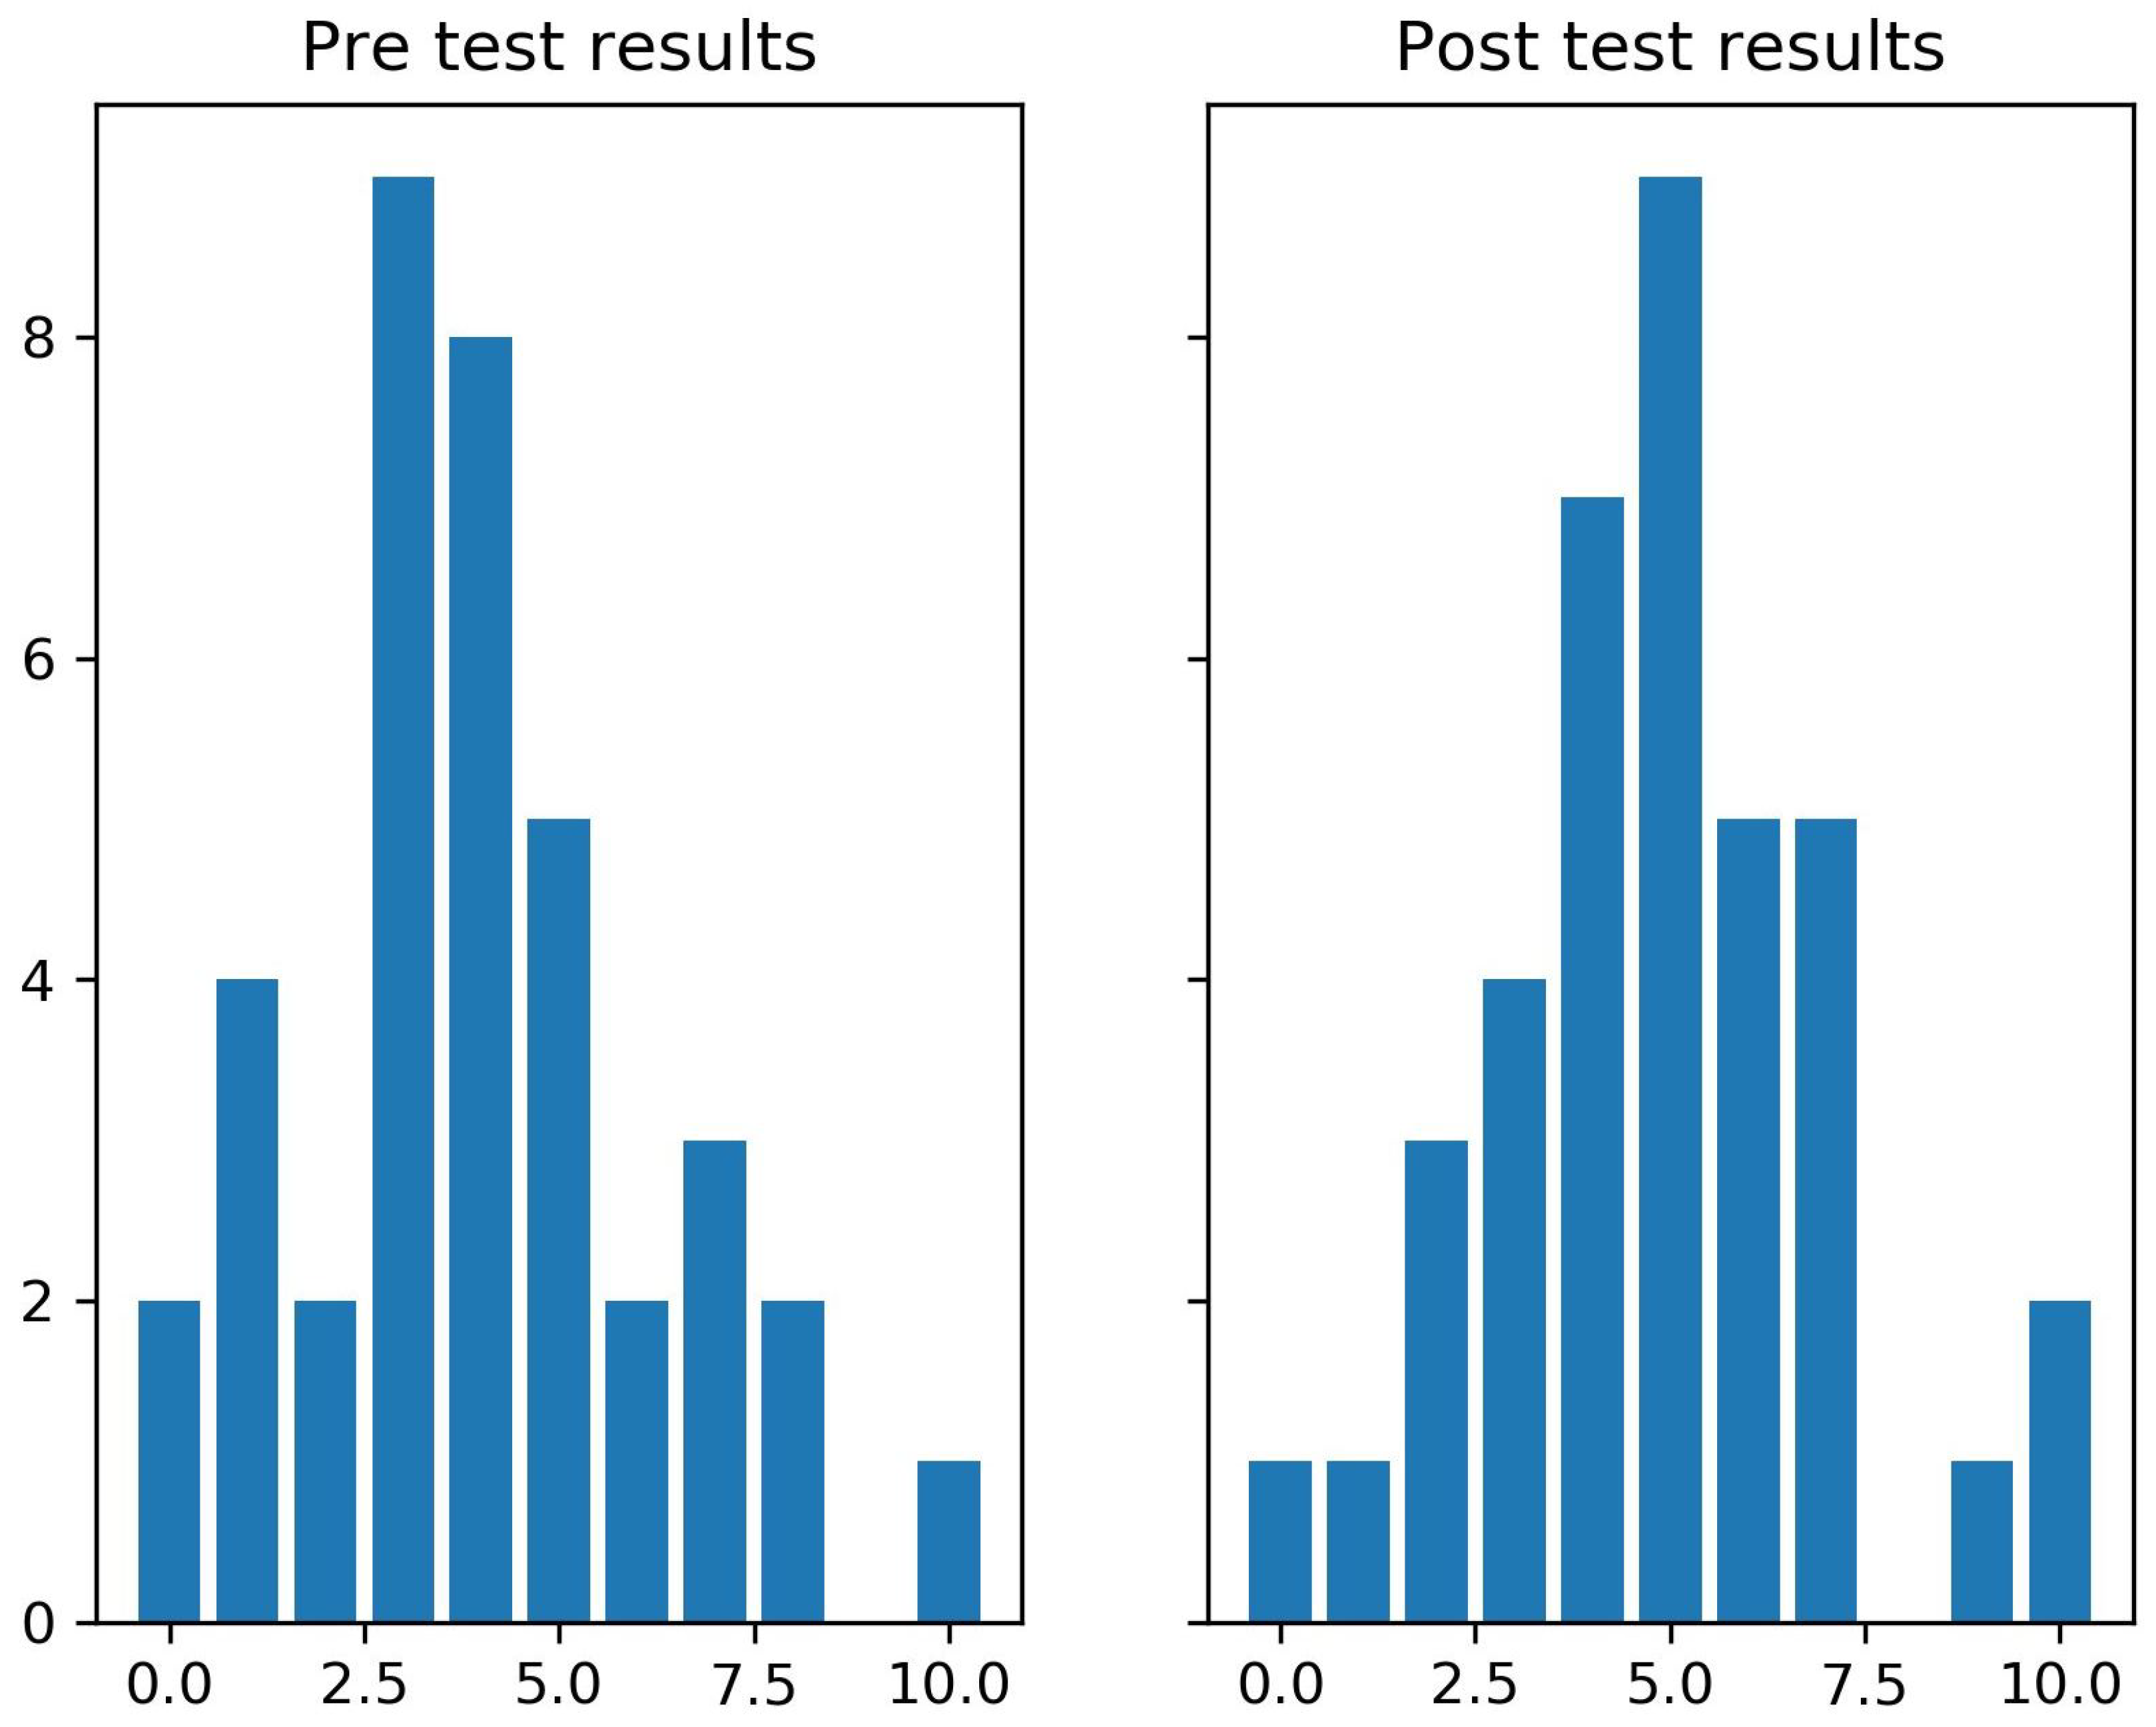
The category cooperation contains six questions; we proceed in the same way as in the previous category (see
Figure 2 and
Table 3).
The Wilcoxon test returned a p-value equal to , and as before, we could accept the hypothesis for this category.
5.3. Category: Flexibility
The Wilcoxon test returned a p-value equal to , so we could not accept the hypothesis for this category. The conclusion is that the distribution of the pre- and post-results is statistically similar and can represent the same background statistics.
5.4. Category: Digital Skills
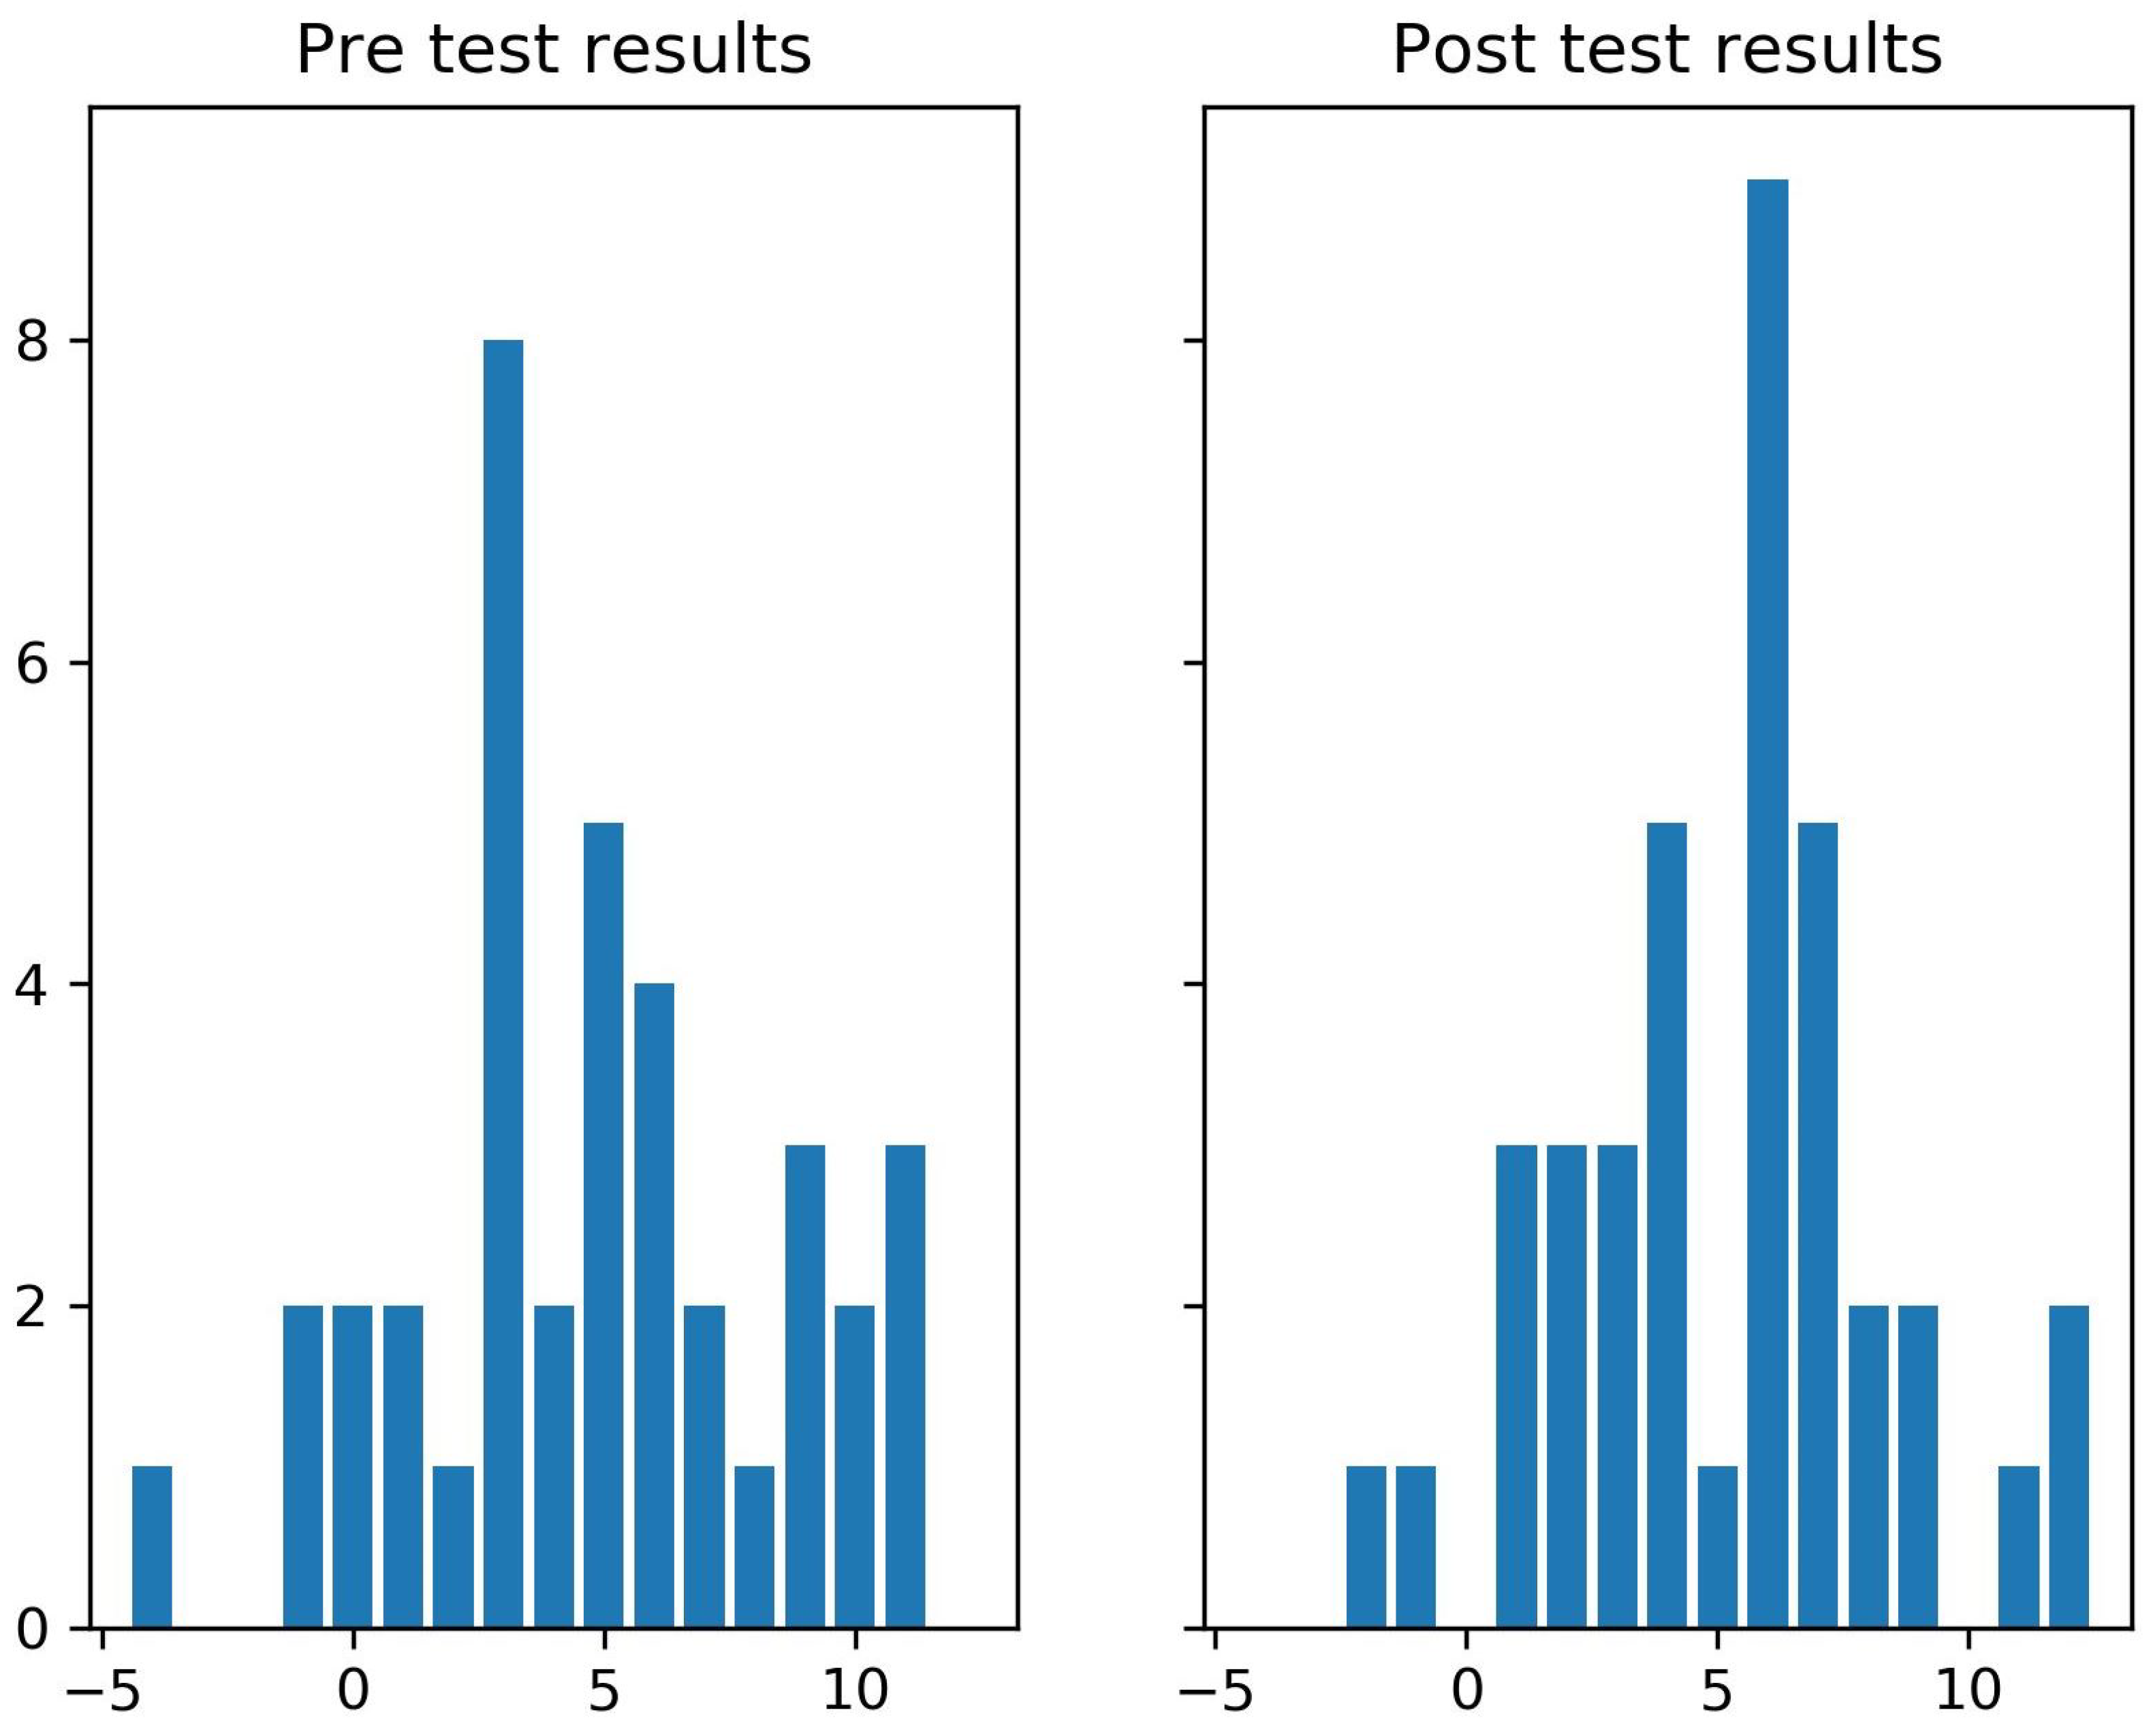
The category digital skills contains four questions (see
Figure 4 and
Table 5). The Wilcoxon test returned a
p-value equal to
, and we could accept the
hypothesis for this category.
5.5. Category: Creativity
The category creativity contains six questions; we have proceeded in the same way as in previous categories (see
Figure 5,
Table 6).
The Wilcoxon test returned a p-value equal to , so we could not accept the hypothesis for this category.
5.6. Category: Critical Thinking
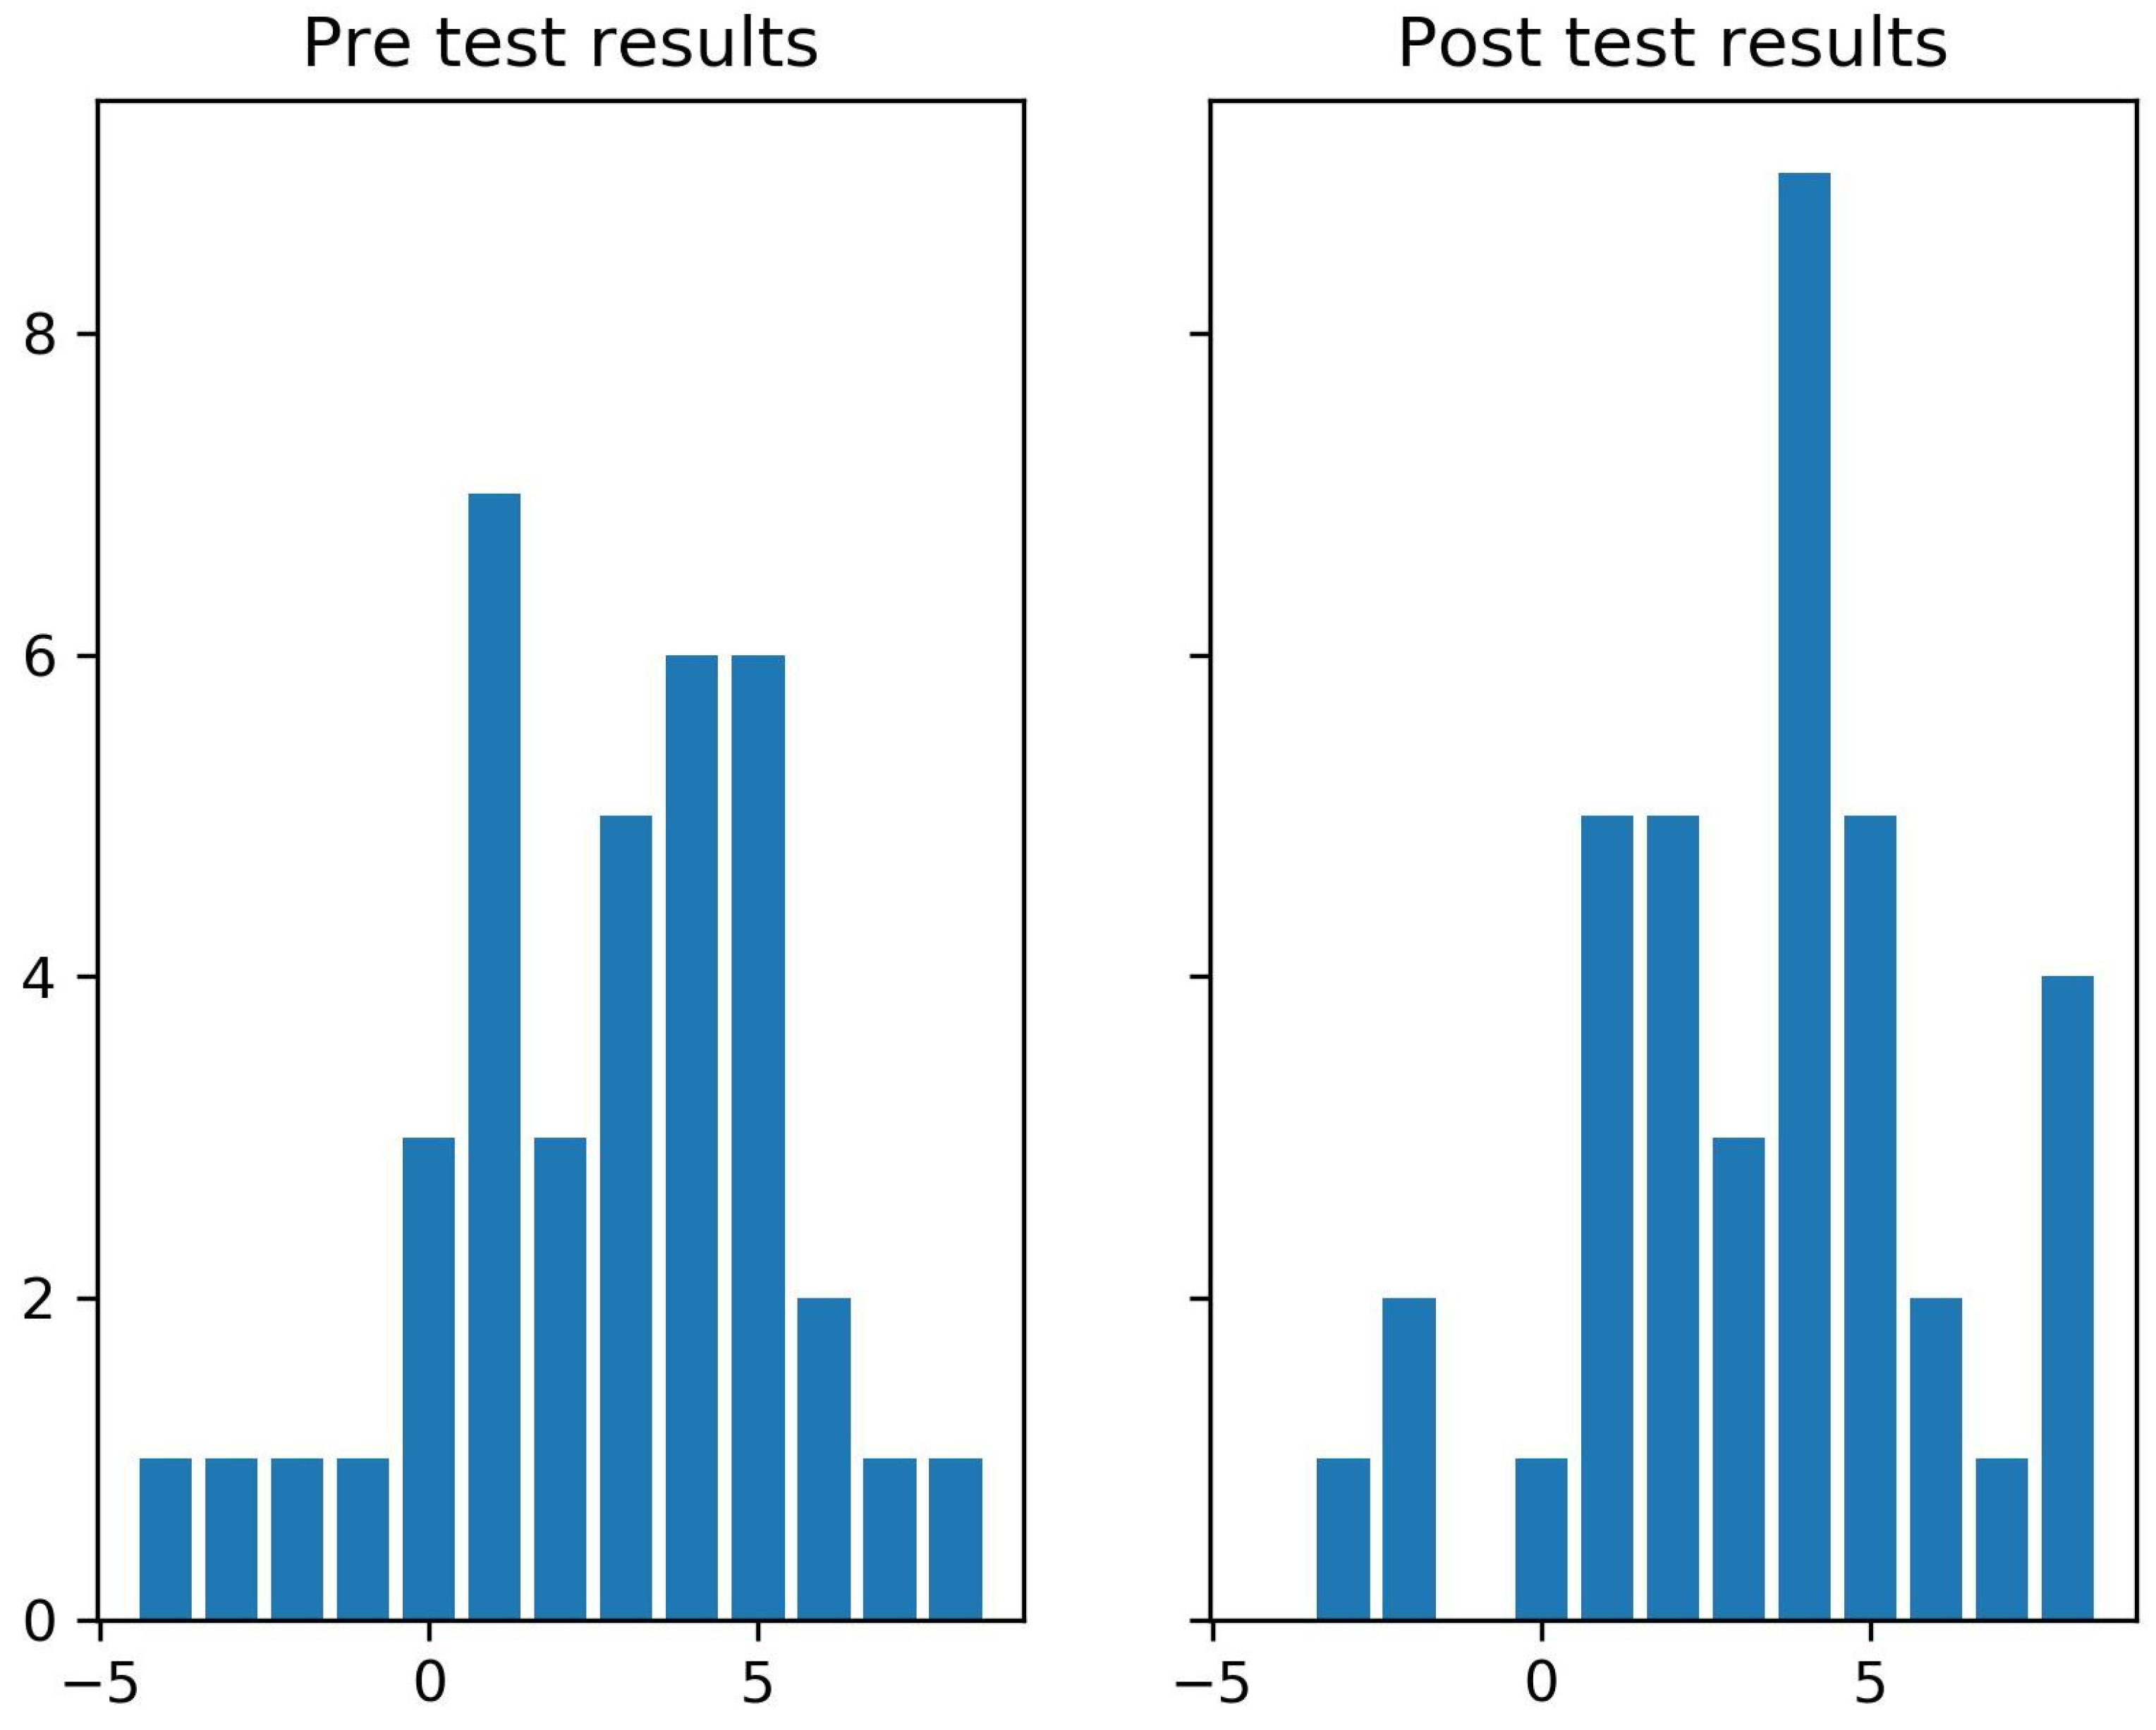
The category critical thinking contains five questions; we proceed in the same way as in the previous categories (see
Figure 6 and
Table 7).
The Wilcoxon test returned a p-value equal to , so we could not accept the hypothesis for this category. The conclusion is that the distribution of the pre- and post-results is similar.
5.7. Category: Willingness to Learn
The category willingness to learn contains six questions (see
Figure 7 and
Table 8).
The Wilcoxon test returned a p-value equal to , so we could not accept the hypothesis for this category. The conclusion is that the distribution of the pre- and post-results is statistically statistically similar.
5.8. Category: Self-Reflection
The category self-reflection contains five questions (see
Figure 8,
Table 9).
The Wilcoxon test returned a p-value equal to , so we could accept the hypothesis for this category.
7. Conclusions
The method used in the project was expected to have a positive impact on the participants. Moreover, the event we describe is the second event of this type organized together. Staff members who have worked with students on the previous event observed a positive impact on students’ soft and future skills. The observations in the following academic year suggest a higher increase in skills in the project participants when compared with the other students in the degree program. This time during the event, we have incorporated KYSS surveys as a measurement tool. The results support the expectations and previous observations. Not all aspects measured with KYSS show similar growth. The different effects of the project on different skill categories were expected. Moreover, the KYSS gives a more reliable assessment of the project’s effects than a simple direct questionnaire. Based on the presented results, the consortium will conduct a similar study and measure its impacts on the participants.
The effects show that software development projects can be used for multidisciplinary education. This type of team task allows for increased communication and cooperation in diverse groups. Young people are eager to use and create new solutions that use modern technologies. What is important is that this type of activity is very appreciated by non-technical students.
The results suggest that this type of solution is worth implementing not only for occasional projects but also as a regular part of student education. Naturally, each academic institution would need to adapt the described teaching method to its specific conditions and capabilities. Implementation would require changes to the curriculum and may not allow for the full realization of all benefits from the project described in this article. However, certain elements could be effectively utilized by academic staff on a daily basis. Preparing short, multi-day courses that require students to work intensively, thereby simulating real-world, high-pressure situations, appears relatively simple to implement. In many cases, it would also be possible to form interdisciplinary groups within a single university. Conversely, organizing international groups would be more challenging due to the need for student mobility and the associated higher financial costs.
The results show that intensive international and multidisciplinary projects can have a significant impact on the soft and future skills of participants. Moreover, our research provides, for the first time, objective measurements of the effects of the MIMI methodology.
