Article

Break Barriers: Motivation and Obstacles in Secondary School Teacher Education

by
Andrea Hlubučková
1,*,
Karel Tomšík, Jr.
2,
Lucie Smékalová
3,
Karel Tomšík
4 and
Kateřina Tomšíková
5
1
Department of Professional and Personal Development, Institute of Education and Counselling, Czech University of Life Sciences Prague, V Lázních 3, 15900 Prague, Czech Republic
2
Department of Statistics, Faculty of Economics and Management, Czech University of Life Sciences Prague, Kamýcká 129, 16921 Prague, Czech Republic
3
Department of Pedagogy, Institute of Education and Counselling, Czech University of Life Sciences Prague, V Lázních 3, 15900 Prague, Czech Republic
4
Department of Economics, Faculty of Economics and Management, Czech University of Life Sciences Prague, Kamýcká 129, 16921 Prague, Czech Republic
5
Business Academy and Secondary Vocational School of the General F. Fajtl, Osvoboditelů 380, 44001 Louny, Czech Republic
*
Author to whom correspondence should be addressed.
Educ. Sci. 2025, 15(10), 1363; https://doi.org/10.3390/educsci15101363
Submission received: 2 September 2025 / Revised: 10 October 2025 / Accepted: 11 October 2025 / Published: 14 October 2025

Abstract

The quality of teacher education represents a fundamental pillar for effective educational systems. European and Czech educational policies emphasise alignment with labour market demands and continuous professional development of teachers. This study examines the motivations of and barriers faced by secondary school teachers enrolled in a pedagogical study programme at the Czech University of Life Sciences Prague, contextualised within broader European and national strategic frameworks. Employing a mixed-methods approach, the research combined document analysis of international and national educational policy reports with a longitudinal questionnaire survey of 404 bachelor’s level teacher education students. Chi-square tests and sign residual analyses investigated relationships between labour market position, study motivation, and perceived obstacles. Findings reveal that employer requirements primarily drive educational professionals to pursue further qualifications, whilst other occupational groups cite personal interest as their main motivator. Time constraints emerge as the predominant barrier across all groups, followed by inadequate employer support. No significant association was identified between motivation and perceived barriers. Comparative analysis demonstrates Czech teachers’ lower remuneration satisfaction relative to other countries examined in this research. The study concludes that enhanced employer support and targeted policy measures addressing time constraints are essential for effective teacher professional development.

1. Introduction

Schools have traditionally held a central role in the transmission of knowledge and the provision of education. However, recent social and technological developments are challenging this position. Digitalisation and artificial intelligence, together with alternative educational institutions and media, increasingly shape the landscape of learning (Walter, 2024). Education, however, remains valuable for contemporary society, which was already described decades ago as a “knowledge society” or “education society” (Bell, 1973; Blau & Duncan, 1967; Boudon, 1973; Bowles & Gintis, 1976; Lane, 1966). At the same time, critical voices have highlighted the risks of commercialisation and market orientation of the educational sector. (Liessmann, 2009; Lohmann & Rilling, 2002). In this context, schools’ social and cultural roles remain indispensable, as they represent spaces where values are shared across social differences and where education may contribute to bridging social inequalities.
Since 2004, the Czech Republic has been a member of the European Union (hereinafter “EU”). According to the earlier classification into common and community policies, education does not belong to the common policies within the EU, similar to the broader field of social policy. The EU only has supporting competences in this area (European Commission, 2024). In practice, this implies that education policies fall exclusively within the competence of member states, while the EU’s role is limited to supporting national initiatives and coordinating selected activities. In the Czech Republic, these competences fall under the Ministry of Education, Youth and Sports (hereinafter “MEYS”).
Among the main international documents addressing educational policy, the Europe 2020 strategy, adopted by the European Council in 2010, holds particular significance. The strategy articulates three fundamental priorities, one of which specifically targets education (Government of the Czech Republic, 2022). Regarding vocational training, the EU established a forum based on the preceding Lisbon Strategy. This platform, formally designated as Education and Training 2020, facilitates the systematic exchange of best practices, methods, and experience in the field of education.
European cooperation in the field of education and vocational training is implemented through the Copenhagen process (MEYS, 2024b). Lifelong learning represents an integral part of contemporary education and employment policies. Following the negotiations held during the Lisbon European Council in 2000, the European Commission subsequently adopted the Memorandum on Lifelong Learning.
In the Czech Republic, the main document related to education is the Education Policy Strategy 2030+ (hereinafter “Strategy 2030+”). This document articulates two principal objectives: the transformation of educational content and the reduction in educational inequalities. These goals are operationalised through four strategic lines: (1) the comprehensive transformation of educational processes, (2) the mitigation of educational disparities, (3) the enhancement of teaching staff support and professional development, and (4) the establishment of sustainable financing mechanisms (MEYS, 2024d).
The implementation of Strategy 2030+ is facilitated through the Long-Term Plan of the Education System of the Czech Republic 2023–2027 (hereinafter “the Long-Term Plan”). This document delineates three priorities: (1) personal development and motivation for lifelong learning, (2) modern education and prepared pedagogues, and (3) a sustainable and effective system based on responsibility for educational results (MEYS, 2024a). The primary foundation for lifelong learning is established by the Lifelong Learning Strategy of the Czech Republic, adopted by the Government of the Czech Republic through Resolution No. 761 of 11 July 2007 (MEYS, 2024c).
On the basis of another legal document, the decree on Further Education of Pedagogical Staff, a career regulation (system) was to be introduced from 2014 (MEYS, 2024e). However, it was rejected by the Chamber of Deputies of the Parliament of the Czech Republic in July 2017 and is currently being revised. Beyond these legislative impediments, the professional development of teaching staff confronts numerous systemic challenges characteristic of combining study with employment. According to data from the Czech Statistical Office (hereinafter “CZSO”), these barriers encompass temporal and financial constraints, insufficient institutional support from employers, and the demanding nature of concurrent study requirements while maintaining professional responsibilities (CZSO, 2013).
Despite increasing recognition of the role of teacher professional development, several gaps persist in the current literature. As Richter et al. (2025) point out, most studies measure teachers’ motivation without a specific focus on their specialisation. Much of the existing literature focuses on technical training aspects, with limited examination of how professional development influences teachers’ attitudes and motivation (Amemasor et al., 2025). Methodologically, only a limited number of studies employ rigorous experimental designs (Ventista & Brown, 2023), while the current literature overlooks context-specific evaluations for socio-economic conditions (Liu & Li, 2025). Recent studies emphasise barriers, including inadequate institutional support and heavy workloads (Eroglu & Donmus Kaya, 2021), yet comprehensive longitudinal analyses examining employer support-motivation relationships remain scarce. As Rodríguez-Rivero et al. (2023) note, professional well-being and motivation are influenced by factors such as personal values, available time, and institutional context. This perspective situates our study within the broader international discourse on teacher motivation and lifelong learning.
This study addresses these gaps by examining the intersection of labour market position, study motivation, and perceived barriers among Czech secondary school teachers through a mixed-method approach. The research offers a comprehensive analysis of employer-driven versus self-motivated professional development participation within the specific context of Czech educational policy frameworks, contributing both theoretical insights into motivation-barrier relationships and practical recommendations for policy enhancement.

2. Materials and Methods

The first research technique employed is document analysis. The method was applied to three key documents. The primary document analysed was “Education at a Glance,” which presents annual survey results conducted by the Organisation for Economic Co-operation and Development (hereinafter “OECD”) and enables a comparison of education systems in OECD countries through selected indicators. The second document examined was Education and training in the EU—facts and figures, in which Eurostat presents findings from its annual survey on education across EU member states. The final document utilised is the publication Teaching and Learning International Survey 2018 Results (hereinafter “TALIS 2018”), which is available on the website of the Czech School Inspectorate (hereinafter “CSI”).
The analysis employs eight criteria to assess educational priorities and the attractiveness of the teaching profession across countries. The first criterion examines expenditure on education as a percentage of GDP, while the second focuses on government expenditure on education. The third criterion analyses the educational attainment of EU residents aged 25–34 years. The fourth criterion considers participation rates in education and vocational training amongst individuals aged 25–64 years. The fifth criterion analyses university graduates’ decisions to pursue teaching careers, and the sixth criterion assesses teachers’ professional satisfaction levels. The seventh criterion compares teachers’ salaries with those of other university-educated professionals, which is complemented by the eighth criterion—a comparison of salary levels for teachers with 15 years of professional experience across OECD countries.
The second research technique employed was a questionnaire survey conducted by our university. The respondents were selected from students enrolled in the bachelor’s study programme “Pedagogy for teachers of practical training”. This programme represents the only pedagogical degree offered by our university and attracts not only teachers of practical subjects at secondary vocational schools or training schools who require formal qualifications for their profession, but also employees from other sectors and self-employed individuals seeking to enter the teaching profession.
The survey included all students enrolled in the programme. This comprehensive approach was feasible due to the programme’s manageable size, with approximately 30–40 students per year of study. Data collection was conducted across four distinct periods: academic years 2014–2015, 2017–2018, 2020–2021, and 2023–2024. The three-year intervals between data collection periods matched the programme’s duration, which ensured complete participant turnover with each cohort participating only once. The total sample comprised 404 respondents.
The questionnaire comprised six questions, with questions 1–3 collecting data on respondents’ year of study, gender, and age. The main focus of the research centred on questions 4–6, which were as follows:
  • Question 4: What is your position in the labour market?
  • Question 5: What was the reason for starting your studies at the Institute of Education and Communication?
  • Question 6: What was the biggest obstacle to studying at the Institute of Education and Communication?
To identify dependencies between data obtained in questions 4–6, the chi-squared test of independence was employed. Where dependence had been statistically confirmed, a more detailed analysis was conducted using the so-called sign scheme. The sign scheme is based on the values of adjusted standardised residuals. When the observed frequency was significantly greater than the expected frequency, a “+” sign was assigned to the cell. Conversely, a “−” sign indicates that the observed frequency was substantially lower than the expected frequency. The number of signs corresponds to the significance level, as presented in Table 1.
The “0” sign indicates that the difference between observed and expected frequency in the particular cell is statistically insignificant at the 0.05 significance level. All data processing was conducted using IBM SPSS Statistics 30.

3. Results and Discussion

3.1. Document Analysis

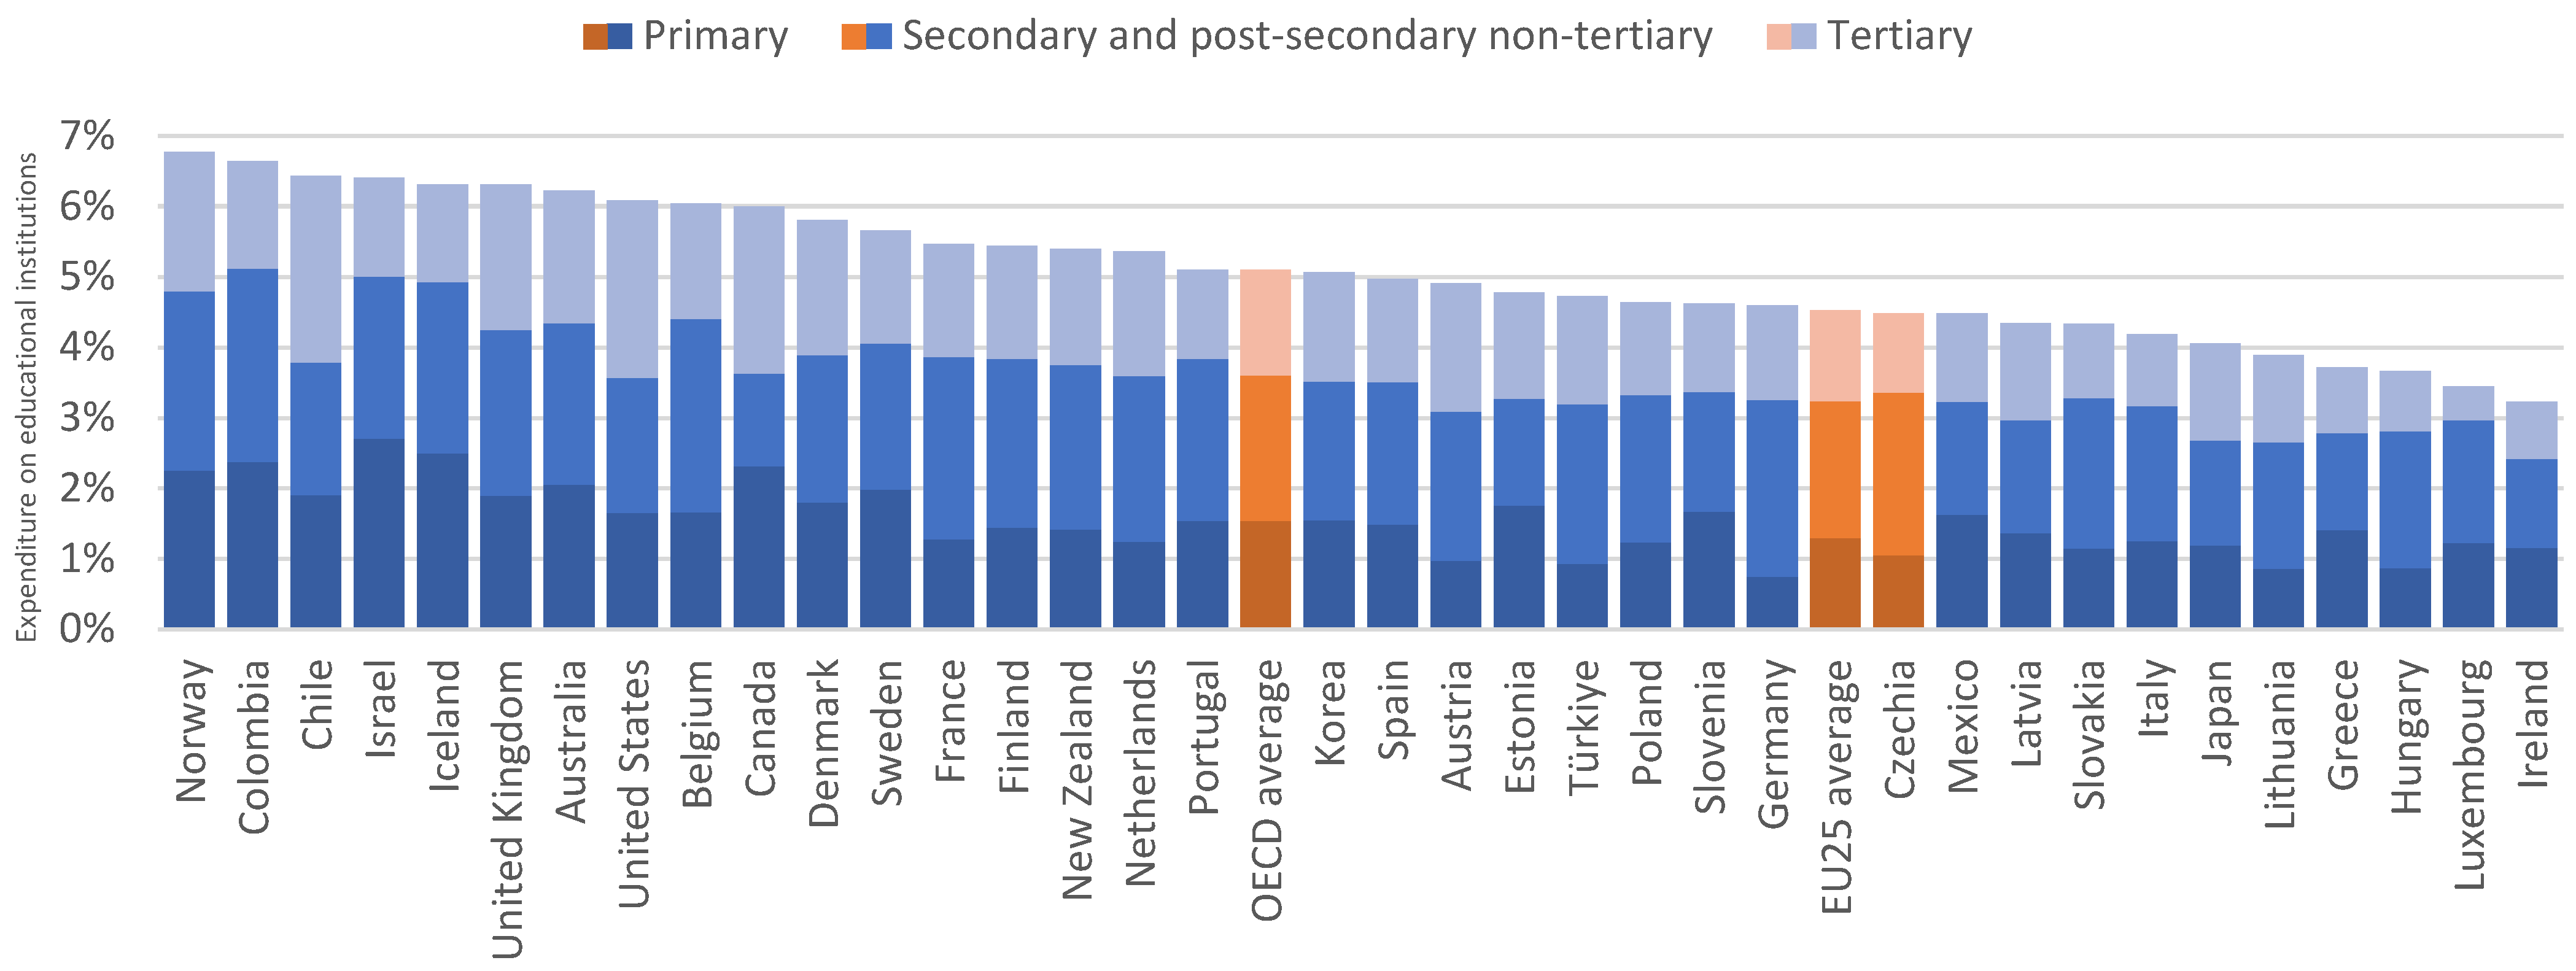
Educational expenditure as a percentage of GDP serves as a key indicator of a nation’s commitment to education, independent of absolute economic performance. This metric enables meaningful comparisons between countries with varying economic capacities and reflects policy priorities regarding human capital development. The distribution of educational expenditure as a percentage of GDP in 2020 by level of education across countries is illustrated in Figure 1.
The 2020 data reveal that the Czech Republic allocated 4.5% of GDP to education, falling below the OECD average of 5.1%. However, it is evident that education expenditure corresponds to the EU average (which in this case is calculated from the member states excluding Bulgaria, Romania, and Croatia, and including the United Kingdom).
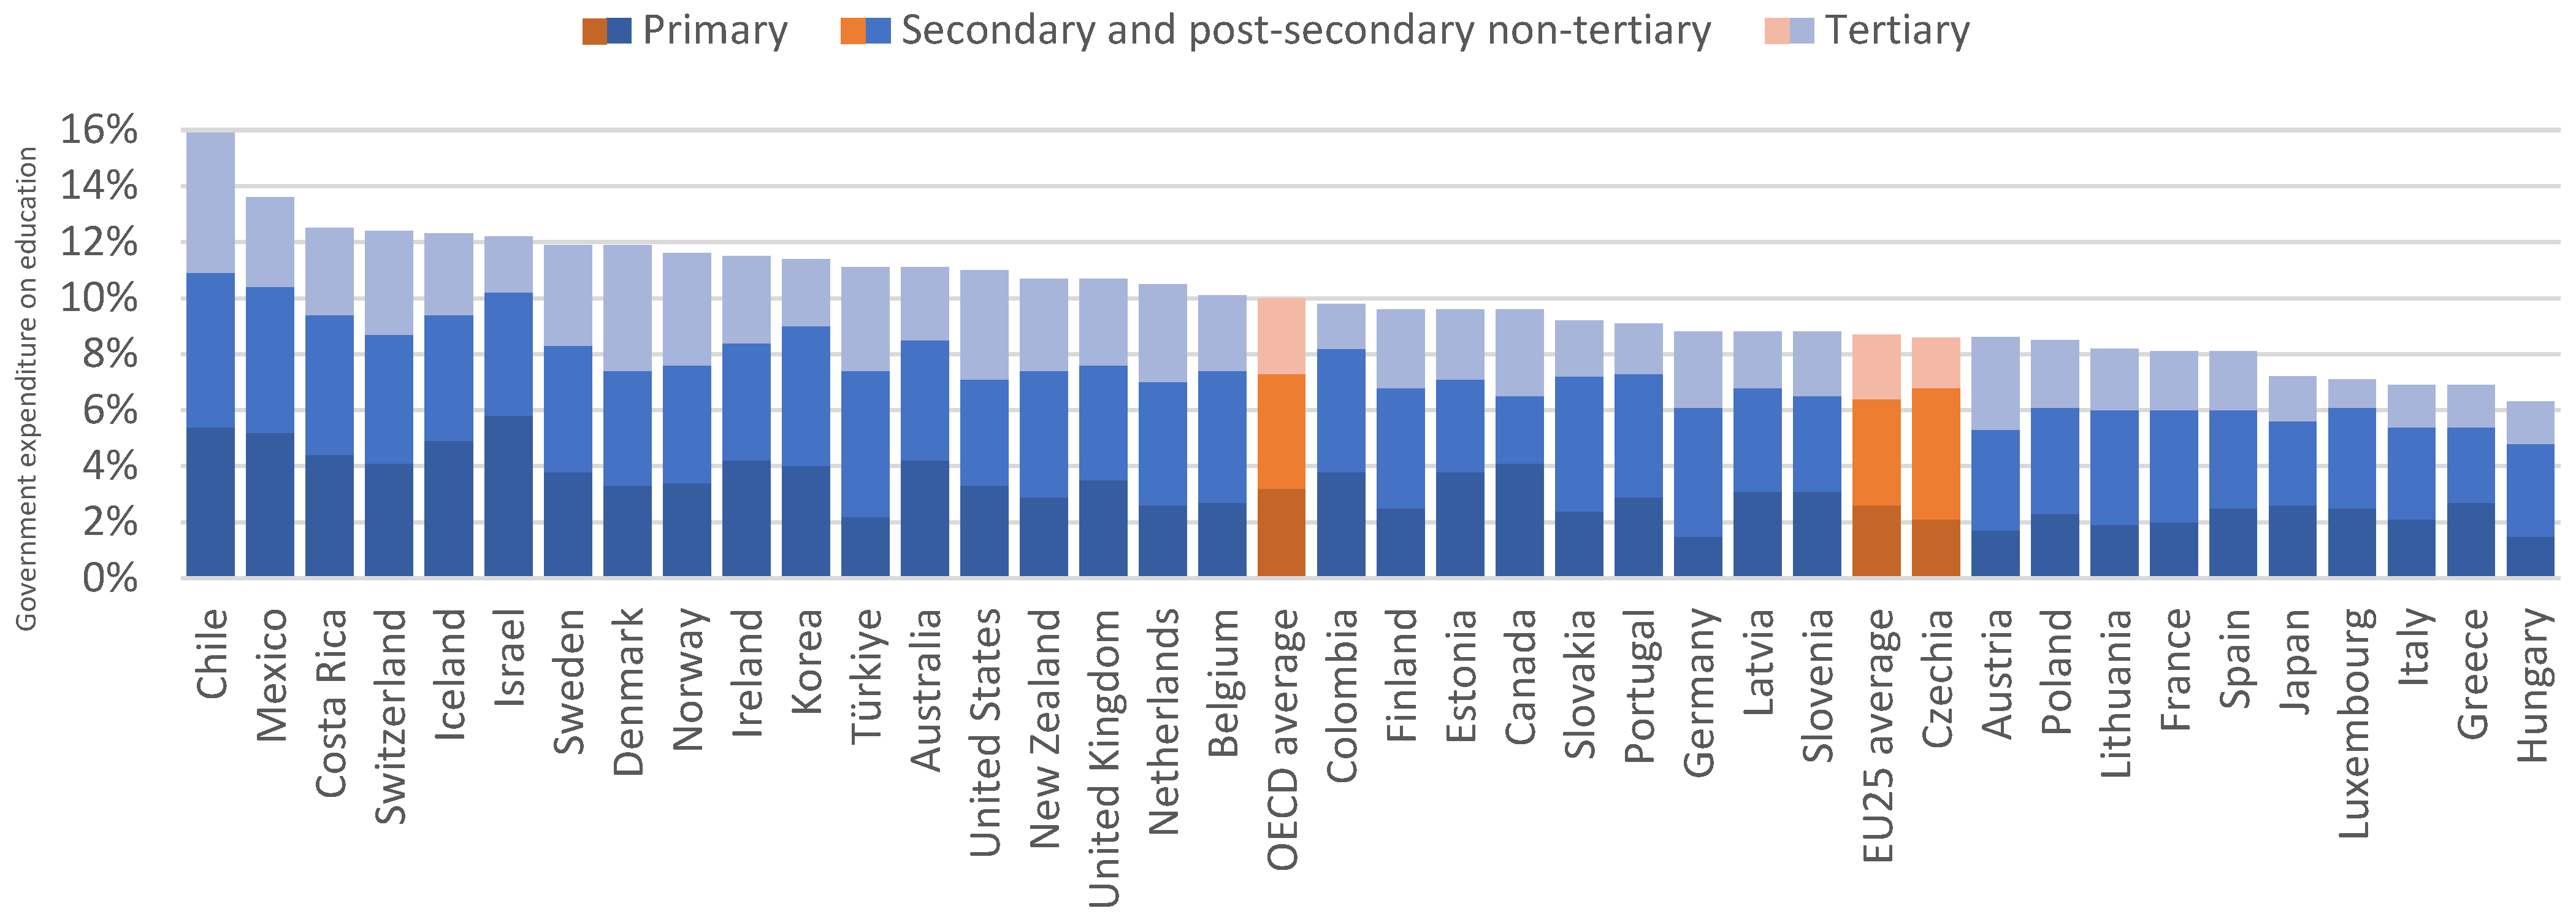
Similarly, government expenditure analysis shows the Czech Republic’s commitment at 8.6% of total government expenditure in 2020 compared to the OECD average of 10% (Figure 2). In this case, the gap is somewhat more pronounced; nevertheless, a similar pattern to that observed in expenditure on educational institutions as a percentage of GDP emerges, with the values remaining closely aligned with the EU average.
Table 2 highlights the distribution of educational attainment levels among individuals aged 25–34 across the EU countries. The Czech Republic demonstrates a distinctive educational profile within the EU context. While tertiary education attainment (33%) lags behind the EU average (44%), the country shows strengths in vocational and secondary education pathways. The high proportion of post-secondary non-tertiary general education (36% versus the EU average of 14%) reflects the Czech Republic’s traditional emphasis on technical and vocational training. It should be noted that the term EU-23 refers to EU member states (including the United Kingdom) that are also OECD countries.

3.1.1. Lifelong Learning Participation

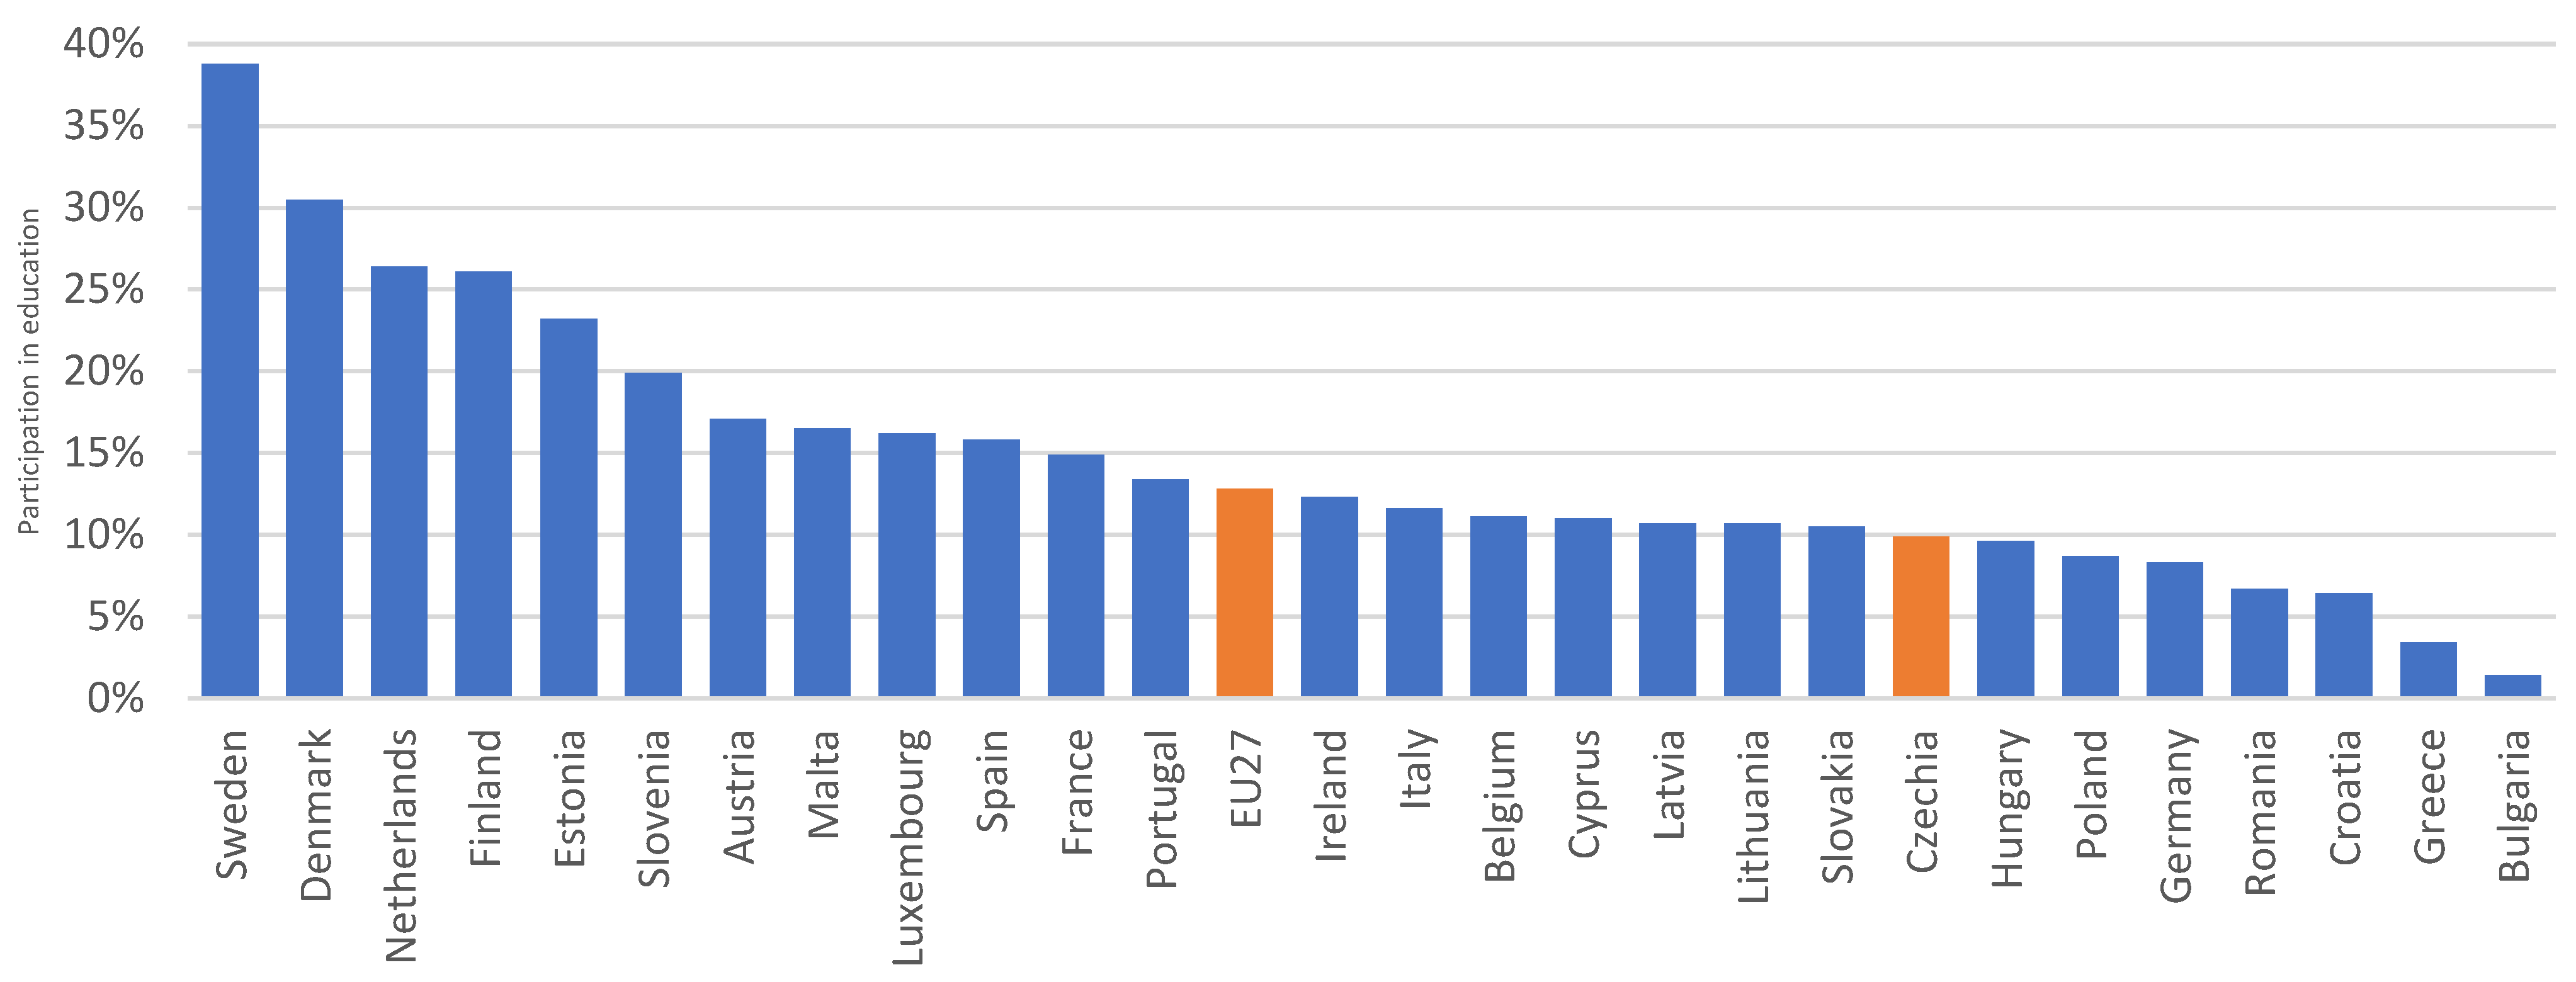
Beyond formal educational attainment, adult participation in continuing education reflects a country’s commitment to lifelong learning principles. Annual data on the involvement in education and training in the last 4 weeks are calculated as annual averages of quarterly EU Labour Force Survey data (EU-LFS), providing a robust indicator of ongoing learning engagement across the population (Figure 3).
The Czech Republic’s performance in lifelong learning reveals significant challenges for teacher professional development. With only 9.9% of adults aged 25–64 participating in formal or non-formal education in 2023, the country ranks 20th among 27 EU member states, substantially below the EU average of 39.5%.
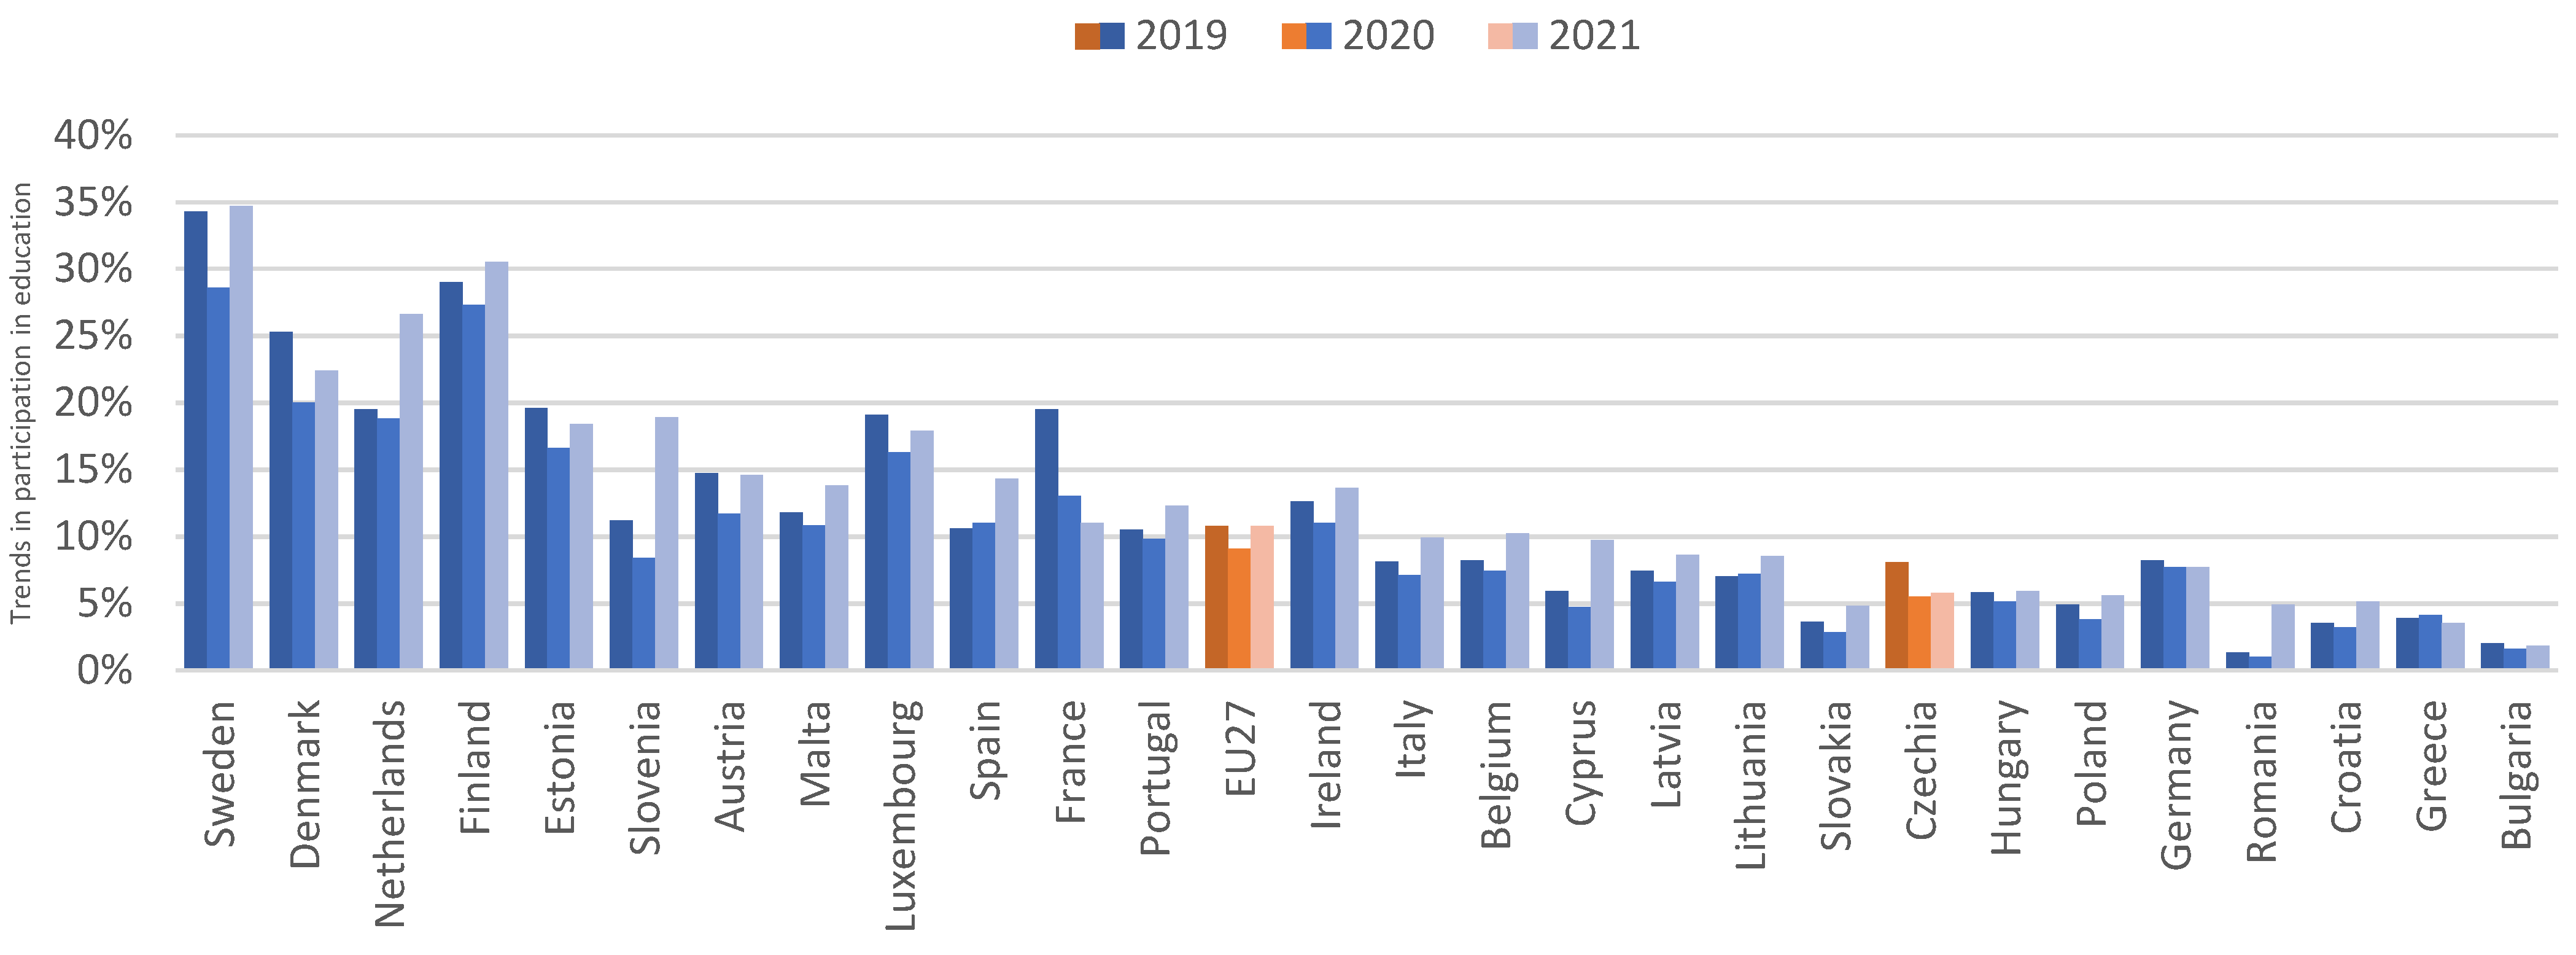
The temporal analysis (Figure 4) shows that COVID-19 pandemic measures caused a notable decline in adult education participation across OECD countries, with recovery beginning in 2021. This disruption may have affected teacher professional development programmes, as many rely on face-to-face interaction and collaborative learning approaches.

3.1.2. Teaching Profession

The Czech teaching workforce faces ageing challenges, with 30.5% of teachers exceeding 55 years compared to the EU average of 24.5% (MEYS, 2019). Additionally, teaching is increasingly serving as a secondary career choice, with only 53.6% of teachers with fewer than five years of experience choosing teaching as their first career option (CSI, 2019). These patterns may influence professional development participation and long-term commitment to the profession.
Potential teachers cite financial constraints and inadequate initial education quality as primary obstacles, with approximately half of teacher training enrolees choosing alternative careers (Korbel & Prokop, 2021). The TALIS 2018 survey reveals that only 52% of beginning Czech teachers view teaching as their primary profession, compared to 62% in neighbouring countries. While job satisfaction matches OECD levels (90%), salary satisfaction significantly lags behind: only 36% of Czech teachers are satisfied with their remuneration, compared to the OECD average of 47% (CSI, 2019). This reflects the Czech Republic’s position among OECD countries with the lowest teacher compensation.
Table 3 demonstrates that Czech teachers earn significantly less relative to other university graduates compared to international standards. While OECD teachers typically earn 86–96% of the salaries of other graduates, Czech teachers earn only 74–77%, representing a consistent 11–19 percentage point disadvantage across all education levels. This gap suggests that teaching is less financially competitive in the Czech Republic than in most developed countries.
Table 4 shows that experienced Czech teachers earn approximately half of the international standards, with salaries ranging from USD 25,535 to USD 28,534 per year, compared to OECD averages of USD 45,253 to USD 53,268. Czech teacher salaries remain relatively flat across different teaching levels, while OECD and EU compensation increases progressively from pre-primary (USD 45,000-USD 43,000) to upper secondary levels (USD 53,000), reflecting different salary structures.

3.2. Questionnaire Survey

The total of 404 respondents who participated in the survey included 258 women (63.9%) and 146 men (36.1%). In terms of age structure, the largest group consisted of individuals under 30 years, followed by those aged 41–50 years (26.2%), participants aged 31–40 years (19.6%), and individuals aged 51 or older (18.3%) (see Appendix A). As presented in Table 5, more than half of the participants (54.7%) were already employed in education, followed by employees in state administration (17.8%) and services sector workers (16.1%).
The motivational factors driving study enrolment, detailed in Table 6, reveal distinct patterns in participant rationales. Personal interest in increasing qualifications emerged as the predominant motivation, cited by 61.4% of respondents. This intrinsic motivation was followed by employer-requested qualification increases, which accounted for 24.3% of responses. Notably, financial benefits post-graduation represented only 2.0% of motivations, while career advancement considerations comprised 12.4%.
Regarding barriers to educational participation, Table 7 illustrates that time constraints constitute the most significant obstacle, affecting 57.4% of participants. The second most frequently cited barrier was insufficient employer support, reported by 20.8% of respondents. Both financial requirements (1.7%) and academic difficulty (2.0%) were marginal concerns for participants.

3.2.1. Accessing the Statistical Relationship Between the Position in the Labour Market and the Reason for Starting the Studies

For the first statistical test, the following null and alternative hypotheses were formulated:
  • H0: No statistically significant relationship exists between the position in the labour market and the reason for starting the studies.
  • H1: A statistically significant relationship exists between the position in the labour market and the reason for starting the studies.
Table 8 presents the initial statistical examination.
The presence of low expected frequencies in 40% of the cells violated the condition for using the chi-squared test, where 20% is the maximum. Therefore, some categories required their combination. Due to the low representation of the category “Expected financial benefit after graduation” among the reasons for starting the studies, this category was merged with “Advancement of the position in the labour market”, creating a new category labelled Other.
Table 9 presents an improved contingency table, with 20% of cells containing expected frequencies below five, which falls within an acceptable tolerance. The analysis yielded a very low p-value, confirming the statistically significant relationship between occupational position and educational motivation.
The adjusted standardised residual analysis presented in Table 10 reveals specific patterns within this relationship (detailed values in Appendix B). Employees in education demonstrate significantly higher propensity for employer-requested qualification enhancement, while showing significantly lower likelihood of pursuing other motivational categories. Conversely, state administration employees and own-account workers exhibit positive associations with alternative motivational factors, suggesting diverse pathways to teacher education based on current employment status. Personal interest in qualification improvement showed no dominant pattern across any occupational category relative to others.

3.2.2. Statistical Relationship Between the Position in the Labour Market and the Biggest Obstacles to Studying

The second relationship tested was between position in the labour market and the biggest obstacles to studying, based on the following null and alternative hypotheses:
  • H0: No statistically significant relationship exists between the position in the labour market and the biggest obstacle to studying.
  • H1: A statistically significant relationship exists between the position in the labour market and the biggest obstacle to studying.
As can be seen from Table 11, the chi-square assumption was not met here either, and therefore, categories were merged. In this case, the low-represented categories’ Financial requirement’ and ‘Studying was too hard’ were combined with the ‘Other’ category.
After category consolidation, Table 12 demonstrates a statistically significant association between examined variables.
After confirming a statistically significant relationship, Table 13 provides the residual analysis for the labour market position-barriers relationship (detailed values in Appendix C). Services sector employees demonstrate a significant positive association with employer support deficits, while showing a negative tendency with time-related constraints. Own-account workers exhibit a positive association with alternative barrier categories, reflecting their unique employment circumstances.

3.2.3. Statistical Relationship Between the Reason for Starting the Studies and the Biggest Obstacles to Studying

Finally, the last statistical test was based on the following null and alternative hypotheses:
  • H0: No statistically significant relationship exists between the reason for starting the studies and the biggest obstacle to studying.
  • H1: A statistically significant relationship exists between the reason for starting the studies and the biggest obstacle to studying.
The “biggest obstacles to studying” variable was already applied in reduced form without low-frequency categories. Table 14 presents this analysis, revealing no statistically significant association. This finding suggests that motivational factors and perceived obstacles operate independently within this population, indicating that barriers to education affect participants uniformly regardless of their initial reasons for pursuing teacher qualification programmes.

3.2.4. Summary of Statistical Testing

The statistical analysis revealed three key findings with important implications for understanding teacher professional development patterns. The significant relationship between labour market position and study motivation demonstrates that employees in education are predominantly motivated by employer requirements, while other professional groups show positive associations with alternative motivational factors. This finding suggests that professional development approaches should account for these distinct motivational patterns across different employment sectors.
The significant association between labour market position and perceived barriers indicates that services sector employees experience significantly higher rates of inadequate employer support compared to other groups, while showing a lower association with time-related constraints. This pattern suggests that barrier experiences vary systematically across employment sectors, with implications for targeted support strategies.
There is no statistically significant relationship between study motivation and perceived barriers, which suggests that barriers operate independently of initial motivations. This finding indicates that time constraints, employer support deficits, and other obstacles affect participants uniformly, regardless of whether they entered the programme due to employer requirements or personal interest. Consequently, support interventions should focus on universal barrier reduction rather than motivation-specific approaches.

3.3. Discussion

As noted by Akcaoglu et al. (2023), continued participation in professional development depends largely on intrinsic motivation. Our document analysis supports this view by showing that institutional factors in the Czech context may not sufficiently encourage sustained engagement in lifelong learning, as reflected in the comparatively low national participation rate in adult education. This contextual limitation is also evident in our empirical results, which align with international research while revealing Czech-specific characteristics. The predominance of employer-driven motivation among education employees corresponds with expected organisational influence on teacher behaviour (Straková & Simonová, 2024), though broader retention challenges persist.
Time constraints, as the primary barrier (57.4%), resonate with the international literature. Ventista and Brown (2023) emphasised that inadequate time allocation consistently emerges as a key barrier across multiple educational contexts.
The employer support deficits affecting 20.8% of participants highlight cultural differences in professional development contexts. While Zhang et al. (2021) found no significant relationship between organisational support and teacher motivation in China, Western research consistently emphasises such support as crucial for professional learning.
The absence of a significant statistical association between study motivation and perceived barriers indicates that barriers operate independently of motivational factors. While Richter et al. (2025) demonstrated that teachers exhibit different motivational patterns for professional development participation, our findings suggest that barriers affect all participants regardless of motivational types.
The modest role of financial factors contrasts with studies identifying resource constraints as significant barriers. Straková and Simonová (2024) and Belay and Melesse (2024) emphasised financial considerations as important factors, suggesting that temporal and organisational factors may be more influential in our specific context.

4. Conclusions

Among the examined occupational categories, employees in education represent the most significant group. The first statistical test revealed that the primary reason for study enrolment among education employees is employer requirements, with non-education employees predominantly citing alternative motivations.
The second statistical test identified time requirements as the most common barrier to study. Although this does not represent a statistically significant dependency for education employees, it is noteworthy that 135 out of 221 education employees cited time constraints as problematic. This finding is particularly concerning given that, according to provisions from Section 24, Paragraph 7 of the Act on Teaching Staff, teaching personnel are entitled to 12 working days of study leave annually (MEYS, 2024f). Additionally, in accordance with § 232 of the Labour Code, employees are entitled, when furthering their qualifications, to paid leave of absence corresponding to their average earnings. This entitlement covers the time necessary to attend classes, 2 working days for preparing for and taking the examination, 10 working days for preparing for and defending a bachelor’s thesis, and 40 working days for preparing for and taking the final state examination. These provisions apply to all employees, not exclusively to teaching staff.
The persistence of time-related barriers suggests that the formal framework does not translate into practical feasibility in the Czech Republic. The relatively low participation of adults in lifelong learning mirrors international patterns observed in systems where professional learning is not yet fully institutionalised, as also noted in global studies on teachers and personal development (Ovenden-Hope & Kirkpatrick, 2024).
The second most frequently cited barrier was lack of employer support. While this does not constitute a statistically significant dependency for education employees, the finding that 40 education employees reported inadequate employer support remains concerning, particularly given that employer requests were the predominant motivation for their studies.
The third statistical test revealed no statistically significant relationship between study motivation and perceived barriers. This absence of association can be considered a positive outcome, indicating that employers’ lack of support does not undermine employees’ participation in further education.
According to the fourth line of Strategy 2030+ (the establishment of sustainable financing mechanisms), the Czech Republic aims to enhance the attractiveness of the teaching profession by increasing education funding to OECD average levels. Recent amendments to the Act on Pedagogical Workers have set 130% of the average wage as the compensation for teachers. However, shortcomings persist in teacher professional development, particularly in terms of employer support. A comprehensive international study in 2016 came to similar conclusions: “All the participants had plans for their further professional development but sometimes foresaw hindrances to the realisation of those plans, such as a lack of resources and time” (Van der Klink et al., 2017).
Continued efforts to enhance motivation among both employers and employees remain necessary. Enhanced tax reliefs for employers represent one potential solution. While costs associated with employee qualification improvement are already tax-deductible under the Labour Code, this applies only when the education relates to the company’s business. Future tax relief provisions could extend to employee education in other areas.
Regional education receives co-financing through European Structural and Investment Funds (hereinafter “ESI”) development programmes. More effective utilisation of these resources could advance pedagogical competence development. Research confirms that “the practice architectures of professional learning in an age of standards work to support instrumental forms of professional learning while constraining the possibility of more authentic or generative forms of professional learning and consequently, teacher professionalism” (Mockler, 2022).
Understanding different teacher roles will strengthen the entire educational system (Antonsen et al., 2024), with teacher career system completion representing an integral component. The Czech Republic continues to reform its teacher training systems and support beginning teachers as a priority under Strategy 2030+. Since January 2024, the Teaching Staff Act has implemented mentoring teacher roles. International research indicates that schools can provide enhanced support for beginning teachers (Mockler, 2022), including mentoring programmes (Chalies et al., 2021).
Recent changes to accreditation procedures for professional development providers should reduce beginning teacher concerns about the demanding profession while increasing practice motivation. Current solutions rely primarily on ESI project-based support. Strategy 2030+’s second strategic line proposes developing professional standards for teachers and school directors, similar to those implemented in Scotland (Forde et al., 2016).

Author Contributions

Conceptualisation, A.H.; methodology, K.T.J.; validation, L.S.; formal analysis, K.T.J.; investigation, K.T. (Kateřina Tomšíková); data curation, A.H.; writing—original draft preparation, K.T. (Karel Tomšík) and K.T. (Kateřina Tomšíková); writing—review and editing, A.H. and K.T.J.; visualisation, K.T. (Kateřina Tomšíková); supervision, K.T. (Karel Tomšík); project administration, L.S. All authors have read and agreed to the published version of the manuscript.

Funding

This research received no external funding.

Institutional Review Board Statement

The research was conducted in accordance with the current ethical standards valid at the Czech University of Life Sciences Prague. For details, see https://www.czu.cz/en/r-9186-about-university/r-9193-authorities/r-12456-ethics-committee (Accessed on 9 October 2025). Therefore, no additional ethical approval was required. In case of necessity, the university operates an Ethics Board to oversee ethical matters. Furthermore, the author of this article conducted the research under the supervision of doctoral advisors, providing an additional layer of ethical oversight and guidance. The research fully complied with applicable ethical standards and legal requirements, including the protection of participants’ personal data and voluntary informed consent. There were no risks or harms associated with participation. The author ensured transparency, integrity, and honesty throughout the research process and in the presentation of results. No conflicts of interest were identified by the author. The Ethics Committee at the Czech University of Life Sciences Prague is available for ethical consultations, and doctoral supervision provided an additional ethical oversight framework.

Informed Consent Statement

Informed consent was obtained from all subjects involved in the study.

Data Availability Statement

The data presented in this study are available from the corresponding author on request.

Conflicts of Interest

The authors declare no conflicts of interest.

Abbreviations

The following abbreviations are used in this manuscript:
CSICzech School Inspectorate
CZSOCzech Statistical Office
ESIEuropean Structural and Investment Funds
EUEuropean Union
MEYSMinistry of Education, Youth and Sports (of the Czech Republic)
OECDOrganisation for Economic Co-operation and Development
TALISTeaching and Learning International Survey

Appendix A

Table A1. Question 2: To which age group do you belong?
Age GroupFrequencyPercent
30 or younger14535.9
31 to 407919.6
41 to 5010626.2
51 or older7418.3
Total404100.0
Source: Own elaboration.

Appendix B

Table A2. Adjusted standardised residual of the relationship between the position in the labour market and the reason for starting the studies—reduced categories.
CrosstabulationReason for Starting the Studies
Position in the labour marketThe employer’s request for an increase in qualificationOwn interest in increasing qualification, the need to educate yourselfOther
Employee in education6.2−1.6−5.3
Employee in the state administration−2.60.52.5
Employee in services−2.50.91.8
Own-account worker−3.00.82.6
Other−2.00.41.9
Source: Own elaboration.

Appendix C

Table A3. Adjusted standardised residual of the relationship between position in the labour market and the biggest obstacles to studying—reduced categories.
CrosstabulationThe Biggest Obstacles to Studying
Position in the labour marketTime requirementNo employer supportOther
Employee in education1.6−1.5−0.5
Employee in the state administration−0.11.3−1.2
Employee in services−2.02.8−0.4
Own-account worker−0.6−1.82.4
Other0.7−1.81.0
Source: Own elaboration.

References

  1. Akcaoglu, M., Ozcan, M. S., & Dogan, S. (2023). What keeps teachers engaged during professional development? The role of interest development. Education Sciences, 13(2), 188. [Google Scholar] [CrossRef]
  2. Amemasor, S. K., Oppong, S. O., Ghansah, B., Benuwa, B.-B., & Essel, D. D. (2025). A systematic review on the impact of teacher professional development on digital instructional integration and teaching practices. Frontiers in Education, 10, 1541031. [Google Scholar] [CrossRef]
  3. Antonsen, Y., Aspfors, J., & Maxwell, G. (2024). Early career teachers’ role in school development and professional learning. Professional Development in Education, 50(3), 460–473. [Google Scholar] [CrossRef]
  4. Belay, S., & Melesse, T. (2024). Exploring the link between teachers’ motivation for continuous professional development and professional learning communities: A structural equation modeling approach. SAGE Open, 14(3), 21582440241281855. [Google Scholar] [CrossRef]
  5. Bell, D. (1973). The coming of post-industrial society: A venture in social forecasting. Heinemann. [Google Scholar]
  6. Blau, P. M., & Duncan, O. D. (1967). The American occupational structure. Wiley. [Google Scholar]
  7. Boudon, R. (1973). L’inégalité des chances: La mobilité sociale dans les sociétés industrielles. Armand Colin. [Google Scholar]
  8. Bowles, S., & Gintis, H. (1976). Schooling in capitalist America. Routledge and Kegan Paul. [Google Scholar]
  9. Chalies, S., Xiong, Z., & Matthews, R. (2021). Mentoring and building professional competences of pre-service teachers: Theoretical proposals and empirical illustrations. Professional Development in Education, 47(5), 796–814. [Google Scholar] [CrossRef]
  10. CSI. (2019). Výsledky mezinárodního šetření TALIS 2018. Available online: https://www.csicr.cz/Csicr/media/Prilohy/PDF_el._publikace/Mezin%c3%a1rodn%c3%ad%20%c5%a1et%c5%99en%c3%ad/Narodni-zprava-z-setreni-TALIS-2018_web.pdf (accessed on 16 May 2024).
  11. CZSO. (2013). Vzdělávání dospělých v České republice: Výstupy z šetření adult education survey 2011. Available online: https://csu.gov.cz/docs/107508/40988203-8268-f8d2-a963-112088ca66fa/23005324.pdf?version=1.0 (accessed on 23 August 2024).
  12. Eroglu, M., & Donmus Kaya, V. (2021). Professional development barriers of teachers: A qualitative research. International Journal of Curriculum and Instruction, 13(2), 1896–1922. [Google Scholar]
  13. European Commission. (2024). Oblasti činnosti EU. Available online: https://commission.europa.eu/about/role/law/areas-eu-action_cs (accessed on 10 January 2024).
  14. Eurostat. (2024). Education and training in the EU—Facts and figures. Available online: https://ec.europa.eu/eurostat/statistics-explained/index.php?title=Education_and_training_in_the_EU_-_facts_and_figures (accessed on 23 August 2024).
  15. Forde, C., McMahon, M. A., Hamilton, G., & Murray, R. (2016). Rethinking professional standards to promote professional learning. Professional Development in Education, 42(1), 19–35. [Google Scholar] [CrossRef]
  16. Government of the Czech Republic. (2022). Strategie Evropa 2020. Available online: https://vlada.gov.cz/cz/evropske-zalezitosti/evropske-politiky/hospodarske_politiky_eu/strategie_evropa_2020/strategie-evropa-2020-193925/ (accessed on 10 January 2024).
  17. Korbel, V., & Prokop, D. (2021). Proč se lidé nehlásí ke studiu učitelství a jak to změnit? Available online: https://www.ucitelnazivo.cz/files/1875-proc-se-lide-nehlasi-ke-studiu-ucitelstvi-a-jak-to-zmenit.pdf (accessed on 23 August 2024).
  18. Lane, R. E. (1966). The decline of politics and ideology in a knowledgeable society. American Sociological Review, 31(5), 649–662. [Google Scholar] [CrossRef]
  19. Liessmann, K. P. (2009). Teorie nevzdělanosti: Omyly společnosti vědění. Academia. [Google Scholar]
  20. Liu, T., & Li, W. (2025). Enhancing teacher recruitment and retention through decision-making models in education systems. Scientific Reports, 15(1), 15247. [Google Scholar] [CrossRef] [PubMed]
  21. Lohmann, I., & Rilling, R. (2002). Die verkaufte Bildung: Kritik und Kontroversen zur Kommerzialisierung von Schule, Weiterbildung, Erziehung und Wissenschaft. Leske + Budrich. [Google Scholar]
  22. MEYS. (2019). Hlavní výstupy z Mimořádného šetření ke stavu zajištění výuky učiteli v MŠ, ZŠ, SŠ a VOŠ. Available online: https://msmt.gov.cz/ministerstvo/novinar/ministerstvo-zjistovalo-stav-ucitelu-v-regionalnim-skolstvi (accessed on 9 March 2024).
  23. MEYS. (2024a). Dlouhodobé záměry ČR. Available online: https://msmt.gov.cz/vzdelavani/skolstvi-v-cr/dlouhodobe-zamery-cr (accessed on 10 January 2024).
  24. MEYS. (2024b). Education and Training 2020. Available online: https://msmt.gov.cz/vzdelavani/vysoke-skolstvi/et-2020 (accessed on 5 January 2024).
  25. MEYS. (2024c). Strategie celoživotního učení ČR. Available online: https://msmt.gov.cz/vzdelavani/dalsi-vzdelavani/strategie-celozivotniho-uceni-cr (accessed on 10 January 2024).
  26. MEYS. (2024d). Strategie vzdělávací politiky ČR do roku 2030+. Available online: https://msmt.gov.cz/vzdelavani/skolstvi-v-cr/strategie-2030 (accessed on 10 January 2024).
  27. MEYS. (2024e). Vyhláška č. 317/2005 Sb., o dalším vzdělávání pedagogických pracovníků, akreditační komisi a kariérním systému pedagogických pracovníků. Available online: https://msmt.gov.cz/ministerstvo/vyhlaska-c-317-2005-sb-2 (accessed on 15 January 2024).
  28. MEYS. (2024f). Zákon o pedagogických pracovnících. Available online: https://msmt.gov.cz/dokumenty/zakon-o-pedagogickych-pracovnicich-ve-zneni-ucinnem-ode-dne (accessed on 15 January 2024).
  29. Mockler, N. (2022). Teacher professional learning under audit: Reconfiguring practice in an age of standards. Professional Development in Education, 48(1), 166–180. [Google Scholar] [CrossRef]
  30. OECD. (2022). Education at a Glance 2022: OECD Indicators. OECD Publishing. [Google Scholar] [CrossRef]
  31. OECD. (2023). Education at a Glance 2023: OECD Indicators. OECD Publishing. [Google Scholar] [CrossRef]
  32. Ovenden-Hope, T., & Kirkpatrick, H. (2024). The early career framework: Why context matters for teacher professional development. Education Sciences, 14(11), 1261. [Google Scholar] [CrossRef]
  33. Rabušic, L., Soukup, P., & Mareš, P. (2019). Statistická analýza sociálněvědních dat (prostřednictvím SPSS). Masarykova Univerzita. [Google Scholar]
  34. Richter, E., Fütterer, T., Eisenkraft, A., & Fischer, C. (2025). Profiling teachers’ motivation for professional development: A nationwide study. Journal of Teacher Education, 76(1), 90–103. [Google Scholar] [CrossRef]
  35. Rodríguez-Rivero, E. R., Rodríguez Hernández, A. F., Hernández-Jorge, C. M., & Duarte-Lores, I. (2023). The why of the teaching profession: Validation of a structural model of teacher motivations. Education Sciences, 13(8), 815. [Google Scholar] [CrossRef]
  36. Straková, J., & Simonová, J. (2024). Why do teachers leave schools? Evidence from lower secondary schools in the Czech Republic. International Journal of Educational Management, 38(5), 1444–1458. [Google Scholar] [CrossRef]
  37. Van der Klink, M., Kools, Q., Avissar, G., White, S., & Sakata, T. (2017). Professional development of teacher educators: What do they do? Findings from an explorative international study. Professional Development in Education, 43(2), 163–178. [Google Scholar] [CrossRef]
  38. Ventista, O. M., & Brown, C. (2023). Teachers’ professional learning and its impact on students’ learning outcomes: Findings from a systematic review. Social Sciences & Humanities Open, 8(1), 100565. [Google Scholar] [CrossRef]
  39. Walter, Y. (2024). Embracing the future of Artificial Intelligence in the classroom: The relevance of AI literacy, prompt engineering, and critical thinking in modern education. International Journal of Educational Technology in Higher Education, 21(1), 15. [Google Scholar] [CrossRef]
  40. Zhang, X., Admiraal, W., & Saab, N. (2021). Teachers’ motivation to participate in continuous professional development: Relationship with factors at the personal and school level. Journal of Education for Teaching, 47(5), 714–731. [Google Scholar] [CrossRef]
Figure 1. Total expenditure on educational institutions in 2020 as a percentage of GDP (Czechia, EU, and OECD highlighted). Source: Own elaboration based on OECD (2023).
Education 15 01363 g001
Figure 2. Government expenditure on education in 2020 as a percentage of total government expenditure (Czechia, EU, and OECD highlighted). Source: Own elaboration based on OECD (2023).
Education 15 01363 g002
Figure 3. Participation in formal and non-formal education and training in 2023 of people aged 25–64 (Czechia and EU highlighted). Source: Own elaboration based on Eurostat (2024).
Education 15 01363 g003
Figure 4. Trends in participation in formal and non-formal education and training of people aged 25–64 (Czechia and EU highlighted). Source: Own elaboration based on Eurostat (2024).
Education 15 01363 g004
Table 1. Number of sign symbols and corresponding significance level α.
SignSignificance Level α
“+” or “−”0.05
“+ +” or “− −”0.01
“+ + +” or “− − −”0.001
Source: Own elaboration based on Rabušic et al. (2019).
Table 2. Education achieved at the age of 25–34 in EU countries (%).
CountryPrimary and Lower SecondaryPost-Secondary Non-Tertiary GeneralPost-Secondary Non-Tertiary ProfessionalTertiary
Italy24133528
Hungary13173931
Czechia7362433
Germany1384633
Portugal25191937
Slovakia944739
Finland9113942
Austria1183942
Greece13242142
Poland6143743
Estonia11192743
Slovenia5104144
Latvia11252044
EU-23 average13142944
OECD average15162445
Belgium15112747
Denmark18102547
France1393148
Sweden16142148
Netherlands1283149
Lithuania7201855
Luxembourg13151655
Ireland92170
Source: Own elaboration based on OECD (2022).
Table 3. Comparison of teachers’ salaries with other tertiary-educated employees in 2021 (%).
Teaching LevelOECDEUCzechia
Primary868574
Lower secondary908974
Upper secondary969577
Source: Own elaboration based on OECD (2022).
Table 4. Annual salaries of teachers with 15 years of experience in 2021 (USD).
Teaching LevelOECDEUCzechia
Pre-primary45,25343,74625,535
Primary49,24549,02228,453
Lower secondary51,24651,50728,534
Upper secondary53,26853,27328,534
Source: Own elaboration based on OECD (2022).
Table 5. Question 4: What is your position in the labour market?
Position in the Labour MarketFrequencyPercent
Employee in education22154.7
Employee in the state administration7217.8
Employee in services6516.1
Own-account worker348.4
Other123.0
Total404100.0
Source: Own elaboration.
Table 6. Question 5: What was the reason for starting your studies at the Institute of Education and Communication?
Reason for Starting the StudiesFrequencyPercent
The employer’s request for an increase in qualification9824.3
Own interest in increasing qualification, the need to educate yourself24861.4
Expected financial benefit after graduation82.0
Advancement of the position in the labour market5012.4
Total404100.0
Source: Own elaboration.
Table 7. Question 6: What was the biggest obstacle to studying at the Institute of Education and Communication?
The Biggest Obstacles to StudyingFrequencyPercent
Time constraints23257.4
Financial requirement71.7
No employer support8420.8
Academic difficulty82.0
Other7318.1
Total404100.0
Source: Own elaboration.
Table 8. Relationship between the position in the labour market and the reason for starting the studies.
CrosstabulationReason for Starting the Studies
Position in the labour marketThe employer’s request for an increase in qualificationOwn interest in increasing qualification, the need to educate yourselfExpected financial benefit after graduationAdvancement of the position in the labour market
Employee in education80128112
Employee in the state administration946413
Employee in services843212
Own-account worker12319
Other0804
Chi-squared test
Test statistic61.42Note: 8 cells (40%) have expected count less than 5.
p-value<0.001
Source: Own elaboration.
Table 9. Relationship between the position in the labour market and the reason for starting the studies—reduced categories.
CrosstabulationReason for Starting the Studies
Position in the labour marketThe employer’s request for an increase in qualificationOwn interest in increasing qualification, the need to educate yourselfOther
Employee in education8012813
Employee in the state administration94617
Employee in services84314
Own-account worker12310
Other084
Chi-squared test
Test statistic57.28Note: 3 cells (20%) have expected count less than 5.
p-value<0.001
Source: Own elaboration.
Table 10. Sign scheme for the relationship between the position in the labour market and the reason for starting the studies—reduced categories.
CrosstabulationReason for Starting the Studies
Position in the labour marketThe employer’s request for an increase in qualificationOwn interest in increasing qualification, the need to educate yourselfOther
Employee in education+ + +0− − −
Employee in the state administration0+
Employee in services00
Own-account worker− −0+ +
Other00
Source: Own elaboration.
Table 11. Relationship between position in the labour market and the biggest obstacles to studying.
CrosstabulationThe Biggest Obstacles to Studying
Position in the labour marketTime requirementFinancial requirementNo employer supportStudying was too hardOther
Employee in education135340439
Employee in the state administration4111929
Employee in services30122111
Own-account worker1823110
Other80004
Chi-squared test
Test statistic24.10Note: 12 cells (48%) have expected count less than 5.
p-value0.087
Source: Own elaboration.
Table 12. Relationship between position in the labour market and the biggest obstacles to studying—reduced categories.
CrosstabulationThe Biggest Obstacles to Studying
Position in the labour marketTime requirementNo employer supportOther
Employee in education1354046
Employee in the state administration411912
Employee in services302213
Own-account worker18313
Other804
Chi-squared test
Test statistic20.29Note: 2 cells (13.3%) have expected count less than 5.
p-value0.009
Source: Own elaboration.
Table 13. Sign scheme for the relationship between position in the labour market and the biggest obstacles to studying—reduced categories.
CrosstabulationThe Biggest Obstacles to Studying
Position in the labour marketTime requirementNo employer supportOther
Employee in education000
Employee in the state administration000
Employee in services+ +0
Own-account worker00+
Other000
Source: Own elaboration.
Table 14. Relationship between the reason for starting the studies and the biggest obstacle to studying.
CrosstabulationThe Biggest Obstacles to Studying
Reason for starting the studiesTime requirementNo employer supportOther
The employer’s request for an increase in qualification551726
Own interest in increasing qualification, the need to educate yourself1425155
Other35167
Chi-squared test
Test statistic5.51Note: 0 cells (0%) have expected count less than 5.
p-value0.239
Source: Own elaboration.
Disclaimer/Publisher’s Note: The statements, opinions and data contained in all publications are solely those of the individual author(s) and contributor(s) and not of MDPI and/or the editor(s). MDPI and/or the editor(s) disclaim responsibility for any injury to people or property resulting from any ideas, methods, instructions or products referred to in the content.