Abstract
Conventional academic warning systems in higher education often rely on end-of-semester grades, which severely limits opportunities for timely intervention. To address this, our interdisciplinary study developed and validated a comprehensive socio-technical framework that integrates social-cognitive theory with learning analytics. The framework combines educational data mining with culturally responsive, personalized interventions tailored to a non-Western context. A two-phase mixed-methods design was employed: first, predictive models were built using Learning Management System (LMS) data from 2,856 students across 64 courses. Second, a quasi-experimental trial (n = 48) was conducted to evaluate intervention efficacy. Historical academic performance, attendance, and assignment submission patterns were the strongest predictors, achieving a Balanced Area Under the Curve (AUC) of 0.85. The intervention, specifically adapted to Confucian educational values, yielded remarkable results: 73% of at-risk students achieved passing grades, with a large effect size for academic improvement (Cohen’s d = 0.91). These findings empirically validate a complete prediction–intervention–evaluation cycle, demonstrating how algorithmic predictions can be effectively integrated with culturally informed human support networks. This study advances socio-technical systems theory in education by bridging computer science, psychology, and educational research. It offers an actionable model for designing ethical and effective early warning systems that balance technological innovation with human-centered pedagogical values.
1. Introduction
This chapter outlines the challenges of academic risk in higher education and frames the purpose and scope of the present study.
1.1. The Challenge of Timely Intervention in Higher Education
Across the global landscape of higher education, many nations are confronting the dual challenges of declining birth rates and university expansion, which has prompted a shift from an elite to a mass model of higher education (Alyahyan & Düştegör, 2020). This rapid expansion, while increasing access, raises significant concerns about educational quality and student attrition as learners with diverse academic preparedness enter university (Fahd et al., 2021; Vaarma & Li, 2024). Traditional academic support systems, however, remain constrained by reactive approaches that rely primarily on end-of-semester assessments. This practice creates significant temporal delays that limit the effectiveness of timely interventions (Hsieh & Shih, 2020; Macfadyen & Dawson, 2010).
From a theoretical standpoint, this challenge can be understood through the lens of social-cognitive theory, which emphasizes the importance of self-regulation, feedback mechanisms, and environmental support in learning processes (Bandura, 1991). The proliferation of digital learning environments has generated unprecedented opportunities to apply these principles through learning analytics (Siemens & Gasevic, 2012). Yet, the conventional model of “post hoc identification and reactive intervention” remains a critical bottleneck, failing to capture the dynamic nature of student learning and missing crucial opportunities for support (Azizah et al., 2024).
The higher education context in Taiwan exemplifies this global trend with particular acuity. The massification of university education in Taiwan has created unprecedented heterogeneity in student preparedness and learning motivations. This is compounded by a Confucian-influenced educational culture that traditionally emphasizes teacher authority and expects students to independently overcome academic difficulties (Yuan, 2023). This cultural context makes the development of proactive, data-driven support systems not only a technical challenge but a socio-cultural necessity.
To contextualize the dual challenges of declining birth rates and university expansion in Taiwan, official statistics from the Department of Statistics, Ministry of Education and the University Entrance Examination Center are drawn upon. In 2000, Taiwan had about 50 universities and 70 technical colleges, and the university admission rate was roughly 70%, still reflecting selective entry (Institution, 2016). By 2024, the number of universities had increased to about 140 while technical colleges had declined to 15, and the admission rate had risen to nearly 98% (News, 2024), reflecting near-universal access. These shifts illustrate how structural imbalance has lowered entry thresholds and contributed to weaker academic preparedness among incoming students.
1.2. Study Motivation and Research Gaps
Building upon the issues outlined in the introduction, this section briefly explains the theoretical and practical motivations of the present study and highlights the key gaps that existing research has not yet addressed.
Recent developments in educational data mining have highlighted the potential of utilizing diverse data sources to identify at-risk students at an early stage (Romero & Ventura, 2020). These advances have spurred the emergence of predictive models capable of detecting students who may require timely support. However, a critical examination of the current literature reveals three enduring gaps that limit both the theoretical development and practical applicability of learning analytics.
First, a substantial proportion of existing studies remain focused on enhancing prediction accuracy while neglecting the empirical validation of intervention effectiveness. As Gašević et al. (2015) note, relatively few studies have completed the full “prediction–intervention–evaluation” cycle, which is essential for demonstrating the practical utility of early warning systems in educational settings. This omission restricts our understanding of whether predictive insights can be translated into meaningful improvements in student outcomes.
Second, the predominance of research conducted in Western educational contexts has resulted in a narrow cultural scope. While these studies offer valuable insights, they provide limited understanding of how cultural norms—such as teacher authority, collectivism, or help-seeking behaviors—may shape students’ responses to data-informed interventions. This cultural over-reliance calls into question the global generalizability of existing findings.
Third, there is a notable lack of research grounded in the socio-technical systems perspective. Originally proposed by Trist and Bamforth (1951) and recently contextualized in learning analytics, this framework emphasizes that technological innovations must be understood in conjunction with the institutional and cultural systems in which they are embedded. Yet, in the field of learning analytics, few studies examine how predictive technologies interact with existing support structures, pedagogical practices, or institutional constraints. The absence of such perspectives impedes the development of sustainable, context-sensitive early warning systems.
Taken together, these gaps underscore the need for more holistic, culturally informed, and system-integrated approaches to learning analytics research and implementation.
1.3. Theoretical Framework and Research Objectives
This study addresses the aforementioned gaps by adopting a socio-technical systems framework, which conceptualizes learning analytics (Siemens & Gasevic, 2012) not merely as a technical solution but as a complex integration of algorithmic prediction, human support networks, and local cultural contexts (Ferguson, 2012; Stratton et al., 2022). Drawing on self-regulated learning theory (Zimmerman, 2002), we view effective early warning systems as learning environments that deliver timely feedback to support students’ self-regulation and activate appropriate social support mechanisms.
Accordingly, this study aims to develop and evaluate a comprehensive early warning system situated within the context of Taiwanese higher education. Specifically, the research seeks to: (1) construct and validate a predictive model that integrates historical academic records with real-time learning behaviors to identify at-risk students effectively; (2) design and implement a culturally responsive, personalized intervention mechanism that aligns with institutional support structures; and (3) rigorously evaluate the impact of this integrated “prediction–intervention” system on students’ academic performance and engagement using a quasi-experimental approach (Ifenthaler & Yau, 2020).
By fulfilling these objectives, the study contributes to the field of learning analytics by validating a socio-technical framework in a non-Western educational context, demonstrating the full prediction–intervention–evaluation cycle, and offering a transferable model for broader institutional implementation (Oliveira et al., 2021).
1.4. Research Questions
Despite academic consensus on the value of “predict–intervene” frameworks (Pardo et al., 2019), their effectiveness requires localized empirical validation within specific educational contexts. Prior studies have identified key predictors of academic risk (Malini & Kalpana, 2021; Sadi et al., 2023) and investigated the outcomes of targeted interventions (López-Meneses et al., 2025; Oliveira et al., 2021). However, the applicability of these findings to the Taiwanese higher education landscape remains to be established (Hsieh & Shih, 2020).
This study therefore addresses the following two core research questions:
- How can data mining techniques be effectively utilized to identify key variables from student background and learning process data that reliably predict at-risk status?
- What is the substantive impact of a personalized early warning system and its associated interventions on the academic performance and learning engagement behaviors of at-risk students?
2. Literature Review
This chapter reviews theoretical foundations and prior research on early warning systems (EWS), highlighting key developments and research gaps.
2.1. Theoretical Foundations and Developmental Context of Early Warning Systems
The development of early warning systems (EWS) within the field of learning analytics is grounded in multiple theoretical foundations (Siemens & Gasevic, 2012). Early Warning Systems (EWS) can be grounded in multiple learning theories that explain their educational value. From the perspective of
Social Cognitive Theory, EWS provides real-time feedback and environmental support, which enhance students’ self-efficacy and promote sustained learning (Arnold & Pistilli, 2012; Bandura, 1991). Similarly, within the framework of
Self-Regulated Learning Theory, EWS warning signals assist students in self-monitoring, adjusting learning strategies, and maintaining motivation, thereby strengthening their self-directed learning processes (Zimmerman, 2002).
Constructivist and Sociocultural Perspectives, EWS functions not merely as technical alerts but as triggers for engaging students with networks of support, including teachers, peers, and institutional resources, highlighting its role as a mechanism for activating social and institutional learning supports (Kember & David, 2009; Vygotsky & Cole, 1978).
The Learning Analytics Framework further emphasizes that an effective predictive system must integrate algorithmic accuracy with pedagogical feasibility, thereby creating a continuous cycle of “data–insight–action” (Siemens & Gasevic, 2012). In recent years, the Socio-Technical Systems Theory has gained increasing relevance in the learning analytics field. This theory asserts that the success of technological systems depends not only on computational performance but also—more critically—on the degree to which these systems are integrated into the existing educational ecosystem. This perspective is particularly important for understanding how learning analytics can be implemented and scaled across diverse cultural and institutional contexts.
2.2. Current State and Comparative Analysis of International EWS Research
2.2.1. Recent Research Developments
Recent international research conducted between 2023 and 2024 has identified three prominent trends in the development of EWS. The first concerns technical refinement. Bañeres et al. (2023) introduced a dynamic time-interval prediction model that demonstrated a significant reduction in dropout rates among 581 online learners. The innovation of this approach lies in its continuous prediction mechanism, which updates students’ risk profiles on a daily basis. This method offers greater responsiveness compared to traditional static evaluations. Within such systems, commonly adopted supervised machine learning algorithms include Decision Trees, Random Forests, and Gradient Boosting methods such as XGBoost 2.1.3, all of which have consistently exhibited strong predictive performance across diverse educational contexts (Chen et al., 2025).
The second trend pertains to cross-cultural applicability. Viberg et al. (2024) conducted a large-scale cross-national study involving 762 university students from Germany, South Korea, Spain, Sweden, and the United States. Their findings reveal that cultural variables—particularly power distance and uncertainty avoidance—significantly affect students’ acceptance of learning analytics systems. These insights lend strong theoretical support to the integration of cultural sensitivity into EWS design, particularly in non-Western educational settings.
The third development involves the integration of learning analytics with personalized learning strategies. In a study conducted in Chinese higher education, Zhou (2023) implemented an AI-driven personalized learning platform. An experimental trial with 356 students yielded substantial improvements in academic performance, with gains of 18.4% in computer science and 22.9% in mathematics. These findings underscore the pedagogical potential of combining learning analytics with adaptive instructional design.
2.2.2. Systematic International Comparison
In the context of this study, an Early Warning System (EWS) is defined as an institutionalized procedure established by higher education institutions, designed to leverage data analytics and learning behavior monitoring to detect academic risks at an early stage and to trigger corresponding academic support and interventions.
EWS can take the form of comprehensive, institution-wide initiatives or be localized within faculties or specific courses, depending on curricular demands and program orientations (e.g., teacher education programs, laboratory courses, education faculties, or engineering schools). While cross-cultural studies have revealed differences between countries and regions (Arnold & Pistilli, 2012; Siemens & Gasevic, 2012), Evidence suggests that even within the same cultural or national context, EWS practices may vary significantly across faculties and courses. This internal diversity underscores the importance of future comparative and empirical studies.
A systematic review of the literature reveals considerable regional variations in how EWS are developed and implemented across different educational contexts. In Western countries, learning analytics research tends to prioritize student privacy and system transparency. EWS in these settings are typically designed to support learner autonomy, providing suggestive rather than prescriptive interventions. The emphasis lies in preserving student agency and avoiding institutional overreach, aligning with broader cultural values such as individualism and self-directed learning.
By contrast, research in Asian educational systems often capitalizes on the hierarchical nature of teacher-student relationships and emphasizes collective learning cultures. Interventions in these contexts are generally more directive and are proactively administered by educators or institutional support units (Kember & David, 2009). Predictive models developed in this region frequently rely on indicators such as students’ prior academic performance, attendance records, and assignment completion patterns, which are consistent with prevailing pedagogical norms.
In Latin America, emerging research highlights the potential of EWS to enhance educational outcomes, particularly in health sciences education. One large-scale study involving 1691 students demonstrated that early identification of cognitive skill deficiencies can significantly improve learning effectiveness. These studies commonly adopt big data approaches, offering valuable methodological insights that contribute to the refinement of EWS frameworks and their broader applicability (Romero & Ventura, 2020).
2.3. Identification of Research Gaps and Formulation of Innovations
2.3.1. Systematic Limitations in Existing Research
A comprehensive review of literature from 2014 to 2023 identifies four major limitations in the current research landscape on EWS. First, most existing studies focus primarily on the construction of predictive models, with limited attention paid to evaluating the effectiveness of subsequent interventions. Among the 205 relevant modeling studies reviewed, fewer than 15% completed the full prediction–intervention–evaluation cycle, raising concerns regarding the practical utility and real-world impact of these systems (Gašević et al., 2015).
Second, there is a clear geographical concentration of research in Western educational systems, resulting in a scarcity of empirical studies conducted in East Asian or Confucian-influenced contexts. This lack of cross-cultural data undermines the generalizability of findings and limits the development of context-sensitive theoretical models that account for cultural diversity in learning environments (Yuan, 2023).
Third, current EWS research tends to treat learning analytics as a purely technical endeavor, often overlooking the socio-technical dimension of system implementation (Gray et al., 2022; Selwyn, 2019). This narrow perspective neglects the complex interplay between algorithmic design, institutional structures, and cultural norms—factors that fundamentally shape the adoption, effectiveness, and sustainability of EWS.
Finally, most evaluations of intervention outcomes are confined to short-term measures. There is a notable absence of longitudinal research that tracks long-term effects on students’ academic trajectories, persistence, or learning dispositions. As a result, the sustained impact of early warning interventions remains largely unknown, leaving a critical gap in understanding the broader educational implications of these systems.
2.3.2. Theoretical Innovations and Unique Contributions of This Study
In response to the gaps identified in prior research, this study makes three significant theoretical contributions to the field of learning analytics and EWS.
First, it provides the first systematic validation of the socio-technical systems framework within an East Asian higher education context. The findings show that in cultural environments with high power distance and collectivism, teacher- or advisor-led interventions are more effective than the autonomous learner models common in Western settings. This insight is crucial for expanding the theoretical foundation of learning analytics to better accommodate culturally diverse educational ecosystems.
Second, this study goes beyond prediction accuracy by completing the full prediction–intervention–evaluation cycle. Through a quasi-experimental design, it provides empirical evidence that supports the practical value of learning analytics in enhancing academic outcomes for at-risk students (Shafiq et al., 2022). This contribution addresses the long-standing call for rigorous intervention validation in the field.
Third, this research proposes a “Culturally Sensitive Learning Analytics Framework” that stresses the importance of aligning intervention strategies with local educational values and institutional support structures. The integrated model links the Center for Teaching and Learning Development, the Counseling Center, and the advisor system, demonstrating a holistic and contextually responsive approach to designing and implementing EWS.
Together, these innovations offer a theoretically grounded and operationally adaptable model for institutions that want to implement culturally relevant learning analytics initiatives.
2.4. Theoretical Framework and Conceptual Model
This study integrates three theoretical perspectives—Self-Regulated Learning Theory, Social Cognitive Theory, and Socio-Technical Systems Theory—to construct a comprehensive framework for culturally informed learning analytics, as illustrated in Figure 1.
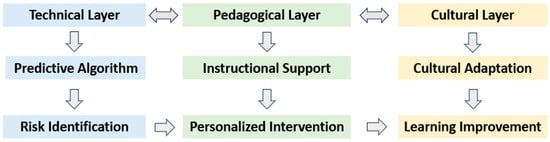
Figure 1.
Culturally Embedded Learning Analytics Framework.
This framework underscores three critical dimensions of integration essential for the effective implementation of learning analytics systems. First, it emphasizes the alignment between technical accuracy and pedagogical relevance, ensuring that algorithmic predictions are not only precise but also meaningful and actionable within authentic instructional contexts. Second, it stresses the importance of combining personalized support with cultural sensitivity, allowing intervention strategies to be tailored to institutional norms and student expectations across different educational environments (Huang et al., 2023). Third, it advocates for the integration of short-term interventions with long-term developmental goals, acknowledging that sustainable academic success depends not only on immediate remediation but also on ongoing structural support.
Based on this framework, the study proposes the following three research hypotheses:
H1.
A machine learning model based on learning management system (LMS) behavioral data can accurately predict student academic risk.
H2.
Culturally sensitive and personalized interventions can significantly improve the academic performance of at-risk students.
H3.
The degree of socio-technical integration moderates the educational effectiveness of the EWS.
3. Methodology
This chapter describes the research design, participants, data sources, and analytic procedures adopted in the study.
3.1. Research Design and Framework
This study adopts a sequential two-phase quantitative research design to systematically examine both the predictive accuracy and the practical effectiveness of an EWS. Phase I centers on the construction and validation of predictive models, while Phase II evaluates the impact of targeted interventions through a quasi-experimental design. The overall research framework is illustrated in Figure 2.
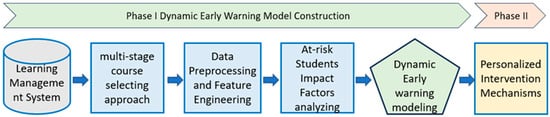
Figure 2.
Flowchart of Early Warning Model Construction and Intervention Effectiveness Validation.
In Phase I, the study was conducted at a comprehensive university in Taiwan, aiming to develop robust predictive models capable of identifying at-risk students early in the semester (Sadi et al., 2023). To achieve this, we integrated students’ demographic profiles, course-specific data, and digital learning traces—including class attendance and assignment submission records—into course-specific data mining models. Each course was modeled independently to accommodate contextual differences in instructional design and assessment practices.
Phase II assessed the real-world effectiveness of the intervention strategies. One course from Phase I—characterized by high model accuracy and repeated offering in subsequent semesters—was selected for quasi-experimental implementation. With the instructor’s approval, we applied the validated model to identify high-risk students in the sixth week of the semester. Those identified were assigned to an experimental group and received individualized intervention support, while others followed the regular instructional process. The control group consisted of students who were not flagged by the EWS and who continued with regular instruction. Ideally, a quasi-experimental design would compare two groups of high-risk students (those receiving interventions versus those without). However, due to ethical restrictions, we could not withhold academic support from students identified as at risk. Instead, the present design allowed us to examine whether personalized interventions could help the experimental group (EWS-flagged students) reduce the performance gap with their peers and achieve the passing standard in final course grades. The results, interpretations, and conclusions from this quasi-experimental analysis are elaborated in the following sections.
3.1.1. Study Population and Data Sources
The study employed a multi-stage purposive sampling approach to ensure representativeness and stability. The initial sampling frame comprised 12,861 undergraduate courses delivered across the 2020–2024 academic years at a comprehensive university in Taiwan. Through systematic screening, 1661 core (non-elective) courses were identified. To focus on foundational academic competencies, the sample was further refined to include only first- and second-year courses with consistent delivery patterns, yielding a final sample of 205 eligible courses.
Given the substantial heterogeneity across courses—including variations in pedagogical approaches, assessment methodologies, faculty characteristics, and evaluation criteria—developing a universal predictive model presented significant challenges. Consequently, this study adopted a course-specific modeling strategy to enhance ecological validity and predictive accuracy, acknowledging that model performance would likely vary according to course-specific characteristics. To enhance the interpretability of our model, a comprehensive glossary titled “Glossary of Model Predictors” has been added in Appendix A. This table lists all predictors included in the model, specifying each variable’s name, data source, definition, range or categories, and Information Value (IV). This addition allows readers to better understand the basis of model construction and the relative contribution of different variables to predictive power.
Data were extracted from the institution’s integrated Student Information System (SIS) and Learning Management System (LMS). All datasets underwent comprehensive de-identification procedures following institutional data governance protocols. Ethical approval was obtained from the university’s Institutional Review Board (IRB) prior to data collection and analysis.
3.1.2. Data Preprocessing and Feature Engineering
Some instructors did not implement formative assessments, midterm or final examinations, or systematically record student attendance at the beginning of the semester. These omissions led to a high proportion of early missing values in key predictive variables. When the extent of missing data exceeded the threshold for reasonable imputation, the corresponding course data were excluded from the analysis to ensure both early-warning capability and model accuracy.
Guided by existing literature and practical experience, the researchers developed three major categories of predictive features: (1) Prior Academic Performance, such as grades from the previous semester; (2) Course Engagement Behaviors, like attendance and assignment submissions; and (3) Student Background Characteristics, including department, gender, and admission type. To improve both model interpretability and predictive power, Information Value (IV) analysis was used to identify and retain the most discriminative features.
This rigorous process involved five steps. First, data cleaning was conducted to remove incomplete or erroneous records, and outliers were carefully examined and corrected where necessary. Second, missing values were treated based on their nature: small amounts of random missing data were imputed using the mean or mode, while systematic gaps were categorized as independent groups to preserve interpretability. Third, categorical variables, such as student identity or high school type, were encoded using one-hot encoding to avoid misinterpreting them as continuous scales. Fourth, continuous variables were discretized into bins and transformed using the Weight of Evidence (WoE), followed by standardization. Finally, Information Value (IV) was calculated for each variable to assess its power in predicting the target variable (course failure), and features with an IV less than 0.02 were excluded as non-predictive.
By implementing this process, the final model only included variables with a moderate to strong predictive ability, ensuring the selected features were both statistically robust and practically interpretable. This refinement not only enhances model validity but also gives educators a clear understanding of how specific student characteristics contribute to risk prediction, which strengthens the educational utility of the EWS.
3.1.3. Risk Prediction Model Construction and Evaluation
The core objective of this study was to construct an early warning model for learning risk, aiming to predict whether students would successfully pass their courses by the end of the semester. Three machine learning algorithms were compared: Decision Tree, Random Forest, and XGBoost (Chen & Zhai, 2023; Dutt et al., 2017). Given the application requirements in educational contexts, the Decision Tree model was selected as the primary approach due to its high interpretability, enabling educators to understand predictive outputs and design appropriate interventions.
In constructing the models, this study applied specific parameter configurations to each algorithm. The Decision Tree model used the Gini index as the splitting criterion, with the maximum depth restricted to 5 to prevent overfitting. The Random Forest model incorporated 200 trees, set the maximum number of features to √p (where p is the number of variables), and required a minimum of 5 samples to split an internal node. The XGBoost model was configured with a learning rate of 0.1, a maximum depth of 6, a subsample ratio of 0.8, and 200 iterations. These parameter choices were guided by prior literature and cross-validation results, ensuring that the models achieved an appropriate balance between performance and interpretability.
For the Decision Tree and Random Forest models, hyperparameters were tuned using GridSearchCV, which systematically searches combinations of tree depth, minimum samples per split, and the number of estimators. For the XGBoost model, the researchers used RandomizedSearchCV to sample from the hyperparameter space and improve computational efficiency. In all cases, the Area Under the Curve (AUC) was the main selection criterion for evaluating model performance.
Decision Tree and Random Forest models were chosen for their ability to generate clear, interpretable rules that help educators understand the “profiles” of at-risk students, such as their learning behavior patterns, attendance, or assignment completion. These rules help educators design targeted interventions. Unlike “black-box” models, these rule-based methods reveal the factors behind academic risk, allowing instructors to provide timely, individualized support.
The interpretability of these rules also has practical implications beyond the classroom, as they can inform institutional governance and policymaking, including curriculum design and the allocation of learning support services. In essence, the interpretability of the rules enhances the models’ usefulness in educational practice and strengthens their contribution to long-term institutional reform.
In contrast, other models were not considered as suitable for this study’s context. Adaboost, for example, is sensitive to noisy and heterogeneous data. KNN can suffer from the “curse of dimensionality” in high-dimensional datasets and lacks interpretability. Voting classifiers, while able to combine multiple models, do not easily produce transparent rules, which limits their applicability in real-world educational contexts. For these reasons, the study focused on tree-based models, balancing predictive performance with interpretability to ensure both academic rigor and practical utility.
The dataset was split into 70% training and 30% testing subsets, and five-fold cross-validation was conducted to enhance model stability and generalizability. As at-risk students represent a minority in the dataset, model evaluation emphasized Recall, F1-Score, and balanced Area Under the Curve (AUC), in addition to overall accuracy, to ensure balanced performance assessment (Fahd et al., 2021).
In evaluating model performance, this study adopts balanced AUC as one of the core indicators. Prior literature suggests that an balanced AUC below 0.75 can be interpreted as relatively poor model performance in measurement and testing contexts (Zhou, 2023).
Accordingly, we interpret the observed balanced AUC = 0.85 as evidence of good predictive capability in courses where data quality met the minimum threshold.
Nonetheless, in educational applications, the interpretation of balanced AUC should be contextualized: numerical values must be considered alongside data completeness and the interpretability of rules to ensure that the model genuinely informs pedagogical and policy decisions.
3.2. Dynamic Early Warning and Intervention Mechanisms
The second phase of this study aimed to empirically validate the practical efficacy of intervention strategies. To do this, a foundational general education course was selected from the set of high-performing courses identified in Phase I. This course had strong predictive accuracy and was taught by an instructor who was willing to participate in the quasi-experimental design for implementing a dynamic early warning and intervention protocol.
Students in the experimental group received personalized interventions through a structured, multi-stage support system that integrated institutional resources. The intervention workflow is shown in Figure 3. When the EWS was activated, instructors were immediately notified, and the risk list was also sent to departmental advisors for preliminary engagement and to gain context on the flagged students.
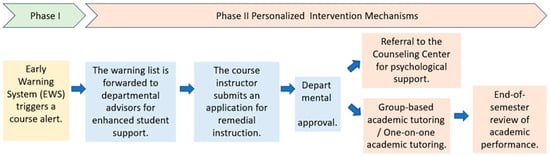
Figure 3.
Personalized Intervention Process Flowchart.
Follow-up support could be initiated by instructors or through student self-referral. After receiving departmental approval, students gained access to services from various campus units. The Center for Teaching and Learning Development provided customized academic support, including in-class remedial instruction or one-on-one tutoring based on student needs (Walkington & Bernacki, 2021). If academic difficulties were suspected to be linked to emotional distress or other non-academic factors, students were also referred to the University Counseling Center for professional psychological support and care.
3.3. Effectiveness Validation
To objectively assess the effectiveness of the early warning and intervention mechanism, this study employed a quasi-experimental design comparing academic outcomes between an experimental group (receiving individualized intervention) and a control group (receiving regular instruction without intervention). Multiple statistical methods were applied to ensure a comprehensive evaluation of the intervention’s impact.
First, descriptive statistics were computed, including means and standard deviations for both pretest and posttest scores across groups, to establish the baseline distribution characteristics. Second, paired-samples t-tests were conducted to examine within-group differences, identifying whether significant learning gains occurred from pretest to posttest in each group independently. For the primary analysis of intervention efficacy, Analysis of Covariance (ANCOVA) was employed to assess whether the experimental group outperformed the control group on posttest scores while controlling for initial academic levels.
Specifically, we clarified that the study employed a standardized course-based test as both the pretest and posttest, covering core concepts, problem-solving skills, and applied items in order to reflect multiple dimensions of learning outcomes.
The pretest was conducted at mid-semester (week 6) and the posttest at the end of the semester (week 18). The two tests shared a similar structure but did not reuse items, thereby reducing potential memory effects. For analysis, we applied paired-sample t-tests to compare students’ scores before and after the intervention and calculated Cohen’s d to determine effect size.
3.4. Research Ethics
Throughout the research process, strict adherence to ethical standards was maintained. All early warning notifications were designed using “de-labeling” and “empowerment-oriented” language aimed at promoting student self-reflection and encouraging constructive help-seeking behaviors, rather than inducing anxiety or stigmatization. This ethical design minimizes potential negative psychological impacts from labeling effects and ensures that technology use genuinely supports student well-being and academic growth.
3.5. GenAI Use Statement
Generative artificial intelligence (GenAI) tools were used in the preparation of this manuscript for purposes beyond surface-level text editing.
ChatGPT (OpenAI, GPT-4.0, 2025) was employed to assist in drafting portions of the text, to support research design by suggesting alternative methodological and analytical approaches, and to aid in the interpretation of statistical results, including the balanced Area Under the Curve (AUC) and Cohen’s d.
All substantive research decisions, including final study design, data analysis, and interpretation of findings, were made solely by the author. No GenAI tool was used to fabricate, manipulate, or alter research data.
4. Results
This chapter presents the empirical findings from both phases of the study, including predictive modeling and intervention analyses. Phase I reports the construction and performance of predictive models, while Phase II summarizes the quasi-experimental outcomes on student achievement.
4.1. Predictive Model Selection and Performance
The first phase of this study focused on constructing and validating an appropriate predictive model and course context suitable for subsequent quasi-experimental intervention.
From a dataset of 205 core first- and second-year courses, selected on the basis of consistent multi-semester offerings, a multi-criteria selection strategy was employed to ensure both predictive robustness and practical feasibility.
Three criteria guided the process: (1) sufficient model validity, (2) early availability of assessment data, and (3) strong discriminative value of behavioral indicators.
To ensure discriminatory power, only courses with an Area Under the Curve (AUC) value exceeding 0.75 were retained (Smolkowski & Cummings, 2015; Swets, 1988). Table 1 summarizes the distribution of model performance across AUC ranges and the corresponding qualitative ratings. This threshold ensured the model’s ability to differentiate between students likely to succeed and those at risk of failure.

Table 1.
Predictive Model Performance Evaluation Metrics.
In addition, courses were required to provide meaningful assessment input—such as assignments or quizzes—available in the early weeks of instruction to support timely prediction.
Finally, predictive features extracted by week six had to demonstrate strong discriminative value, defined as an Information Value (IV) greater than 1.0.
Applying these criteria, 64 courses comprising 2856 students met the initial performance requirements. Of these, only eight courses further satisfied the conditions of early data completeness and faculty cooperation for intervention. From this refined set, one course—History of Physical Education, a general education subject—was selected as the intervention context. It demonstrated the strongest model performance (AUC = 0.85) and fulfilled all implementation requirements.
- Methods—Evaluation Metrics
In addition to accuracy, precision, recall, specificity, and F1-score, the study employed the Area Under the balanced Receiver Operating Characteristic Curve (AUC) to evaluate model performance. The balanced AUC was approximated from the confusion matrix using the formula
In this study, we report multiple classification metrics. Specifically, true positive rate (TPR) represents the proportion of actual at-risk students correctly identified (recall), while true negative rate (TNR) represents the proportion of not-at-risk students correctly classified (specificity). Here, true positive (TP) refers to at-risk students correctly flagged by the model, false positive (FP) refers to not at-risk students incorrectly flagged as at-risk, true negative (TN) refers to not-at-risk students correctly recognized, and false negative (FN) refers to at-risk students who were not identified by the system. The criterion for determining students “actually at risk” was their final course outcome: students who failed or officially withdrew were coded as positive cases, while those who passed were coded as negative cases.
- Results—Comparison Across Semesters
In order to evaluate the predictive performance of the Early Warning System in a real teaching context, we selected a sports history course that had been offered consecutively over six semesters.
Data from 1184 students across these six prior semesters were used to construct the predictive model, which was subsequently applied to a new cohort of 48 students in the following semester. The comparison of outcomes is presented in Table 2.
Table 2.
Confusion matrices for six prior semesters (N = 1184) and the new semester (N = 48).
As summarized in Table 2, the confusion matrices for the six prior semesters (N = 1184) and the new semester (N = 48) were used to calculate the model performance metrics presented in Table 3. Across the six prior semesters, the model achieved an accuracy of 92.7% with a precision of 65.8% and a recall of 75.0%, resulting in an F1-score of 70.1%. The high specificity (94.9%) indicates strong ability to correctly identify students who were not at risk, while the balanced accuracy (85.0%) and approximate balanced accuracy value of 0.85 further confirm its robustness.
Table 3.
Model performance metrics across semesters.
When applied to the new semester cohort, the model maintained comparable discriminative power, with a slightly lower accuracy of 83.3% but improved recall (93.8%) and F1-score (78.8%), suggesting greater sensitivity to identifying at-risk students.
Although specificity declined to 78.1%, the balanced accuracy remained stable at 85.9% and the AUC at 0.86, demonstrating consistent overall performance. These performance values are consistent with benchmarks recommended for academic progress monitoring tools (Smolkowski & Cummings, 2015).
These findings suggest that the model is both stable across larger historical datasets and adaptable to smaller, new cohorts, reinforcing its potential as a reliable component of an Early Warning System.
Recall increased substantially in the new semester (93.8% vs. 75.0%), indicating improved detection of at-risk students. However, specificity declined (78.1% vs. 94.9%), reflecting more false positives.
This trade-off yielded a higher F1-score and comparable balanced AUC values, indicating that the model achieved a more balanced performance between precision and recall.
- Statistical Test Results
As shown in Table 4, statistical analyses were conducted to examine whether the distribution of classification outcomes differed between the six prior semesters and the new semester cohort. The chi-square test yielded a highly significant result (χ2 = 40.35, p < 0.001), indicating that the distributions of the confusion matrices were not homogeneous across semesters. In addition, the Population Stability Index (PSI) was calculated to quantify the degree of distributional change. The PSI value of 0.566 substantially exceeded the conventional threshold of 0.25, confirming that the new semester sample exhibited a major shift in its distribution.
Table 4.
Statistical tests for differences in distribution between semesters.
Taken together, these results indicate that the new semester cohort differed significantly from the prior cohorts in terms of distributional patterns. Such differences may reflect data drift or pre-existing cohort variations rather than direct causal effects of the intervention. Accordingly, the chi-square and PSI values are interpreted as descriptive indicators of group-level variation. The primary evidence of intervention effectiveness is instead drawn from the quasi-experimental comparison of pass rates and effect size (Cohen’s d = 0.91).
Figure 4 illustrates the weekly trends of student attendance behavior over the 18-week semester. The chart displays unexcused absence rates as blue bars and excused absence (leave) rates as orange bars. These visual indicators capture fluctuations in student participation patterns across time. Notably, the data reveal two critical periods—around weeks 6 and 12—when both unexcused and excused absences peak, suggesting heightened disengagement and potential academic risk during midterm and pre-final phases. These patterns highlight the necessity for timely, data-informed interventions that align with students’ evolving needs throughout the semester.
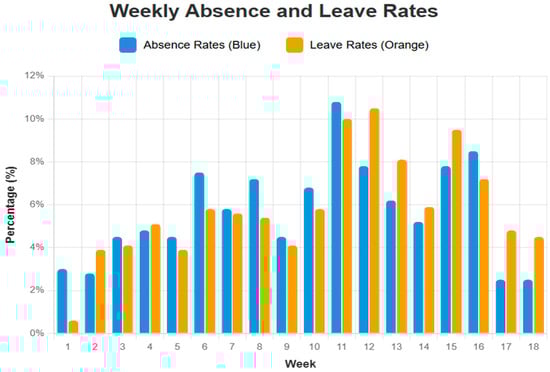
Figure 4.
Dynamic Trends in Student Attendance Behavior.
As shown in Figure 4, this study tracked both absence rates (blue) and leave rates (orange) as key indicators for determining the timing of intervention.
Results revealed an upward trend in both indicators around week 6, which led to the selection of this point as the primary prediction and intervention stage.
Although some students continued to show absenteeism during weeks 11–12, they had already been identified and received intervention at week 6. These later patterns were therefore monitored as part of ongoing tracking rather than used to retrain the model.
This design ensures that the EWS functions not only as a one-time prediction tool but also as a framework that integrates early warning with continuous follow-up.
4.2. Quasi-Experimental Analysis of Intervention Efficacy
This section presents the empirical results of Phase II, which aimed to assess the effectiveness of the dynamic early warning and intervention mechanism through a quasi-experimental design. The selected course served as the intervention context, wherein at-risk students identified by the predictive model received individualized support measures. To determine the impact of the intervention, the study compared learning outcomes between the experimental group and the control group using a combination of descriptive statistics, paired-samples t-tests, and analysis of covariance (ANCOVA). The following analysis outlines the statistical evidence supporting the intervention’s contribution to improved academic performance among high-risk students.
4.2.1. Sample Distribution and Baseline Comparison
The experimental sample consisted of 48 students, grouped based on the sixth-week EWS identification results. According to the EWS outputs, 22 students identified as at-risk were assigned to the experimental group and received individualized intervention measures, while 26 students not flagged as at-risk were placed in the control group and continued with regular instruction. To assess baseline equivalence, a one-way Analysis of Variance (ANOVA) was conducted on pretest scores. Results revealed a statistically significant difference between the two groups at baseline, F(1, 46) = 47.83, p < 0.001, with a large effect size of η2 = 0.51. Specifically, the experimental group had a substantially lower mean pretest score (M = 23.64, SD = 13.89) compared to the control group (M = 73.65, SD = 15.21). The large effect size indicates that group membership accounted for 51% of the variance in pretest scores. This result confirms the EWS’s ability to accurately identify a genuinely at-risk population, thereby validating the rationale for group assignment (see Table 5).
Table 5.
ANOVA Analysis for Pre-test Scores Between-Group Difference.
4.2.2. Within-Group Learning Trajectory Analysis
To investigate academic progress within each group, paired-samples t-tests were conducted to compare pretest and posttest scores. The results revealed contrasting learning trajectories. For the experimental group, which received individualized intervention, the improvement was statistically highly significant, t(21) = −4.28, p < 0.001. The mean score increased by 18.77 points, with a large effect size (Cohen’s d = 0.91). This notable gain suggests that the intervention was effective in reversing the academic decline of at-risk students and promoting substantial learning improvement (see Table 6).
Table 6.
Paired Samples t-test—Pre-Post Comparisons by Group Experimental Group Pre-Post Comparison.
In contrast to the experimental group, the control group—comprising students who did not receive any intervention—demonstrated a statistically significant decline in academic performance. The paired-samples t-test revealed a significant reduction in posttest scores, t(25) = 2.70, p = 0.012, with a mean decrease of 10.50 points. The effect size was moderate (Cohen’s d = 0.53), indicating a meaningful decline in learning outcomes. This unexpected performance deterioration among initially non-flagged students underscores the importance of proactive monitoring and support, as even students who appear academically stable at mid-semester may still face learning challenges without timely intervention (see Table 7).
Table 7.
Paired Samples t-test—Pre-Post Comparisons by Group Control Group Pre-Post Comparison.
4.2.3. Between-Group Comparison and Final Outcomes
Despite the experimental group’s substantially lower baseline scores, the academic gap between the two groups narrowed considerably following the intervention. Analysis of posttest scores via ANOVA revealed a statistically significant difference between groups, F(1, 46) = 5.15, p = 0.028; however, the effect size was notably smaller than that observed at baseline. The posttest η2 of 0.101 indicates that group membership accounted for only 10.1% of the variance in scores, compared to 51% in the pretest, suggesting a marked convergence in academic outcomes. This reduction in the between-group effect size provides further evidence that the intervention effectively mitigated academic disparities among at-risk students (see Table 8).
Table 8.
ANOVA Analysis for Post-test Scores Between-Group Differences.
Most critically, the analysis of final course outcomes provided robust evidence of the intervention’s cumulative impact. A one-way ANOVA comparing the final scores of the two groups revealed a statistically significant difference, F(1, 46) = 9.42, p = 0.004, with a medium effect size (η2 = 0.17). This indicates that group membership explained 17% of the variance in final academic performance. The results suggest that although performance gaps persisted at mid-semester, the effects of targeted support accumulated over time, ultimately leading to a more substantial improvement among the at-risk students by the end of the course (see Table 9).
Table 9.
ANOVA Analysis for Final Scores Between-Group Differences.
Importantly, 73% of students in the experimental group (16 out of 22) achieved a passing grade (≥60 points) in the final course assessment. Moreover, grade-level transition analysis indicated that 68% of these students improved their academic standing, markedly outperforming their counterparts in the control group. These findings suggest that the intervention not only supported learning progress but also facilitated students in overcoming critical academic thresholds.
Effect size analysis further corroborated these improvements. The experimental group’s within-group pretest-to-posttest improvement achieved a large effect size (Cohen’s d = 0.91), while the between-group difference in final scores yielded a medium-to-large effect size (Cohen’s d = 0.77). Statistical power analysis confirmed that all major tests exceeded a power threshold of 0.70, indicating sufficient sensitivity to detect true effects. A summary of effect sizes and associated statistical power levels is provided in Table 10.
Table 10.
Effect Size and Statistical Power Analysis.
4.3. Comprehensive Response to Research Questions
This section directly addresses the research questions articulated in the introduction by drawing on the empirical findings presented above.
Regarding Research Question 1, which explores how data mining techniques can effectively identify key variables for predicting students’ at-risk status, the results demonstrate that feature importance analysis successfully pinpointed the most influential predictors. Specifically, students’ “previous semester grades” served as reliable historical benchmarks, while real-time indicators such as “course attendance rates” and “timely assignment submission rates” emerged as powerful predictors of academic risk (Malini & Kalpana, 2021).
In response to Research Question 2, which examines the impact of individualized early warning and intervention strategies, the quasi-experimental findings provide robust empirical support. The data show that 73% of students in the experimental group, initially identified as at-risk, successfully met passing standards following intervention. Moreover, improvements were observed in their learning engagement behaviors, including attendance and assignment submission rates. These outcomes validate the efficacy of the “early warning–intervention” closed-loop system designed in this study. The intervention’s success is further substantiated by the large within-group effect size (Cohen’s d = 0.91).
4.4. Hypothesis Testing
This section evaluates the three core hypotheses proposed in Section 2 based on the empirical results presented in Section 4.
The first hypothesis (H1) posited that a machine learning model utilizing LMS behavioral data could accurately predict students’ academic risk. The findings provide conditional support for this hypothesis. In courses where data quality met the minimum acceptable standard, the selected predictive model achieved an Area Under the Curve (AUC) value of 0.85, indicating strong discriminative power. Moreover, the model attained a recall rate of 0.75 and an F1-score of 0.70, effectively identifying 75% of at-risk students while maintaining a balanced trade-off between precision and recall (see Table 1). These results suggest that LMS-based behavioral features can serve as robust indicators in EWS for risk detection, although their effectiveness remains contingent on the completeness and reliability of course-level data.
The second hypothesis (H2) suggested that culturally responsive and personalized intervention strategies could significantly enhance at-risk students’ academic outcomes. This hypothesis also receives strong empirical support. Students in the experimental group, after receiving individualized support, exhibited statistically significant improvement in academic performance, with an average gain of 18.77 points (p < 0.001). The magnitude of this improvement is underscored by a large effect size (Cohen’s d = 0.91), indicating substantial educational relevance. Notably, 73% of the originally identified at-risk students successfully passed the course following intervention, illustrating the practical impact of the tailored support system (see Table 6, Table 9 and Table 10).
The third hypothesis (H3) proposed that the degree of socio-technical integration moderates the educational effectiveness of the EWS. Although this construct was not directly measured, the overall findings offer compelling inferential support. The system’s success was contingent upon the interplay between its technical and social components. Technically, the EWS demonstrated high accuracy in identifying at-risk students (Table 5). This identification enabled timely activation of personalized interventions through instructors and academic advisors. The positive educational outcomes observed—including significant academic gains in the experimental group (Table 6) and the narrowing of the performance gap between groups (Table 8)—can be interpreted as a result of this integrated socio-technical mechanism. Therefore, the system’s educational efficacy appears to be moderated by the seamless coordination between algorithmic detection and human-led intervention, thus substantiating the third hypothesis.
5. Discussion, Conclusions and Recommendations
This chapter interprets the findings in relation to the research questions, outlines theoretical and practical implications, and concludes with directions for future work.
5.1. Interpretation of Key Findings and Theoretical Implications
This study’s findings confirm that a predictive model balancing high performance (Balanced AUC = 0.85) with interpretability is fundamental to a successful EWS, offering strong support for Hypothesis 1 (H1). More importantly, the study provides compelling causal evidence for the effectiveness of individualized interventions, directly validating Hypothesis 2 (H2). The large effect size observed (Cohen’s d = 0.91) ranks among the most robust reported in the learning analytics literature. For context, recent meta-analyses of educational technology interventions generally report moderate effects (d = 0.3–0.5) (Sung et al., 2016). The remarkable efficacy observed in this study can be attributed to three interrelated factors: (1) the precision of algorithmic risk detection, (2) the cultural alignment of intervention design, and (3) the integration of diverse institutional support services. Notably, 73% of initially at-risk students achieved passing grades—a substantial improvement over the historical average failure rate of 45%—reflecting a 28% absolute increase in academic success.
In relation to the research questions, these results further illustrate that effective early warning models should integrate both historical academic performance and current behavioral engagement to enhance predictive accuracy and relevance. By combining stable indicators such as previous semester grades with dynamic signals like attendance rates and timely assignment submissions, the model demonstrates how data mining techniques can generate robust predictions of academic risk. Moreover, the quasi-experimental findings confirm that individualized early warning and intervention strategies significantly improve both pass rates and engagement behaviors, supported by a large within-group effect size (Cohen’s d = 0.91). Collectively, these findings validate the “early warning–intervention” closed-loop system and provide strong empirical justification for the implementation of culturally responsive EWS.
These outcomes provide empirical support for Hypothesis 3 (H3), affirming the utility of a socio-technical systems framework. The success of the EWS was not solely due to algorithmic sophistication, but rather its capacity to trigger culturally sensitive, human-centered support networks. This result aligns with the Social Cognitive Theory’s emphasis on environmental supports (Bandura, 1991) and extends the Self-Regulated Learning Theory (Zimmerman, 2002) by demonstrating how culturally informed external regulation can scaffold and enhance learners’ self-regulation capacities (Hooshyar et al., 2023).
5.2. Cross-Cultural Learning Analytics: The Role of Context
Our research contributes to the emerging field of cross-cultural learning analytics by empirically demonstrating how Confucian educational values influence the effectiveness of early warning and intervention systems. In the Taiwanese context, the hierarchical structure of teacher-student relationships amplified the motivational impact of instructor-mediated interventions. This culturally embedded dynamic contrasts with Western contexts, where student autonomy and self-initiated help-seeking are often emphasized (Gašević et al., 2015), highlighting the necessity of culturally adaptive design principles in educational technologies. Recent scholarship in cross-cultural learning analytics has similarly emphasized the role of cultural context. For example, Viberg et al. (2024) identified substantial cross-national differences in students’ privacy concerns, while Zhou (2023) demonstrated the success of AI-based personalized learning approaches within Chinese higher education. Building on this foundation, our study advances the field by offering fine-grained insights into how Confucian educational values shape intervention outcomes, thereby enriching the theoretical discourse on cultural responsiveness in learning analytics systems.
Furthermore, our work resonates with broader developments in learning analytics governance and the global movement toward precision education. The proposed “predict–intervene–evaluate” framework exemplifies a socio-technical integration that prioritizes not only predictive accuracy but also ethical, pedagogical, and contextual alignment. This model addresses the concerns articulated in the literature regarding the ethical dimensions of learning analytics, and aligns with a vision for precision education tailored to individual learning trajectories (Ifenthaler & Yau, 2020). These findings underscore the imperative for technological innovation in education to evolve alongside institutional governance frameworks, ensuring both student well-being and pedagogical innovation.
5.3. Methodological Contributions to Learning Analytics Research
This study addresses a critical gap in the learning analytics literature by completing the full prediction–intervention–evaluation cycle through a rigorous quasi-experimental design. While much of the existing research in this field prioritizes predictive accuracy, it often neglects to evaluate the practical impact of interventions—an omission that weakens the field’s claims of improving educational outcomes (Gašević et al., 2015). By implementing a two-phase methodology that integrates both algorithmic risk identification and empirically validated intervention outcomes, this research demonstrates how learning analytics can move beyond correlational analysis toward causal inferences about educational effectiveness. In doing so, it offers a replicable framework for advancing evidence-based educational innovation and underscores the necessity of embedding robust evaluation mechanisms in future learning analytics initiatives.
5.4. Practical and Policy Implications
5.4.1. Practical Recommendations for Institutions
The findings of this study provide a replicable blueprint for designing data-driven student support systems in higher education. To effectively implement early warning and intervention mechanisms, institutions must foster cross-departmental collaboration that integrates the efforts of course instructors, academic advisors, and student support centers. Equally important is the need to empower faculty members with data literacy skills, enabling them to interpret learning analytics outputs and respond with pedagogically meaningful actions. Moreover, ethical system design must be prioritized, with a commitment to de-stigmatization, student privacy protection, and institutional transparency. These principles are essential for cultivating trust in technology-enhanced educational environments and ensuring that predictive systems are used in ways that empower rather than penalize students.
From an educational standpoint, this outcome is also consistent with the principle that it is “better to over-warn than under-warn.” In practice, slightly increasing false positives is considered acceptable if it ensures that the majority of truly at-risk students are identified in time for intervention. By prioritizing sensitivity and recall, the system maximizes opportunities for early support, even at the cost of occasionally flagging students who ultimately succeed without assistance. Such a precautionary orientation reflects the ethical responsibility of higher education institutions to err on the side of inclusion when providing academic support, thereby reinforcing the role of Early Warning Systems as both predictive tools and student-centered intervention mechanisms.
5.4.2. Policy Implications for Higher Education
The findings of this study carry significant implications for higher education policy in the era of digital transformation (Eynon, 2013). As institutions around the world continue to invest in sophisticated learning analytics infrastructures, our research underscores a critical point: technological advancement alone is not sufficient to ensure educational effectiveness. Rather, implementation efforts must be rooted in local educational cultures and guided by an iterative refinement process. A recommended approach involves initiating pilot programs within select departments, where feedback can be systematically collected and used to adjust system design before broader deployment across the institution. Policy development should thus prioritize the integration of cultural competency into the design and application of educational technologies, recognizing the diversity of student populations and learning environments. Concurrently, sustained investment in faculty development programs is essential, particularly those that bridge the gap between data literacy and pedagogical practice, enabling instructors to make informed decisions based on learning analytics insights. Moreover, the establishment of ethical governance frameworks is imperative, ensuring a balanced approach that protects student privacy and autonomy while enabling actionable prediction. To promote generalizability and equity, institutions should also consider forming cross-institutional research collaborations aimed at validating predictive and intervention mechanisms in diverse educational and cultural contexts (Naim, 2025).
5.5. Limitations and Future Research Directions
5.5.1. Methodological Limitations
Although the quasi-experimental design employed in this study provides stronger causal inferences than correlational studies, the absence of randomization limits the ability to fully control for selection bias and the potential influence of unobserved variables (e.g., motivation, personality traits). Consequently, the findings of this study should be interpreted as evidence of an association between the Early Warning System (EWS) intervention and learning outcomes, rather than as definitive proof of causality. Future research should employ randomized controlled trials (RCTs) where ethically feasible, or incorporate more rigorous matching or stratification methods within quasi-experimental designs to enhance causal inference.
The empirical implementation was restricted to a single general education course, and the intervention’s success was contingent upon the instructor’s willingness to participate. These conditions suggest that the results should be regarded as a demonstration of local success rather than as universal evidence of effectiveness. The contribution of this study lies in illustrating how the EWS framework can be integrated into an authentic teaching context, rather than asserting its universal applicability. Furthermore, due to the absence of a parallel control group representing other cultural orientations (e.g., Western emphases on autonomy or inquiry), this study cannot rigorously determine whether cultural adaptation is superior to structured support per se. Future studies should broaden the scope to include multiple courses, instructors, and institutions, and adopt cross-cultural experimental designs to more clearly distinguish the relative effects of cultural adaptation and structured support.
5.5.2. Future Research
Future research should pursue several interrelated directions to extend the contributions of this study.
First, systematic replication across different cultural contexts is necessary to distinguish universal success factors from those that are culturally specific, thereby strengthening the cross-cultural validity of early warning and intervention systems.
Second, longitudinal studies spanning multiple semesters are essential to assess the sustainability of intervention effects and to understand how early support influences long-term academic trajectories and the development of self-regulation skills.
Third, future work should advance the design of precision interventions by developing algorithms capable of matching specific intervention types to individual risk profiles and learning needs, ensuring both efficiency and personalization in support delivery.Finally, integrating quantitative behavioral analytics with qualitative insights into student experiences and institutional implementation processes will provide a more holistic understanding of system effectiveness, enabling researchers and practitioners to address both technical performance and human-centered adoption challenges.
5.6. Conclusions
This research confirms that effective learning analytics systems are not standalone technological artifacts but complex socio-technical systems that must be carefully contextualized to align with local cultural norms and institutional structures. The study empirically validated an integrated framework wherein accurate algorithmic prediction triggered culturally informed interventions, yielding significant and sustained improvements in the academic performance of at-risk students. These findings underscore the necessity of embedding predictive technologies within responsive human systems to ensure practical educational impact.
Moreover, the linguistic and cultural heterogeneity inherent in global higher education systems presents both challenges and opportunities for adaptation. To enhance the generalizability of the proposed early warning and intervention mechanism, future research should explore its transferability across diverse language environments and sociocultural settings. Variables such as teacher authority, students’ help-seeking behaviors, and classroom interaction norms may critically shape the system’s acceptance and effectiveness. Cross-cultural comparative studies are thus recommended to examine how sociocultural dynamics mediate system performance and inform context-sensitive design choices. Insights from such research could guide the localization of algorithmic thresholds, interface layouts, and intervention protocols, thereby promoting both international scalability and contextual fidelity.
The primary theoretical contribution of this study lies in the empirical validation of the socio-technical systems framework in a non-Western educational context, extending the scope of learning analytics beyond predominantly Western paradigms. In doing so, this research advances the emerging discourse on cross-cultural learning analytics and offers a model that is both operationalizable and ethically responsive. Institutions aiming to build equitable, data-informed support structures may draw upon this framework to ensure that technological innovation is aligned with local pedagogical values and student needs.
Author Contributions
Conceptualization, Y.-H.C.; methodology, Y.-H.C.; data curation, F.-C.C.; writing—original draft preparation, F.-C.C.; writing—review and editing, Y.-H.C.; supervision, C.-I.L. All authors have read and agreed to the published version of the manuscript.
Funding
This research received no external funding.
Institutional Review Board Statement
Not applicable.
Informed Consent Statement
Not applicable.
Data Availability Statement
The data that support the findings of this study are available on request from the corresponding author. The data are not publicly available due to privacy or ethical restrictions.
Acknowledgments
During the preparation of this manuscript, the authors used ChatGPT (OpenAI, GPT-4.0, 2025) for the purposes of drafting selected sections of the text, suggesting methodological alternatives, and supporting the interpretation of findings. The authors have reviewed and edited the output and take full responsibility for the content of this publication.
Conflicts of Interest
The authors declare no conflicts of interest.
Appendix A. Glossary of Model Predictors
Table A1.
Glossary of Model Predictors and Information Value (IV).
Table A1.
Glossary of Model Predictors and Information Value (IV).
| Field Name | Data Source | Definition | Range/Values | Field Attribute | Information Value (IV) |
|---|---|---|---|---|---|
| year | Student Database | Academic year | 106, 111 | ||
| master | Student Database | Semester (upper/lower term) | 1 (upper term) | ||
| code | Student Database | Course code | Numeric code (e.g., 113015) | ||
| score | Student Database | Student course grade | 0–100 | 0.12 | |
| rebuild | Student Database | Whether the student retook the course | Y/N | Analytical Unit | 0.04 |
| Ranking | Student Database | Student’s class ranking | 1–100 | ||
| leave | Student Database | Number of official leaves | 0–10 | Analytical Unit | 0.83 |
| Absence | Student Database | Number of absences | 0–10 | Analytical Unit | 0.85 |
| gender | Student Database | Student gender | Male/Female | Analytical Unit | 0.14 |
| identity | Student Database | Student identity status | General, disadvantaged, indigenous, overseas Chinese, foreign | Analytical Unit | 0.20 |
| Graduated_school | Student Database | Type of high school graduated | General HS, vocational HS, etc. | Analytical Unit | 0.54 |
| teacher_trainee | Student Database | Whether student is in teacher training | 0, 1 | Analytical Unit | 0.08 |
| extension_student | Student Database | Whether student is in extension program | 0, 1 | Analytical Unit | 0.12 |
| English_inspection | Student Database | Whether passed English proficiency test | Y/N | Analytical Unit | 0.21 |
| Transfer_lineage | Student Database | Whether transfer student | 0, 1 | Analytical Unit | 0.05 |
| Double_major | Student Database | Whether double major | 0, 1 | Analytical Unit | 0.05 |
| mid_score | Student Database | Midterm exam grade | 0–100 | ||
| end_score | Student Database | Final exam grade | 0–100 | ||
| subsidies | Student Database | Whether receiving subsidies | Y/N | Analytical Unit | 0.33 |
| exemption | Student Database | Whether course exemption | Y/N | Analytical Unit | 0.01 |
| loan | Student Database | Whether receiving student loan | Y/N | Analytical Unit | 0.06 |
| counseling | Student Database | Whether the student received counseling services | Y/N | Analytical Unit | 0.03 |
| NoPass | Student Database | Whether the student failed the course | Y/N | Target Variable |
Y/N denotes a binary indicator: Y = Yes; N = No. IV = Information Value.
References
- Alyahyan, E. A., & Düştegör, D. (2020). Predicting academic success in higher education: Literature review and best practices. International Journal of Educational Technology in Higher Education, 17, 3. [Google Scholar] [CrossRef]
- Arnold, K. E., & Pistilli, M. D. (2012, April 29–May 2). Course signals at Purdue: Using learning analytics to increase student success. 2nd International Conference on Learning Analytics and Knowledge, Vancouver, BC, Canada. [Google Scholar] [CrossRef]
- Azizah, Z., Ohyama, T., Zhao, X., Ohkawa, Y., & Mitsuishi, T. (2024). Predicting at-risk students in the early stage of a blended learning course via machine learning using limited data. Computers and Education: Artificial Intelligence, 7, 100261. [Google Scholar] [CrossRef]
- Bandura, A. (1991). Social cognitive theory of self-regulation. Organizational Behavior and Human Decision Processes, 50(2), 248–287. [Google Scholar] [CrossRef]
- Bañeres, D., Rodríguez-González, M. E., Guerrero-Roldán, A.-E., & Cortadas, P. (2023). An early warning system to identify and intervene online dropout learners. International Journal of Educational Technology in Higher Education, 20(3), 3. [Google Scholar] [CrossRef]
- Chen, Y., Sun, J., Wang, J., Zhao, L., Song, X., & Zhai, L. (2025). Machine learning-driven student performance prediction for enhancing tiered instruction. arXiv, arXiv:2502.03143. [Google Scholar] [CrossRef]
- Chen, Y., & Zhai, L. (2023). A comparative study on student performance prediction using machine learning. Education and Information Technologies, 28, 12039–12057. [Google Scholar] [CrossRef]
- Dutt, A., Ismail, M. A., & Herawan, T. (2017). A systematic review on educational data mining. IEEE Access, 5, 15991–16005. [Google Scholar] [CrossRef]
- Eynon, R. (2013). The rise of big data: What does it mean for education, technology, and media research? In Learning, media and technology (Vol. 38, pp. 237–240). Taylor & Francis. [Google Scholar]
- Fahd, K., Venkatraman, S., Miah, S. J., & Ahmed, K. (2021). Application of machine learning in higher education to assess student academic performance, at-risk, and attrition: A meta-analysis of literature. Education and Information Technologies, 27, 3743–3775. [Google Scholar] [CrossRef]
- Ferguson, R. (2012). Learning analytics: Drivers, developments and challenges. International Journal of Technology Enhanced Learning, 4(5–6), 304–317. [Google Scholar] [CrossRef]
- Gašević, D., Dawson, S., & Siemens, G. (2015). Let’s not forget: Learning analytics are about learning. TechTrends, 59(1), 64–71. [Google Scholar] [CrossRef]
- Gray, G., Schalk, A. E., Cooke, G., Murnion, P., Rooney, P., & O’Rourke, K. C. (2022). Stakeholders’ insights on learning analytics: Perspectives of students and staff. Computers & Education, 187, 104550. [Google Scholar] [CrossRef]
- Hooshyar, D., Tammets, K., Ley, T., Aus, K., & Kollom, K. (2023). Learning analytics in supporting student agency: A systematic review. Sustainability, 15(18), 13662. [Google Scholar] [CrossRef]
- Hsieh, P.-S., & Shih, M. (2020). Students’ early alert systems in taiwanese universities: A study of current uses and restrictions. Journal of Research in Education Sciences, 65(4), 171–201. [Google Scholar]
- Huang, A. Y. Q., Chang, J. W., Yang, A. C. M., Ogata, H., Li, S. T., Yen, R. X., & Yang, S. J. H. (2023). Personalized intervention based on the early prediction of at-risk students to improve their learning performance. Educational Technology & Society, 26(4), 69–89. [Google Scholar]
- Ifenthaler, D., & Yau, J. Y.-K. (2020). Utilising learning analytics to support study success in higher education: A systematic review. Educational Technology Research and Development, 68(4), 1961–1990. [Google Scholar] [CrossRef]
- Institution, T. B. (2016). Education in Taiwan: Taiwan’s colleges and universities. Available online: https://www.brookings.edu/articles/education-in-taiwan-taiwans-colleges-and-universities/ (accessed on 5 October 2025).
- Kember, D., & David, L. (2009). Promoting student-centred forms of learning. Canada Teachers’ College Press. [Google Scholar]
- López-Meneses, E., Mellado-Moreno, P. C., Gallardo Herrerías, C., & Pelícano-Piris, N. (2025). Educational data mining and predictive modeling in the age of artificial intelligence: An in-depth analysis of research dynamics. Computers, 14(2), 68. [Google Scholar] [CrossRef]
- Macfadyen, L. P., & Dawson, S. (2010). Mining LMS data to develop an “early warning system” for educators: A proof of concept. Computers & Education, 54(2), 588–599. [Google Scholar] [CrossRef]
- Malini, J., & Kalpana, Y. (2021). Analysis of factors affecting student performance evaluation using education dataminig technique. Turkish Journal of Computer and Mathematics Education, 12(7), 2413–2424. [Google Scholar]
- Naim, A. (2025). Equity across the educational spectrum: Innovations in educational access crosswise all levels. Frontiers in Education, 9, 1499642. [Google Scholar] [CrossRef]
- News, T. (2024). Taiwan’s university admission rate lowest in four years at 94%. Available online: https://taiwannews.com.tw/news/5919671 (accessed on 5 October 2025).
- Oliveira, C. F. d., Sobral, S. R., Ferreira, M. J., & Moreira, F. (2021). How does learning analytics contribute to prevent students’ dropout in higher education: A systematic literature review. Big Data and Cognitive Computing, 5(4), 64. [Google Scholar] [CrossRef]
- Pardo, A., Jovanovic, J., Dawson, S., Gašević, D., & Mirriahi, N. (2019). Using learning analytics to scale the provision of personalised feedback. British Journal of Educational Technology, 50(1), 128–138. [Google Scholar] [CrossRef]
- Romero, C., & Ventura, S. (2020). Educational data mining and learning analytics: An updated survey. Wiley Interdisciplinary Reviews: Data Mining and Knowledge Discovery, 10(3), e1355. [Google Scholar] [CrossRef]
- Sadi, M., Chowdhury, I. A., Roy, N., Md Nazim, H., & Nandi, D. (2023). Investigation of student dropout problem by using data mining technique. International Journal of Education and Management Engineering, 13(5), 43. [Google Scholar] [CrossRef]
- Selwyn, N. (2019). What’s the problem with learning analytics? Journal of Learning Analytics, 6(3), 11–19. [Google Scholar] [CrossRef]
- Shafiq, D. A., Marjani, M., Habeeb, R. A. A., & Asirvatham, D. (2022). Student retention using educational data mining and predictive analytics: A systematic literature review. IEEE Access, 10, 72480–72503. [Google Scholar] [CrossRef]
- Siemens, G., & Gasevic, D. (2012). Guest editorial-learning and knowledge analytics. Journal of Educational Technology & Society, 15(3), 1–2. [Google Scholar]
- Smolkowski, K., & Cummings, K. D. (2015). Evaluation of diagnostic systems: The selection of students at risk of academic difficulties. Assessment for Effective Intervention, 41(1), 41–54. [Google Scholar] [CrossRef]
- Stratton, T. P., Janetski, B. K., Ray, M. E., Higginbotham, M. C., Lebovitz, L., & Martin, B. A. (2022). Detection of academic early warning signs and effective intervention “takes a village”. American Journal of Pharmaceutical Education, 86(7), 8743. [Google Scholar] [CrossRef] [PubMed]
- Sung, Y.-T., Chang, K.-E., & Liu, T.-C. (2016). The effects of integrating mobile devices with teaching and learning on students’ learning performance: A meta-analysis and research synthesis. Computers & Education, 94, 252–275. [Google Scholar] [CrossRef]
- Swets, J. A. (1988). Measuring the accuracy of diagnostic systems. Science, 240(4857), 1285–1293. [Google Scholar] [CrossRef]
- Trist, E. L., & Bamforth, K. W. (1951). Some social and psychological consequences of the longwall method of coal-getting: An examination of the psychological situation and defences of a work group in relation to the social structure and technological content of the work system. Human Relations, 4(1), 3–38. [Google Scholar] [CrossRef]
- Vaarma, M., & Li, H. (2024). Predicting student dropouts with machine learning: An empirical study in Finnish higher education. Technology in Society, 76, 102474. [Google Scholar] [CrossRef]
- Viberg, O., Kizilcec, R. F., Jivet, I., Monés, A. M., Oh, A., Mutimukwe, C., Hrastinski, S., & Scheffel, M. (2024). Cultural differences in students’ privacy concerns in learning analytics across Germany, South Korea, Spain, Sweden, and the United States. Computers in Human Behavior Reports, 14, 100416. [Google Scholar] [CrossRef]
- Vygotsky, L. S., & Cole, M. (1978). Mind in society: Development of higher psychological processes. Harvard University Press. [Google Scholar]
- Walkington, C., & Bernacki, M. L. (2021). Making classroom learning personalized. APA Division 15 Policy Brief Series, 1(4), 1–6. Available online: https://apadiv15.org/making-classroom-learning-personalized/ (accessed on 5 October 2025).
- Yuan, X. (2023). Confucian or confusion? Analyses of international students’ self-rated intercultural sensitivity and its sociocultural predictors at Canadian universities. Frontiers in Education, 8, 1239177. [Google Scholar] [CrossRef]
- Zhou, C. (2023). Integration of modern technologies in higher education on the example of artificial intelligence use. Education and Information Technologies, 28(4), 3893–3910. [Google Scholar] [CrossRef]
- Zimmerman, B. J. (2002). Becoming a self-regulated learner: An overview. Theory into Practice, 41(2), 64–70. [Google Scholar] [CrossRef]


Disclaimer/Publisher’s Note: The statements, opinions and data contained in all publications are solely those of the individual author(s) and contributor(s) and not of MDPI and/or the editor(s). MDPI and/or the editor(s) disclaim responsibility for any injury to people or property resulting from any ideas, methods, instructions or products referred to in the content. |
© 2025 by the authors. Licensee MDPI, Basel, Switzerland. This article is an open access article distributed under the terms and conditions of the Creative Commons Attribution (CC BY) license (https://creativecommons.org/licenses/by/4.0/).