Article

Sequence Analysis-Enhanced AI: Transforming Interactive E-Book Data into Educational Insights for Teachers

by
Yaroslav Opanasenko
,
Emanuele Bardone
,
Margus Pedaste
* and
Leo Aleksander Siiman
Institute of Education, University of Tartu, 50416 Tartu, Estonia
*
Author to whom correspondence should be addressed.
Educ. Sci. 2025, 15(1), 28; https://doi.org/10.3390/educsci15010028
Submission received: 26 October 2024 / Revised: 12 December 2024 / Accepted: 27 December 2024 / Published: 31 December 2024

Abstract

:
This study explores the potential of large language models as interfaces for conducting sequence analysis on log data from interactive E-Books. As studies show, qualitative methods are not sufficient to comprehensively study the process of interaction with interactive E-Books. The quantitative method of educational data mining (EDM) has been considered as one of the most promising approaches for studying learner interactions with E-Books. Recently, sequence analysis showed potential in identifying typical patterns of interaction from log data collected from the Estonian Interactive E-Book Platform Opiq, allowing one to see the types of sessions from students in different grades, clusters of students based on the amount of the content they studied, and the interaction type they preferred. The main goal of the present study is to understand how teachers can utilize insights from CustomGPT to enhance their understanding of students’ interaction strategies with digital learning environments (DLEs) such as Opiq, and what the potential areas for further development of such tools are. We specified the process for developing a chatbot for transferring teachers’ queries into sequence analysis results and gathered feedback from teachers, allowing us both to estimate current design solutions to make sequence analysis results available and to find potential vectors of its development. Participants provided explicit feedback on CustomGPT, appreciating its potential for group and individual analysis, while suggesting improvements in visualization clarity, legend design, descriptive explanations, and personalized tips to better meet their needs. Potential areas of development, such as integrating personalized learning statistics, enhancing visualizations and reports for individual progress and mitigating AI hallucinations by expanding training data, are described.

1. Introduction

One of the potential domains of AI application in education can be making the results of educational data mining more accessible for teachers using CustomGPT both as an environment for data analysis and as a language interface providing more user-friendly access to the results, along with ideas on its further implementation. In this study, we focus on the developing design of CustomGPT as a tool for making the results of sequence analysis applied on Estonian interactive E-Book Opiq’s log data accessible for teachers.
Educational data mining (EDM) is a field that focuses on analyzing data from educational settings to better understand students’ learning processes, predict student performance, identify at-risk students, and personalize learning experiences. EDM can analyze students’ interaction logs within learning management systems to detect disengagement and provide timely interventions (Baker & Inventado, 2014; Romero & Ventura, 2020). Moreover, the integration of EDM with learning analytics enables a deeper analysis of learning environments, enhancing the efficacy of educational tools and pedagogical strategies (Siemens & Long, 2011). The application of EDM has also been instrumental in adaptive learning technologies, which adjust content delivery based on individual student needs, thereby fostering more effective and personalized learning experiences (Koedinger et al., 2015; Pechenizkiy et al., 2009). Sequence analysis can be used to examine the diversity of learning experiences (in particular, the strategies students use to learn).
Sequence analysis is “a categorical longitudinal modeling procedure with a holistic approach that allows the inclusion of the trajectories of a set of objects, stating all states of interest experienced within a specific timeframe, to create categorical sequences and produce a typology or clustering classification” (Tan & Samavedham, 2022). Sequence analysis allows the contextualization of events, their relationships with each other, and the effects of part or the whole sequence (Abbott, 1995). At the beginning of its transition from genetics to social science, sequence analysis life course research is one of the most prominent applications of the procedure. Researchers study the sequences of life events such as education (Haas, 2022), employment (Aisenbrey & Fasang, 2010), marriage (Elzinga & Liefbroer, 2007), and parenthood (Macmillan & Copher, 2005) to understand how these trajectories influence individuals’ lives. In the early 2000s, sequence analysis started to be applied in educational science, showing a growing trend; according to the literature review on sequence analysis application in educational science (Valle Torre et al., 2023), a total of 13 articles were published in 2010–2015, while an equal number were published in 2022. At the beginning of its application in a new field, sequence analysis has mainly been used similarly to social science studies to discover educational trajectories during life. Recently, more and more studies have been devoted to using sequence analysis to analyze students’ interaction processes, revealing students’ patterns in interacting with different Digital Learning Environments (DLE) (Tan & Samavedham, 2022; Kleinman et al., 2022; Opanasenko et al., 2023; Opanasenko et al., 2024).
Interactive E-Books are one of the areas where sequence analysis can be applied; since they provide a variety of possible interactions, users may apply different strategies of using them. Previous studies show (Opanasenko et al., 2024), that some of these strategies might cover only a small fraction of the presented content; others, such as (Wang et al., 2020), show, that students even tend to use E-Books without taking any meaningful strategy. Teachers might not be aware of the strategies students apply when some of them are ineffective and other strategies might be more effective for specific context. Therefore, awareness about these data would empower teachers in guiding students’ learning.
Considering that sequence analysis provides more detailed information about various aspects of student interaction within the educational process, this information can be important for subsequent interventions. Broad visualization capabilities of sequence analysis allow it to be considered as a statistical tool for teachers. The main problem with teachers’ access to the analysis of educational log data is the high requirements for data analysis skills and time resources. AI, which is already being actively used in the field of education, may be the solution to this problem by working both as an environment for automatized data-analysis and as a language interface to access results.
The research questions of the study are the following:
RQ1: What information about the process of students’ interaction with DLE Opiq do teachers need in their practice?
RQ2: What are teachers’ perspectives on the design and development of the developed CustomGPT that would help to make the results of sequence analysis available for teachers?
RQ3: What are the possible areas of development of the developed CustomGPT for making the results of sequence analysis available for teachers?
To answer the research questions, we developed a chatbot in the ChatGPT environment, which allows teachers to upload log data generated by DLE (in our case—the interactive E-Book Opiq). The data processing functionality of CustomGPT has already been applied in the educational field, with studies highlighting its use in developing tools for learning anatomy (Collins et al., 2024), generating strategic recommendations for institutional planning (Chukhlomin, 2024), providing flexible scientific writing assistance (Kabir et al., 2024), and creating quizzes based on provided data (Pandya & Tatikonda, 2023). In our study, we expand on this functionality by utilizing CustomGPT’s capability to process uploaded data through Python scripts, enabling more advanced and customized analyses. This eliminates the need for teachers to navigate complex databases or analytics tools: teachers can interactively explore data through a conversational interface, asking follow-up questions, and diving deeper into specific areas of interest without needing advanced technical skills. Scripts for sequence analysis were developed and uploaded to the CustomGPT environment. Besides sequence analysis scripts processing, CustomGPT also provides teachers with a description of graphs and tips for teachers based on this processing. Focus group interviews with two groups of educators (Estonian teachers who were PhD students at the time and international master’s degree students at University of Tartu) were conducted to study teachers’ perspectives on the value of information about students’ strategies of interaction with Opiq and their overall impression of CustomGPT.

2. Literature Review

2.1. Potential of Generative AI in Education

Generative AI (GenAI) belongs to the family of machine-learning techniques, referring to algorithms and models that can generate content in the form of pictures, texts, videos, and sounds from existing resources, typically scrapped from the Internet (García-Peñalvo & Vázquez-Ingelmo, 2023). Generative large language models (LLMs) are a particular example of GenAI, as they can generate text typically based off a prompt, which is nothing but an input for the generation of an output (Schulhoff et al., 2024). Generative LLMs can perform a series of tasks, such as summarizing or translating. One of the key features is that they can enact this through interactions mimicking a dialogue with the user (Chiarello et al., 2024). The ability to engage users in open-ended dialogue-based interactions gave rise to chatbots of which ChatGPT—technically built on a “generative pre-trained transformer”—is the most well-known and widely used.
The possibility of relying on a conversational user interface is one of the reasons for the tremendous success of chatbots such as ChatGPT; however, it is also the source of one of the major drawbacks and limitations. The term “hallucination” has been used to refer to the specific phenomenon of generative LLMs producing “unfaithful or nonsensical text” (Ji et al., 2022). Hallucinations cover a wide range of undesirable outcomes in interactions with chatbots like ChatGPT, such as factual inconsistencies, contradictions and, more generally, any kind of content that, while being seemingly realistic, is simply not (McIntosh et al., 2024). While in some cases, hallucinations can be easily debunked, for example, when two contradictory statements occur in the same text, in others the generated output simply evades our ability to check sources, and therefore the reliability and/or accuracy of what has been produced (Ji et al., 2022). It is worth noting that hallucinations are not bugs but the fundamental features of generative LLMs, which occur when they go beyond training data (Yao et al., 2023).
In order to minimize (but not fully prevent) the detrimental impacts of hallucinations, OpenAI provided a service that allows users to create and then share custom chatbots—custom GPTs. Advertised by OpenAI as a way of creating a ChatGPT for a specific purpose, those chatbots are essentially using (1) prompt tuning and (2) resorting to external knowledge (Zhao et al., 2023). Prompt tuning means that specific instructions are provided to guide the behavior of the chatbot. In this way, the creator can steer the interactions that users will have with the GPT in certain directions rather than others. The second aspect involves adding external resources to mitigate the issues related to hallucinations. The custom GPT can be specifically instructed to rely on that external knowledge base.
The above-mentioned features (tuning prompts and access to external data) of CustomGPT have significantly increased the potential of using AI in education. Nowadays, educators are finding more and more ways to apply this technology in both teaching and learning. One of the most popular uses has been the assessment of student work (Almasre, 2024) and providing feedback based on processed text (Fuller et al., 2024). Another application found was creating CustomGPTs as assistants for searching educational and academic materials upon request (Alfirević et al., 2024). The functionality of CustomGPT has expanded these tasks: CustomGPTs playing specific roles for conversational trainings have emerged: in addition to responding to student queries, some CustomGPTs have been trained to ask thought-provoking questions (Honig et al., 2024). Another potentially important feature of CustomGPT is the ability to not only generate scripts upon request but also execute them using Python. This opens a third vector for using AI in education: in addition to learning and teaching, CustomGPT can be used for educational data mining. In our opinion, this approach leverages all the strengths of CustomGPT: by providing external data (in our case, log data) and code for analysis, the prompt-based language interface is used to simplify access to the results.

2.2. Sequence Analysis as a Visualization Tool

Sequence-nature data, which track the order of events or measurements, are pivotal in numerous scientific fields for understanding temporal patterns and causations. In their systematic review (Guo et al., 2022) explore how visual analytics techniques are leveraged to analyze event sequence data, which are prominent in various fields like healthcare, cybersecurity, advertising, sociology, and educational science. The authors have proposed a classification to categorize and evaluate different methods based on different approaches to visualization: e.g., timeline-based visualizations that are frequently adopted to emphasize temporal ordering of events (Plaisant et al., 1996; Wang et al., 2008), hierarchy-based visualizations (Figure 1.3) (Wongsuphasawat et al., 2011; Bostock & Heer, 2009), Sankey-based methods (Figure 1.1) (Riehmann et al., 2005), matrix-based visualizations (Figure 1.2) (Zhao et al., 2015), and chart-based visualizations (Malik et al., 2016). Examples are presented in Figure 1.
Chart-based visualization is also one of the most-used approaches to present results of sequence analysis in social science. Visualization is used in sequence analysis to provide a more efficient and effective manner of data analysis (Healy & Moody, 2014). The R-package TraMineR has become an important step in the evolution of sequence analysis visualization, providing different ways of data representation (Bürgin & Ritschard, 2014). Fasang and Liao (Fasang & Liao, 2014) distinguish two main groups of graphs for sequence analysis: data summarization and data representation. While data summarization graphs are more focused on typical sequences of observed states/actions, data representation graphs allow for the plotting of individual sequences. These two main approaches are crucial for sequence analysis and can be used together to both display overall trends in the data and draw attention to individual cases. This potential of sequence analysis can be particularly relevant when using sequence analysis as a tool for student interaction statistics for teachers: teachers will be able to assess both patterns characteristic of certain groups of students (e.g., a class) and track sequences in individual cases (e.g., a student’s interaction with specific content).
Different data summarization graphs techniques might be used to represent different aspects of sequence data:
The Transition plot (Tan & Samavedham, 2022) (Figure 1.7) visualizes the probabilities or frequencies of transitioning from one state to another. This is useful for understanding the dynamics within the sequences, such as common transitions or rare shifts between states.
The Sequence Frequency Plot (Figure 1.4 and Figure 1.5) (Opanasenko et al., 2023; Opanasenko et al., 2024) shows the frequencies or relative frequencies of different sequences within the dataset. It helps identify the most common or rare sequences and can be useful as a starting point for focusing on particular types of sequences.
The State Distribution Plot (Fasang & Liao, 2014) shows the distribution of different states across all sequences at each point in time or across specified time intervals. It helps in understanding how the distribution of states evolves over time.
Data representation is usually presented by the Sequence Index Plot (Figure 1.6) (Helske et al., 2024), which displays individual sequences in a stacked manner, where each sequence is represented as a horizontal bar composed of different colors representing different states or events. This visualization is useful for giving a quick overview of the entire dataset, allowing patterns, common sequences, and outliers to be visually identified.
Sequence analysis can be also used together with cluster analysis to derive and visualize the main patterns of sequences in a dataset. In the educational field, it might be useful for clustering students based on their interaction patterns, and this could be used as a value for further analysis. Cluster analysis has been applied with sequence analysis in our previous studies to derive patterns of interaction with an E-Book’s chapters, patterns of sessions of interaction, and test-taking patterns. The visualization of sequences’ clusters is also being used in a current study as a main function of the developed CustomGPT.

3. Methodology

3.1. Overall Approach: Co-Design

This study addresses three key research questions: identifying the information teachers need about students’ interactions with DLEs, exploring how teachers’ perspectives shape the design of a CustomGPT for presenting sequence analysis results, and examining potential areas for CustomGPT development. To answer these questions, we employ a co-design approach, integrating teachers’ thoughts and insights throughout the process. Sanders and Stappers (2008) define the co-design approach as the collaboration of multiple actors in the process of designing to improve the result. In our case, teachers’ views are necessary since they are not only co-designers, but also the users of the final product. Therefore, we see teachers’ role in both design-solutions making and providing feedback, the iterations of which create a cycle of co-design. Gaete Cruz et al. (2022) describe the participation ladder and the design cycle steps. Our co-design process refers to the second stage of the participation ladder—consultation—that authors describe as stimulating the involvement of actors and selection and the decision-making step in the design cycle, which includes expert orientation and evaluation and decision-making of the most convenient option. The main goal of our co-design process with teachers is to consult with them on the current design solutions and discuss potential areas for the improvement of CustomGPT.

3.2. Design of CustomGPT

CustomGPT has been designed to enhance the understanding and analysis of student interaction data within interactive E-Books. Currently available analysis options have been chosen based on our previous studies analyzing DLE Opiq (Opanasenko et al., 2023, 2024). CustomGPT is built on top of OpenAI’s GPT series language models, with the GPT-4 configuration selected. CustomGPT supports two primary methods for customization: contextual instruction-tuning, where developers set task-specific instructions to guide the base GPT model without altering its underlying weights, and custom embedding, which indexes data like documents or scripts in vector databases to retrieve relevant information during queries, enhancing the model’s domain-specific responses. In our study, we did not perform model weight fine-tuning but instead leveraged CustomGPT’s capability of processing uploaded data and running Python scripts. This approach allowed us to integrate task-specific functionality, such as data analysis and result interpretation, without altering the core language model.
By analyzing uploaded log-data with session strategies (Sequence File 1), workbook study temporal patterns (Sequence File 2), and test-taking activities (Sequence File 3), the chatbot provided teachers with visualizations and detailed interpretations of students’ interaction. Tips for teaching practice were provided based on the results. The functionality of CustomGPT is presented in Figure 2.
Firstly, teachers upload a log-data file in .xlsx format provided by the Opiq platform. For this study we used test-data, crafted to present the potential of CustomGPT to teachers; detailed description of the test-data is presented in Appendix A. CustomGPT automatically processes this file preparing it for further analysis. After processing is performed, users can ask CustomGPT to process one of 3 available analyses based on the developed scripts in CustomGPT’s environment (more detailed description of the scripts is presented in Appendix B). The first script provides an overview of general interaction patterns, helping teachers understand overall engagement trends. The second script goes deeper into the sessions’ level, allowing for an understanding of students’ preferences not only in particular activities, but also in the order of interaction. The third script focuses on the level of particular activity (in our case—test-taking), showing different strategies of the same type of interaction. It is worth noticing that the scale on each level might be potentially adjusted by teachers: e.g., they can choose weeks instead of months or media-interaction instead of tests. The current system represents the idea of multilevel analysis, which can help teachers to obtain an overview of different aspects of students’ interaction with Opiq.
After choosing one of three options, CustomGPT processes the corresponding script and presents the output (presented on Figure 3) consisting of the visualization, overall description of analysis, descriptions, and tips for each type of interaction. In the case of visualizations, ChatGPT is being used mostly as an environment for data-analysis, while descriptions and tips provided by generative AI are devoted to making results accessible for teachers. To make sure of the logic CustomGPT uses to describe the visualization and on which it provides tips, we prompted CustomGPT to explain this process: all the visualizations, along with the CustomGPT explanation of its description processes, are presented in Appendix C.

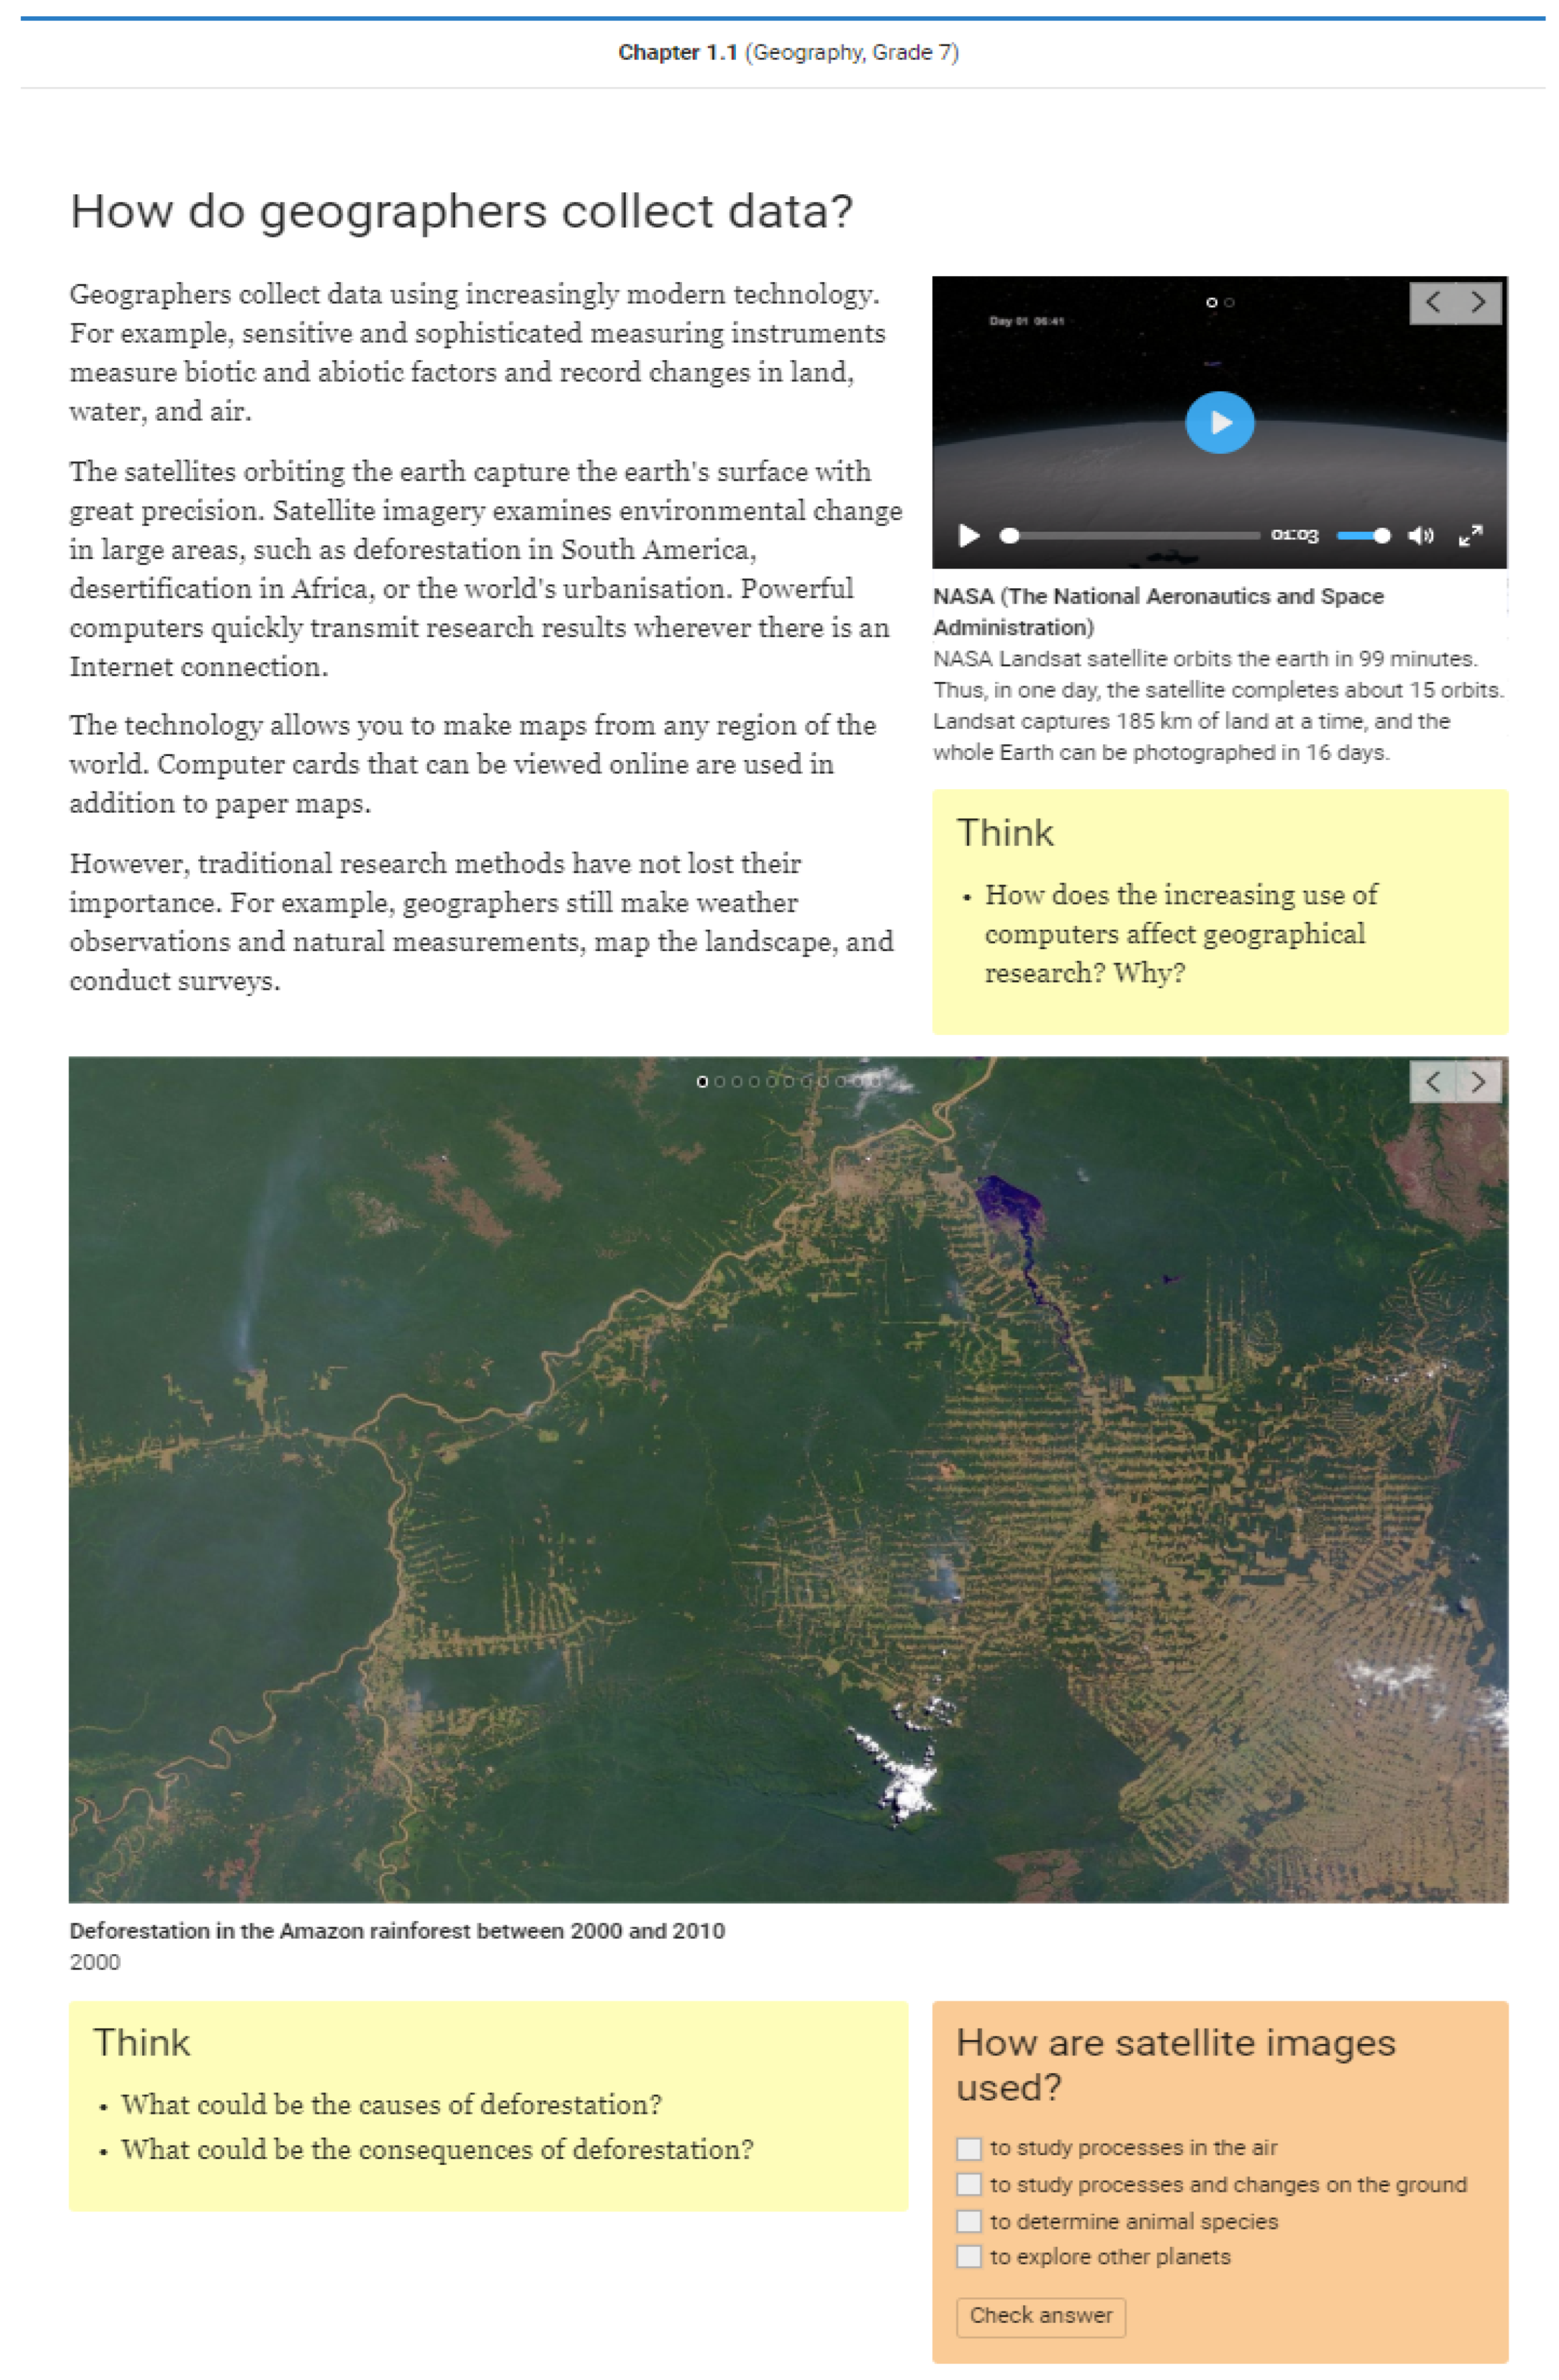
3.3. Description of Opiq Environment

Opiq is a cloud-based learning environment that contains interactive E-Books from Opiq educational publishers. Currently, there are 486 E-Books available in Estonian, English and Russian languages that cover most of the school subjects for preschool, middle, and high school. Since there are 16 publishers and content providers whose E-Books are presented in Opiq, the design of the E-Books could be quite different in the matter of interactivity. Opiq provides a wide number of possible interactions, including reading chapters, switching slides, watching videos, opening the gallery, taking tests including phases of checking, saving, and fixing results, which are also available for follow-up analyses. An example of an interactive E-Books page in the Opiq environment is presented in Figure 4. Opiq’s usage log-data provides information about every action that has been made by the student during their interaction with E-Books, which makes further EDM analysis available.

3.4. Data Collection and Analysis

Focus group interviews with educators were conducted to study opinions on students’ strategies of interaction with interactive E-Books, validate the current design of the CustomGPT, and explore areas for its possible development (Appendix D, Table A1). Each focus group consisted of 3 participants; the overall sample was 12 participants. A total of 2 groups was formed to provide a variability of views. These groups comprises Estonian teachers, who had experience with Opiq and who are currently gaining a PhD degree in Educational Science at University of Tartu (n = 6); and international educators, who were studying “Educational Technology“ at a master’s program at the University of Tartu. All 12 participants were working as school teachers at the moment of the interview. An interview protocol was developed to answer research questions and is presented in Appendix E, in Table A2. During the interview, the CustomGPT was presented to the participants; additionally, DLE Opiq was presented at the beginning of the interview to those participants who were not familiar with it. Each interview was conducted on Zoom and lasted for up to 1 h 20 min. The recorded interviews were transcribed to ensure a comprehensive dataset. The transcripts were read multiple times to gain familiarity with the data. Preliminary codes were generated inductively based on the content of the interviews and the research questions. Using an iterative process, codes were grouped into broader categories that reflected recurring themes (Table A3). These categories were further organized into overarching dimensions that align with the research objectives. The key findings were organized by dimension and presented in the Results section, with illustrative quotes where necessary to support interpretations.

4. Results

4.1. Opinions on the Interactive E-Books’ Environment

To understand possible points of interest and possibilities of improvement, teachers were asked about their opinion on positive and negative features of Opiq. Teachers expressed a mix of positive and negative sentiments regarding the Opiq platform. On the positive side, they found Opiq ’s materials useful for creating their own tests based on the existing ones, providing inspiration for lesson content, and demonstrating various study strategies. Comments included: “So I used … Opiq to add something to my lessons like showing the videos from there, and also for inspiration for the tests”; and “to show different kind of strategies, and how to solve things”. Some teachers also facilitated collaboration with students by using content from Opiq on a whiteboard for group activities during the lesson. It also saved time, as teachers did not need to prepare their own materials and kept students engaged through automatic assessment, which eliminated the need for immediate teacher feedback: “students are engaged at every minute of the lesson since they don’t have to wait for the teacher’s feedback”. Additionally, teachers valued the sustainability aspect of using online materials, considering them modern and environmentally friendly.
On the negative side, the main issue seemed to be limited access, as the decision to use Opiq depended on the school budget and not on their personal autonomy. Some teachers felt that Opiq was less effective compared to classic books: “I prefer actually that my students read textbooks on paper because all kinds of neurological studies … about how the brain studies … still show that you study better when you read from paper and write notes and construct by hand, etc.”. Technical issues were also a concern, with correct answers sometimes being marked as incorrect due to minor mistakes or different tabulations. Additionally, there were complaints about outdated information in subjects like geography, necessitating teachers to seek more accurate data from other sources.
While most of the negative aspects were quite technical (such as the wrong test evaluation process) or organizational (the school’s decision not to use Opiq in the current year) and more context-specific, the positive features mentioned by the participants showed that they saw the educational potential of using interactive E-Books, emphasizing the advantages of different types of student interaction (like media content or tests) in Opiq. It is worth mentioning that two respondents at this point mentioned the concept “different strategies of studying material“, which is an essential part of our chatbot.

4.2. Opinions on the Process of Students’ Interaction

To understand what information about students’ strategies of interaction teachers need (which was set as the first research question), they were asked a series of questions about their observations on different strategies that students use in their interaction process. Some participants observed a variety of test-taking strategies: “Do the test until you randomly get the right answer, or actually spend some time reading before, and then try to get it right the 1st time”. Additionally, they acknowledged that students employ different general learning strategies and follow varying orders of interaction, such as whether they watch instructional videos first, later, or not at all. Participants also emphasized the significance of certain combinations of interaction: “It’s important to read before watching the videos. I know it’s harder, but you will get … better knowledge out of this subject or this part. Because if you are watching only the videos, you won’t get the overview”. It is worth noting that two of the three strategies (test-taking and interaction during the session) mentioned by participants at this stage were available for an analysis in the CustomGPT before teachers were familiarized with it.
Participants also shared their thoughts on factors influencing students’ interaction strategies with Opiq, mentioning motivation, subject (“I believe that for some subjects materials would be more interactive rather than reading, and for some subjects, more activities, more of a practice would be better”), quality of material, grade (“in the younger grades you can just show a cool picture at the start”), flexibility of the platform, and personal preferences (“maybe some students will prefer listening, for example, instead of reading”). This information might be potentially useful to develop further analysis and study differences based on the above-mentioned factors. Also, participants might be interested in applying the chatbot to see patterns of interaction not only within one group, but also on a scale of studying a particular subject in a particular grade.
Participants also emphasized the value of detailed information about students’ interactions for various applications. First, teachers might be interested in overall information about students’ interaction, including the role of different activities: “Information about how much time they spent on reading, how much time they spent on doing the self-assessment tests which I think are like one of the biggest values here. Did they look at the videos and everything?” Deeper analysis of a particular activity is also valuable, e.g., the process of preparing for the test might be of practical interest for teachers: “I definitely would be interested in knowing, for example, how well they prepared for these so-called reading tests or reading controls that I usually do in every lesson. Right now, I can only rely on their answer being truthful or not, when they say that they prepare, or did they not prepare for the reading assignment?” Information about different aspects of taking tests can also be beneficial: “how much time they spent on reading, how much time they spent on doing the self-assessment tests which I think is like one of the biggest values here.” Along with a vision of what they want to know, participants also shared ideas on how this information might be used. For example, additional support might be provided to students based on the analysis: “I can see how much, like, they concentrated on the content. And if I see, for example, that half the class spent, like, really a lot of time on some chapter, then I can see, like, okay, is it too hard. If I see that one student didn’t do anything at all I could, like, ask him in the classroom about these questions”; or, it could be used to adjust the workload. Another application might be identifying what content has been avoided: “Sometimes they only watch the videos and do the lesson and it’s not effective.”
Therefore, participants already have their own ideas as to how students interact with Opiq, although they come only from observations and not from real data. Educators are not only interested in obtaining more detailed information about students’ interaction; they have a vision of what exactly they would like to know (e.g., test-taking patterns and session patterns) and for what purpose. This might be a good indicator for choosing appropriate examples for data analysis in our CustomGPT and a basis for further studies. The last part of the interview was devoted to the participants’ evaluation of the CustomGPT visualization clarity and interpretation/tips usefulness.

4.3. Opinions on the Design and Functionality of the Developed CustomGPT

Teachers provided detailed feedback on various aspects of the bot, focusing on visualizations, descriptions, tips, and overall thoughts and ideas about its application, which was set as our second research question. Regarding visualizations, teachers generally found the pictures clear, although there was some ambiguity with the legends. Some found extra labels on each graph distracting and suggested that additional information, such as the number of students in each cluster, would be helpful: “For example, it would be useful to have. How many? What’s the number of students in each cluster.” However, some teachers admitted that they did not understand the visualizations at all, especially regarding the clarity of related frequency: “So more interpretation about this relative frequency is probably needed.”
Descriptions accompanying the visualizations were seen as necessary and useful for expanding understanding. While some teachers believed the graphs were clear enough on their own, others appreciated the added clarity provided by the descriptions, especially for those who might not grasp the visual data immediately: “I think we understood it already by seeing it. But if somebody didn’t understand, they can read it. And it’s good.” The tips provided by the bot received mixed feedback. Some teachers found them useful as they offered new ideas, while others felt that their own tips would differ from those given. There was also criticism that the tips were too general and repetitive, merely describing what was already visible in the graphs without adding significant value.
In terms of overall thoughts and ideas about the chatbot, there was some uncertainty about its practical application. Teachers questioned how they could interpret and use the provided data. Group analysis was seen as beneficial for understanding class dynamics, but individual analysis was deemed more meaningful if it included specific student names. Some teachers expressed a desire for flexibility to create their own solutions rather than relying on ready-made scripts. The tool was viewed as potentially valuable for diagnostics at specific moments: “Teachers might use this idea pretty rarely. But at one point could consider this extremely useful and valuable. At some extreme points or at the beginning of the journey.” Privacy concerns were mentioned, with teachers worried about the potential storage and misuse of student data. There was also interest in applying the tool outside of Opiq for broader educational purposes. Finally, some teachers suggested that more detailed visualizations focusing on certain students rather than general clusters would be more useful for their needs: “I would like to have information about specific students, not so much, maybe, about the clusters of students who are actually doing quite fine in class.”
Overall, teachers shared interest in more detailed information about students’ interaction, mentioning its potential value and an overall positive attitude to the CustomGPT developed, also mentioning areas of improvement.

5. Discussion

The results we obtained allowed us to assess the relevance of making sequence analysis accessible to teachers as a statistical tool, validate the current design solutions of the CustomGPT, and develop potential directions for its improvement. As was mentioned before, our idea was to combine features of CustomGPTs that are already in use in educational field (prompt tunning and external knowledge (Zhao et al., 2023) with using CustomGPT as a programming environment, in contradiction to using the basic version of ChatGPT just as a programming assistant for script generation (Tian et al., 2023).
Teachers positively evaluated the interactive capabilities of the platform and repeatedly emphasized the importance of detailed information about student interactions with DLE Opiq. They not only already had an idea of what specific information would be of interest to them but also the potential areas of its application. These observations once again support the relevance of educational data mining methods (Ampadu, 2023), while also highlighting the problem of accessibility of the obtained results for teachers (Fonseca et al., 2021). Given the trend of increasing the number of DLEs and their specifications (Weller, 2022), there is a need to apply new research methods that describe various aspects of the educational process. Sequence analysis allows identifying and visualizing student patterns depending on the duration of their interaction with educational content, the predominance or absence of certain actions, as well as their order. The high flexibility of this tool and its applicability for analyzing student interactions at different levels (throughout the academic year, within one session, and one test) were the foundation of the developed CustomGPT.
One of the positive indicators of our decision was that participants mentioned some information about student interactions (session patterns and test progressions) as being of interest to them even before it was presented as a feature of the CustomGPT, which was set as our first research question. Regarding the second research question, the design and functionality of the CustomGPT can also be considered quite successful. Although some participants found the visualizations clear and informative on their own, detailed descriptions accompanying the graphs helped either to aid understanding for those who may not have grasped the visuals initially or to expand understanding. However, there is still room for improvement: for instance, additional data about the number of students in each cluster. Also, the concept of relative frequency should be explained more clearly to help teachers interpret the data accurately. The feedback on the tips provided varies: while some teachers appreciated the practical ideas these tips offered, others felt that the tips were too general or did not align with their needs. However, now, the developed CustomGPT is on a par with similar assistants (Van Poucke, 2024; Kotsis, 2024), leaving the teacher with the responsibility of interpreting the information received and disposing of it.
In respect to finding vectors for improvement of the CustomGPT, which was our last research question, integrating more personalized learning statistics could be beneficial. For instance, developing visualizations and reports that focus on individual student progress in addition to overall typologization can provide a more comprehensive view. In this case, considering some other sequence analysis visualizations might be useful to reflect new sides of education processes (Raab & Struffolino, 2022). Implementing interactive elements in the visualizations could allow teachers to explore data more dynamically, adapting the insights to their specific interests. Clear solutions about data privacy measures and compliance with relevant regulations should address privacy concerns, making all parties more comfortable with using the tool. Also, descriptions and tips provided by generative AI might be further improved by adjusting initial prompts (e.g., template or specific points of interest) based on feedback received. Some problems that we faced during the process of developing the CustomGPT also could help to establish potential points of improvement. Firstly, the problem of correct log-data processing and interpretation (Algarni, 2016) becomes even more important when the process is automatized by AI. Secondly, AI- hallucinations need to be prevented by expanding the amount of data used to train the CustomGPT (Yao et al., 2023). While we believe that this paper contributes to both problems’ solutions, the next step would be to develop and test its findings based on the feedback received.

Author Contributions

Conceptualization, Y.O. and E.B.; methodology, M.P.; software, L.A.S.; for-mal analysis, Y.O.; writing—original draft preparation, Y.O. and E.B.; writing—review and editing, E.B., M.P. and L.A.S.; visualization, Y.O.; supervision, M.P.; funding acquisition, M.P. All authors have read and agreed to the published version of the manuscript.

Funding

This research received no external funding.

Institutional Review Board Statement

According to both Estonian and European Union regulations, the Ethics Committee approval for research involving humans is not needed for the current research because of the following reasons: (1) our respondents are adults; (2) our respondents do not belong to any specific group of humans (e.g., minorities, the ones with special needs); (3) our study does not focus on their characteristics but on their opinions about a tool/product/method we plan to develop.

Informed Consent Statement

Informed consent was obtained from all subjects involved in the study.

Data Availability Statement

The datasets presented in this article are not readily available because the respondents are identifiable in the recordings of the interviews. Requests to access the datasets should be directed to corresponding author.

Acknowledgments

The research was supported by the Opiq development team StarCloud.

Conflicts of Interest

The authors declare no conflict of interest.

Appendix A. Features of the Test-Data

The main data file used by the CustomGPT in our study is a specially crafted dataset designed to demonstrate the potential of sequence analysis in an educational context for teachers. It has been created based on the real log-data gathered during the DigiEfekt project in the 2021/2022 study year. Since the original data had some limitations (inhomogeneity, lack of the information about the context of interaction, and some technical issues), a new dataset has been artificially created to produce clear and understandable results that can effectively illustrate to teachers how sequence analysis can be applied in different dimensions and what insights they can potentially obtain from it.
The key components of this file include:
  • Student ID: A unique identifier for each student, allowing for the tracking of individual interaction patterns over time;
  • TimeCode: A timestamp indicating the exact date and time when each interaction occurred. This column is crucial for analyzing temporal patterns in Opiq usage;
  • Action: Describes the type of activity the student engaged in, such as watching videos, reading materials, completing exercises, or taking tests. This information is important for deriving typical sessions based on dominant activities and their order;
  • Score: The results of assessments, representing the correctness of students’ answers. Scores range from 0 to 100 as it is in the Opiq environment.
Three types of information of the data file have been used for sequence analysis:
Temporal patterns: The TimeCode column enables the examination of when students interact with the platform. By converting these timestamps into monthly or weekly periods, sequence analysis can be applied to identify patterns of engagement over time. In our case, the first sequence analysis script uses this information to track student activity over months, highlighting interaction trends and helping to identify periods of high or low activity.
Session patterns: the Action column provides detailed information on the types of interactions students have with the platform. By categorizing these actions and analyzing their sequences, teachers can see which activities are commonly performed together and identify typical sessions of interaction.
Test-taking patterns: the Score column is used to track student performance tests. By mapping these scores onto categorical labels (e.g., ‘Incorrect’, ‘Partly correct’, ‘Almost correct’, ‘Correct’), sequence analysis can reveal typical strategies that students use while taking tests.

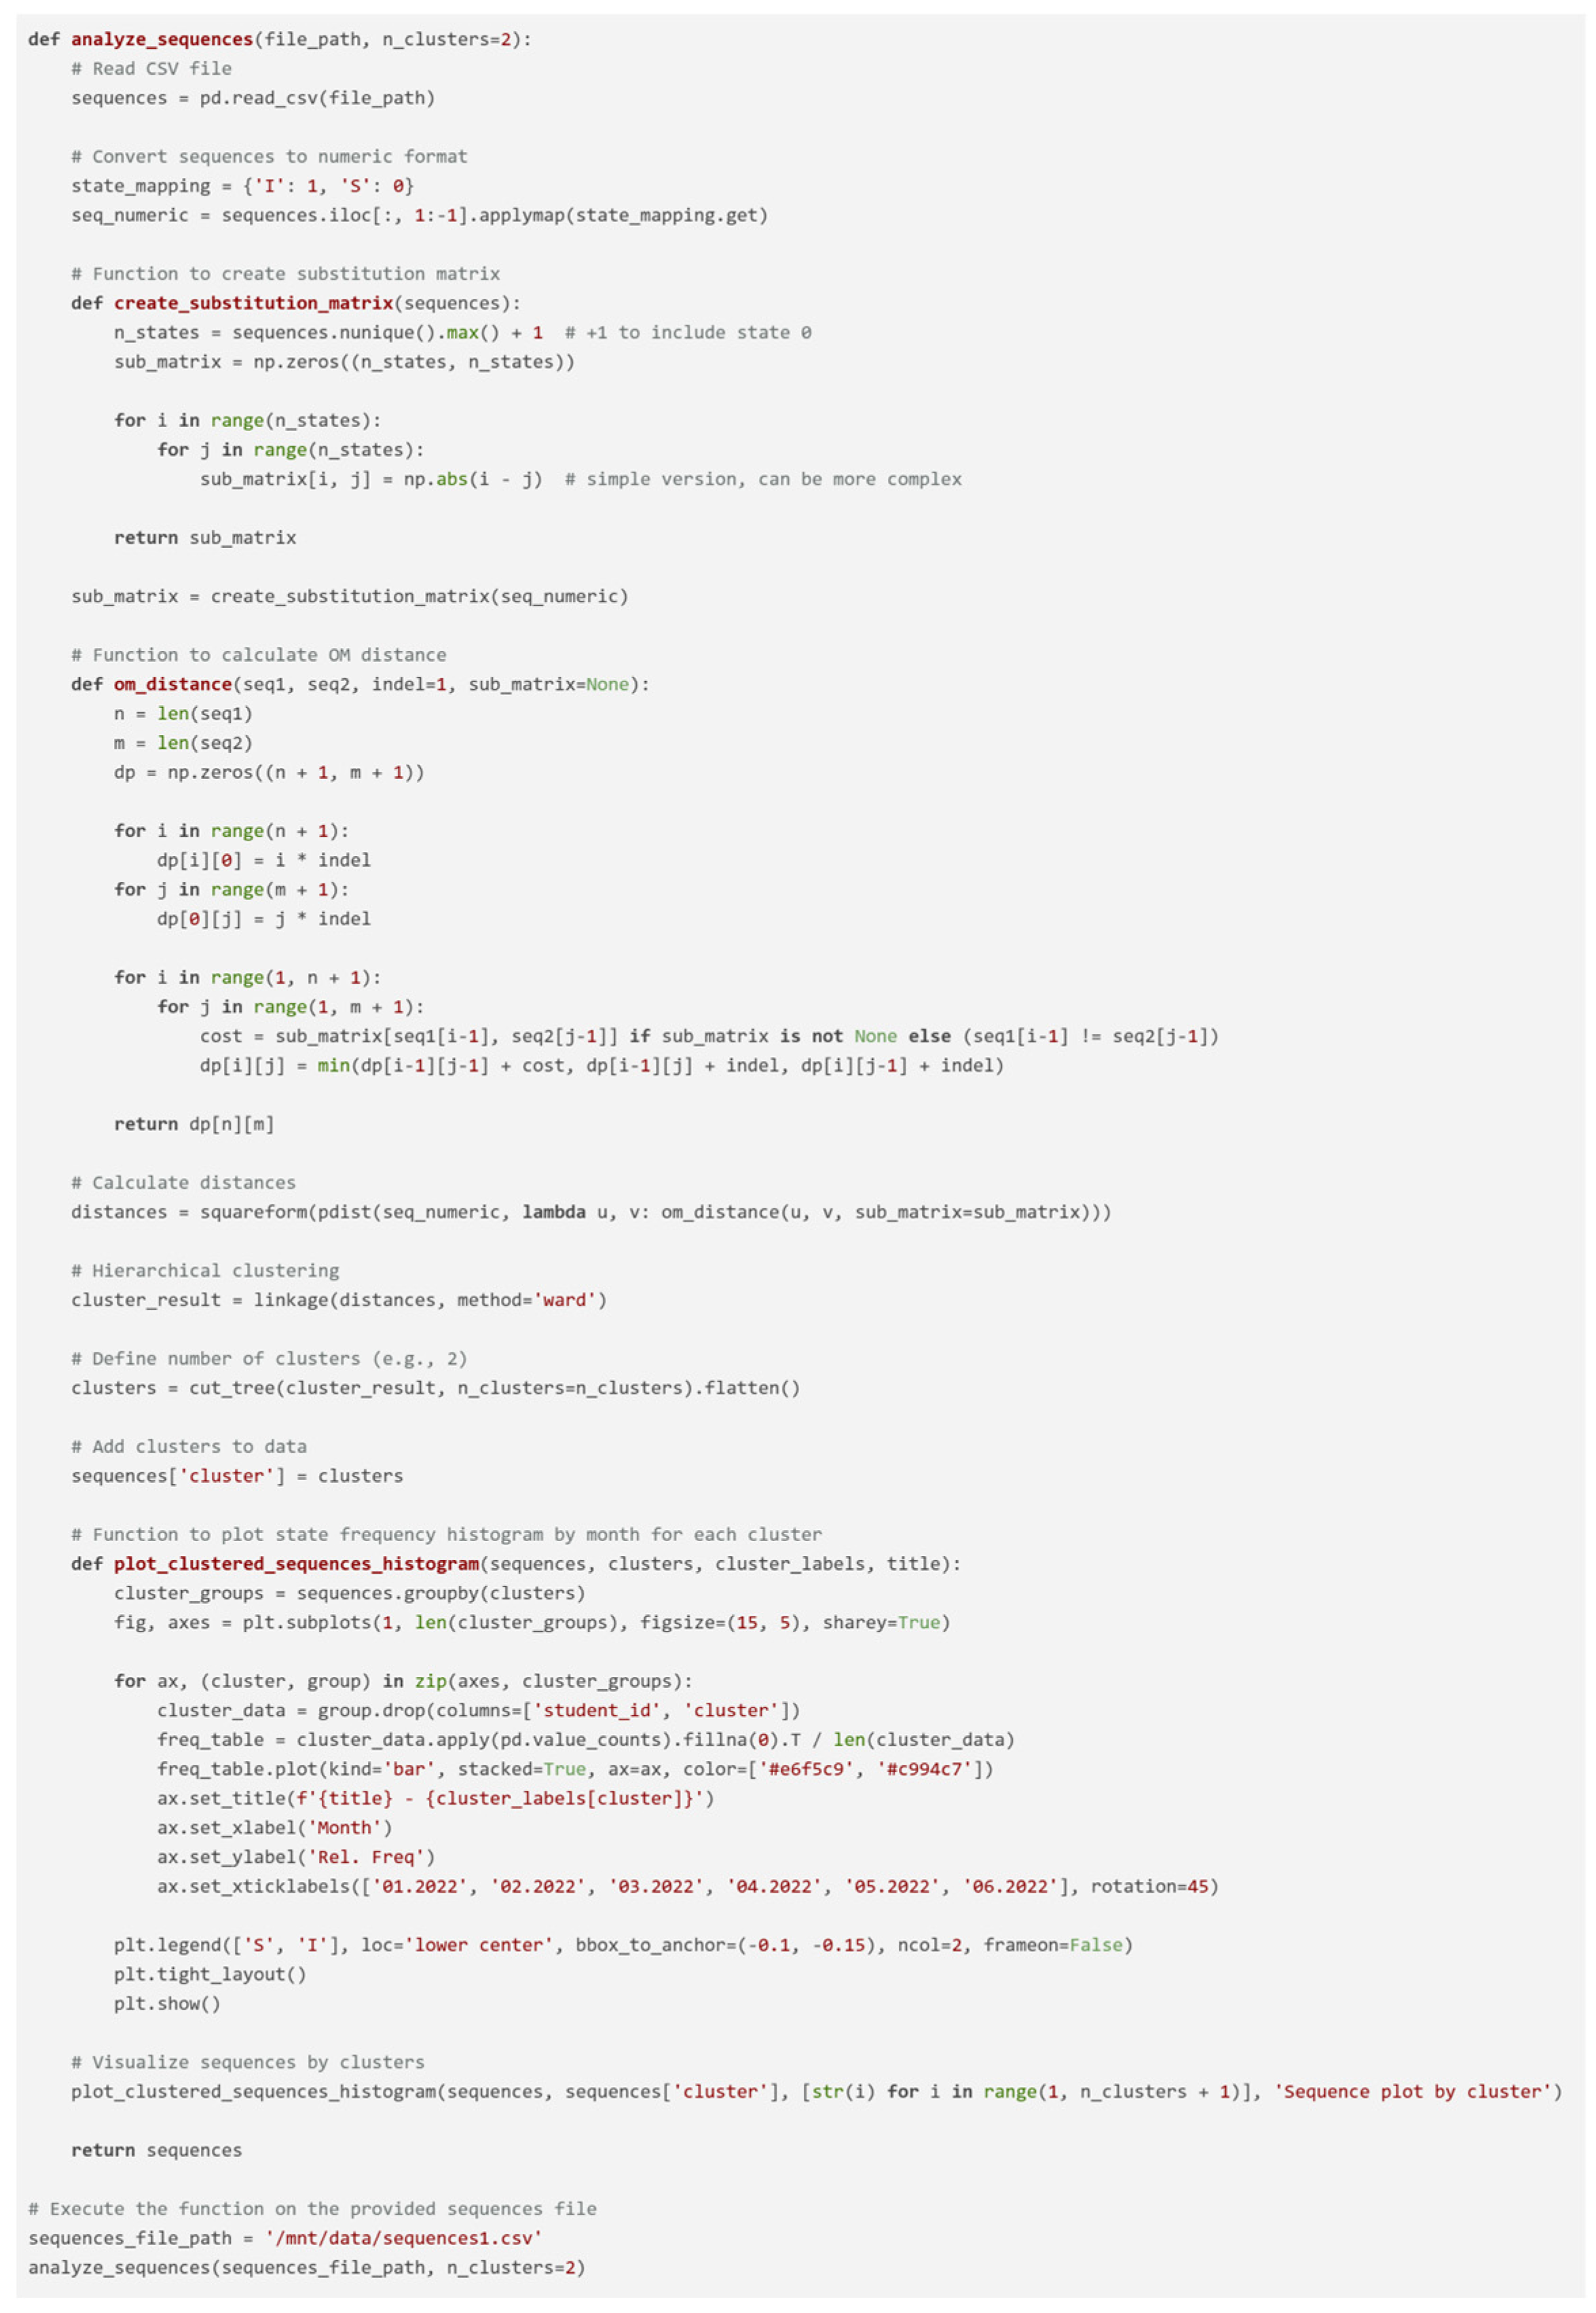
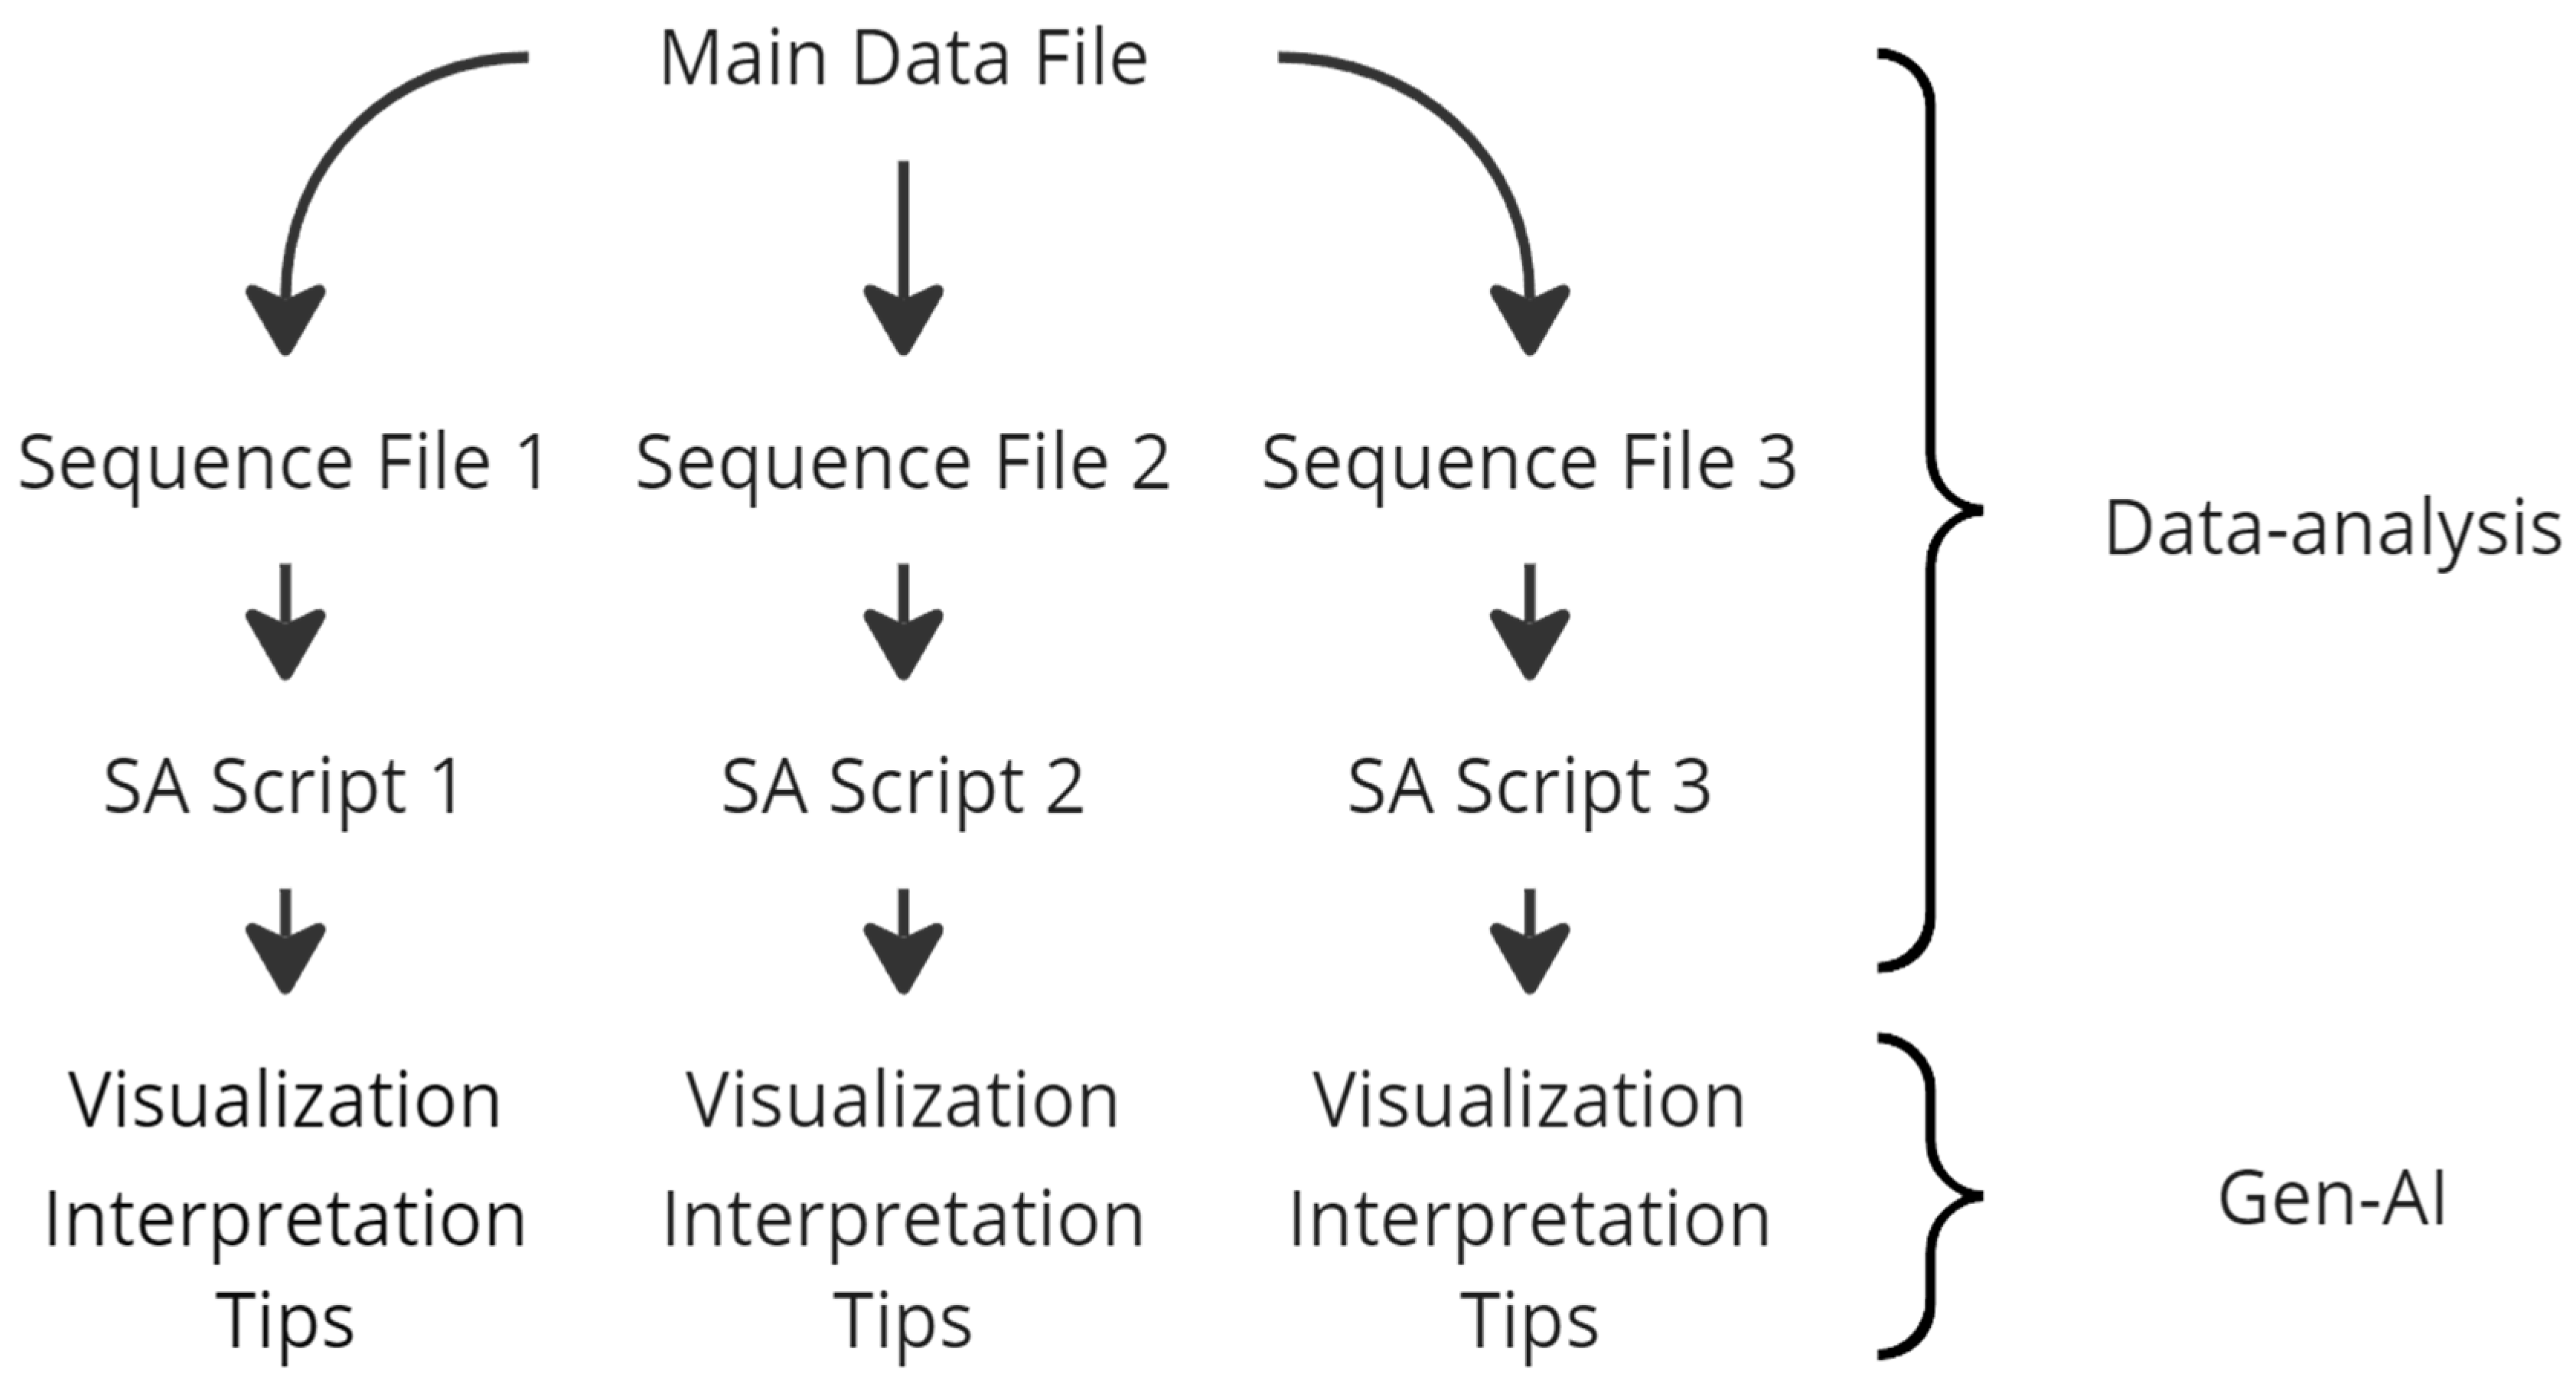
Appendix B. Features of the Scripts for Sequence Analysis

The first step is translating the sequence data-processing workflow. In R, the sequence data is often being read, cleaned, and transformed using specific libraries like TraMineR. We adapted this process in Python using the pandas library, which offers comparable data manipulation capabilities to make it viable in the ChatGPT environment. Specifically, the CustomGPT read the sequence data from an original CSV file (that teachers potentially might obtain directly from the Opiq environment), ensured the data was in the correct format, and mapped categorical states to numeric values. The next step was replicating the optimal matching (OM) algorithm, a key feature of TraMineR used for measuring the dissimilarity between sequences. We implemented the OM distance calculation in Python, utilizing dynamic programming techniques as analogues of ones employed by TraMineR. This involved defining a substitution matrix to determine the cost of transforming one event into another and incorporating insertion and deletion costs. The scipy library’s functions were used in calculating pairwise distances between sequences and performing hierarchical clustering, akin to the functions provided by TraMineR’s clustering library.
Finally, we adapted the visualization provided by the ggplot2 package of TraMineR into Python using matplotlib. This involved creating histograms of the typical sequences. After adapting each component of the R script into Python, we ensured that the results gained using TraMineR package were replicated, making them accessible within a Python-based workflow for their application in a ChatGPT environment.
The following Python libraries were used to adapt the sequence analysis:
  • pandas: for data manipulation and analysis;
  • numpy: for numerical operations;
  • matplotlib.pyplot: for plotting and visualization;
  • scipy.cluster.hierarchy: for performing hierarchical clustering;
  • scipy.spatial.distance: for calculating pairwise distances between sequences.
The process of preparing the data for sequence analysis consists of several steps. The first step is to generate specific types of sequence files in a .csv format for further analysis. Initially, the main data file is read using the pandas library to extract and format necessary columns. For the first sequence file, the chatbot is focusing on capturing student interaction patterns over a series of months. This involved converting the ‘TimeCode’ column to a string format, extracting the month (6 months were available in the data-set as an example of a semester), and identifying unique student IDs. For each student, monthly interactions were recorded as either ‘I’ for interaction or ‘S’ for skip, resulting in a DataFrame that reflected each student’s sequence over time. This DataFrame was saved to the chatbot environment as sequence1.csv.
In creating the second sequence file, the emphasis was on session sequences. The process involved reading the same main data file and generating sequences of actions during each session. Each session consists of five actions—this limitation was implemented since the problem of analyzing sequences of different length is still open in an educational context. The possible actions are: ‘Reading’, ‘Gallery’, ‘Video’, ‘Exercise’ and ‘Test’. These sequences were converted to a numeric format using custom mapping for different actions and they were saved as sequence2.csv.
The third sequence file focused on analyzing test-taking patterns from the data. The data were read from the main file, and performance scores were mapped to categories like ‘Incorrect’ (score 0–49), ‘Partly correct (score 50–79)’, ‘Almost correct (score 80–99)’, and ‘Correct (score 100)’, accordingly. These labeled sequences were then transformed into a numeric form for optimal matching distance calculations. These processed data were saved as sequence3.csv.
After automatically creating three files with sequences, the CustomGPT allows the user to show different sequences analysis results by typing the following commands: “Show the temporal patterns“, “Show the session patterns“, and “Show the test-taking patterns“. Each of the commands launches a corresponding .py script in the chatbot environment. The following sequence analysis is based on the previous studies on Opiq (Opanasenko et al., 2023; Opanasenko et al., 2024).
Here is an overview of the three sequence analysis scripts currently available in the CustomGPT:
The first script is designed to analyze interaction patterns from the log data, focusing on sequences of student activities over time. The primary aim is to identify and visualize distinct patterns of student engagement throughout a semester. The script begins by reading a CSV file containing sequences of monthly interactions (marked as ‘I’ for interaction and ‘S’ for skip). These sequences are then converted into a numeric format for the computation of OM distances. Once the distances are computed, hierarchical clustering is applied to group students based on their interaction patterns. The resulting clusters are then visualized through state frequency histograms. Each cluster’s relative frequency of interaction is plotted by month, with the green color representing interaction and purple representing a skip. The educational goal of this analysis is in identifying potential dropouts, gaps in interaction, or periods of increased activity.
The second script takes a similar approach to analyzing educational log data but focuses on sequences of specific actions rather than general interactions. This script aims to provide a more granular view of student behavior by examining the types of actions performed during study sessions. In this script, the sequences of actions (e.g., watching videos, reading, and performing exercises) are read from a CSV file and converted into numeric format using an action mapping. The OM distance is again used to calculate the similarity between sequences, and hierarchical clustering is applied to group similar sequences together. A key difference in this script is the emphasis on visualizing the sequences with custom colors assigned to each type of action. This allows for a detailed representation of student behavior, highlighting which actions are most prevalent in each cluster. The visualizations include a separate legend for each cluster to make it more easily readable for teachers. The aim of this analysis is to provide teachers with an understanding of how typical sessions of interaction with Opiq look.
The third script extends the analysis further by focusing on sequences of test-scores, categorizing them into different levels of correctness. The script starts by reading sequences of scores from a CSV file and mapping these scores onto categorical labels, such as ‘Incorrect’, ‘Partly correct’, ‘Almost correct’, and ‘Correct’. These labeled sequences are then used to compute OM distances, followed by hierarchical clustering to group students based on their performance patterns. The resulting histograms display the relative frequency of each performance category within the clusters, providing an overview of trends of improvement of the result.
While all three scripts share a common goal of analyzing and visualizing student behavior through sequence analysis, they each focus on different levels of the interaction process. The following Python script was used to process and analyze sequential interaction data and generate visualizations for the study (Figure A1).
Figure A1. Script for deriving and analyzing sequences from an original log data file.
Education 15 00028 g0a1

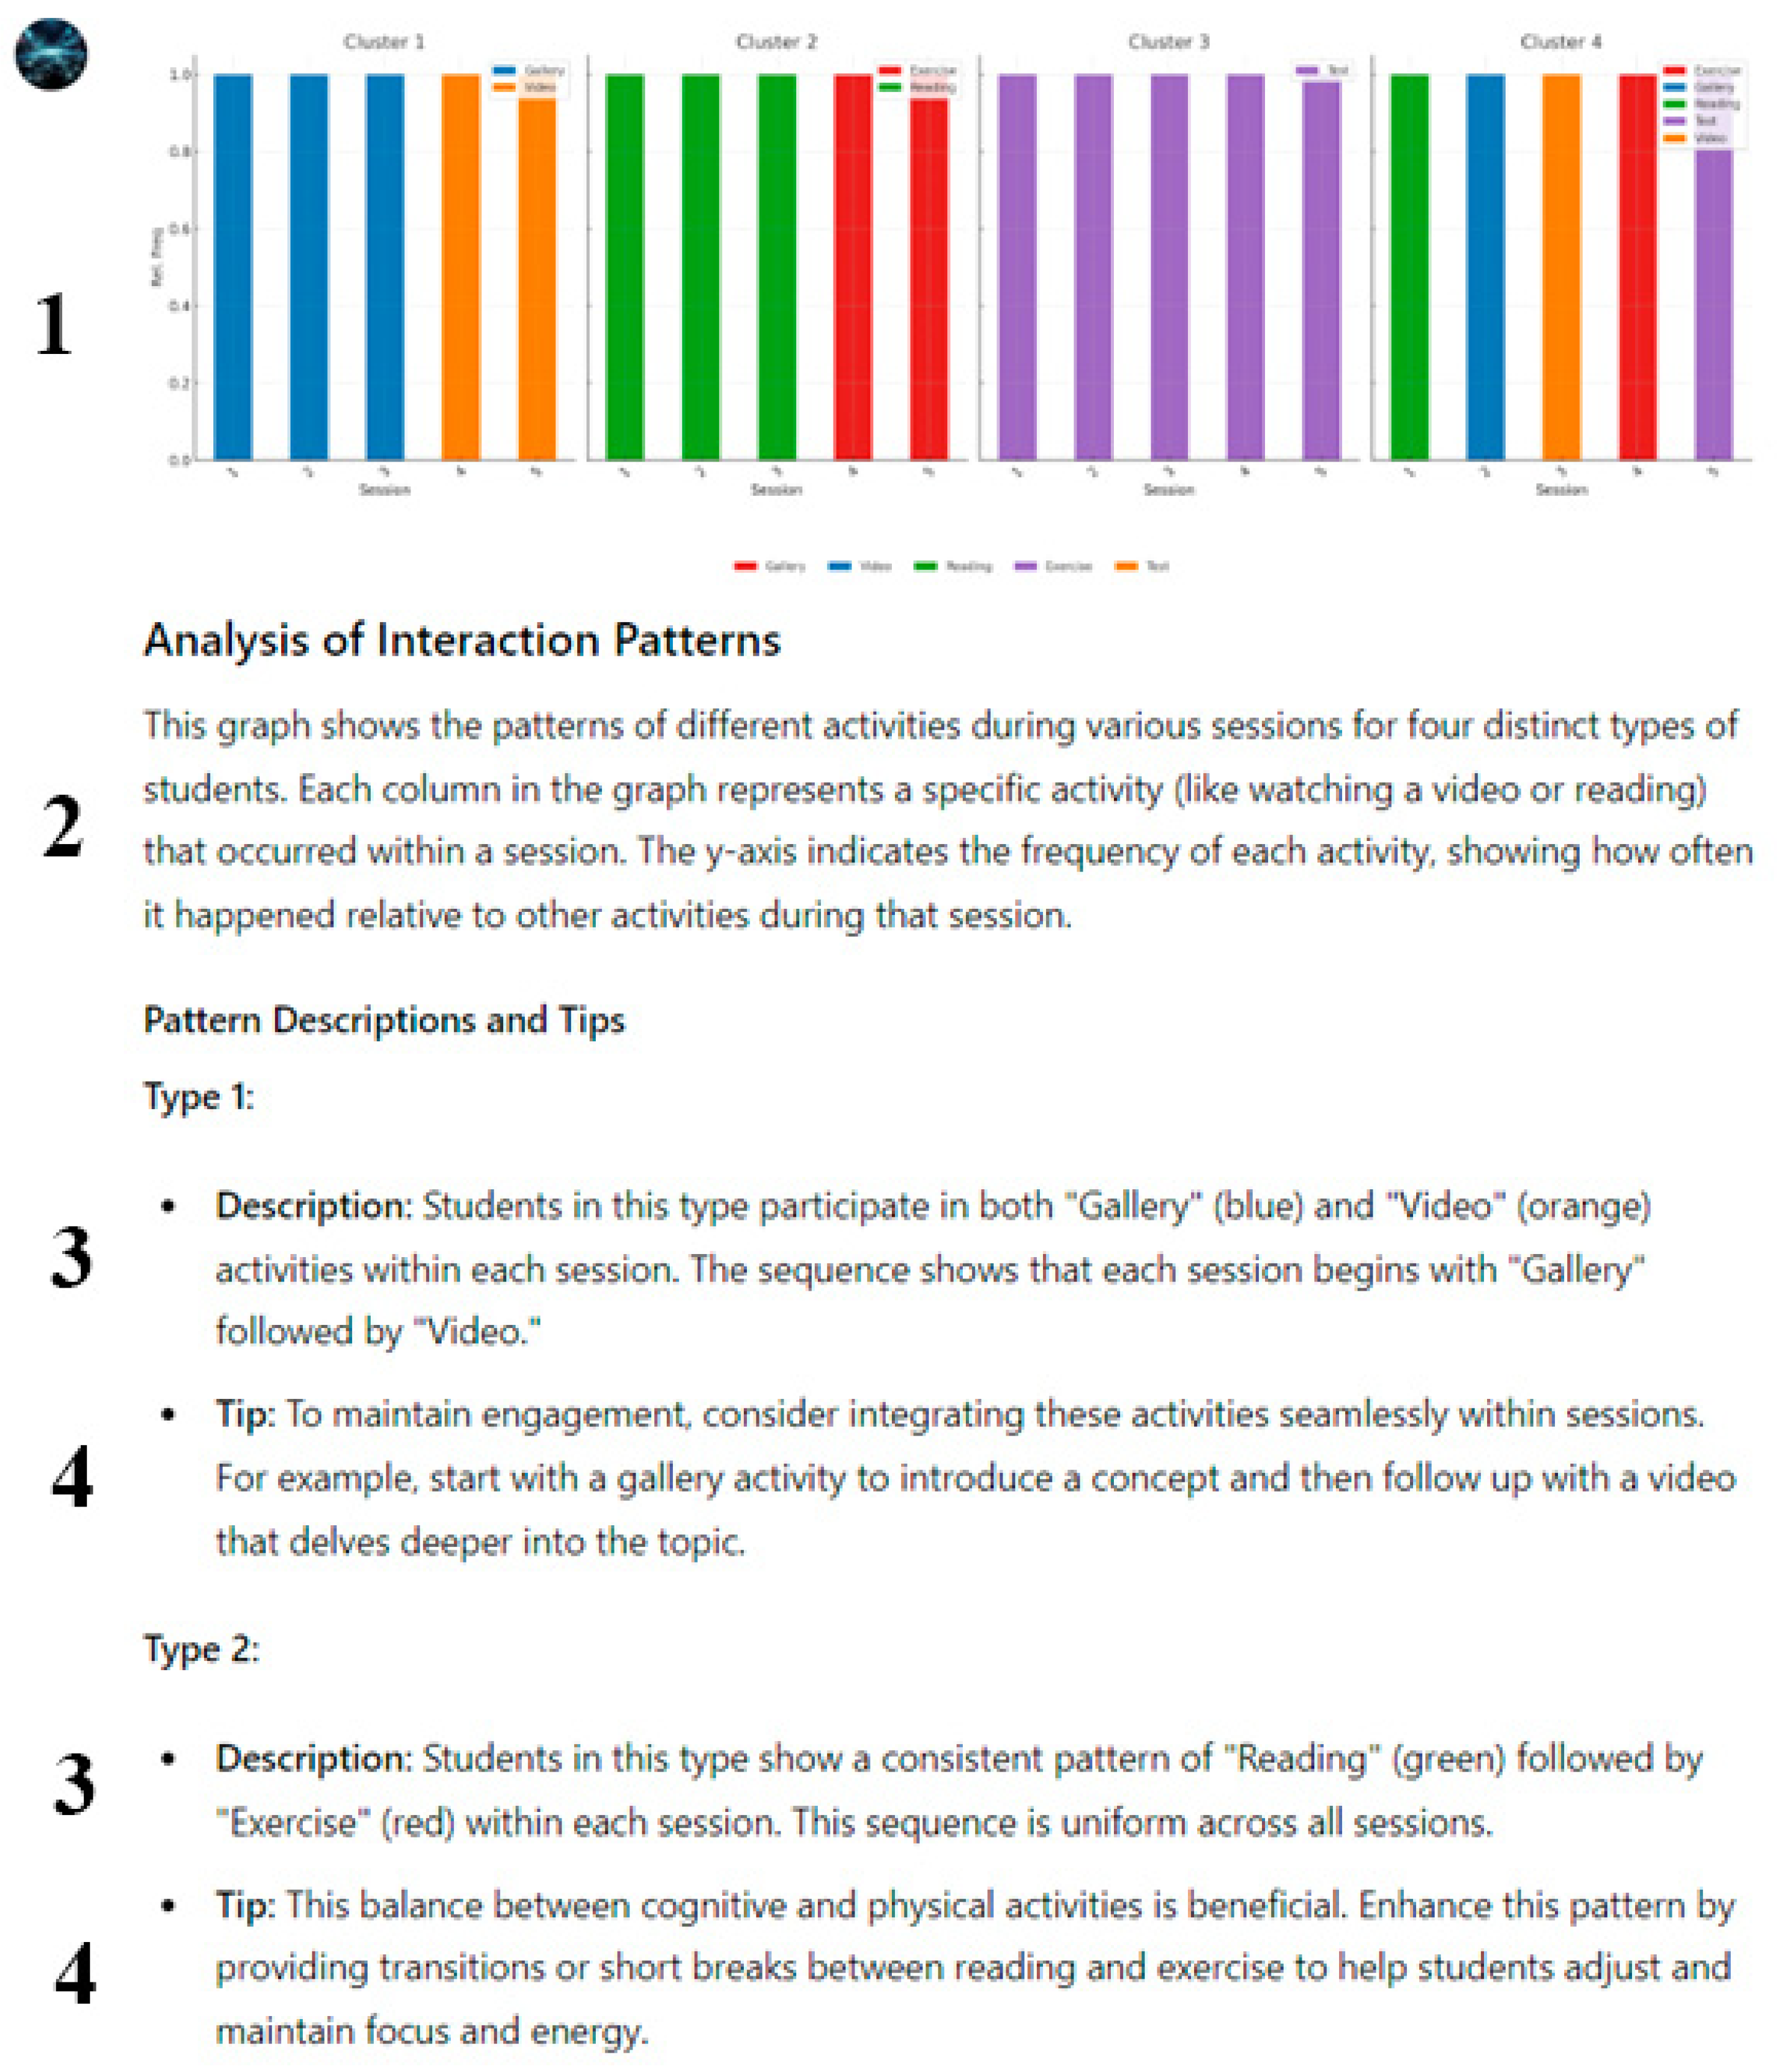
Appendix C. Description of Various Analysis Options Available in the CustomGPT and Examples of Interpretation and Tips Provided by the CustomGPT

Since the main goal of the CustomGPT is to make data more accessible for teachers, visualizations of different patterns were provided along with the description and tips, both generated by AI. Below are the visualizations and an example of interpretation/tips provided by Custom GPT.
Temporal patterns (Figure A2):
Each graph represents a sequence plot for one of three distinct clusters of students, showing how frequently students were interacting with the educational platform (“I” for interaction) versus being inactive (“S” for skip) in each month from January 2022 to June 2022 (taken as an example based on the original data). While the first and the third graphs show that all the students in these clusters interacted in every month (in case of the first cluster) or in January, May, and June (in case of the third cluster), the second cluster shows that the relative frequency of interacting during first two month is about 0.7.
Figure A2. Visualization of temporal patterns.
Education 15 00028 g0a2
Interpretation and tips generated by the Custom GPT:
“In the first script, the graphs represent student interactions over several months, with colors indicating activity (green) and inactivity (purple). The legend helps readers understand that each bar corresponds to a month, and the height of the colored sections shows the relative frequency of interactions or inactivity. To interpret these graphs, we look for patterns such as consistent engagement, early drop-offs, or sporadic interactions. By identifying these patterns, we can provide targeted tips for each group of students based on their engagement trends.
For instance, if a cluster shows consistent monthly interactions, it indicates regular study habits. We interpret this as a positive engagement pattern and suggest maintaining this engagement through continuous feedback and regular content updates. On the other hand, if a cluster shows interactions only in the initial months, it suggests a potential drop-off. We interpret this as a sign that these students might be losing motivation or facing challenges and recommend early intervention to address these issues” (OpenAI, 2024).
Session Patterns (Figure A3):
Each graph represents a sequence plot for one of four distinct types of students, illustrating how frequently students engaged in different activities during each session. The relative frequency of each activity is represented on the y-axis, while the order of actions is shown on the x-axis. Each session conditionally consists of only five actions with relative frequency = 1.0 to avoid problems with sequences of unequal length and feedback received from teachers. In this case, the states of sequences represent different types of student activities during each session: Gallery viewing (blue), Video watching (orange), Reading (green), Exercise (red), and Taking Tests (purple). The data for this type of analysis were created to reproduce some distinguish patterns of interaction during the session: combining two activities in a particular order (in case of the first and the second clusters), focusing only on a specific activity during the whole session (the third cluster), and combining different types of interaction (the fourth cluster).
Figure A3. Visualization of sessions’ patterns.
Education 15 00028 g0a3
Interpretation and tips generated by the CustomGPT:
“The second script focuses on the variety of activities students engage in during each session. The graphs use a distinct color for each activity (e.g., blue for “Gallery”, orange for “Video”, green for “Reading”, red for “Exercise”, and purple for “Test”). Each bar represents a session, and the height of each colored section indicates the frequency of the corresponding activity. To interpret these graphs, we analyze the sequence and frequency of activities within each session. This helps us understand student preferences and engagement levels with different types of activities.
For example, if a cluster shows a consistent pattern of “Reading” followed by “Exercise”, it indicates a balanced engagement with cognitive and physical activities. We interpret this as a positive pattern and suggest enhancing it by providing transitions or short breaks between activities to maintain focus and energy. If a cluster shows a mix of all activities in a session, it indicates that variety keeps students engaged. We recommend continuing to provide this variety and monitoring individual preferences to offer tailored support if needed” (OpenAI, 2024).
Test-taking Patterns (Figure A4):
The sequence plots in the third analysis illustrate distinct patterns of how students performed across five test attempts. The relative frequency of each performance category is represented on the y-axis, while the order of test attempts (steps) is shown on the x-axis. In this case, the states of the sequences represent different levels of the result: Incorrect (red), Partly correct (orange), Almost correct (yellow), and Correct (green). The data for this analysis were designed to reflect distinguishable patterns of performance improvement: moving progressively from incorrect to correct results over the five attempts (Type 1), consistently maintaining an “Almost correct” performance with no significant improvement (Type 2), and showing a steady improvement from partly correct to fully correct by the final attempt (Type 3).
Figure A4. Test-taking patterns.
Education 15 00028 g0a4
Interpretation and tips generated by the CustomGPT:
“The third script examines student performance over multiple test attempts. The graphs use colors to represent different performance categories (e.g., red for “Incorrect”, orange for “Partly correct”, yellow for “Almost correct”, and green for “Correct”). Each bar corresponds to a step in the sequence of test attempts, showing the progression of student performance. To interpret these graphs, we look for trends in performance improvement or consistency. This helps us identify students’ learning trajectories and provide appropriate support.
For instance, if a cluster shows gradual improvement from “Incorrect” to “Correct”, we interpret this as a positive learning trajectory. We suggest encouraging regular practice tests and providing feedback to maintain this improvement. If a cluster shows consistent “Almost correct” results with no significant improvement, we interpret this as a plateau in performance. We recommend identifying factors hindering progress and providing targeted exercises and personalized feedback to help these students improve further” (OpenAI, 2024).

Appendix D. Requirements, Evaluation Criteria and Possibilities for CustomGPT Development Process

Table A1. Stages and recommendations for CustomGPT development process.
StageRequirementsEvaluation CriteriaPossibilities
Educational log-data gathering and processingDefine the information to collect (e.g., actions and timestamps that may be of interest), determine granularity for adequate representation of the learning processAre all important actions and timestamps, including omissions or subtle events, considered? Can the level of detail in the data be adjusted after collection for specific analytical tasks? Are there artifacts in the data, and if so, can they be neutralized during further analysis?Ability to track micro-behaviors of students, including actions tied to specific content (e.g., reading, completing exercises, testing). Flexibility in log-file granularity—allowing a single log file to be used for analyses at different levels.
Ensure data protection and anonymity during collection, processing, and usage in CustomGPTDoes the system eliminate the possibility of data leakage at various stages of analysis? Are well-defined access levels provided for different users (teachers, administrators, etc.)?A flexible anonymity system allows for sharing aggregated data for research or product improvements while maintaining participant anonymity. It also enables personalized information for a limited audience (e.g., teachers and parents).
Define directions for analysis (e.g., activity trends, interaction strategies, test completion patterns), write analysis code, and test it in Python and RDo the analysis results reflect trends that are easy to interpret and of interest to teachers? Do Python script results match those obtained in R, confirming accuracy?Wide variability in analysis allows teachers to focus on what matters to them. The analysis can target students (class trends) or content (trends in studying a specific textbook) and can also be generalized or personalized.
VisualizationsDefine appropriate visualization methods for sequences based on analysis goals (state plot, distribution plot, etc.)Do the graphs represent real data without distortion, ensuring accurate understanding of patterns?Develop a dynamic visualization system that automatically selects the most appropriate type of graph (e.g., state plot for sequence analysis, distribution plot for frequency evaluation) based on input data and analysis goals.
Ensure intuitive visualizations—a color palette that allows clear differentiation of patterns; include a legend to define key visualization elementsAre the colors contrasting and easily distinguishable for different categories (e.g., actions, states, or test results)? Can teachers or analysts without technical training understand the visualization results?Create a visualization interface where teachers or analysts can choose color schemes and customize legends to simplify pattern understanding, allowing individualization of data representation for various audiences (e.g., teachers, parents, researchers).
InterpretationProvide CustomGPT instructions to train the model for understanding results, highlighting key trends (e.g., high relative frequency of a specific action during a session) and presenting them in interpretationsAre the interpretations consistently aligned with the highlighted trends across multiple scenarios or datasets?

Can the model adapt to variations in input data (e.g., different formats, levels of detail) without losing interpretation quality?
Interpretation might be based not only on developers’ instructions, but also on users’ interaction, which means the focus of interpretation might be more personalized
Ensure practice-oriented interpretation of results for teachers, where numerical metrics are translated into insights useful for understanding the learning processDo the insights align with teachers’ needs and can teachers implement changes or interventions based on the insights provided? Is there a feedback mechanism for teachers to refine the interpretation process and improve the relevance of insights over time?Further training of the chatbot could focus on highlighting key metrics that are of practical interest to teachers. For example, attention could be drawn to the absence of specific actions in patterns or, conversely, the dominance of a certain action at the beginning, middle, or end of a session.
TipsGenerated tips should be based on results in each particular case and their interpretation, so Interpretation + Tips become related to each otherAre the tips closely aligned with the specific results and interpretations for each case? Subsequent outputs can also build upon previous ones, forming a sort of portfolio for each student or class. This creates an opportunity for comparative analysis of interaction dynamics over time.
DLE specifications and interaction context should be taken into account while generating tipsAre the tips adapted to the context of the student’s learning behavior?The system could provide aggregated action plans for educators or administrators, summarizing the tips for multiple students or groups. This feature would allow educators to implement data-driven interventions at scale.

Appendix E. Interview Analysis

Table A2. Interview protocol.
Informative PotentialQuestion in the Interview
Background What are the main strengths of Opiq?
What disadvantages of Opiq have you noted?
RQ1Do you think that the process of students’ interaction with Opiq may vary? For example, students may use different strategies when learning material.
Do you think that different activities in Opiq (reading, video, gallery, practice, etc.) may vary depending on the context (task, age, subject, etc.)? Share your observations and thoughts on this matter.
Do you think certain combinations of interactions (e.g., reading + watching videos, or practicing in preparation for obligatory tests) can be effective in the learning process? Share your observations and thoughts on this matter.
Do you think that the order of studying content in Opiq matters?
Would you as a teacher benefit from more detailed information about student interaction with Opiq?
RQ2What information can you extract from graphs without explanation?
Is the textual interpretation of the graphs clear? Did it expand your understanding?
Do you find the tips the bot gives you based on current information useful?
RQ3What is your overall impression of the custom GPT?
What other statistics on your students’ use of Opiq would you like to know?
Table A3. Categories and code names resulting from the analysis of interviews.
DimensionCategoryCode
Opinions on the Opiq environmentPositive featuresUsing material from Opiq to create own content (tests)
Showing some content from Opiq
Showing different strategies for studying material
Collaboration with students
Saving time
Automatic assessment
Sustainability
Negative featuresLimited access
Less effectiveness in comparison to classic books
Technical issues
Outdated information
Opinions on the process of students’ interactionVariety of students’ interaction processTest-taking strategies
General learning strategies
Order of interactions
Certain combinations
Factors influencing students’ strategiesSubject
Quality of material
Motivation
Grade
Personal preferences
Platform flexibility
Information of interaction and ways of its applicationProcess of preparation for tests
How much time students spend on different activities
Process of test-taking
Using the information for additional support
Using the information to plan the workload
Check if some content is avoided
Opinions on the design and functionality of the Custom GPTVisualizationsPictures are clear
Legend ambiguity
Additional info needed
Related frequency concept
Pictures aren’t clear
DescriptionsDescriptions are needed
Descriptions can expand the understanding
Descriptions aren’t needed
TipsCan be useful
Different from teacher’s opinion on the case
Repeating description
Too general
Overall thoughts and ideas about the chatbotUncertainty about application
Group analysis
Individual analysis
Flexibility to expand the analysis
Using a tool for diagnostic at some specific moments
Privacy concerns
Wider application
Other ways of visualization

References

  1. Abbott, A. (1995). Sequence analysis: New methods for old ideas. The Annual Review of Sociology, 21, 93–113. [Google Scholar] [CrossRef]
  2. Aisenbrey, S., & Fasang, A. E. (2010). New life for old ideas: The “second wave” of sequence analysis bringing the “course” back into the life course. Sociological Methods & Research, 38, 420–462. [Google Scholar] [CrossRef]
  3. Alfirević, N., Praničević, D. G., & Mabić, M. (2024). Custom-trained large language models as open educational resources: An exploratory research of a business management educational chatbot in croatia and bosnia and herzegovina. Sustainability, 16, 4929. [Google Scholar] [CrossRef]
  4. Algarni, A. (2016). Data mining in education. International Journal of Advanced Computer Science and Applications, 7, 70659. [Google Scholar] [CrossRef]
  5. Almasre, M. (2024). Development and evaluation of a custom GPT for the assessment of students’ designs in a typography course. Education Sciences, 14, 148. [Google Scholar] [CrossRef]
  6. Ampadu, Y. B. (2023). Handling Big Data in Education: A Review of Educational Data Mining Techniques for Specific Educational Problems. IntechOpen. [Google Scholar] [CrossRef]
  7. Baker, R. S. J. D., & Inventado, P. S. (2014). Educational data mining and learning analytics. In Learning analytics (pp. 61–75). Springer. [Google Scholar]
  8. Bostock, M., & Heer, J. (2009). Protovis: A graphical toolkit for visualization. IEEE Transactions on Visualization and Computer Graphics, 15, 1121–1128. [Google Scholar] [CrossRef]
  9. Bürgin, R., & Ritschard, G. (2014). A decorated parallel coordinate plot for categorical longitudinal data. The American Statistical Association, 68, 98–103. [Google Scholar] [CrossRef]
  10. Chiarello, F., Giordano, V., Spada, I., Barandoni, S., & Fantoni, G. (2024). Future applications of generative large language models: A data-driven case study on ChatGPT. Technovation, 133, 103002. [Google Scholar] [CrossRef]
  11. Chukhlomin, V. (2024). Exploring the use of custom GPTs in higher education strategic planning: A preliminary field report. SSRN. [Google Scholar] [CrossRef]
  12. Collins, B. R., Black, E. W., & Rarey, K. E. (2024). Introducing anatomyGPT: A customized artificial intelligence application for anatomical sciences education. Clinical Anatomy, 37(6), 661–669. [Google Scholar] [CrossRef] [PubMed]
  13. Elzinga, C. H., & Liefbroer, A. C. (2007). De-standardization of family-life trajectories of young adults: A cross-national comparison using sequence analysis. The European Journal of Population, 23, 225–250. [Google Scholar] [CrossRef]
  14. Fasang, A. E., & Liao, T. F. (2014). Visualizing sequences in the social sciences: Relative frequency sequence Plots. Sociological Methods & Research, 43, 643–676. [Google Scholar] [CrossRef]
  15. Fonseca, D., García-Peñalvo, F. J., & Camba, J. D. (2021). New methods and technologies for enhancing usability and accessibility of educational data. Universal Access in the Information Society, 20, 421–427. [Google Scholar] [CrossRef] [PubMed]
  16. Fuller, K. A., Morbitzer, K. A., Zeeman, J. M., Persky, A. M., & Savage, A. C. (2024). Exploring the use of ChatGPT to analyze student course evaluation comments. BMC Medical Education, 24, 423. [Google Scholar] [CrossRef]
  17. Gaete Cruz, M., Ersoy, A., Czischke, D., & van Bueren, E. (2022). Towards a framework for urban landscape co-design: Linking the participation ladder and the design cycle. CoDesign, 19(3), 233–252. [Google Scholar] [CrossRef]
  18. García-Peñalvo, F., & Vázquez-Ingelmo, A. (2023). What do we mean by GenAI? A systematic mapping of the evolution, trends, and techniques involved in generative AI. The International Journal of Interactive Multimedia and Artificial Intelligence, 8, 7–16. [Google Scholar] [CrossRef]
  19. Guo, Y., Guo, S., Jin, Z., Kaul, S., Gotz, D., & Cao, N. (2022). Survey on visual analysis of event sequence data. IEEE Transactions on Visualization and Computer Graphics, 28, 5091–5112. [Google Scholar] [CrossRef]
  20. Haas, C. (2022). Applying Sequence Analysis in Higher Education Research: A Life Course Perspective on Study Trajectories. Theory and Method in Higher Education Research, 8, 127–147. [Google Scholar]
  21. Healy, K., & Moody, J. (2014). Data visualization in sociology. The Annual Review of Sociology, 40, 105–128. [Google Scholar] [CrossRef]
  22. Helske, J., Helske, S., Saqr, M., López-Pernas, S., & Murphy, K. (2024). A modern approach to transition analysis and process mining with Markov models in education. In M. Saqr, & S. López-Pernas (Eds.), Learning analytics methods and tutorials: A practical guide using R (pp. 381–427). Springer. [Google Scholar] [CrossRef]
  23. Honig, C. D. F., Desu, A., & Franklin, J. (2024). GenAI in the classroom: Customized GPT roleplay for process safety education. Education for Chemical Engineers, 49, 55–66. [Google Scholar] [CrossRef]
  24. Ji, Z., Lee, N., Frieske, R., Yu, T., Su, D., Yan, X., Ishii, E., Bang, Y., Madotto, A., & Fung, P. (2022). Survey of Hallucination in Natural Language Generation. ACM Computing Surveys, 55(12), 1–38. [Google Scholar] [CrossRef]
  25. Kabir, A., Shah, S., Haddad, A., & Raper, D. M. S. (2024). Introducing our custom GPT: An example of the potential impact of personalized GPT builders on scientific writing. World Neurosurgery, 193, 461–468. [Google Scholar] [CrossRef]
  26. Kleinman, E., Shergadwala, M., Teng, Z., Villareale, J., Bryant, A., Zhu, J., & Seif El-Nasr, M. (2022). Analyzing students’ problem-solving sequences: A human-in-the-loop approach. Journal of Learning Analytics, 9, 138–160. [Google Scholar] [CrossRef]
  27. Koedinger, K. R., D’Mello, S. K., McLaughlin, E. A., Pardos, Z. A., & Rosé, C. P. (2015). Data mining and education. Wiley Interdisciplinary Reviews: Cognitive Science, 6, 333–353. [Google Scholar] [CrossRef]
  28. Kotsis, K. T. (2024). ChatGPT as teacher assistant for physics teaching. EIKI Journal of Effective Teaching Methods, 2(4), 18–27. [Google Scholar] [CrossRef]
  29. Macmillan, R., & Copher, R. (2005). Families in the life course: Interdependency of roles, role configurations, and pathways. The Journal of Marriage and Family, 67, 858–879. [Google Scholar] [CrossRef]
  30. Malik, S., Shneiderman, B., Du, F., Plaisant, C., & Bjarnadottir, M. (2016). High-volume hypothesis testing: Systematic exploration of event sequence comparisons. ACM Transactions on Interactive Intelligent Systems, 6, 1–23. [Google Scholar] [CrossRef]
  31. McIntosh, T. R., Liu, T., Susnjak, T., Watters, P., Ng, A., & Halgamuge, M. N. (2024). A culturally sensitive test to evaluate nuanced GPT hallucination. The IEEE Transactions on Artificial Intelligence, 5, 2739–2751. [Google Scholar] [CrossRef]
  32. Opanasenko, Y., Pedaste, M., & Siiman, L. A. (2023). Students’ patterns of interaction with e-books in Estonian basic schools: A sequence analysis study. In Innovative technologies and learning: Proceedings of the 6th international conference, ICITL 2023, Porto, Portugal, 28–30 August 2023 (pp. 451–460). Springer. [Google Scholar] [CrossRef]
  33. Opanasenko, Y., Pedaste, M., & Siiman, L. A. (2024). Sequence analysis as a tool for visualizing students’ patterns of taking tests in interactive e-book environment. In Innovative technologies and learning: Proceedings of the 7th international conference, ICITL 2024, Tartu, Estonia, 26–28 August 2024 (pp. 120–128). Springer. [Google Scholar] [CrossRef]
  34. OpenAI. (2024). ChatGPT, (June 15 Version) [Large Language Model]. OpenAI.
  35. Pandya, K., & Tatikonda, N. (2023). QuizMasterGPT: CustomGPT for education. Preprint. [Google Scholar]
  36. Pechenizkiy, M., Trčka, N., Vasilyeva, E., van der Aalst, W., & De Bra, P. (2009, July 1–3). Process mining online assessment data. The 2nd International Conference on Educational Data Mining (EDM 2009) (pp. 279–287), Córdoba, Spain. [Google Scholar]
  37. Plaisant, C., Milash, B., Rose, A., Widoff, S., & Shneiderman, B. (1996, April 13–18). Lifelines: Visualizing personal histories. ACM CHI (pp. 221–227), Vancouver, BC, Canada. [Google Scholar]
  38. Raab, M., & Struffolino, E. (2022). Sequence analysis. SAGE Publications. [Google Scholar]
  39. Riehmann, P., Hanfler, M., & Froehlich, B. (2005, October 23–25). Interactive Sankey diagrams. IEEE Symposium on Information Visualization (InfoVis 05) (pp. 233–240), Minneapolis, MN, USA. [Google Scholar] [CrossRef]
  40. Romero, C., & Ventura, S. (2020). Educational data mining and learning analytics: An updated survey. WIREs Data Mining and Knowledge Discovery, 10, e1355. [Google Scholar] [CrossRef]
  41. Sanders, E., & Stappers, P. J. (2008). Co-Creation and the New Landscapes of Design. CoDesign, 4(1), 5–18. [Google Scholar] [CrossRef]
  42. Schulhoff, S., Ilie, M., Balepur, N., Kahadze, K., Liu, A., Si, C., Li, Y., Gupta, A., Han, H., Schulhoff, S., Dulepet, P. S., Vidyadhara, S., Ki, D., Agrawal, S., Pham, C., Kroiz, G., Li, F., Tao, H., Srivastava, A., . . . Resnik, P. (2024). The Prompt Report: A Systematic Survey of Prompting Techniques. arXiv, arXiv:2406.06608. [Google Scholar]
  43. Siemens, G., & Long, P. (2011). Penetrating the fog: Analytics in learning and education. EDUCAUSE Review, 46, 30. [Google Scholar]
  44. Tan, T. K., & Samavedham, L. (2022). The learning process matter: A sequence analysis perspective of examining procrastination using learning management system. Computers & Education Open, 3, 100112. [Google Scholar] [CrossRef]
  45. Tian, H., Lu, W., Li, T. O., Tang, X., Cheung, S. C., Klein, J., & Bissyandé, T. F. (2023). Is ChatGPT the ultimate programming assistant—How far is it? arXiv, arXiv:2304.11938. [Google Scholar]
  46. Valle Torre, M., Oertel, C., & Specht, M. (2023). The sequence matters: A systematic literature review of using sequence analysis in Learning Analytics. arXiv, arXiv:2308.01218. [Google Scholar]
  47. Van Poucke, M. (2024). ChatGPT, the perfect virtual teaching assistant? Ideological bias in learner-chatbot interactions. Computers and Composition, 73, 102871. [Google Scholar] [CrossRef]
  48. Wang, J., Shimada, A., Oi, M., Ogata, H., & Tabata, Y. (2020). Development and evaluation of a visualization system to support meaningful E-Book learning. Interactive Learning Environments, 31, 836–853. [Google Scholar] [CrossRef]
  49. Wang, T. D., Plaisant, C., Quinn, A. J., Stanchak, R., Murphy, S., & Shneiderman, B. (2008, April 5–10). Aligning temporal data by sentinel events: Discovering patterns in electronic health records. ACM CHI (pp. 457–466), Florence, Italy. [Google Scholar]
  50. Weller, M. (2022). The Rise and Development of Digital Education. In Handbook of Open, Distance and Digital Education. Springer. [Google Scholar] [CrossRef]
  51. Wongsuphasawat, K., Guerra Gomez, J. A., Plaisant, C., Wang, T. D., Taieb-Maimon, M., & Shneiderman, B. (2011, May 7–12). Lifeflow: Visualizing an overview of event sequences. ACM CHI (pp. 1747–1756), Vancouver, BC, Canada. [Google Scholar]
  52. Yao, J. Y., Ning, K. P., Liu, Z. H., Ning, M. N., & Yuan, L. (2023). Llm lies: Hallucinations are not bugs, but features as adversarial examples. arXiv, arXiv:2310.01469. [Google Scholar]
  53. Zhao, J., Liu, Z., Dontcheva, M., Hertzmann, A., & Wilson, A. (2015, April 18–23). Matrixwave: Visual comparison of event sequence data. ACM CHI (pp. 259–268), Seoul, Republic of Korea. [Google Scholar]
  54. Zhao, W. X., Zhou, K., Li, J., Tang, T., Wang, X., Hou, Y., Min, Y., Zhang, B., Zhang, J., Dong, Z., Du, Y., Yang, C., Chen, Y., Chen, Z., Jiang, J., Ren, R., Li, Y., Tang, X., Liu, Z., Liu, P., . . . Wen, J. -R. (2023). A survey of large language models. arXiv, arXiv:2303.18223. [Google Scholar]
Figure 1. Different techniques for visualization of sequential data 1. Sankey-based visualizations (Riehmann et al., 2005) mostly used for highlighting transitions at some point of the sequence; 2. Matrix-based visualizations developed for comparing sequence differences (Zhao et al., 2015); 3. The icicle tree visualization (Wongsuphasawat et al., 2011) as an example of hierarchy-based visualizations, mostly emphasizing branching of sequences; 4. Sequence–Frequency Plot (6 states) as a visualization of students’ test-taking patterns (Opanasenko et al., 2024); 5. Sequence–Frequency Plot (2 states) as a visualization of temporal learning activity patterns (Opanasenko et al., 2023); 6. Sequence Index Plot showing specific sequences of participating in MOOC (Tan & Samavedham, 2022); 7. Transition Plot of simulated educational roles (Helske et al., 2024).
Education 15 00028 g001
Figure 2. Functionality of CustomGPT.
Education 15 00028 g002
Figure 3. Output of CustomGPT (1—visualization of typical sequences; 2—overall description of sequence analysis visualizations; 3—description of the interaction pattern; 4—tips based on type of interaction).
Education 15 00028 g003
Figure 4. Opiq environment.
Education 15 00028 g004
Disclaimer/Publisher’s Note: The statements, opinions and data contained in all publications are solely those of the individual author(s) and contributor(s) and not of MDPI and/or the editor(s). MDPI and/or the editor(s) disclaim responsibility for any injury to people or property resulting from any ideas, methods, instructions or products referred to in the content.

