Article

Computational Thinking for Science Positions Youth to Be Better Science Learners

Lawrence Hall of Science, University of California, Berkeley, CA 94720, USA
*
Author to whom correspondence should be addressed.
Educ. Sci. 2025, 15(1), 105; https://doi.org/10.3390/educsci15010105
Submission received: 17 December 2024 / Revised: 11 January 2025 / Accepted: 13 January 2025 / Published: 18 January 2025
(This article belongs to the Special Issue Technology-Embedded Scientific Inquiry Practices)

Abstract

:
Computational thinking plays a central and ubiquitous role in many science disciplines and is increasingly prevalent in science instruction and learning experiences. This study empirically examines the computational thinking skills that are particular to engaging in science and science learning and then tests if these skills are predictive of science learning over the course of one semester. Using a sample from 600 middle school science students, we provide the psychometric properties of a computational thinking for science assessment and demonstrate that this construct is a consistent predictor of science content learning. The results demonstrate that the relationship between computational thinking for science and science content learning is consistent across variations in students and classrooms, above and beyond other demonstrated predictors—STEM fascination or scientific sensemaking. Further, the analysis also showed that experience with computer programming languages, especially block languages, is associated with higher levels of computational thinking. The findings reveal implications for research, teaching, and learning, including some implications for advancing equitable opportunities for students to develop computational thinking for science. This paper advances knowledge about how to ensure that students have the dispositions, skills, and knowledge needed to use technology-enabled scientific inquiry practices and to position them for success in science learning.

1. Introduction

Computational systems that collect, manipulate, and analyze data are an increasing part of our modern lives. They are integrated into and advancing scientific pursuits, critical social institutions (e.g., health care, transportation, food production/ distribution), and entertainment (e.g., sports, arts, media). Accordingly, it is increasingly important to attend to the way computational systems work, who gets to be part of their development, and whose problems they solve. However, until recently, the attention given to understanding and developing the skills and mindsets necessary to comprehend, use, and design these systems has not matched their significance in the modern world. Further, insufficient attention has been given to how to ensure that students have the dispositions, skills, and knowledge needed to use technology-embedded scientific inquiry practices to support science learning.
The growth of computing in all aspects of modern life has drawn increasing attention to how people should and do reason about computing. This broader perspective on reasoning about computing has been given the label computational thinking (CT; Wing, 2006). In 2010, Cuny et al. (2010, p. 1) offered a now widely used definition of computational thinking: “Computational thinking is the thought processes involved in formulating problems and their solutions so that the solutions are represented in a form that can be effectively carried out by an information-processing agent.” This definition positions CT as a set of cognitive processes, rather than computer science skills (e.g., programming), that could be and regularly is put to use well beyond the confines of computer science. Accordingly, efforts have increased to incorporate CT into educational practice across diverse subject areas (Allan et al., 2010; Pollock et al., 2019; Settle et al., 2012). These efforts are similar to how reading is seen as a general skill that also intersects and adapts based on the content domain; therefore, content-specific reading skills need to be developed. The movement related to CT is similar. CT manifests differently depending on the context (Yeni et al., 2024). Science, in particular, has become increasingly intertwined with computational thinking (Sneider et al., 2014), but the specific aspects of computational thinking that best position people for engaging with scientific inquiry have only recently been articulated (Hurt et al., 2023). Building from a framework proposed by Hurt et al. (2023), the present study explores the extent to which computational thinking for science is predictive of science learning across diverse learners and contexts.

1.1. Computational Thinking in Science

Computational artifacts, also called information-processing agents, are pervasive in the sciences. They support and often transform core science practices (e.g., tools that find related articles, suggest optimal experimental designs, make predictions, analyze data, or summarize results), especially the practices associated with modeling (Denning, 2017). The successful use of such tools, like all complex tools, must be intentional. Scientists must have some basic understanding of computation in order to successfully use such tools (Grover & Pea, 2013). We call this understanding computational thinking for science. Computational thinking for science is more than using computational artifacts as part of a science practice, it includes the process of considering the affordances and constraints of particular computational artifacts in order to use them successfully. Moreover, scientists are increasingly central in the creation of the computational artifacts themselves, as new technologies are developed, new applications of those technologies suggest new questions for investigation (Wing, 2011; Grover & Pea, 2013). Computational thinking for science, therefore, not only makes a host of vexing and long-standing questions in science more tractable but also invites new lines of questioning and new research pursuits that would be otherwise unimaginable. In order to be able to successfully engage in an increasingly computational science field, one must be able to engage in computational thinking for science. The concept of computational thinking for science thus characterizes the cognitive processes required to engage in a whole host of technology-embedded scientific inquiry practices.

1.2. Computational Thinking for Science in Science Education

Because computational models and simulations play a central and ubiquitous role in many science disciplines, they are increasingly prevalent in science instruction and learning experiences. Just as they have advantages for scientists, computational models and simulations also have advantages for learners in providing closer access to underlying processes and mechanisms (Malone et al., 2018; National Research Council, 2011; Wilensky & Reisman, 2006). Sneider et al. (2014) describe several ways that computational thinking allows learners to investigate science problems beyond their immediate physical surroundings. For instance, simulations allow students to experience scientific phenomena that they cannot observe directly, and computational thinking can allow for a deeper understanding of the simulation and position learners to draw meaningful conclusions. Likewise, data-mining large datasets allows learners to gather evidence to test hypotheses without having to conduct the experiments themselves; computational thinking allows learners to design effective search parameters to gather data relevant to their research question, as well as interpret data effectively based on its structure and properties. A number of grant-funded efforts have produced increasingly widely used simulations for middle and high school science (e.g., PhET, Molecular Workbench), and all the major commercial publishers also include online simulations (e.g., Amplify, Macmillan, McGraw-Hill, Pearson).
As with adult practitioners, however, youth will be most successful in using and learning from simulations if they are actively engaging with the tools and thinking critically about their use—how and why they are using the tool, what the outcomes of the tool do and do not convey, and the extent to which these simulations answer their questions at hand. Learners are expected to be able to use computational models (where appropriate) in making predictions, generating explanations, or designing solutions, as well as critique their uses in those practices. Hence, to be successful in modern science learning experiences, learners need to be able to think computationally within science contexts. The NRC Framework for K-12 Science Education and the NGSS both draw attention to computational thinking for these reasons (National Research Council, 2012; NGSS Lead States, 2013).
However, research to date has left several questions unanswered about the role of CT in science learning. One prior study showed that performance in a computational thinking college-level course was predictive of students’ overall academic performance in college (Haddad & Kalaani, 2015), albeit generalizations are difficult to make from this study as the sample was 95% male and focused exclusively on engineering majors. Other research found correlations between CT and academic pathways and career interests (Allan et al., 2010; Hava & Ünlü, 2021), but the extent to which these correlations were driven by CT and not other cognitive skills or processes (e.g., scientific reasoning) was unclear. Computational thinking is also correlated with STEM learning attitudes (Hava & Ünlü, 2021; Sun et al., 2021), but the extent to which each of these would uniquely predict science performance remains unclear. Finally, the majority of extant research has focused on general computational thinking (Allan et al., 2010; Haddad & Kalaani, 2015; Hava & Ünlü, 2021; Sun et al., 2021) without operationalizing CT within the context of science. As computational thinking is recognized as a core practice of science (NGSS Lead States, 2013), it is essential that we define which aspects of CT are most critical within science classrooms in order to position educators to teach these vital skills.

1.3. Measuring Computational Thinking for Science

Key barriers to research on the role of computational thinking in science have been a lack of a framework outlining the specific components of computational thinking that best position youth for success in science learning and the absence of corresponding assessments to measure those components. Previous definitions of computational thinking that were developed in computer science contexts are less useful in science classrooms where computers play a different role and students may or may not know how to program (Denning, 2017; Guzdial, 2015). Weintrop et al. (2016) proposed computational thinking in mathematics and science taxonomy to outline the types of activities that are likely to evoke computational thinking in a science or mathematics classroom. While useful for showing how CT manifests in science classrooms, this taxonomy and similar frameworks (e.g., National Research Council, 2012; K-12 Computer Science Framework, 2016) explicate activities that should evoke CT rather than the cognitive processes that constitute computational thinking for science. A clear outlining of the cognitive processes themselves is a necessary first step in measurement development.
To address this gap, Hurt et al. (2023) proposed a computational thinking for science framework (Figure 1) that aims to operationalize computational thinking for science as it manifests in a science classroom. The CT-S Framework explicitly outlines three types of interactions with computational tools (reflective use, design, and evaluation) that emerge during common science practices (data collection, data analysis, modeling, and problem-solving) and are likely to elicit computational thinking. The framework offers a specific articulation of what a technology-enabled scientific inquiry practice might entail for a student or scientist. As Hurt et al. describe (p. 6–7):
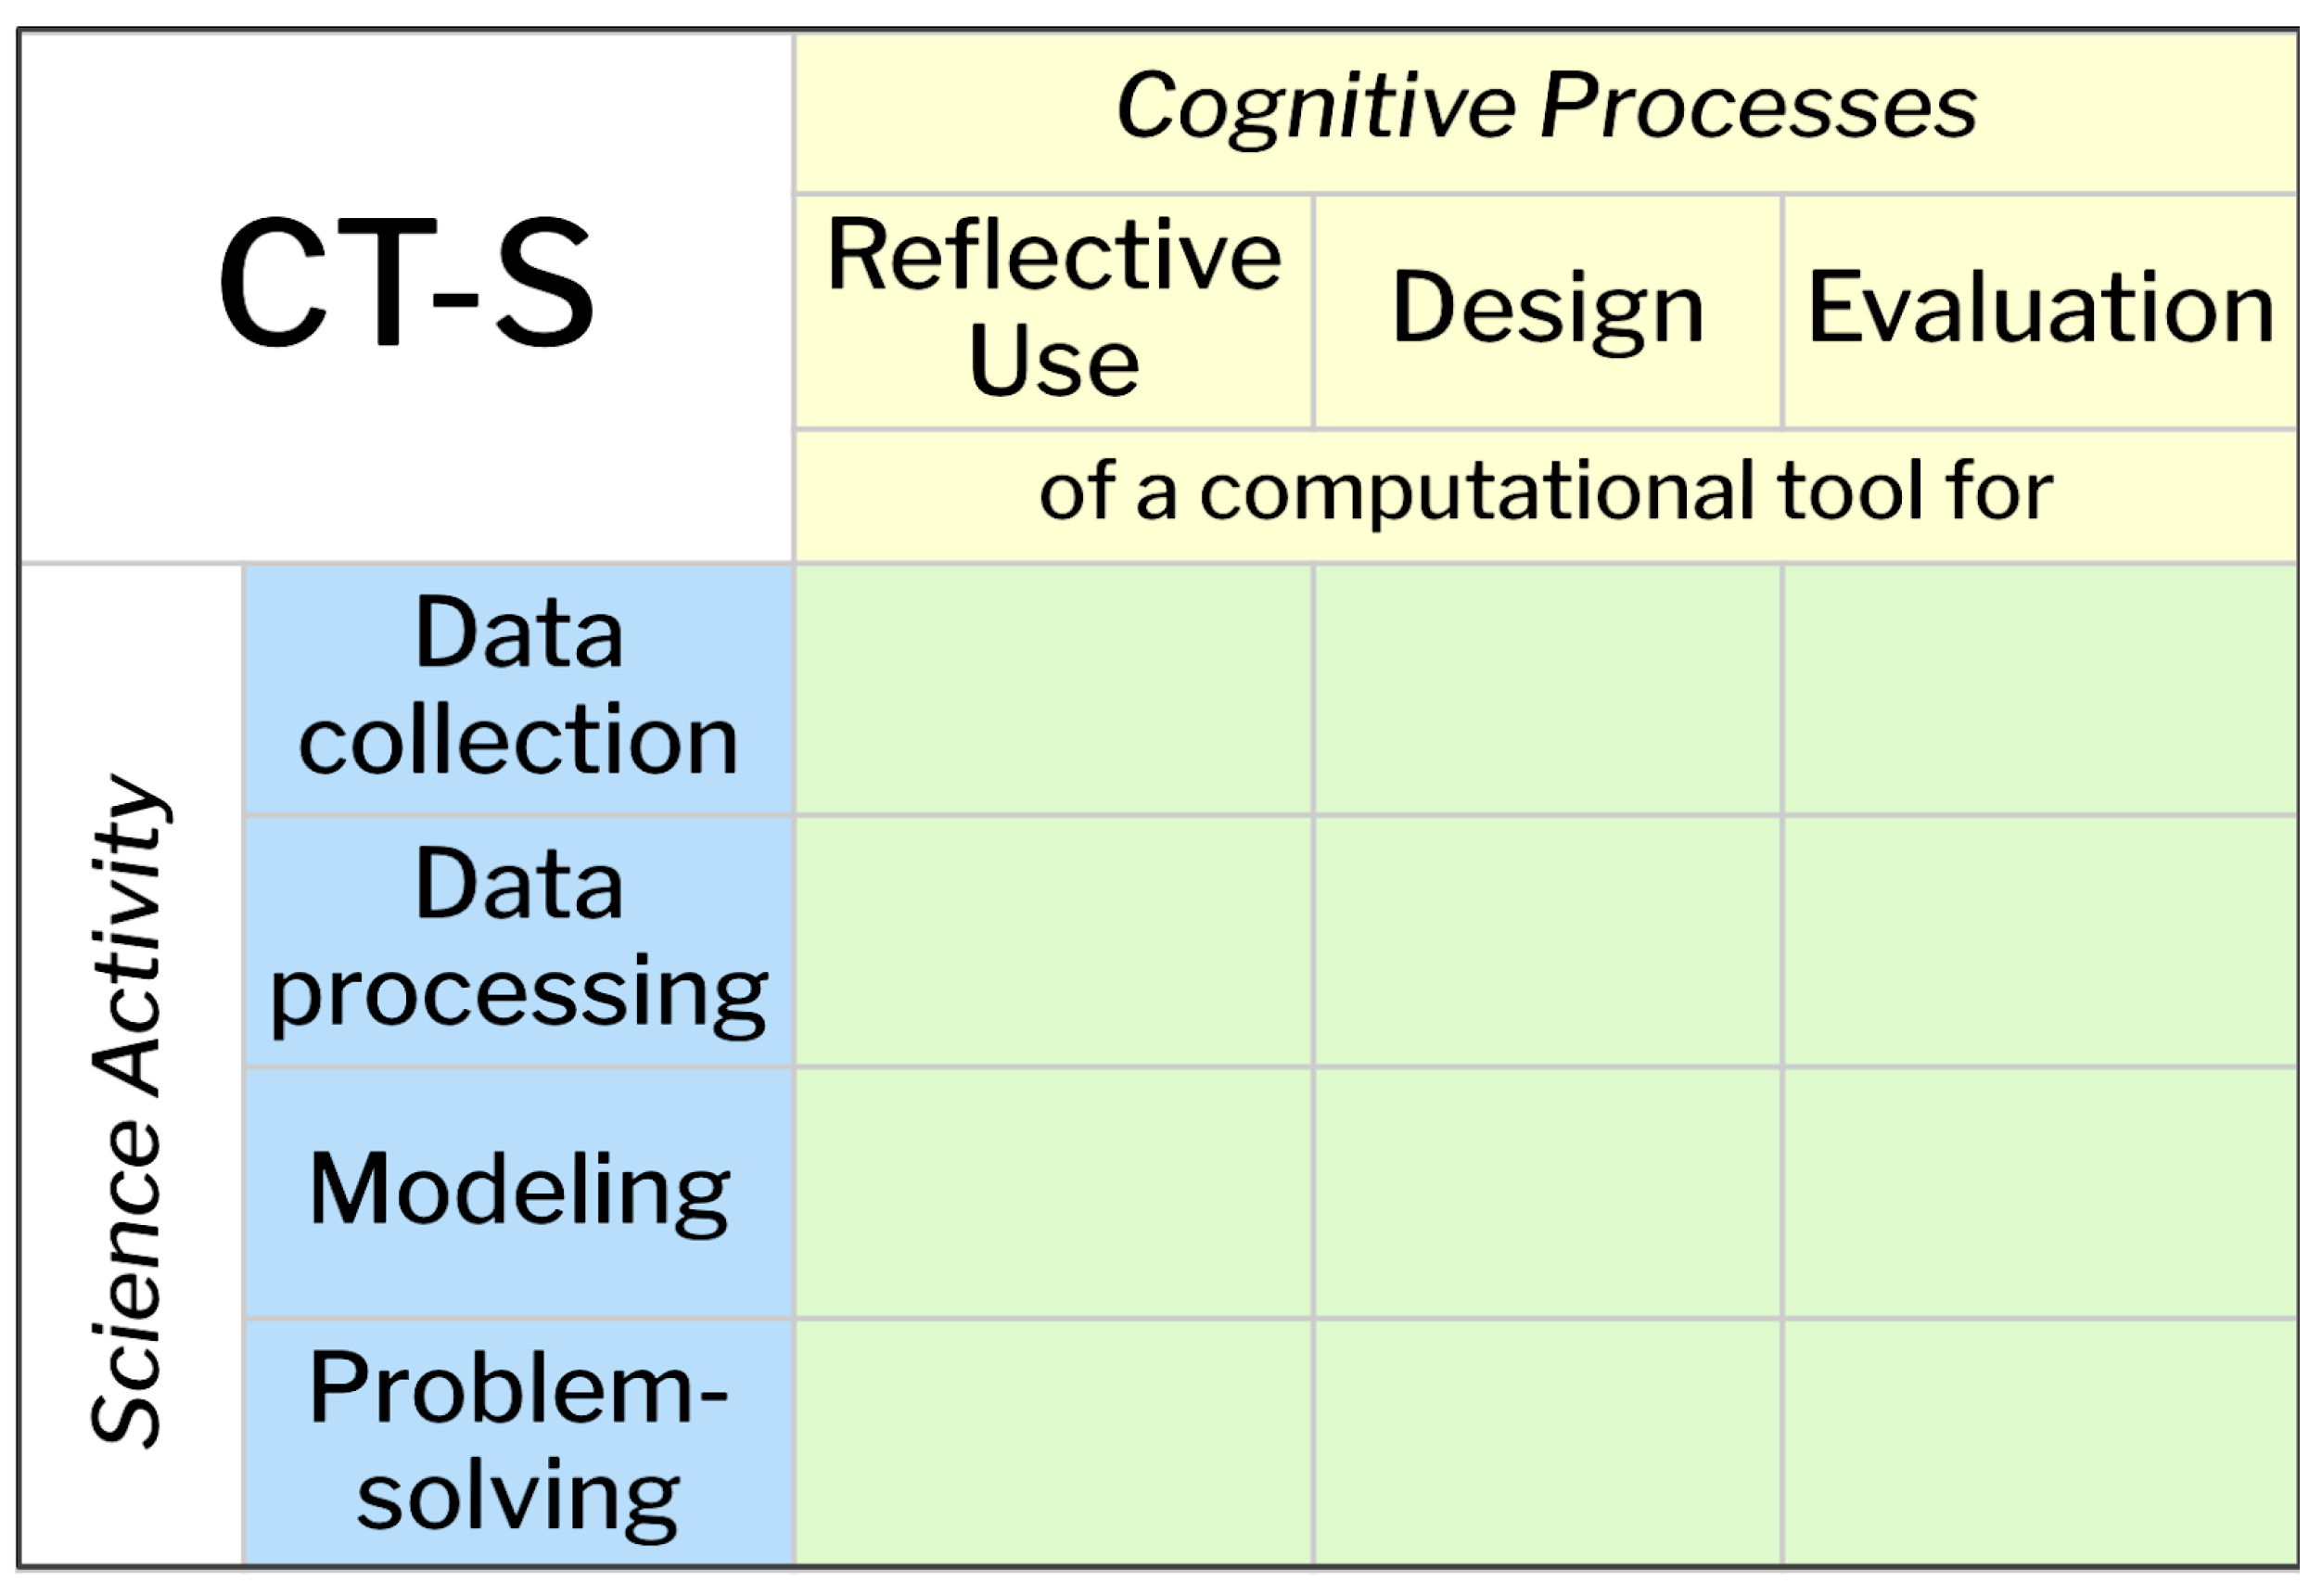
The framework is a table of four rows and three columns, which creates 12 cells. The rows represent four categories of science activity (data collection, data processing, modeling, and problem-solving) where computational tools are likely to be leveraged in K–12 science learning. The columns represent three interactions with computational tools (Reflective Use, Design, and Evaluation of computational tools) that engage the cognitive processes characteristic of computational thinking. Each cell within the framework, therefore, represents CT-S as the intersection of a row with a column. That is, any time an individual engages in a science learning experience that can be categorized by one, or more, of the cells in the framework, they are engaging in computational thinking for science.
In order to understand this framework, it is helpful to also note the definitions of each of the cognitive processes referenced within it. Reflective Use is defined as “building or modifying a mental model of [a] computational tool’s functionality through interaction with that tool” (p. 5). “Rote” use becomes “reflective” use when the individual is actively thinking about the tool’s functionality, rather than just clicking buttons or following step-by-step instructions. Within CT-S, reflective use of a tool occurs within the context of working toward a science learning goal. Design is defined as “building or modifying a mental model of an imagined computational tool’s functionality” (p. 5). To engage in design in a science learning context, the student must envision the science goal they are trying to achieve or science question they are trying to answer, envision the type of output that would be useful toward that goal, and articulate the steps needed in order to produce the desired outputs. Evaluation is defined as “building or modifying a mental model of the affordances and limitations of that computational tool’s functionality” (p. 5). Evaluation requires that the individual consider the types of output they would expect to see in different scenarios or under different conditions, compare these expectations with the actual outputs, and then evaluate how well the tool functions under different conditions. This framework served as the basis for designing an assessment of CT-S that is used in the present study. We describe the process of developing this assessment and the resulting assessment in further detail below.

1.4. The Present Study

This study empirically examines the extent to which CT-S is predictive of learning over the course of one semester in middle school science classrooms using a science curriculum that is rich in opportunities for computational thinking. In this paper, we present results and a large-scale study that was designed to establish the psychometric properties of a CT-S assessment and test three core research questions using this instrument:
RQ1:
Do variations in initial CT-S abilities predict science content learning gains across diverse learners, contexts, and content?
RQ2:
Do variations in initial CT-S abilities predict science content learning gains, controlling for previous STEM, computational, and coding experience?
RQ3:
Do variations in initial CT-S abilities predict science content learning gains above and beyond STEM fascination and scientific sensemaking?
This study built upon prior work of the Activation Lab, specifically the construct they defined, science learning activation, which includes a set of dispositions, skills, and knowledge that position students for success in science learning (Dorph et al., 2016). In addition to CT-S, in this study, we also explored the activation dimensions of scientific sensemaking and STEM fascination. Scientific sensemaking refers to the degree to which the individual engages with science learning as a sensemaking activity using methods generally aligned with the practices of science, such as asking investigable questions; seeking mechanistic explanations for natural and physical phenomena; and engaging in evidence-based argumentation about scientific ideas (Chung et al., 2016). Scientific sensemaking has been shown to predict content learning in science classrooms, regardless of student characteristics or educational content (Cannady et al., 2019). STEM Fascination refers to a “positive affect towards doing STEM activities, curiosity about the natural and built world, and goals of acquiring and mastering skills and ideas related to STEM” (Chen et al., 2017, p. 1). These two dimensions of activation were chosen for this study as they represent two different aspects of activation toward science; fascination represents the willingness to engage and scientific sensemaking addresses how able the individual is to engage. Thus, the present study examines whether computational thinking for science is uniquely predictive of learning in science classrooms, above and beyond these two other currently known predictors of science learning—scientific sensemaking and STEM fascination.

1.5. Design Challenges for Our CT-S Assessment

To test our hypotheses about the theoretical framework of CT-S and the function of CT-S in science learning, we needed to develop a functional CT-S assessment for middle school students. Here, we describe our approach to developing this assessment and our strategies for addressing development challenges.

1.5.1. Content-Integrated but Not Rare Content-Dependent

As described by Hurt et al., engaging in CT-S requires that students be thinking computationally, within a science context, toward a science learning goal. Thus, any items developed to measure CT-S must be situated within a science context yet focused on measuring computational thinking for science, not science content knowledge, per se. In order to reduce the confounding influence of science content knowledge, items were developed (1) to be situated within common, rather than rare, scientific content knowledge and (2) to include all necessary content within the assessment itself. This two-part approach of using common science content areas was also used in the PISA assessments of scientific literacy competencies (OECD, 2019) and in the Activation assessment of scientific sensemaking (Cannady et al., 2019). We selected and situated items within two common contexts: predator–prey systems and measuring temperature.

1.5.2. Activation Constraint

Given that this study situates our CT-S measure development and investigation in the context of all the measurement design efforts of the Activation Lab, we used the same design criteria and constraints for the CT-S instrument as we had used for the other dimensions of activation. These criteria had been established to ensure that the measures would be useful and usable in a systematic, comparable, and scalable manner across multiple and diverse learning settings (i.e., both in and out of school) and with diverse learners (e.g., race/ethnicity, gender, SES). These criteria include easy to administer on multiple platforms (including paper or online); short (average completion of no more than 20 min/dimension); does not require physical materials; and does not require manual scoring or grading. Accordingly, the final instrument is multiple choice and can be administered on paper or online.

1.5.3. Pandemic Constraints

The present study took place in the 2020–2021 school year, during which the COVID-19 pandemic significantly altered education across the United States. This context had implications for study design—specifically, what was originally planned to be a year-long longitudinal study was shortened to just one semester. The pandemic context also had implications for instrument design, as the final instrument needed to be compatible with administration under various classroom formats, including in-person, online, or hybrid classrooms. Thus, all participating classrooms completed the multiple-choice instrument online using the Qualtrics platform. Despite recruitment challenges given the pandemic context, the study has a large sample of youth from diverse science classrooms across the United States.
Working within these constraints and with the CT-S framework (Hurt et al., 2023) as a guide, we developed an initial item set through either (a) adapting and/or extending related scales in the literature (notably, Weintrop et al., 2016), or (b) creating new items internally when we could not find extant ones that aligned with the framework. Items were iteratively developed and refined through several steps. First, we conducted a series of cognitive interviews to develop the initial item set. Next, we piloted the items with 5th, 6th, 7th, and 8th grade students. During the pilot, we also administered the scientific sensemaking measure and a computational thinking test (Román-González et al., 2017) for convergent validity of measurement. We then solicited evaluative feedback on the existing items and pilot data results from our advisory group, which included both computational thinking and science learning experts. Based on the analyses and evaluations of the cognitive interviews, pilot data, and expert panelist feedback, items were created, dropped, or adjusted accordingly. We went through the item development process two full times. The results of the item development process and pilot test can be found in the technical report (Cannady et al., 2022). The process above resulted in the Computational Thinking for Science Scale, described in the measures section of this paper.

2. Materials and Methods

2.1. Study Overview

This study included two key phases: (1) the creation and refinement of an assessment of computational thinking for science and (2) an 18-week, multi-cohort longitudinal study of CT-S in 6th and 8th graders. This study was designed to speak directly to (RQ1) the relationship of CT-S with science content learning across diverse learning contexts and content, (RQ2) controlling for previous STEM, computational, and coding experience, and (RQ3) above and beyond the role of STEM Fascination and Scientific Sensemaking. The study also investigates whether the relationship between CT-S and learning varies based on the in-person, hybrid, or online status of science instruction or the course content (earth, life, and physical science) (RQ4).
The reason for targeting 6th and 8th grade is to capture the beginning and end of the critical middle school years—a time when students often (1) have a designated science class and teacher for the first time, (2) develop a richer appreciation for the differences that exist across subject matter domains, and (3) interest in science and science learning begins to wane for many students (Potvin & Hasni, 2014). Further, this is the time when students begin to have more agency in selecting electives which may drive both the development of greater interest in a subject and large differences in participation in other optional computation-related learning (Witherspoon et al., 2016).
We conducted this study during a single academic year for two reasons. First, we wanted to minimize attrition that would be introduced if students were to change grade levels. Second, we wanted to control the science learning experience within a single teacher rather than across teachers over multiple years. Given that our previous studies show that much can be learned in a single year of data using this measurement approach (Dorph et al., 2016, 2017; Vincent-Ruz & Schunn, 2017; Bathgate et al., 2015; Bathgate & Schunn, 2017a, 2017b; Lin & Schunn, 2016), we expected the same sensitivity of CT-S to classroom and extracurricular activities over this time period.

2.2. Participants

The sample was drawn from middle school science classrooms using the Amplify Science curriculum, a widely adopted science curriculum that features digital simulations. Working with the Amplify Science team, we sent study invitation emails to all 6th and 8th grade teachers in 44 districts that had adopted the Amplify Science curriculum, spread across 18 US states and territories. After teachers accepted our invitation to participate in the study, we invited their students to participate in the study. Of the consenting students, only those who completed the CT-S measure, as well as the pre- (or mid-unit) and post-Amplify Science content assessments, are included in the analysis described below. Thus, our effective sample size was N = 600 based on students who had responded to at least 60% of the CT-S items at pre- and had pre- and post-test scores on Amplify Science assessments. The youth in this resulting sample came from 15 teachers across 9 schools. Table 1 below describes the demographic characteristics of the sample.

2.3. Data Collection Procedure

Data collection took place between November 2020 and May 2021. For each classroom, data collection spanned the duration of one or two Amplify Science Middle School units (8–16 weeks). Students completed an online survey that included the CT-S items as well as measures of STEM Fascination, Scientific Sensemaking, prior STEM and computational experience, and demographic information prior to the start of the selected Amplify unit(s). Students also completed a pre-content assessment for the relevant Amplify unit. After the completion of the Amplify unit(s), students completed an Amplify post-content assessment. Students completed surveys online through the UC Berkeley licensed version of Qualtrics and content assessments either through the Amplify platform or on paper, depending on the teacher’s preference.

2.4. Measures

A single survey link administered prior to the Amplify Science unit(s) included the following measures:

2.4.1. Computational Thinking for Science

The Computational Thinking for Science (CT-S) scale is a 20-item multiple-choice measure to engage students in computational thinking within common science contexts—predator–prey systems and measuring temperature. To engage students in CT-S, items were designed to elicit cognitive processes (reflective use, design, and evaluation) around a computational tool while engaging in common science practices (data collection, data processing, modeling, and problem-solving). Student responses were coded as correct (1) or incorrect (0), for each item. Validity evidence for the scale, including reliability and factor structure, is presented in the results section. An example item is shown in Figure 2. Students seeing this item had previously been informed of the hunting characteristics of the Good-Eye Predator and Sharp-Tooth Predator as well as the behavioral response of prey when confronting a predator that hunts them (prey runs away) or does not hunt them (prey stays still; see Supplementary Materials for the full context in which this item is embedded).

2.4.2. Scientific Sensemaking

The scientific sensemaking instrument (Cannady et al., 2019) consists of 12 items all contextualized within one of three common scientific scenarios—in this case, monkeys, with alternative versions focused on dolphins and eagles. Although the items are contextualized, they rely on broad, rather than specific knowledge. For example, items assume that respondents know that monkeys are animals, that they can climb trees, and similar details. They do not assume that students know how much food monkeys eat, what parts of the world they live in, or any other rare or specialized monkey knowledge. An example item is shown below in Figure 3. Student responses are coded as correct (1) or incorrect (0), for each item. The scale has strong internal reliability (Armor’s Theta = 0.91).

2.4.3. STEM Fascination

To measure Fascination in STEM, each participant was asked to indicate their level of agreement on a 4-point scale (1 = NO!, 2 = no, 3 = yes, 4 = YES!) with statements about their curiosity, mastery goals, and wonder in STEM. Questions include “I love designing things!”, “I want to learn as much as possible about Math.” The scale has good internal consistency reliability (Cronbach’s alpha = 0.85; polychoric alpha = 0.89) and all items load on a single factor. These items were developed as a part of the Activation Lab work (Chen et al., 2017).

2.4.4. Content Knowledge Assessment

Given the wide range of classrooms recruited for this study, different pre/intermediate/post-content knowledge tests were used to assess how much the students learned from their classroom instruction during the period of the study. Each classroom took the Amplify Science curriculum’s assessments developed for the content unit they completed during the period of the study. We computed and utilized test-specific z-scores to make the scores comparable across forms. Each test form contained 12 multiple-choice questions targeted at the three ordered levels of content understanding addressed in the content unit. Each of these three levels of understanding is targeted by four questions, with distractors representing frequent/expected alternative conceptions. The reported student level thus ranged from 0 to 3, before being converted into test-specific z-scores. The Amplify Science curriculum’s assessment items were developed by a team of assessment developers, refined through cognitive interviews with students, and piloted to check psychometric properties.
Amplify content knowledge assessment scores are assigned through a combination of Bayesian inference and human prescription for handling edge cases. The primary Bayesian approach assumes that student knowledge of each level is dependent on the supporting levels (e.g., a student cannot have a level 2 understanding of the content without understanding level 1 content) and that responses to the assessment items are simply determined by this knowledge state (for the content level of the item) and typical guess and slip probabilities for multiple choice assessments. Edge case knowledge level assignments were modified from this Bayesian calculation in order to make teacher hand-scoring using simple rules more consistent with calculated level assignments.
Background survey. Participants provided demographic information in a survey that asked them about their grade, gender identity, and race/ethnicity. For gender identity, students were asked to select one of five options: female, male, non-binary, prefer to self-describe, or prefer not to say. After cleaning responses under “prefer to self-describe” (e.g., to recode “boy” as male), we created a binary variable, NonMale, with those selecting “male” coded as 0 and all others coded as 1. Students were asked to select among six different racial/ethnicity options with which they identified and were allowed to choose more than one. From the ethnicity data, we created a binary variable called Underrepresented Minority. Students who chose only White, only Asian, or White and Asian, were coded as 0; all others were coded as 1. Youths were also asked to indicate the type of coding that they had experience with. Options included block (e.g., Scratch), typed (e.g., Java, Python), HTML, Lego, and Other (with a text box to describe the other language they had experience with). Youth who did not select any languages and answered the question after this one in the survey were coded as having no programming experience, as well as youth who indicated “other” and either left the comment box empty or explicitly stated they had no programming experience in the textbox. Youth who selected a language or other and commented with a language (angry bird coding game, C++, Malbolge, etc.) or a description of a coding experience (hour of code, code.org, etc.) but no specifics about the language were given a count for the number of language types indicated. Table 2 provides the descriptive statics for these variables and all variables used in the models.

2.4.5. Data Analysis

All analyses were performed using R Statistical Software (v4.2.1; R Core Team, 2021). Our analysis begins with reliability and confirmatory factor analysis to test the psychometric properties and validity of the CT-S instrument. We then assess convergence with previous programming experience to gather evidence of external validity. After having demonstrated strong psychometric properties and external validity evidence, we address our research questions through a series of hierarchical linear models to control for nested data using clmm from the ordinal package in R (v.2019-12-10; Christensen, 2019). To remove variation due to other demographic variables associated with science learning, we begin by including gender, race, home resources (as a proxy for socioeconomic status), and English language proficiency as covariates. Then, to better isolate the unique contribution of CT-S as a set of cognitive processes rather than just a reflection of specific prior learning experiences, we include prior STEM, computational, and coding experiences as covariates. Lastly, to determine the extent to which CT-S predicts science learning, above and beyond other dimensions of Science and STEM Activation, we add STEM Fascination and Scientific Sensemaking.

3. Results

In this section, we consider two types of study results. First, we describe results that establish the validity of the CT-S instrument we designed. Next, we consider results that address the three research questions that we investigated through this study.

3.1. CT-S Instrument Characteristics and Validity Argument

3.1.1. Reliability and Confirmatory Factor Analysis

The item set showed acceptable reliability (α = 0.77) with no items contributing negatively to the overall reliability. We conducted a unidimensional confirmatory factor analysis, assigning all items to a single factor. The model showed a good fit to the data (CFI > 0.9, RMSEA < 0.05, and SRMR < 0.05). We also fit the data to a one-parameter item response theory model (1PL) and found a good model fit (RMSEA = 0.037, CFI = 0.901, SRMR = 0.041) with no significant differential item functioning (DIF) across differences in gender identity, STEM majority/minority race or ethnic status, resource access, or prior programming experience. Further, we found the two versions of the CT-S scale (one used at pre and one at post) to be measurement invariant; X2 = 19.72, p = 0.07. Collectively, this indicates the two versions are psychometrically well-performing, providing reliable scores of a single latent trait, with no observed systematic bias in item performance across important subgroup differences in our sample.

3.1.2. Convergence with Programming Experience

In the previous section of this paper, we established the psychometric properties of the CT-S measure. In this section, we compare CT-S scores with previous programming experience. While CT-S and computer programming are not the same thing, we would expect youth with more experience in programming to have higher CT-S scores than youth with less experience. Further, we would expect youth with experience in block coding (e.g., Scratch) to have the largest increase in scores on CT-S as the items make use of symbols and user interfaces that are similar to block coding. In the table below (Table 3), we provide the mean z-score on CT-S for zero, one, and two or more languages of programming experience.
As evidenced in the table, youth with no programming experience had the lowest overall mean score in CT-S (−0.21). With experience in one programming language type (independent of what type it was), the overall mean CT-S score increased to −0.04, and with experience in a second programming language the CT-S score increased again to 0.125. We did not see further increases in CT-S with additional experience in programming types beyond two languages (three or more languages = 0.073). We looked at the impact of specifically block coding experience since it is the most common programming experience among our participants and has a user interface most similar to the item types in our measurement tool. We compared all youth who had at least some block coding experience to youth who had no block programming experience (this only includes youth who have some programming experience but no block programming experience) and found a statistically significant difference in their mean scores. Together, this indicates that the amount and type of programming experience a youth has is related to their CT-S score. This provides some evidence that the CT-S measure is measuring a skill that is associated with programming experience and that it is more aligned with the conceptual understanding of programming than it is with the syntax of programming. This also demonstrates that CT-S ability is unlikely to be an inherent ability of individuals, but rather a trait that can be modified through instruction or experiences.
RQ1: Do variations in initial CT-S abilities predict science content learning gains across diverse learners, contexts, and content?
To address our first research question, we test whether CT-S is an independent predictor of youths’ science content learning. For this set of analyses, we use p < 0.05 to determine the statistical significance of the main effects and interactions. First, we calculated the Spearman’s rank correlations between youths’ scores on the CT-S assessment with their scores on the classroom-embedded content assessments. These results are shown in Table 4. CT-S pre-scores are correlated to both the pre- and post-content assessments (0.28 and 0.31, respectively). These correlations are relatively low and unlikely to cause multicollinearity problems in our multiple regression analyses. Further, these relatively low, but non-zero, correlations indicated that the instruments are likely measuring related, but separate constructs (CT-S and scientific content knowledge).
Next, we ran a two-two level hierarchical linear model (HLM) to control for nested data effects from differences across classrooms and schools using the lme4 package in R (Bates et al., 2015). The conditional R2 was computed using the method provided by Nakagawa and Schielzeth (2013). It estimates the proportion of variance explained by the whole model accounting for the fixed and random effects. Model 1, below in Table 5, represents the fully unconditional model. In this model, we found an intra-class coefficient of 0.11, implying that 11% of the total variation in content outcome scores in the sample is between classrooms rather than between individuals. Given the ICC and the nested structure of the data, we conducted the remaining analyses in HLM The first three rows of the table indicate the threshold in the log odds for transitioning from one level of the post-test score to the next level, for example from zero to 1, then 1 to 2, and finally, 2 to 3. Model 2 predicts the content post-test score using only the content pre-test score that is captured in three separate variables. The first of these variables account for which post-test was used, either at the end of the unit (which was identical to the pre-test) or a mid-unit check of understanding, which is aligned with, but different from, the pre- or post-test. (The mid-unit check was used only in instances when the pre-test was unavailable, due to student absences or missing data.) The second is the linear relationship and the fourth is the quadratic relationship between the pre- (or mid-point) score and the post-score. This model indicates that there is no difference in the relationship based on which pretest is used, and both the linear and quadratic relationships are significant. In model 3, we included CT-S as a predictor. The results indicate that, even though prior content knowledge accounts for some of the variation in the content knowledge post-test score, CT-S accounts for 8% of the variance, and the standardized beta is on the same order of magnitude as that of the pretest. This implies that the variation in content knowledge post-test scores are roughly equally explained by the pretest score and the CT-S score. That is, CT-S is as useful a predictor of end-of-unit content knowledge as is beginning-of-unit content knowledge.
After establishing that CT-S is a predictor of science content learning, we then tested whether gender or racial/ethnic identity, availability of home resources, prevalence of English spoken at home, or grade level act as moderators of the way CT-S predicts posttest content knowledge scores (Table 6). We found no differences in content learning across gender, racial/ethnic identity, availability of home resources, the prevalence of English spoken at home, or grade, and no significant interactions among these variables with CT-S in predicting post-science content knowledge when controlling for pre-science content knowledge. This indicates that CT-S’s relationship to learning is consistent; it does not differ based on gender or racial/ethnic identity, availability of home resources, prevalence of English spoken at home, or grade level across youth.
We next looked to see if there was any variation based on some of the environmental conditions in the classroom. Since the study took place in the winter and spring of 2021, we had a variety of classroom conditions, with some schools meeting in person, some in a hybrid format, and some operating fully online. We combined the online and hybrid classrooms and compared those with the in-person classrooms to see if there were observable differences in the relationship between CT-S and science content learning. As shown in Table 7, we see no main effect or interaction effect of in-person or remote status on science content learning, indicating that the role CT-S played in science content learning was consistent across in-person and online instruction status.
Further, we explored if the role of CT-S on science content learning varied based on the subject matter unit. Table 7 shows the number of classrooms that completed earth science, life science, or physical science content during the study period. We compared the combination of earth and life science with physics due to the sample sizes in each of these subjects. As seen in Table 7, there is no difference in the post-science content assessment scores based on the course content and no difference in the relationship between CT-S and science content learning across the variation in course content. This implies that the role of computational thinking for science is consistent across the scientific content matter.
RQ2: Do variations in initial CT-S abilities predict science content learning gains, controlling for previous STEM, computational, and coding experience?
In service of investigating our second research question, we explored how previous experiences in computational thinking, STEM, or programming moderate how CT-S predicts post-test content knowledge scores (Table 8). When controlling for pre-science content knowledge, we found no differences in content learning across scales of previous experiences and no significant interactions among these variables and CT-S in predicting post-science content knowledge. This indicates that CT-S’s relationship to learning is not different based on the youth’s prior experiences in CT, STEM, or programming youth. While at first this may seem surprising, this likely indicates that any benefit gained in prior experiences was accounted for in the science content knowledge pretest and therefore controlled for in the model. Either way, this model indicates that CT-S plays an important role in science content learning for youth with extensive and minimal previous experience with CT, STEM, or programming.
RQ3: Do variations in initial CT-S abilities predict science content learning gains above and beyond science fascination and scientific sensemaking?
Finally, we explored our third research question by considering how fascination with science and scientific sensemaking moderate how CT-S predicts post-test content knowledge scores (Table 9). We found no differences in content learning even after including fascination and scientific sensemaking in our model. Further, we found no significant interactions among these variables and CT-S in predicting post-science content knowledge when controlling for pre-science content knowledge. These findings indicate that the relationship between CT-S and science content learning is not different based on the youth’s fascination with science or their level of scientific sensemaking. This implies that CT-S is a separate and unique contributor to science learning than either fascination with science or scientific sensemaking.

4. Discussion

4.1. What We Learned

In this section, we discuss the key findings and limitations of this study by research question, the implications for science teaching and learning, and the potential uses of this instrument.
RQ1: Do variations in initial CT-S abilities predict science content learning gains across diverse learners, contexts, and content?
Across our diverse sample of learners, we found that computational thinking for science serves as a consistent predictor of science content learning (e.g., Table 7, Table 8 and Table 9) across classroom settings (remote, hybrid, or in-person) and diverse science content areas (life science, earth science, or physics). We tested for interactions with learner characteristics (gender identity, racial//ethnic identity, language status, home resources) that may have been associated with differences in learning gains. Though we found that there was variation in gains in science content scores across learners that varied in the home resources available to them (with more resources predicting more gains), we found there was no interaction between CT-S and availability of home resources—or, for that matter, gender, grade, or underrepresented minority status. This lack of interaction implies a broad generality that CT-S is productive for learning across learner characteristics often implicated in science learning outcomes. Recognition of such findings is important for developing science learning environments that make use of broad student assets to promote learning experiences that are neither culturally biased nor biased towards prioritizing ways of reasoning that are not broadly productive.
RQ2: Do variations in initial CT-S abilities predict science content learning gains, controlling for previous STEM, computational, and coding experience?
After having found that CT-S was predictive of science learning across diverse learners, contexts, and content, we next considered the role of previous STEM, computational, and programming experiences. We found no associations between previous experiences and learning gains. While at first this may seem surprising, this likely indicates that any benefit gained in prior experiences was accounted for in the science content knowledge pretest and therefore controlled for in the model. In contrast, however, CT-S was predictive of learning even after controlling for pretest scores and these prior experiences. Thus, CT-S is more than just a proxy for prior programming or STEM experience. Rather, CT-S positions youth to be better learners, by enabling them to think computationally in using, designing, and evaluating computational tools to approach and reason through scientific problems.
We also did not find any interactions between previous experience and CT-S in predicting post-science content knowledge when controlling for pre-science content knowledge. This indicates that CT-S’s relationship to learning is not different based on students’ prior computational, STEM, or programming experiences and that CT-S is helpful in learning science whether students have extensive or minimal programming experience.
RQ3: Do variations in initial CT-S abilities predict science content learning gains above and beyond STEM fascination and scientific sensemaking?
Lastly, having shown that CT-S is valuable for diverse learners, in diverse settings and content areas, bringing diverse prior experiences, we investigated whether CT-S was predictive of science content learning above and beyond previously identified dispositions, practices, and knowledge that position youth for success in science: STEM fascination and scientific sensemaking. While we found no effect for STEM Fascination after controlling for other variables, we indeed found that both CT-S and SSM play unique roles in predicting science content learning. This indicates that thinking computationally is distinct from reasoning scientifically and that both are critical elements of successful science learning in increasingly computational science classrooms.
This study provided the first evidence that computational thinking for science is a unique set of competencies and cognitive processes, above and beyond general computational thinking and scientific reasoning, which play a valuable role in science learning. Knowing this value, further research should seek to better understand the development of computational thinking for science, including predictors of computational thinking and how it changes over time. While some research has explored non-malleable predictors of computational thinking—such as gender, which has shown mixed patterns in its prediction of CT (e.g., Román-González et al., 2017; Sun et al., 2022)—it would be more practicable to understand the role of educational interventions and teaching practices in supporting the development of CT, generally, and CT-S, specifically.

4.2. Implications for Learning and Teaching

4.2.1. Learning Design

The success of instructional interventions designed to promote CT-S and thus support learners to develop the skills to engage in the technology-embedded scientific inquiry process requires both an understanding of the specific learning experiences that would promote CT-S as well as teachers with the knowledge and skills to implement the experiences effectively. As an associational study, the present research study was not designed to identify the predictors of CT-S or to test interventions to improve CT-S. The question remains, therefore, of which specific learning experiences or pedagogical strategies would be most effective in improving students’ computational thinking. This study did find preliminary evidence that prior experience with block coding, such as through Scratch (scratch.mit.edu), may be particularly valuable for supporting the development of computational thinking—perhaps even more so than experience with other text-based programming languages. This association between block coding and computational thinking makes sense, as block coding requires generalized skills such as abstraction, sequential thinking, and logical reasoning, without being overshadowed by the added complication of a specific programming language’s syntax requirements. However, though there is a plausible mechanism through which block coding could improve CT-S, the findings from this study were purely associational, not causal. Therefore, future research should explore whether interventions including block programming lead to improved CT-S.

4.2.2. Teaching

As far as teacher preparedness, a recent study found that secondary science teachers lack confidence in their own ability to infuse CT into their instruction and seek professional learning opportunities to learn more (Kite & Park, 2022). They also question their students’ readiness for CT-infused instruction (Kite & Park, 2022). Previous research has shown promising results for CT-focused professional development for teachers, supporting decreased apprehension, increased confidence around their own CT understanding, and improved pedagogical skills (Adler & Kim, 2018; Bower et al., 2017; Jaipal-Jamani & Angeli, 2017). However, even with a better understanding of what CT is, teachers may still struggle to find a way to infuse it into their existing curriculum and instruction (Ketelhut et al., 2020). Existing research and professional development initiatives, however, have focused on CT. In contrast, CT-S is a construct that fuses both CT and science practices, potentially enabling a much easier process for integrating learning experiences into science classrooms. Future efforts should explore professional development initiatives to prepare teachers to support CT-S development in their classrooms.

4.2.3. Equity

Computer science and related disciplines have long struggled to diversify the number of historically underrepresented individuals, including women and people of color, that participate, making little progress since the gap widened in the 1980s (National Science Board (NSB), 2016). Although there has been recent strong growth in the number of K-12 students experiencing computer science in the US, only approximately half of K-12 schools in 2020 held computer science courses, and rates were lower for Black and Hispanic students (46%) than White students (52%; Google LLC & Gallup, Inc., 2020). The field also remains heavily gender-biased; enrollments in AP Computer Science are the most gender-biased AP subject (College Board, 2017), and computer science undergraduate enrollments overall remain highly gender-biased (NSB, 2016). Girls frequently find computer science less relevant and important than boys (Google LLC & Gallup, Inc., 2020).
These equity concerns in CS have motivated pushes for CT integration into other subject areas (e.g., Ketelhut et al., 2020), but without a clear understanding of how CT manifests in different subject areas. The inclusion of computational thinking in required subjects like science, rather than as an add-on or optional subject like computer science, presents an opportunity to broaden access to computational thinking. In this study, we have demonstrated the valuable role CT-S can play in science content learning, with no significant differences by gender, race/ethnicity, or home resources, even after controlling for prior experience and scientific sensemaking. Thus, having higher CT-S is universally helpful for learning science—but does everyone get the opportunity to participate in learning experiences to support their development of CT-S?
As a nascent construct, CT-S is unlikely to be the focus of many extant interventions or curricula, and the prevalence of such instruction is unknown. The neighboring field of computer science, however, presents numerous equity concerns. The present study provided evidence that CT-S, as articulated by Hurt et al. (2023), is indeed universally helpful for learning science, then efforts should be made to ensure that all youth have access to relevant learning experiences that support its development.

4.3. Utility of New CT-S Measure

Our approach to designing a new measure of CT-S resulted in a reliable and valid 20-item multiple-choice measure to engage students in computational thinking within common science contexts. As with previous measure development, in order to reduce the confounding influence of science content knowledge, we situated these items within common, rather than rare, scientific content knowledge and included all necessary content within the assessment itself. This new measure not only enabled us to investigate the questions articulated in this paper but will also be useful to others seeking to measure youth’s ability to engage in computational thinking for science. Educators in both school and non-school settings may find the instrument useful in both diagnostic and progress-measuring contexts. Program and learning design evaluators may use it to measure the effectiveness of technology-embedded scientific inquiry practices, learning experiences, and interventions. Researchers will find this CT-S assessment useful as they seek to advance knowledge related to many of the future research questions we posed throughout this paper. As with some of the other instruments developed by the Learning Activation Lab and utilized in this study, those interested in using the instrument may find more detailed information about the content and properties of this assessment in a technical report (Cannady et al., 2022).

5. Conclusions

In this study, we sought to determine if the ability to engage in computational thinking for science positions youth to be better learners of science content. In this paper, we provided evidence that indicates computational thinking for science is a consistent predictor of science content learning in middle school science classrooms. Analysis of these results demonstrated that the relationship between computational thinking for science and science content learning is consistent across variations in students and classrooms, above and beyond other demonstrated predictors—STEM fascination or scientific sensemaking. Further, the analysis also showed that experience with computer programming languages, especially block languages, is associated with higher levels of computational thinking. Discussion of these findings revealed some interesting implications for research, teaching, and learning, including some particular implications for advancing equitable opportunities for students to develop CT-S. It also pointed to the potential utility of the new CT-S instrument developed by this study team. In these ways, this paper advances knowledge about how to ensure that students have the dispositions, skills, and knowledge needed to use technology-enabled scientific inquiry practices and to position them for success in science learning.

Supplementary Materials

The following supporting information can be downloaded at: https://www.mdpi.com/article/10.3390/educsci15010105/s1. Full survey item set.

Author Contributions

Conceptualization, M.A.C. (Matthew A. Cannady), E.G. and R.D.; methodology, M.A.C. (Matthew A. Cannady) and M.A.C. (Melissa A. Collins); formal analysis, R.M. and T.H.; writing—original draft preparation, M.A.C. (Melissa A. Collins), M.A.C. (Matthew A. Cannady), T.H., R.M.; writing—review and editing, M.A.C. (Melissa A. Collins), M.A.C. (Matthew A. Cannady), T.H., R.D. and E.G.; project administration, M.A.C. (Matthew A. Cannady), R.D. and E.G.; funding acquisition, R.D., M.A.C. (Matthew A. Cannady) and E.G. All authors have read and agreed to the published version of the manuscript.

Funding

This research was funded by The National Science Foundation, grant number 1838992.

Institutional Review Board Statement

The study was conducted in accordance with the Declaration of Helsinki, and approved by the Institutional Review Board (or Ethics Committee) of The University of California, Berkeley (protocol code 2019-04-12146, approved 29 October 2019).

Informed Consent Statement

Informed assent was obtained from all subjects involved in the study.

Data Availability Statement

Anonymous data files are available for researcher use through contacting the corresponding author.

Acknowledgments

We would like to acknowledge the direct and indirect contributions of our colleagues on our project team Sara Allan, Lauren Brodsky, Ari Krakowski, Christina Morales, and Vasiliki Laina as well as our project advisors. This work is much better due to their contributions. Publication made possible in part by support from the Berkeley Research Impact Initiative (BRII) sponsored by the UC Berkeley Library.

Conflicts of Interest

The authors declare no conflicts of interest. The funders had no role in the design of the study; in the collection, analyses, or interpretation of data; in the writing of the manuscript; or in the decision to publish the results.

References

  1. Adler, R. F., & Kim, H. (2018). Enhancing future K-8 teachers’ computational thinking skills through modeling and simulations. Education and Information Technologies, 23(4), 1501–1514. [Google Scholar] [CrossRef]
  2. Allan, V., Barr, V., Brylow, D., & Hambrusch, S. (2010, March 10–13). Computational thinking in high school courses. 41st ACM Technical Symposium on Computer Science Education (pp. 390–391), Milwaukee, WI, USA. [Google Scholar]
  3. Bates, D., Mächler, M., Bolker, B., & Walker, S. (2015). Fitting linear mixed-effects models using lme4. Journal of Statistical Software, 67(1), 1–48. [Google Scholar] [CrossRef]
  4. Bathgate, M., Crowell, A., Schunn, C., Cannady, M., & Dorph, R. (2015). The learning benefits of being willing and able to engage in scientific argumentation. International Journal of Science Education, 37(10), 1590–1612. [Google Scholar] [CrossRef]
  5. Bathgate, M., & Schunn, C. (2017a). Factors that deepen or attenuate decline of science utility value during the middle school years. Contemporary Educational Psychology, 49, 215–225. [Google Scholar] [CrossRef]
  6. Bathgate, M., & Schunn, C. (2017b). The psychological characteristics of experiences that influence science motivation and content knowledge. International Journal of Science Education, 39(17), 2402–2432. [Google Scholar] [CrossRef]
  7. Bower, M., Wood, L. N., Lai, J. W. M., Howe, C., & Lister, R. (2017). Improving the computational thinking pedagogical capabilities of school teachers. Australian Journal of Teacher Education, 42(3), 53–72. [Google Scholar] [CrossRef]
  8. Cannady, M. A., Montgomery, R., Hurt, T., Collins, M., Allan, S., Brodsky, L., Greenwald, E., Krakowski, A., & Dorph, R. (2022). Technical report: Measuring computational thinking for science (CT-S). Lawrence Hall of Science at University of California, Berkeley. Available online: https://lawrencehallofscience.org/wp-content/uploads/2022/05/CT-S_Tech_Report_v1_0.pdf (accessed on 12 January 2025).
  9. Cannady, M. A., Vincent-Ruz, P., Chung, J., & Schunn, C. (2019). Scientific sensemaking supports science content learning across disciplines and instructional contexts. Contemporary Educational Psychology, 59, 101802. [Google Scholar] [CrossRef]
  10. Chen, Y.-F., Cannady, M. A., Schunn, C., & Dorph, R. (2017). Measures technical brief: Fascination in STEM. Available online: http://activationlab.org/wp-content/uploads/2018/03/Fascination_STEM-Report_20170403.pdf (accessed on 12 January 2025).
  11. Chung, J., Cannady, M. A., Schunn, C., Dorph, R., & Vincent-Ruz, P. (2016). Measures technical brief: Scientific sensemaking. Available online: http://activationlab.org/wp-content/uploads/2018/03/Sensemaking-Report-3.2-20160331.pdf (accessed on 12 January 2025).
  12. Christensen, R. H. B. (2019). Regression models for original data, R package version 2019.12-10; Available online: https://cran.r-project.org/web/packages/ordinal/ordinal.pdf (accessed on 12 January 2025).
  13. College Board. (2017). Program summary report. Available online: https://secure-media.collegeboard.org/digitalServices/pdf/research/2016/Program-Summary-Report-2016.pdf (accessed on 12 January 2025).
  14. Cuny, J., Snyder, L., & Wing, J. M. (2010). Demystifying computational thinking for non-computer scientists. [Unpublished manuscript]. Available online: https://www.cs.cmu.edu/~CompThink/resources/TheLinkWing.pdf (accessed on 12 January 2025).
  15. Denning, P. J. (2017). Computational thinking in science. American Scientist, 105(1), 13–17. [Google Scholar] [CrossRef]
  16. Dorph, R., Cannady, M. A., & Schunn, C. D. (2016). Science learning activation: Positioning youth for success. Electronic Journal of Science Education, 20(8). Available online: http://files.eric.ed.gov/fulltext/EJ1188039.pdf (accessed on 12 January 2025).
  17. Dorph, R., Schunn, C. D., & Crowley, K. (2017). Crumpled molecules and edible plastic: Science learning activation in out-of-school time. Afterschool Matters, 25, 18–28. [Google Scholar]
  18. Google LLC & Gallup, Inc. (2020). Current perspectives and continuing challenges in computer science education in U.S. K-12 schools. Available online: https://services.google.com/fh/files/misc/computer-science-education-in-us-k12schools-2020-report.pdf (accessed on 12 January 2025).
  19. Grover, S., & Pea, R. (2013). Computational thinking in K–12: A review of the state of the field. Educational Researcher, 42(1), 38–43. [Google Scholar] [CrossRef]
  20. Guzdial, M. (2015). Learner-centered design of computing education: Research on computing for everyone. Synthesis Lectures on Human-Centered Informatics, 8(6), 1–165. [Google Scholar] [CrossRef]
  21. Haddad, R. J., & Kalaani, Y. (2015, March 7). Can computational thinking predict academic performance? IEEE Integrated STEM Education Conference (ISEC), Princeton, NJ, USA. [Google Scholar] [CrossRef]
  22. Hava, K., & Ünlü, Z. K. (2021). Investigation of the relationship between middle school students’ computational thinking skills and their STEM career interest and attitudes toward inquiry. Journal of Science Education and Technology, 30, 484–495. [Google Scholar] [CrossRef]
  23. Hurt, T., Greenwald, E., Allan, S., Cannady, M. A., Krakowski, A., Brodsky, L., Collins, M. A., Montgomery, R., & Dorph, R. (2023). The computational thinking for science framework: Operationalizing CT-S for K-12 science education researchers and educators. International Journal of STEM Education, 10(1). [Google Scholar] [CrossRef]
  24. Jaipal-Jamani, K., & Angeli, C. (2017). Effect of robotics on elementary preservice teachers’ self-efficacy, science learning, and computational thinking. Journal of Science Education and Technology, 26(2), 175–192. [Google Scholar] [CrossRef]
  25. K–12 Computer Science Framework. (2016). Available online: http://www.k12cs.org (accessed on 12 January 2025).
  26. Ketelhut, D. J., Mills, K., Hestness, E., Cabrera, L., Plane, J., & McGinnins, J. R. (2020). Teacher change following a professional development experience in integrating computational thinking into elementary science. Journal of Science Education and Technology, 29, 174–188. [Google Scholar] [CrossRef]
  27. Kite, V., & Park, S. (2022). What’s computational thinking?: Secondary science teachers’ conceptualizations of computational thinking (CT) and perceived barriers to CT integration. Journal of Science Teacher Education, 34, 391–414. [Google Scholar] [CrossRef]
  28. Lin, P. Y., & Schunn, C. D. (2016). The dimensions and impact of informal science learning experiences on middle schoolers’ attitudes and abilities in science. International Journal of Science Education, 2551–2572. [Google Scholar] [CrossRef]
  29. Malone, K. L., Schunn, C. D., & Schuchardt, A. M. (2018). Improving conceptual understanding and representation skills through Excel-based modeling. Journal of Science Education and Technology, 27(1), 30–44. [Google Scholar] [CrossRef]
  30. Nakagawa, S., & Schielzeth, H. (2013). A general and simple method for obtaining R2 from generalized linear mixed-effects models. Methods in Ecology and Evolution, 4(2), 133–142. [Google Scholar] [CrossRef]
  31. National Research Council. (2011). Learning science through computer games and simulations. National Academies Press. [Google Scholar]
  32. National Research Council. (2012). A framework for K-12 science education: Practices, crosscutting concepts, and core ideas (pp. 65–66). National Academies Press. Available online: https://www.nap.edu/catalog/13165/a-framework-for-k-12-science-education-practices-crosscutting-concepts (accessed on 12 January 2025).
  33. National Science Board. (2016). Science & engineering indicators 2016; National Science Foundation (NSB-2016-1). Available online: https://www.nsf.gov/nsb/publications/2016/nsb20161.pdf (accessed on 12 January 2025).
  34. NGSS Lead States. (2013). Next generation science standards: For states, by states. The National Academies Press. [Google Scholar]
  35. OECD. (2019). PISA 2018 assessment and analytical framework. PISA, OECD Publishing. [Google Scholar] [CrossRef]
  36. Pollock, L., Mouza, C., Guidry, K. R., & Pusecker, K. (2019, February 27–March 2). Infusing computational thinking across disciplines: Reflections & lessons learned. SIGCSE ’19, Minneapolis, MN, USA. [Google Scholar]
  37. Potvin, P., & Hasni, A. (2014). Analysis of the decline in interest towards school science and technology from grades 5 through 11. Journal of Science Education and Technology, 23, 784–802. [Google Scholar] [CrossRef]
  38. R Core Team. (2021). R: A language and environment for statistical computing. R Foundation for Statistical Computing. Available online: https://www.R-project.org/ (accessed on 12 January 2025).
  39. Román-González, M., Pérez-González, J., & Jiménez-Fernández, C. (2017). Which cognitive abilities underlie computational thinking? Criterion validity of the computational thinking test. Computers in Human Behavior, 72, 678–691. [Google Scholar] [CrossRef]
  40. Settle, A., Franke, B., Hansen, R., Spaltro, F., Jurisson, C., Rennert-May, C., & Wildeman, B. (2012, July 3–5). Infusing computational thinking into the middle-and high-school curriculum. 17th ACM annual Conference on INNOVATION and Technology in Computer Science Education, Haifa, Israel. [Google Scholar]
  41. Sneider, C., Stephenson, C., Schafer, B., & Flick, L. (2014). Computational thinking in high school science classrooms. The Science Teacher, 81(5), 53–59. [Google Scholar] [CrossRef]
  42. Sun, L., Hu, L., Yang, W., Zhou, D., & Wang, X. (2021). STEM learning attitude predicts computational thinking skills among primary school students. Journal of Computer Assisted Learning, 37(2), 346–358. [Google Scholar] [CrossRef]
  43. Sun, L., Hu, L., & Zhou, D. (2022). Programming attitudes predict computational thinking: Analysis of difference in gender and programming experience. Computers & Education, 181, 104457. [Google Scholar] [CrossRef]
  44. Vincent-Ruz, P., & Schunn, C. D. (2017). The increasingly important role of science competency beliefs for science learning in girls. Journal of Research in Science Teaching, 54(6), 790–822. [Google Scholar] [CrossRef]
  45. Weintrop, D., Beheshti, E., Horn, M., Orton, K., Jona, K., Trouille, L., & Wilensky, U. (2016). Defining computational thinking for mathematics and science classrooms. Journal of Science Education and Technology, 25(1), 127–147. [Google Scholar] [CrossRef]
  46. Wilensky, U., & Reisman, K. (2006). Thinking like a wolf, a sheep, or a firefly: Learning biology through constructing and testing computational theories—an embodied modeling approach. Cognition and instruction, 24(2), 171–209. [Google Scholar] [CrossRef]
  47. Wing, J. (2011). Research notebook: Computational thinking—What and why? The Link Magazine, Spring. Carnegie Mellon University, Pittsburgh. Available online: https://www.cs.cmu.edu/link/research-notebook-computational-thinking-what-and-why (accessed on 12 January 2025).
  48. Wing, J. M. (2006). Computational thinking. Communications of the ACM, 49(3), 33–35. [Google Scholar] [CrossRef]
  49. Witherspoon, E. B., Schunn, C. D., Higashi, R. M., & Baehr, E. C. (2016). Gender, interest and prior experience shape opportunities to learn programming in robotics competitions. International Journal of STEM Education, 3(18). [Google Scholar] [CrossRef]
  50. Yeni, S., Grgurina, N., Saeli, M., Hermans, F., Tolboom, J., & Barendsen, E. (2024). Interdisciplinary integration of computational thinking in K-12 education: A systematic review. Informatics in Education, 23(1), 223–278. [Google Scholar] [CrossRef]
Figure 1. The CT-S Framework (Hurt et al., 2023).
Education 15 00105 g001
Figure 2. Example item from the computational thinking for science scale.
Education 15 00105 g002
Figure 3. Example item from the scientific sensemaking scale.
Education 15 00105 g003
Table 1. Demographic characteristics of study sample.
Sample Characteristicn%
Gender
Male26349%
Female23444%
Prefer not to say275%
Non-binary/Third Gender143%
Blank62
Race
White/Caucasian405
Hispanic/Latinx58
South Asian/Indian21
Asian/East Asian/Asian American26
Black/African American34
Middle Eastern/North African10
Native American/Alaska Native17
Native Hawaiian/Pacific Islander6
Blank or Uncategorizable89
Grade
6th17432%
7th6512%
8th30156%
Blank60
English
Always48490%
Sometimes499%
Rarely51%
Never1<1%
Blank61
Total600
Table 2. Descriptive statistics of all model variables.
nMeanStd
Amplify Post-Content Score6002.101.19
Amplify Pre-Flag6000.490.50
Amplify Pre-Content Score6000.630.97
CT-S Pre-z-score6000.061.01
Remote Learning6000.190.39
NonMale5110.490.50
Underrepresented Race/Ethnicity5120.220.41
Home Resources5330.060.98
English Spoken at Home5390.900.30
Grade 86000.580.49
Programming Experience5380.160.37
SSM Pre-z-score5640.101.00
CT Pre-z-score5390.041.00
STEM Experiences Pre-z-score5370.060.99
STEM Fascination Pre-z-score554−0.020.98
Course Content: Life Sciences6000.270.44
Course Content: Earth Sciences6000.360.48
Table 3. Mean CT-S Pre-Z scores by prior programming experience (number of programming languages.
Programming
Languages
Mean CT-S
Pre-Z Score
Nt(df)p
0−0.21128--
1−0.04336257.30.08
20.125172354.40.09
3+0.073150312.10.65
No Block−0.323154--
Yes Block0.139504273.2<0.001
Table 4. Spearman’s rank intercorrelation of pre- and post-embedded content assessments with pre-test CT-S scale scores. All correlations were significant at the p < 0.01 level.
Content PostCT-S
Content Pre0.250.31
Content Post10.35
Table 5. All L1: Series of multiple HLM regressions, beginning with the null model; then adding in pre-scores; then pre-scores and CT-S Score.
Null ModelPre-Amplify ScoresPre-Amplify Scores and CT-S Scores
Threshold from 0 to 1−1.73 ***−2.36 ***−2.35 ***
Threshold from 1 to 2−1.19 ***−1.79 ***−1.74 ***
Threshold from 2 to 3−0.46−1.01 **−0.90 **
Amplify Post-Flag 0.250.11
Amplify Pre-Content Score 2.02 ***1.62 ***
Amplify Pre-Content Score2 0.76 **0.72 **
CT-S Pre-z-score 0.64 ***
ICC0.160.180.17
R_Squared0.160.290.35
Log Likelihood−653.96−627.76−604.23
AIC1315.921269.521224.46
BIC1333.51300.31259.63
Num. obs.600600600
Groups131313
Variance: Groups: (Intercept)0.630.70.7
*** p < 0.001; ** p < 0.01.
Table 6. All L1: Series of multiple HLM regressions including Pre-Scores and CT-S scores: first adding in Non-Male status; then the non-Male status and interaction with CT-S; URM status; then URM interaction with CT-S.
Non-MaleNon-Male
Interaction
URMURM
Interaction
ResourcesResources
Interactions
English at HomeEnglish at Home
Interaction
GradeGrade
Interaction
Threshold from 0 to 1−2.27 ***−2.25 ***−2.49 ***−2.49 ***−2.49 ***−2.49 ***−2.99 ***−3.23 ***−2.24 ***−2.21 ***
Threshold from 1 to 2−1.65 ***−1.63 ***−1.86 ***−1.86 ***−1.83 ***−1.83 ***−2.32 ***−2.55 ***−1.63 ***−1.60 ***
Threshold from 2 to 3−0.74−0.72−1.00 *−1.00 *−0.93 *−0.93 *−1.42 **−1.65 **−0.79−0.75
Amplify Pre-Flag0.220.240.170.180.110.110.120.140.120.14
Amplify Pre-Content Score1.64 ***1.61 ***1.58 ***1.57 ***1.61 ***1.61 ***1.66 ***1.68 ***1.62 ***1.59 ***
Amplify Pre-Content Score2 0.71 *0.70 *0.82 **0.82 **0.78 **0.78 **0.77 *0.78 *0.72 **0.72 *
CT-S Pre-z-score0.75 ***0.57 ***0.64 ***0.72 ***0.65 ***0.65 ***0.68 ***1.26 ***0.64 ***0.47 **
Non-Male0.370.44 *
CT-S Pre-z-score x Non-Male 0.41
Underrepresented in STEM −0.38−0.44
CT-S Pre-z-score x
Underrepresented in STEM
−0.31
Home Resources 0.29 **0.29 **
CT-S Pre-z-score x Home Resources 0.02
English Spoken at Home −0.51−0.75 *
CT-S Pre-z-score x
English Spoken at Home
−0.64
Grade 8 0.160.19
CT-S Pre-z-score x Grade 8 0.3
ICC0.210.210.220.230.210.210.230.220.170.18
R_Squared0.40.40.390.390.390.390.390.40.350.36
Log Likelihood−490.86−488.96−495.03−494.2−517.56−517.54−528.41−526.83−604.18−602.96
AIC999.72997.911008.061008.41053.121055.081074.821073.671226.361225.93
BIC1037.851040.281046.211050.791091.621097.861113.431116.561265.931269.89
Num. obs.511511512512533533539539600600
Groups (TeacherG)13131313131313131313
Variance: TeacherG: (Intercept)0.860.860.940.960.850.850.960.950.70.7
*** p < 0.001; ** p < 0.01; * p < 0.05.
Table 7. All L1: Series of multiple HLM regressions all including Pre-Scores and CT-S scores: remote learning status, remote learning status interaction, dummy codes of life and earth sciences compared to physical sciences.
Remote StatusRemote InteractionLife and Earth
Threshold from 0 to 1−2.72 ***−2.71 ***−2.97 ***
Threshold from 1 to 2−2.07 ***−2.07 ***−2.33 ***
Threshold from 2 to 3−1.16 *−1.15 *−1.41 *
Amplify Post Flag0.330.320.67
Amplify Pre-Content Score1.60 ***1.60 ***1.61 ***
Amplify Pre-Content Score2 0.68 *0.68 *0.65 *
CT-S Pre-z-score0.75 ***0.77 ***0.74 ***
Home Resources0.30 **0.30 **0.29 **
Non-Male0.290.290.3
English Spoken at Home−0.53−0.52−0.5
Remote Instruction0.110.08
CT-S Pre-z-score x
Remote Instruction
−0.11
Course Content: Life Science −1.11
Course Content: Earth Science −0.23
ICC0.190.20.16
R_Squared0.40.40.39
Log Likelihood−476.55−476.48−475.38
AIC977.11978.96976.75
BIC1027.731033.81031.6
Num. obs.502502502
Groups (TeacherG)131313
Variance: TeacherG: (Intercept)0.790.80.64
*** p < 0.001; ** p < 0.01; * p < 0.05.
Table 8. All L1: Series of multiple HLM regressions including Pre-Scores and CT-S scores: first with Program experience; Program Interaction; Computational Experience; STEM Experiences; and Career Interest.
Programming ExperienceProgramming InteractionCT ExperienceSTEM ExperienceCareer Interest
Threshold from 0 to 1−2.50 ***−2.49 ***−2.74 ***−2.74 ***−2.64 ***
Threshold from 1 to 2−1.86 ***−1.85 ***−2.09 ***−2.09 ***−2.04 ***
Threshold from 2 to 3−0.97 *−0.95 *−1.18 *−1.17 *−1.11 *
Amplify Pre-Flag0.060.110.320.340.39
Amplify Pre-Content Score1.66 ***1.68 ***1.60 ***1.56 ***1.60 ***
Amplify Pre-Content Score2 0.84 **0.82 **0.68 *0.68 *0.64
CT-S Pre-z-score0.66 ***0.58 ***0.74 ***0.73 ***0.71 ***
Programming Experience0.050.16
CT-S Pre-z-score x
Programming Experience
0.056
Home Resources 0.30 **0.29 **0.28 **
Non-Male 0.310.280.42 *
English Spoken at Home −0.53−0.54−0.56
CT Experience 0.03
STEM Experience 0.12
Career Interest Pre 0.19
ICC0.210.210.220.230.21
R_Squared0.40.40.390.390.39
Log Likelihood−490.86−488.96−495.03−494.2−517.56
AIC999.72997.911008.061008.41053.12
BIC1037.851040.281046.211050.791091.62
Num. obs.511511512512533
Groups (TeacherG)1313131313
Variance: TeacherG: (Intercept)0.860.860.940.960.85
*** p < 0.001; ** p < 0.01; * p < 0.05.
Table 9. L1: Multiple HLM regression including Pre-Scores and CT-S scores and including measures of fascination and scientific sensemaking.
Fascination and Scientific Sensmaking
Threshold from 0 to 1−2.64 ***
Threshold from 1 to 2−1.96 ***
Threshold from 2 to 3−0.99
Amplify Post Flag0.37
Amplify Pre-Content Score1.37 **
Amplify Pre-Content Score2 0.6
Home Resources0.29 **
Non-Male0.21
English Spoken at Home−0.45
CT-S Pre-z-score0.49 ***
SSM Pre-z-score0.52 ***
Fascination Pre-z-score0.19
ICC0.23
R_Squared0.45
Log Likelihood−462.47
AIC950.93
BIC1005.65
Num. obs.497
Groups (TeacherG)13
Variance: TeacherG: (Intercept)0.96
*** p < 0.001; ** p < 0.01.
Disclaimer/Publisher’s Note: The statements, opinions and data contained in all publications are solely those of the individual author(s) and contributor(s) and not of MDPI and/or the editor(s). MDPI and/or the editor(s) disclaim responsibility for any injury to people or property resulting from any ideas, methods, instructions or products referred to in the content.

