Article

A Study on the Influence of the Affective Domain on the Attitudes of Middle School Students toward Mathematics from a Gender Perspective

by
Mariana Gutierrez-Aguilar
1 and
Santa Tejeda
2,*
1
School of Humanities and Education, Tecnologico de Monterrey, Monterrey 64849, Mexico
2
School of Engineering and Sciences, Institute for the Future of Education, Tecnologico de Monterrey, Monterrey 64849, Mexico
*
Author to whom correspondence should be addressed.
Educ. Sci. 2024, 14(6), 594; https://doi.org/10.3390/educsci14060594
Submission received: 21 February 2024 / Revised: 17 March 2024 / Accepted: 14 May 2024 / Published: 30 May 2024
(This article belongs to the Special Issue Gender and STEM Education)

Abstract

:
Women’s representation in Science, Technology, Engineering and Mathematics (STEM) is a powerful resource to motivate girls to study STEM degrees and fulfill the growing demands for professionals in these fields. From their youth, positive attitudes toward mathematics are characteristic of girls and boys who study STEM degrees. This research aims to identify the association between gender stereotypes and attitudes toward mathematics. The 6° grade generation from a middle school in Monterrey, Mexico, first answered tests on attitudes toward mathematics and gender stereotypes in mathematics. Afterwards, a sample group underwent a 4-week intervention during which students saw videos of STEM professionals and answered a questionnaire on student’s self-perception in STEM careers. Finally, the tests were reapplied with a questionnaire on the use and ease of mathematics. Quasi-statistical and discourse analysis were used to obtain the results. These are presented through a model that highlights the mediating role that the mathematical self-concept and the interest/enjoyment for mathematics have in the association between gender stereotypes and attitudes toward mathematics. The role of gender on female’s lower mathematical self-concept is also exposed, suggesting subsequent lines of research on improving self-concept as an approach to equitably increase students’ interests in STEM degrees from their youth.

1. Introduction

The academic, affective, and social dimensions are key when learning mathematics [1]. Out of these dimensions, the affective dimension is highlighted due to its influence on the development of attitudes toward mathematics, which mainly comprises the interplay of its elements, such as the interest/enjoyment for mathematics, the mathematical self-concept, and the perceived value/utility of mathematics, which have been reportedly associated with gender, as follows. The interest/enjoyment for mathematics has been identified as unaffected by gender but it has also been indicated to play a greater role in men’s attitudes toward mathematics than women’s [2]. Meanwhile, the mathematical self-concept has been the subject of contradicting reports, as it was both unrelated to gender [3] and lower in female students [1]. The perceived value/utility of mathematics is stated as related to gender, since men tend to value STEM for its personal utility while women value it for its social utility [4].
Amongst the literature, special emphasis is made on the effects of STEM role models. Since most of them are stereotypically male, they tend to replicate the idea of men as those who work in STEM, and it has been debated whether sharing non-stereotypical STEM role models might increase interest for STEM areas [5,6]. The lack of consistency found in the literature regarding the role of gender in the decision to study STEM stresses the need to delve into the influence of gender on the elements of the affective domain that are the most relevant for the development of attitudes toward mathematics [7].
Some work has been performed on analyzing the attitudes toward mathematics through a gender perspective in the Mexican context. González-Jiménez focused on the affective domain by examining students’ persuasion, cognitive conflict, metacognition, and their impact on attitudes toward mathematics. They reported a positive change in students’ attitudes after viewing videos of female role models in mathematics [8]. On the other hand, Ursini and Ramírez-Mercado interviewed middle school mathematics teachers who commented that, in Mexico, (1) women still hold the main role of being responsible for reproduction and caregiving, and (2) in the classroom, strategies have been utilized to incentivize female students to participate under the belief that complicated questions should be addressed to male students rather than female students. A strategy implemented by these teachers comprises handing out extra problems and study guides to female students under the belief that these will most likely be solved by them rather than the male students. These researchers report that the participants consider female middle school students to be more hard-working, more consistent in their attendance, and orderly, as well as more nervous but creative. Meanwhile, male students are perceived as more intelligent, less clean, and less orderly when solving mathematical problems [9].
Due to the current need for STEM professionals and the lack of women in STEM fields [3,10], researchers have turned to middle schools as a critical stage for the development of attitudes toward STEM, interests, and gender disparities [2,11,12,13]. Thus, this study takes a gender perspective to better understand the implications that lie behind the development of attitudes toward mathematics for middle school students. The main research question was as follows: How are gender stereotypes associated with attitudes toward mathematics? Moreover, the secondary question asked was as follows: How is the affective domain linked to middle schoolers’ attitudes toward mathematics and their gender stereotypes? Both questions were addressed through the following objectives:
  • Comprehend the association between gender stereotypes and attitudes toward mathematics.
  • Understand how the affective domain impacts attitudes toward mathematics.
  • Analyze the effect on middle school students to being exposed to content from videos of STEM professionals regarding their perspectives on gender equity and attitudes toward mathematics.
In the following three sections, this research’s methodology will be detailed. Afterwards, the results and discussion will be presented. The final part will contain the main conclusions and lessons learned.

2. Methods

The present study corresponds to a mixed methodology mainly grounded on its qualitative approach through data analysis. The following sections will describe this study’s participants, the instruments used, and will provide a brief depiction of the analysis strategy implemented.

2.1. Participants

Research was carried out at a private school in Monterrey, Nuevo Leon, Mexico, with a specific focus on its sixth-grade students. This school follows the International Baccalaureate model, which implies a constructivist, bilingual education and a four-year-long middle school starting at sixth grade. The generation was made up by four groups from which 71 students (37 females and 24 males) participated in the pretest and 70 students (35 females and 35 males) participated in the post-test. Their ages ranged from 11 to 12 years old, corresponding with a critical stage in the development of attitudes, gender stereotypes, academic identity, and vocational interests [10,14,15].
Out of the four groups, one was selected to participate in the intervention since their homeroom teacher was this study’s main researcher. The group consisted of 19 students (12 females and 7 males) who participated in the intervention by watching videos of STEM professionals and answering an extra questionnaire after each video. All participants were requested to present a consent form signed by their parents or tutors, which was previously approved by the school.

2.2. Instruments

The research followed three stages: a pretest, an intervention, and a post-test. Since it corresponds to a mixed methodology, the results were analyzed after they were obtained and were used to refine the instruments applied in later stages.
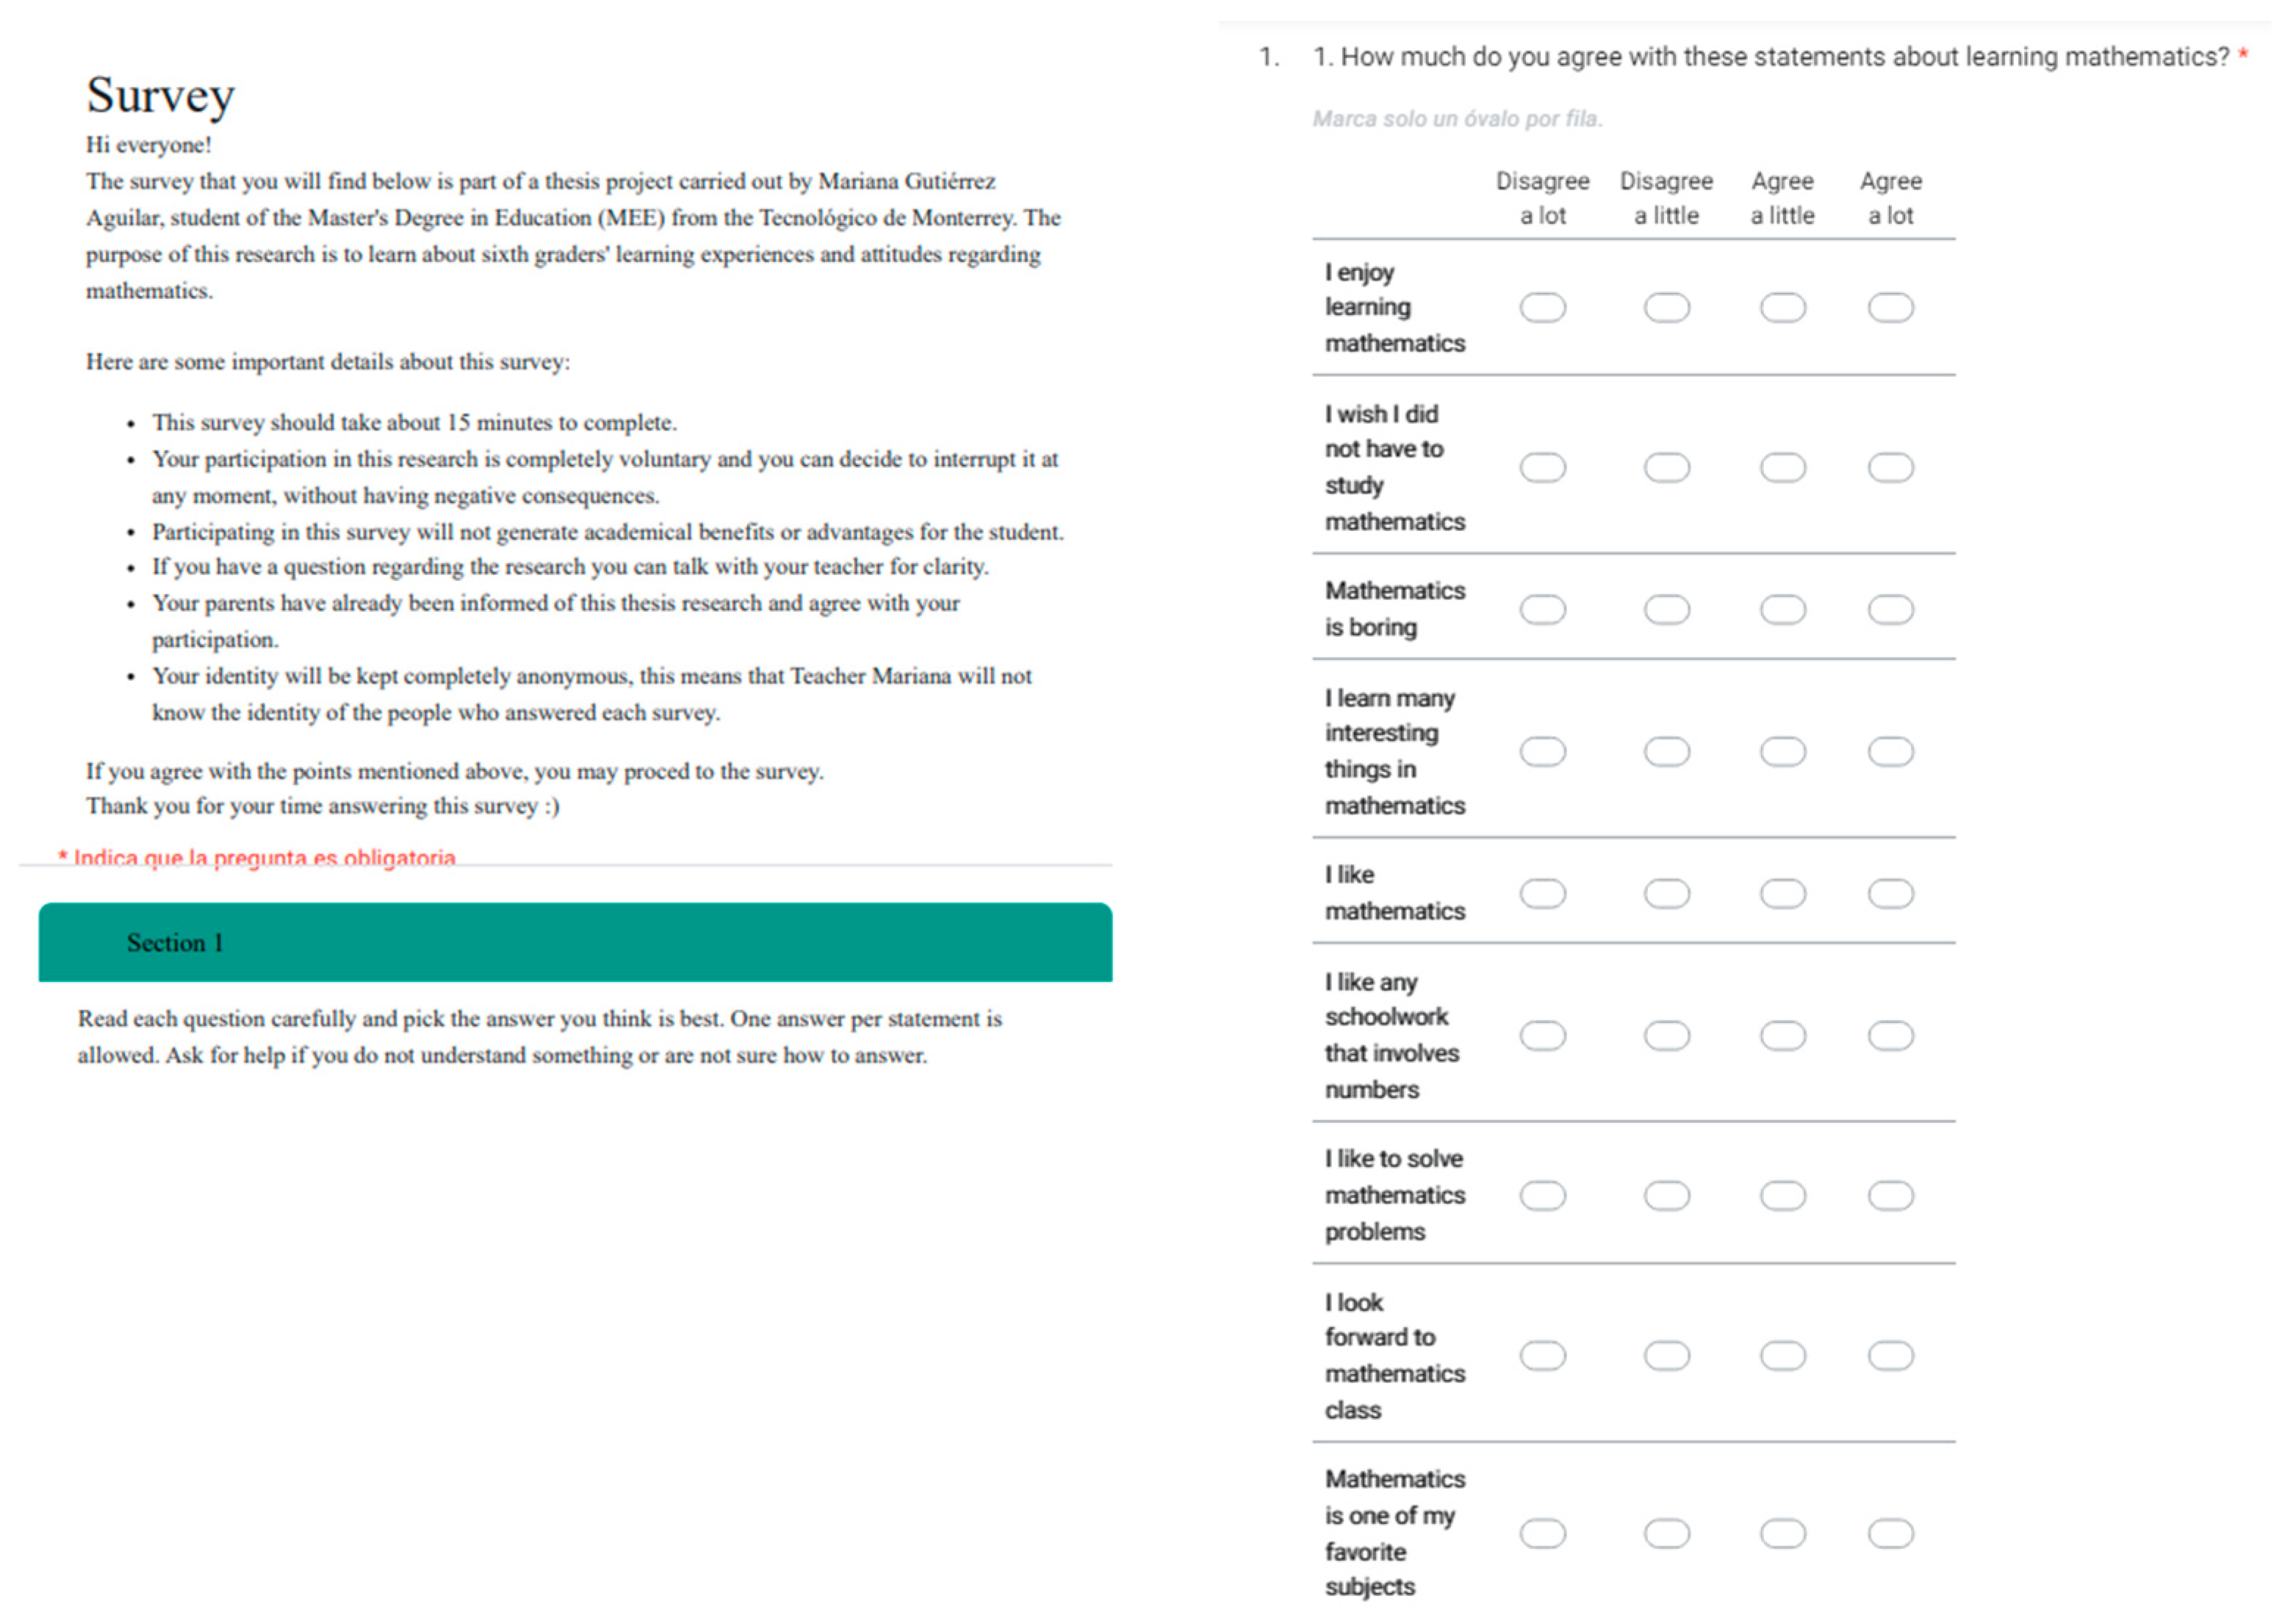
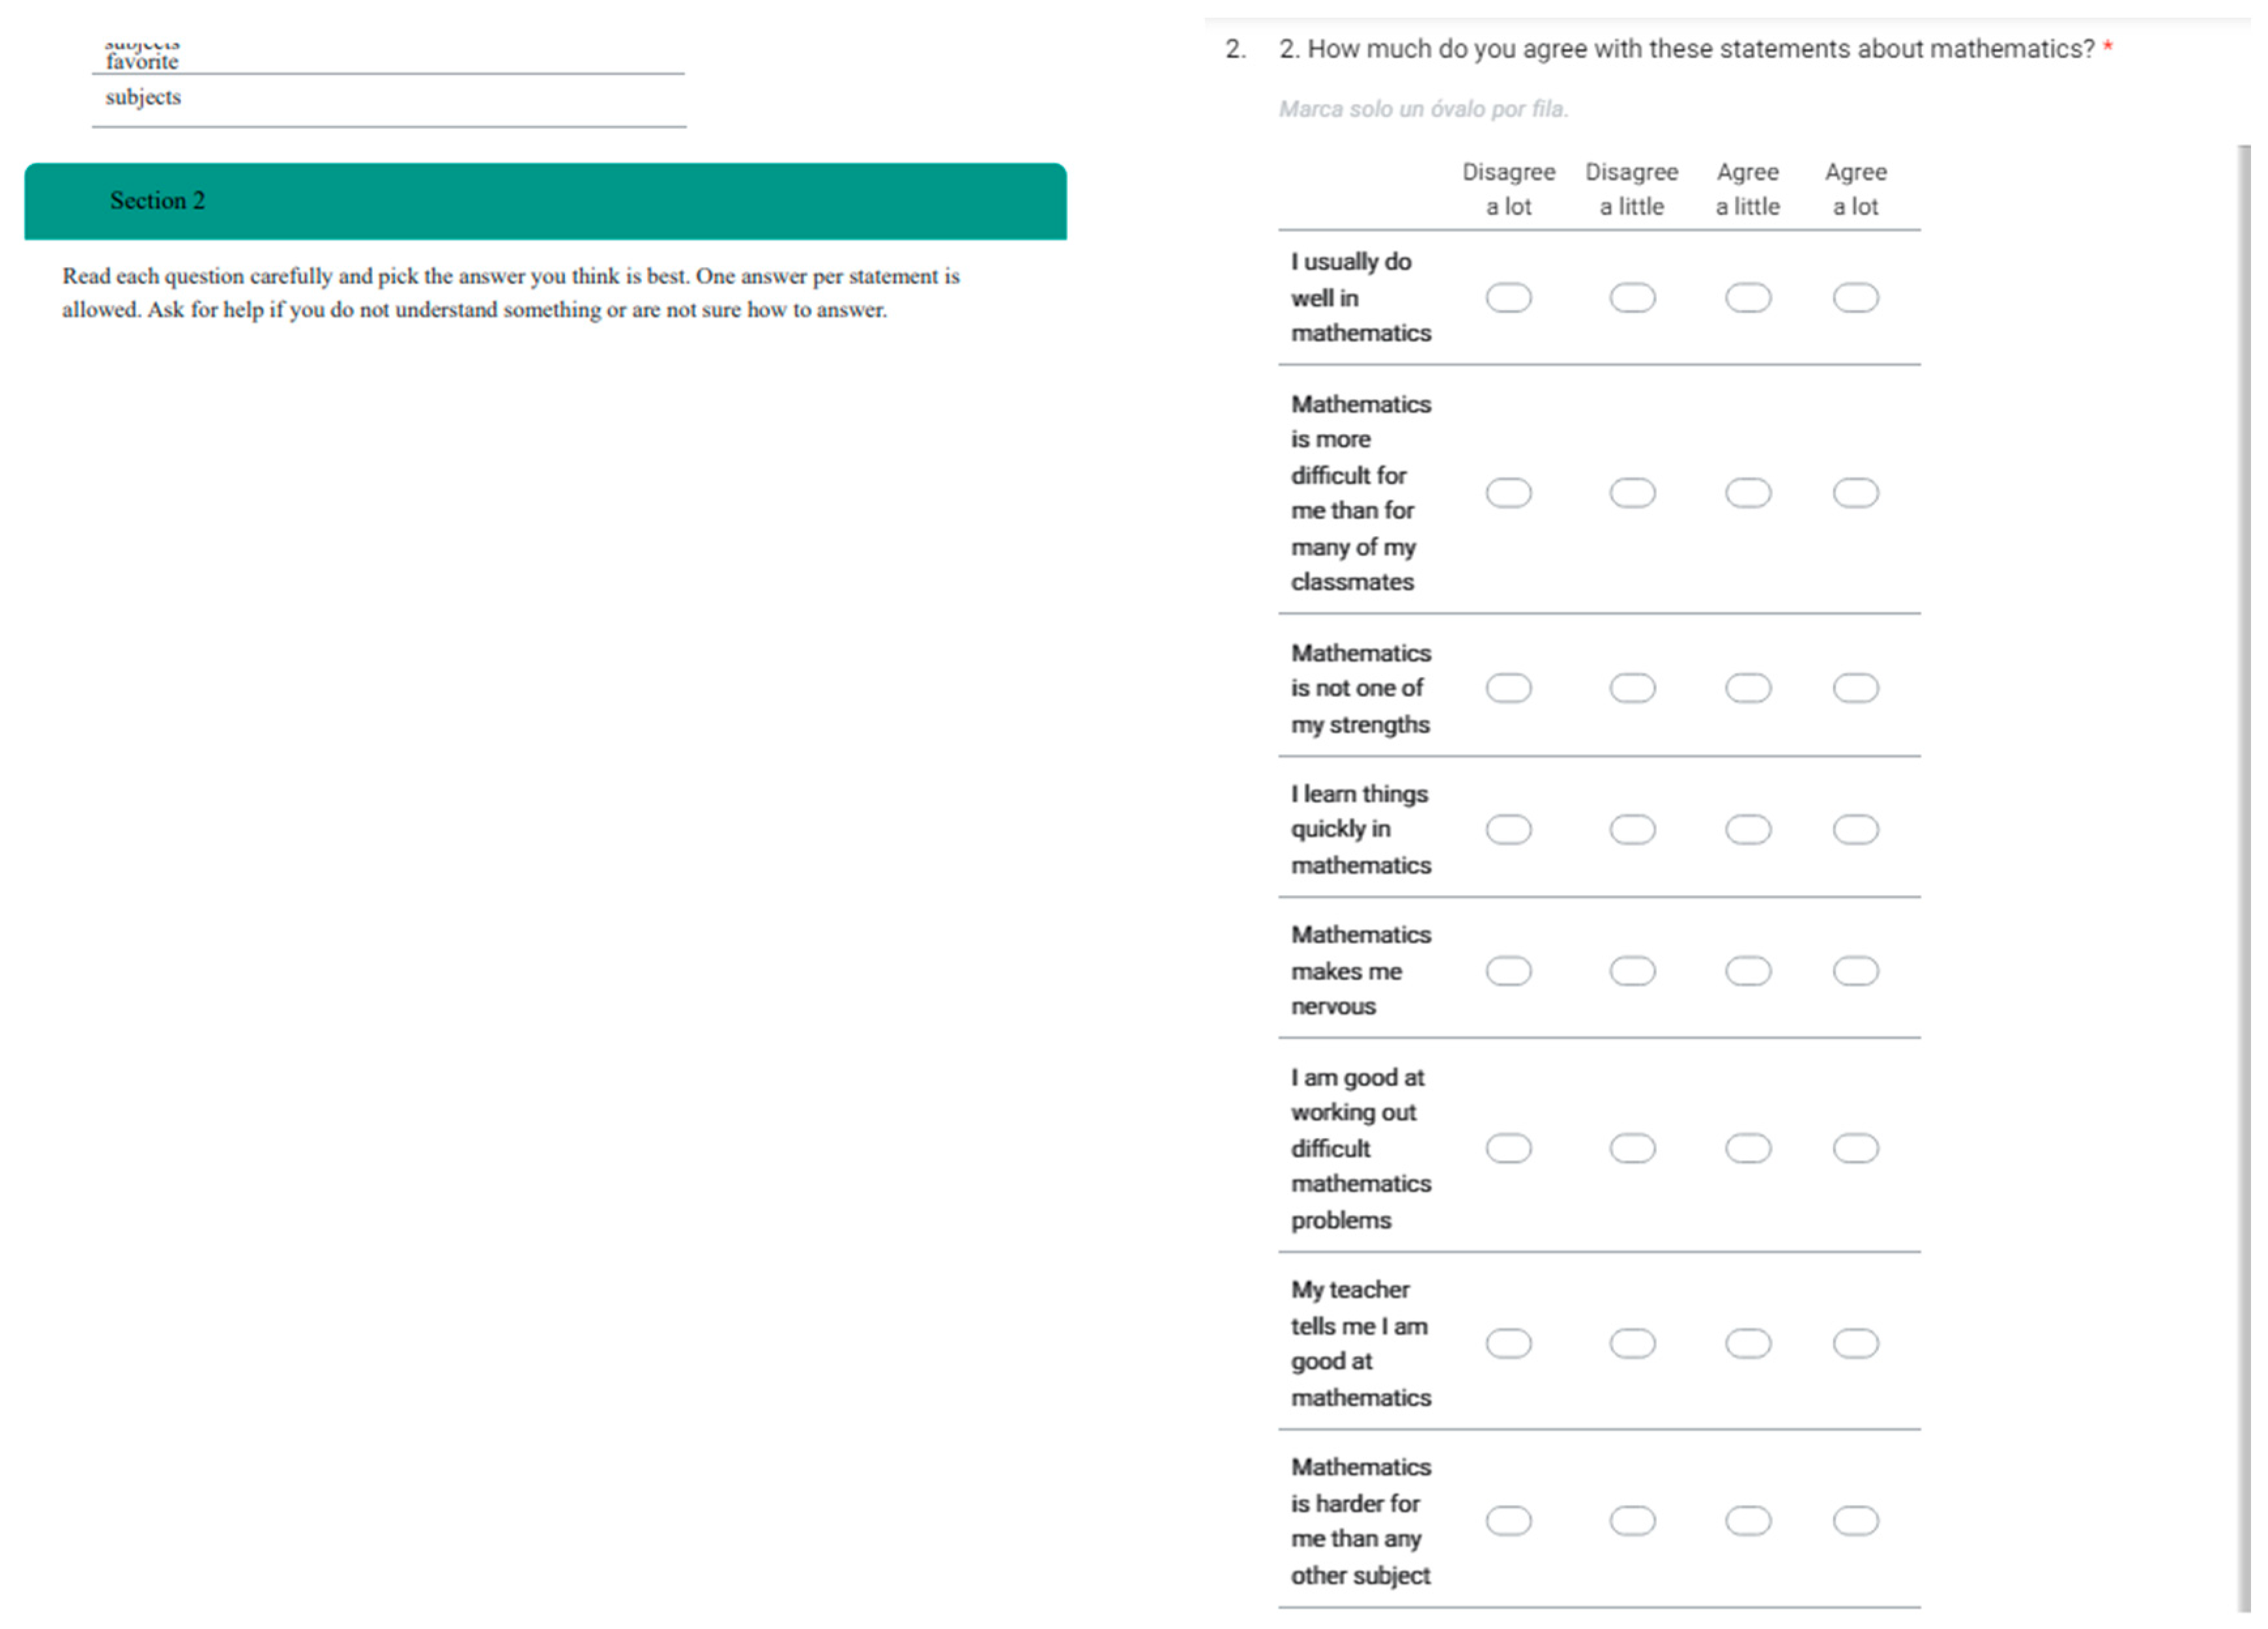
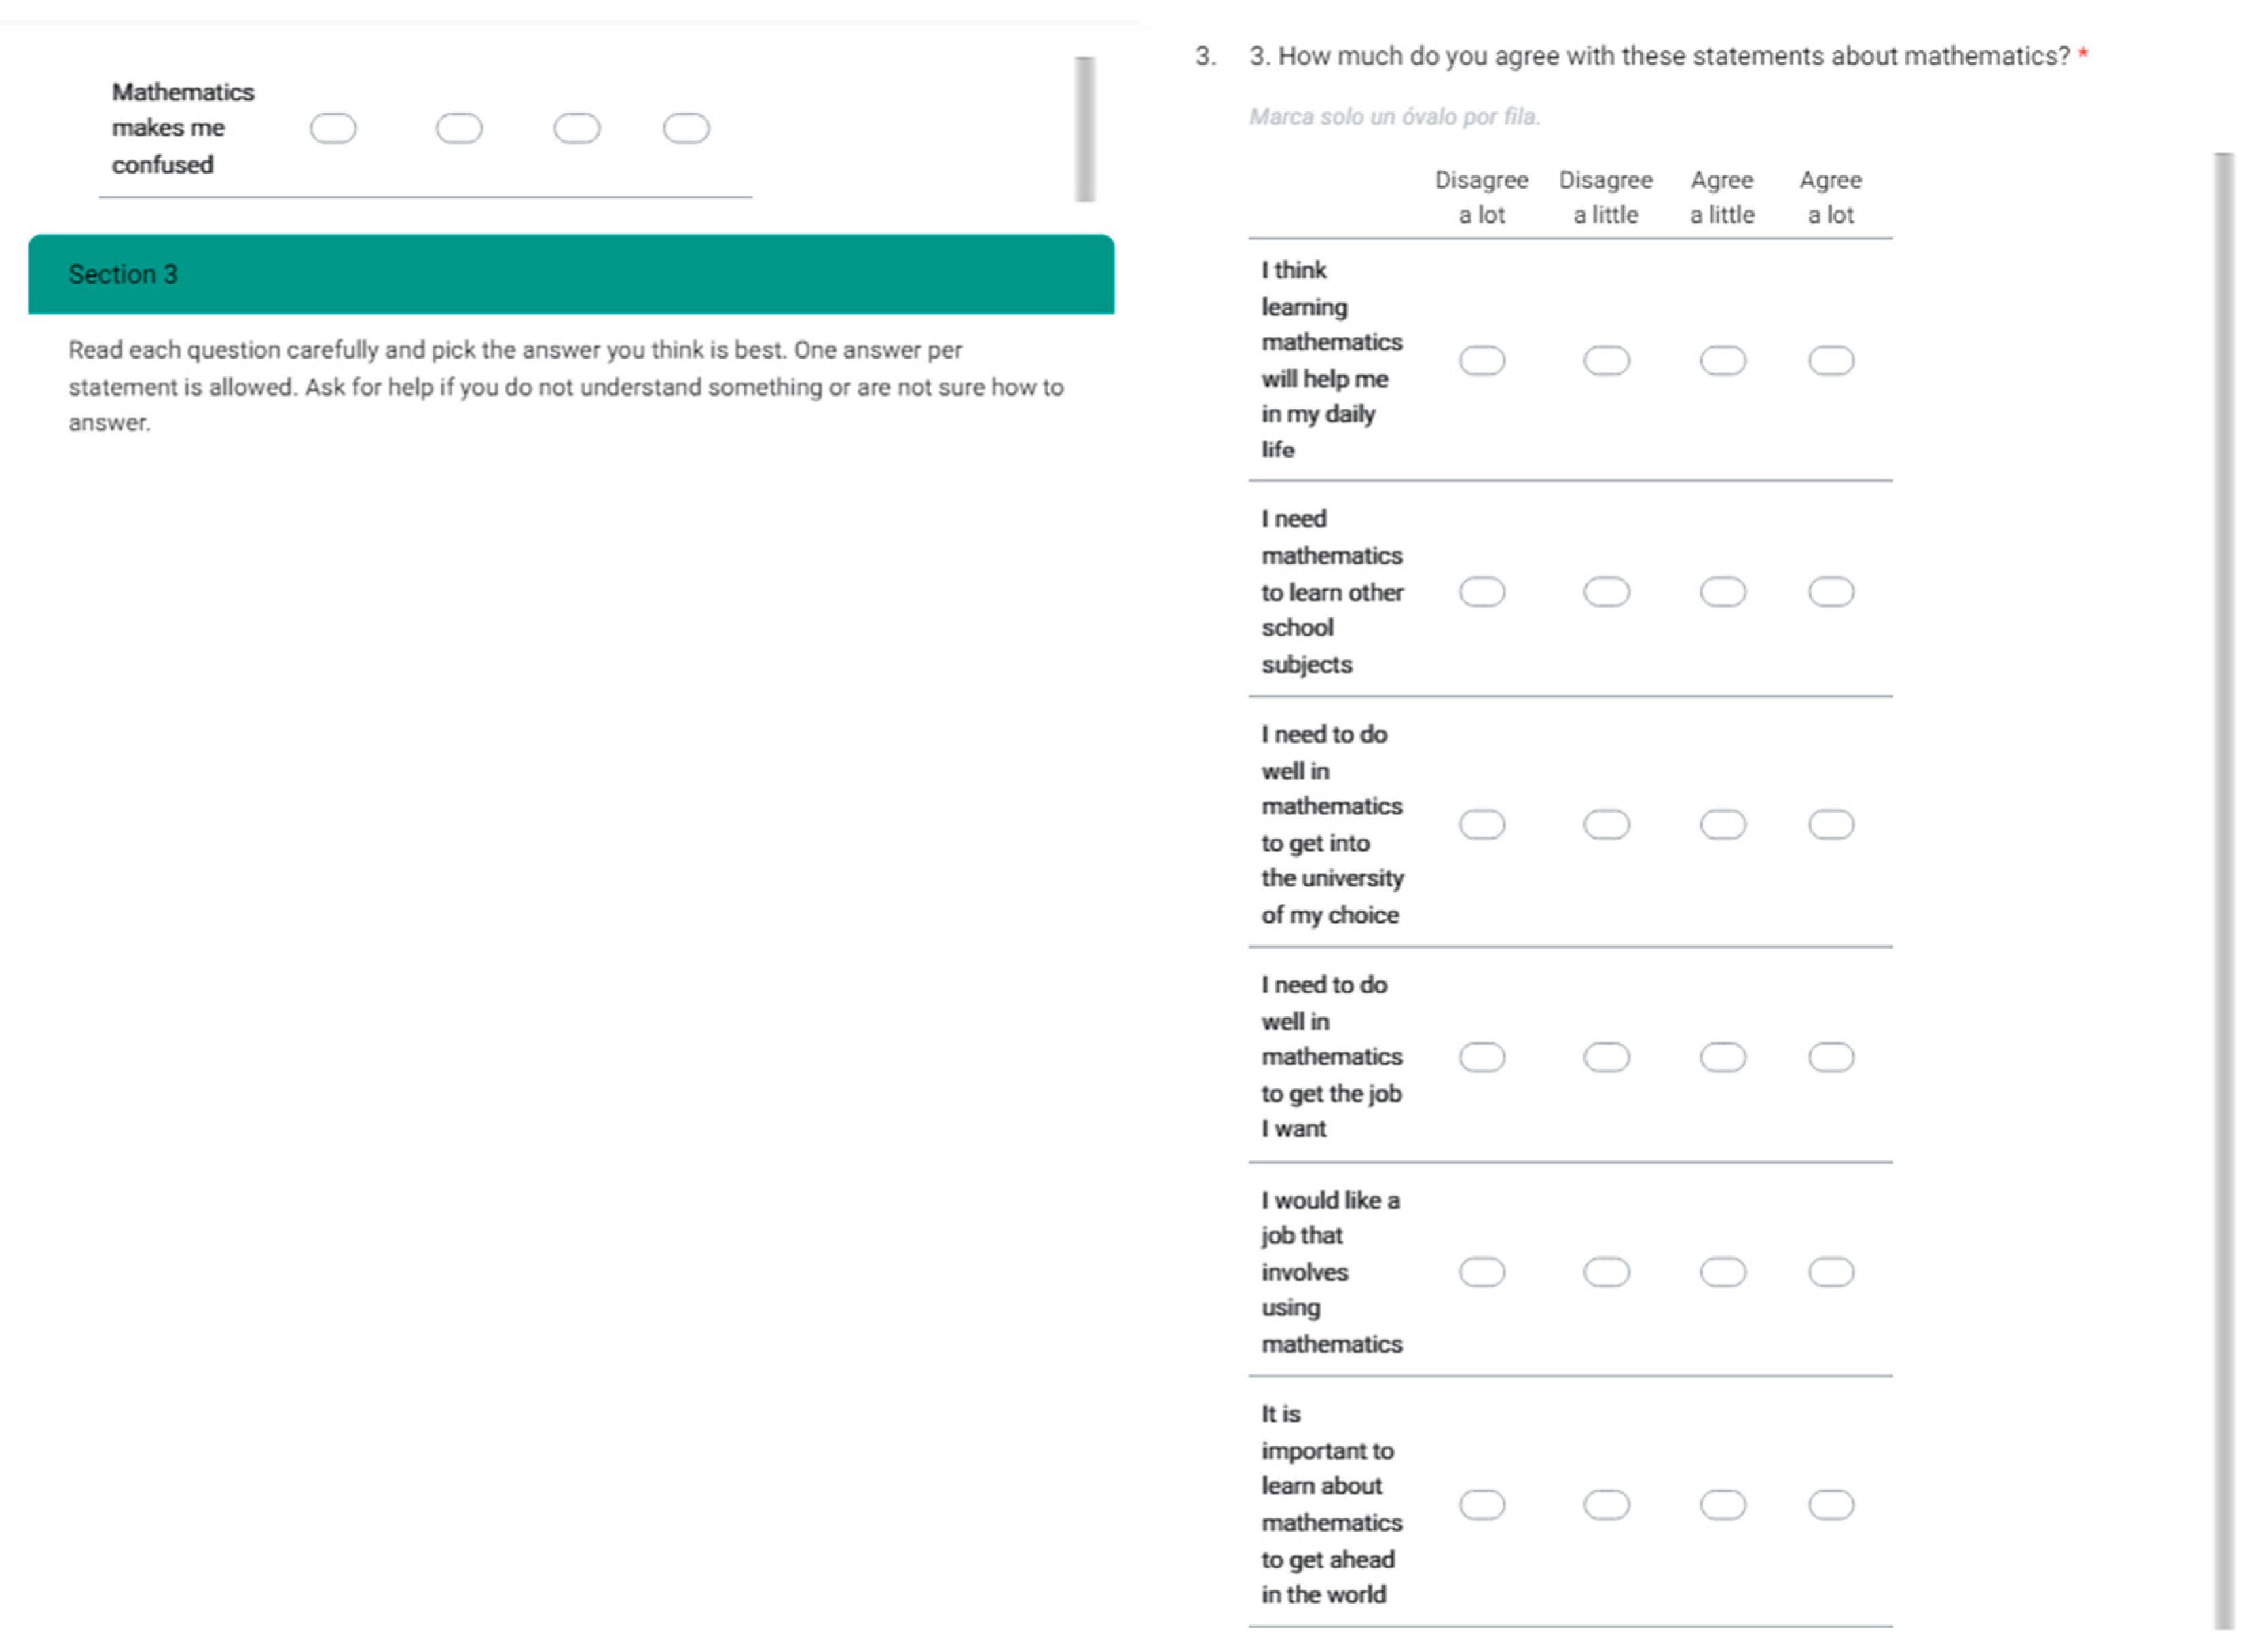
Firstly, the pretest consisted of a test on attitudes toward mathematics from the methodology used by O’Rourke and Prendergast [16], who based it on the Trends in International Mathematics and Science Study (TIMSS) that are carried out annually [17]. Three sections corresponding to the interest/enjoyment toward mathematics, the mathematical self-concept, and the value/utility perception were considered for this study. The test had a total of three sections with nine questions in each section and 4-point Likert scale answer options.
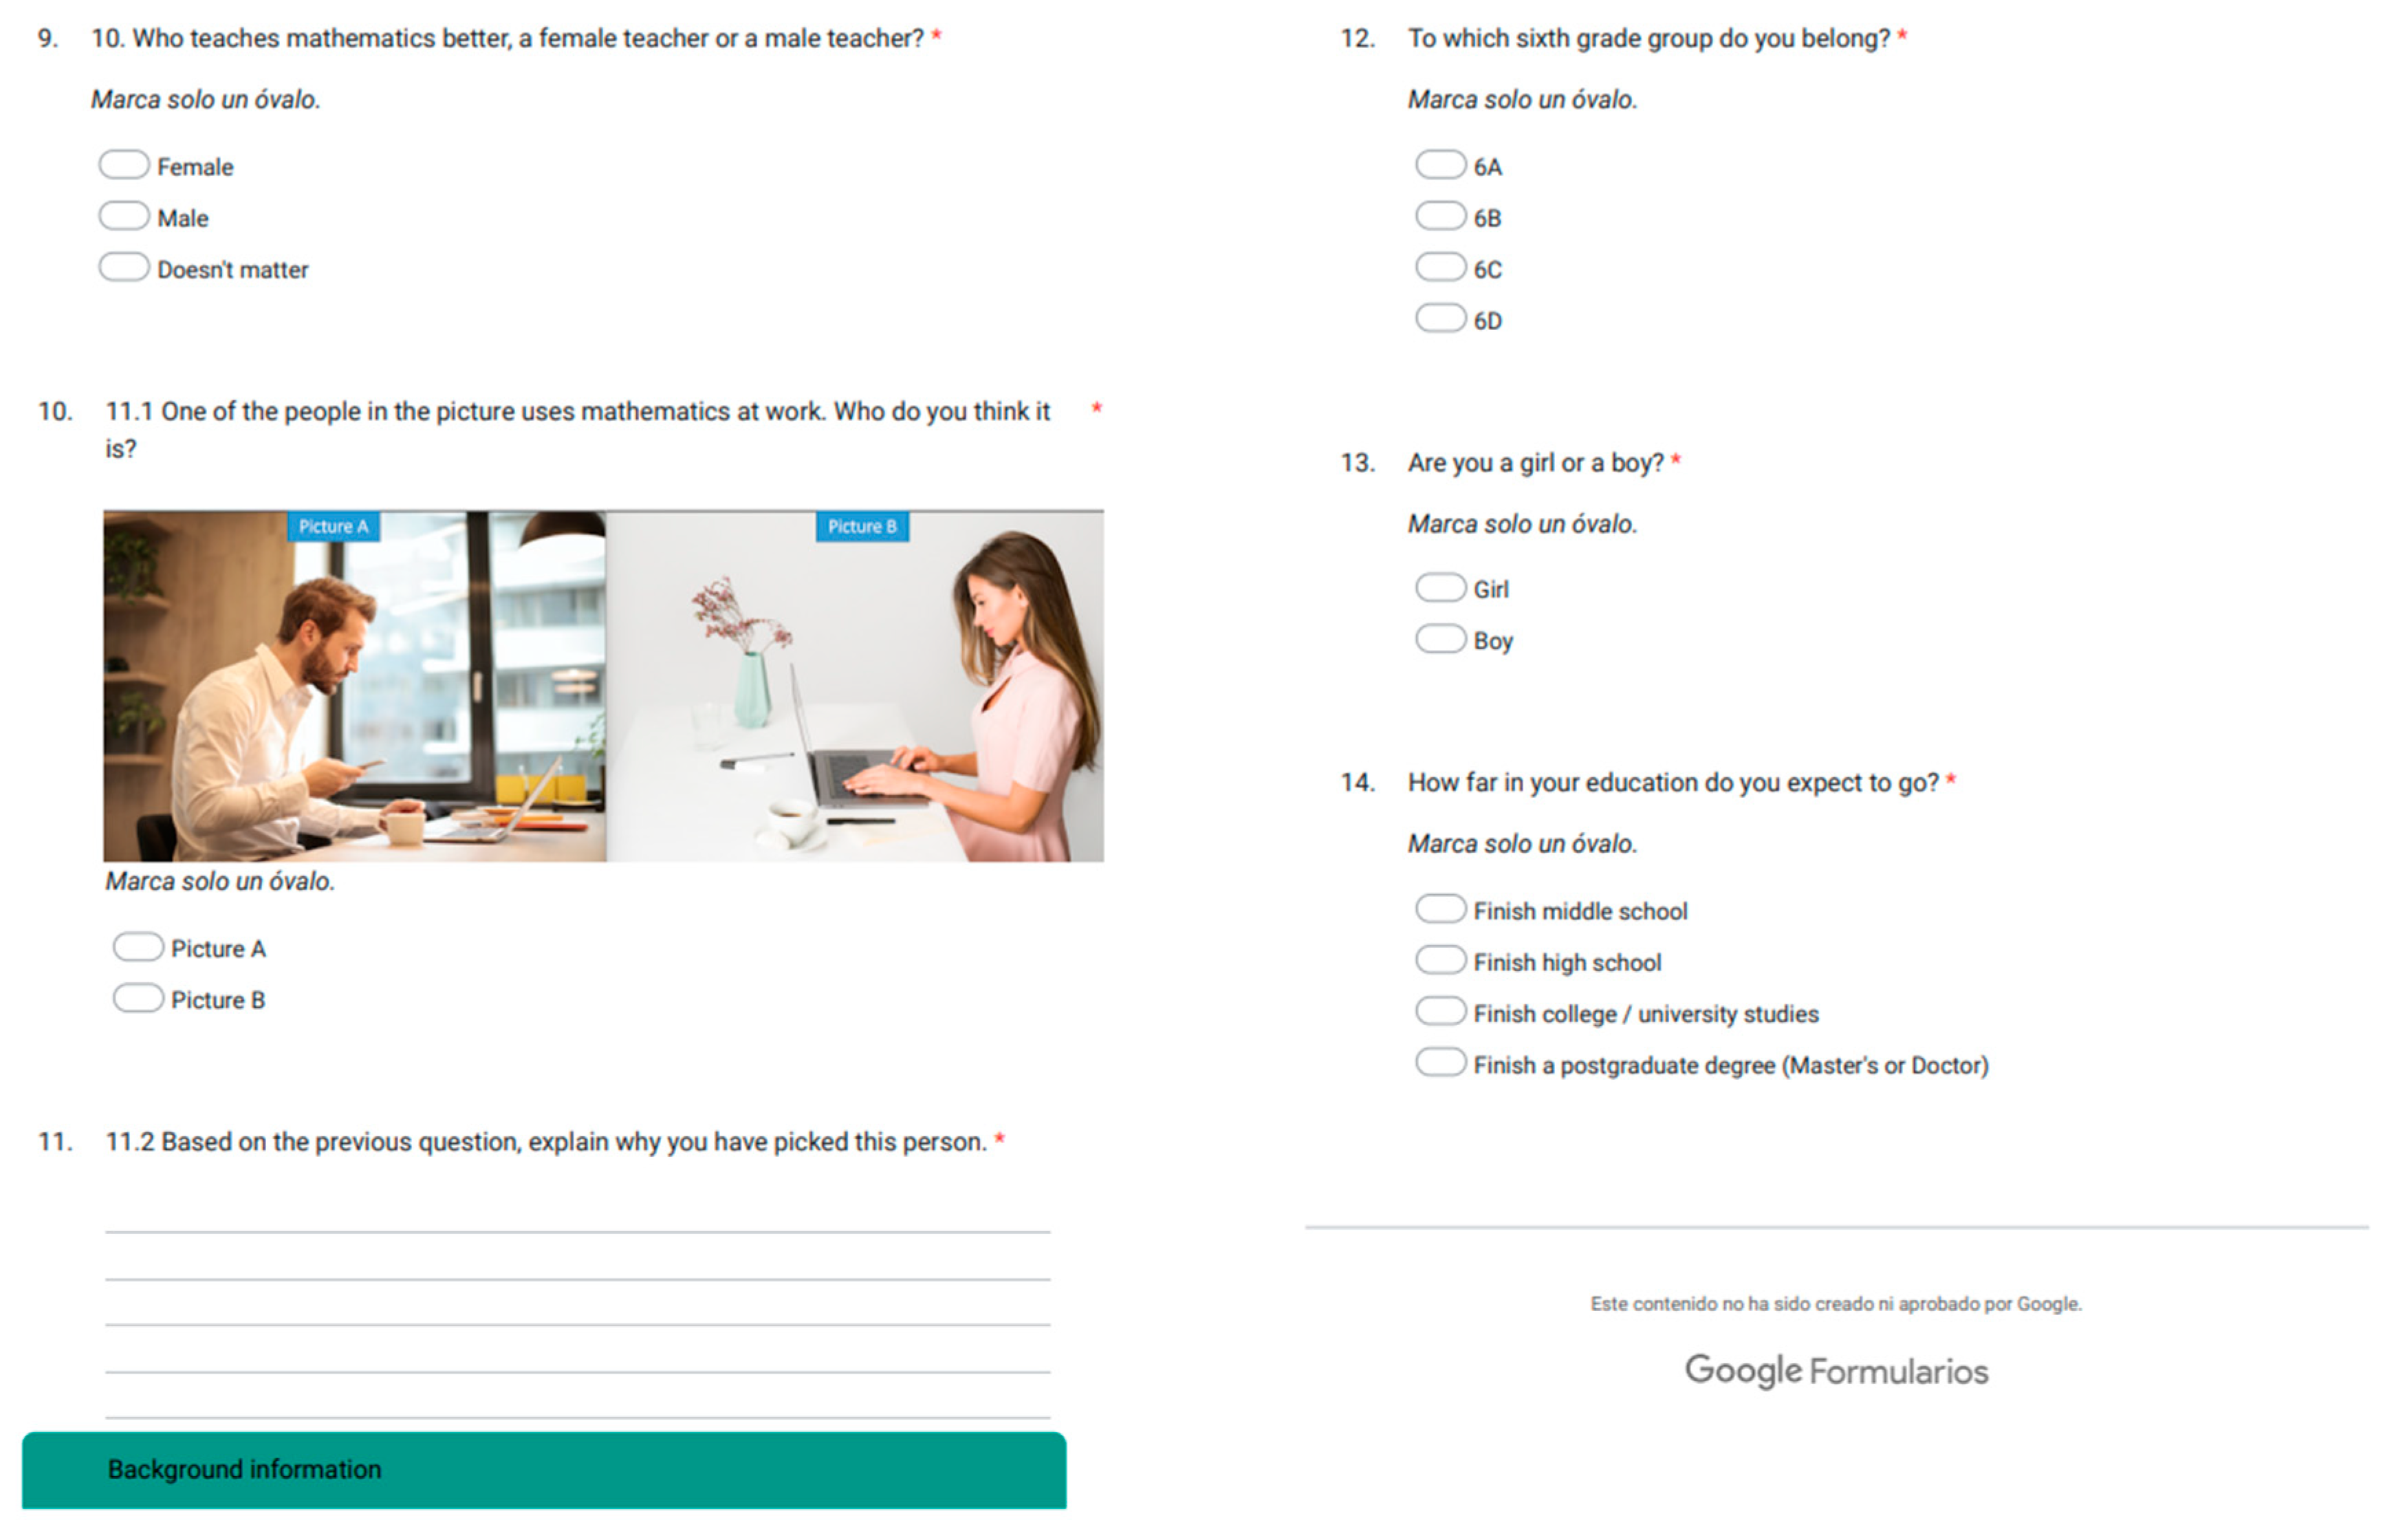
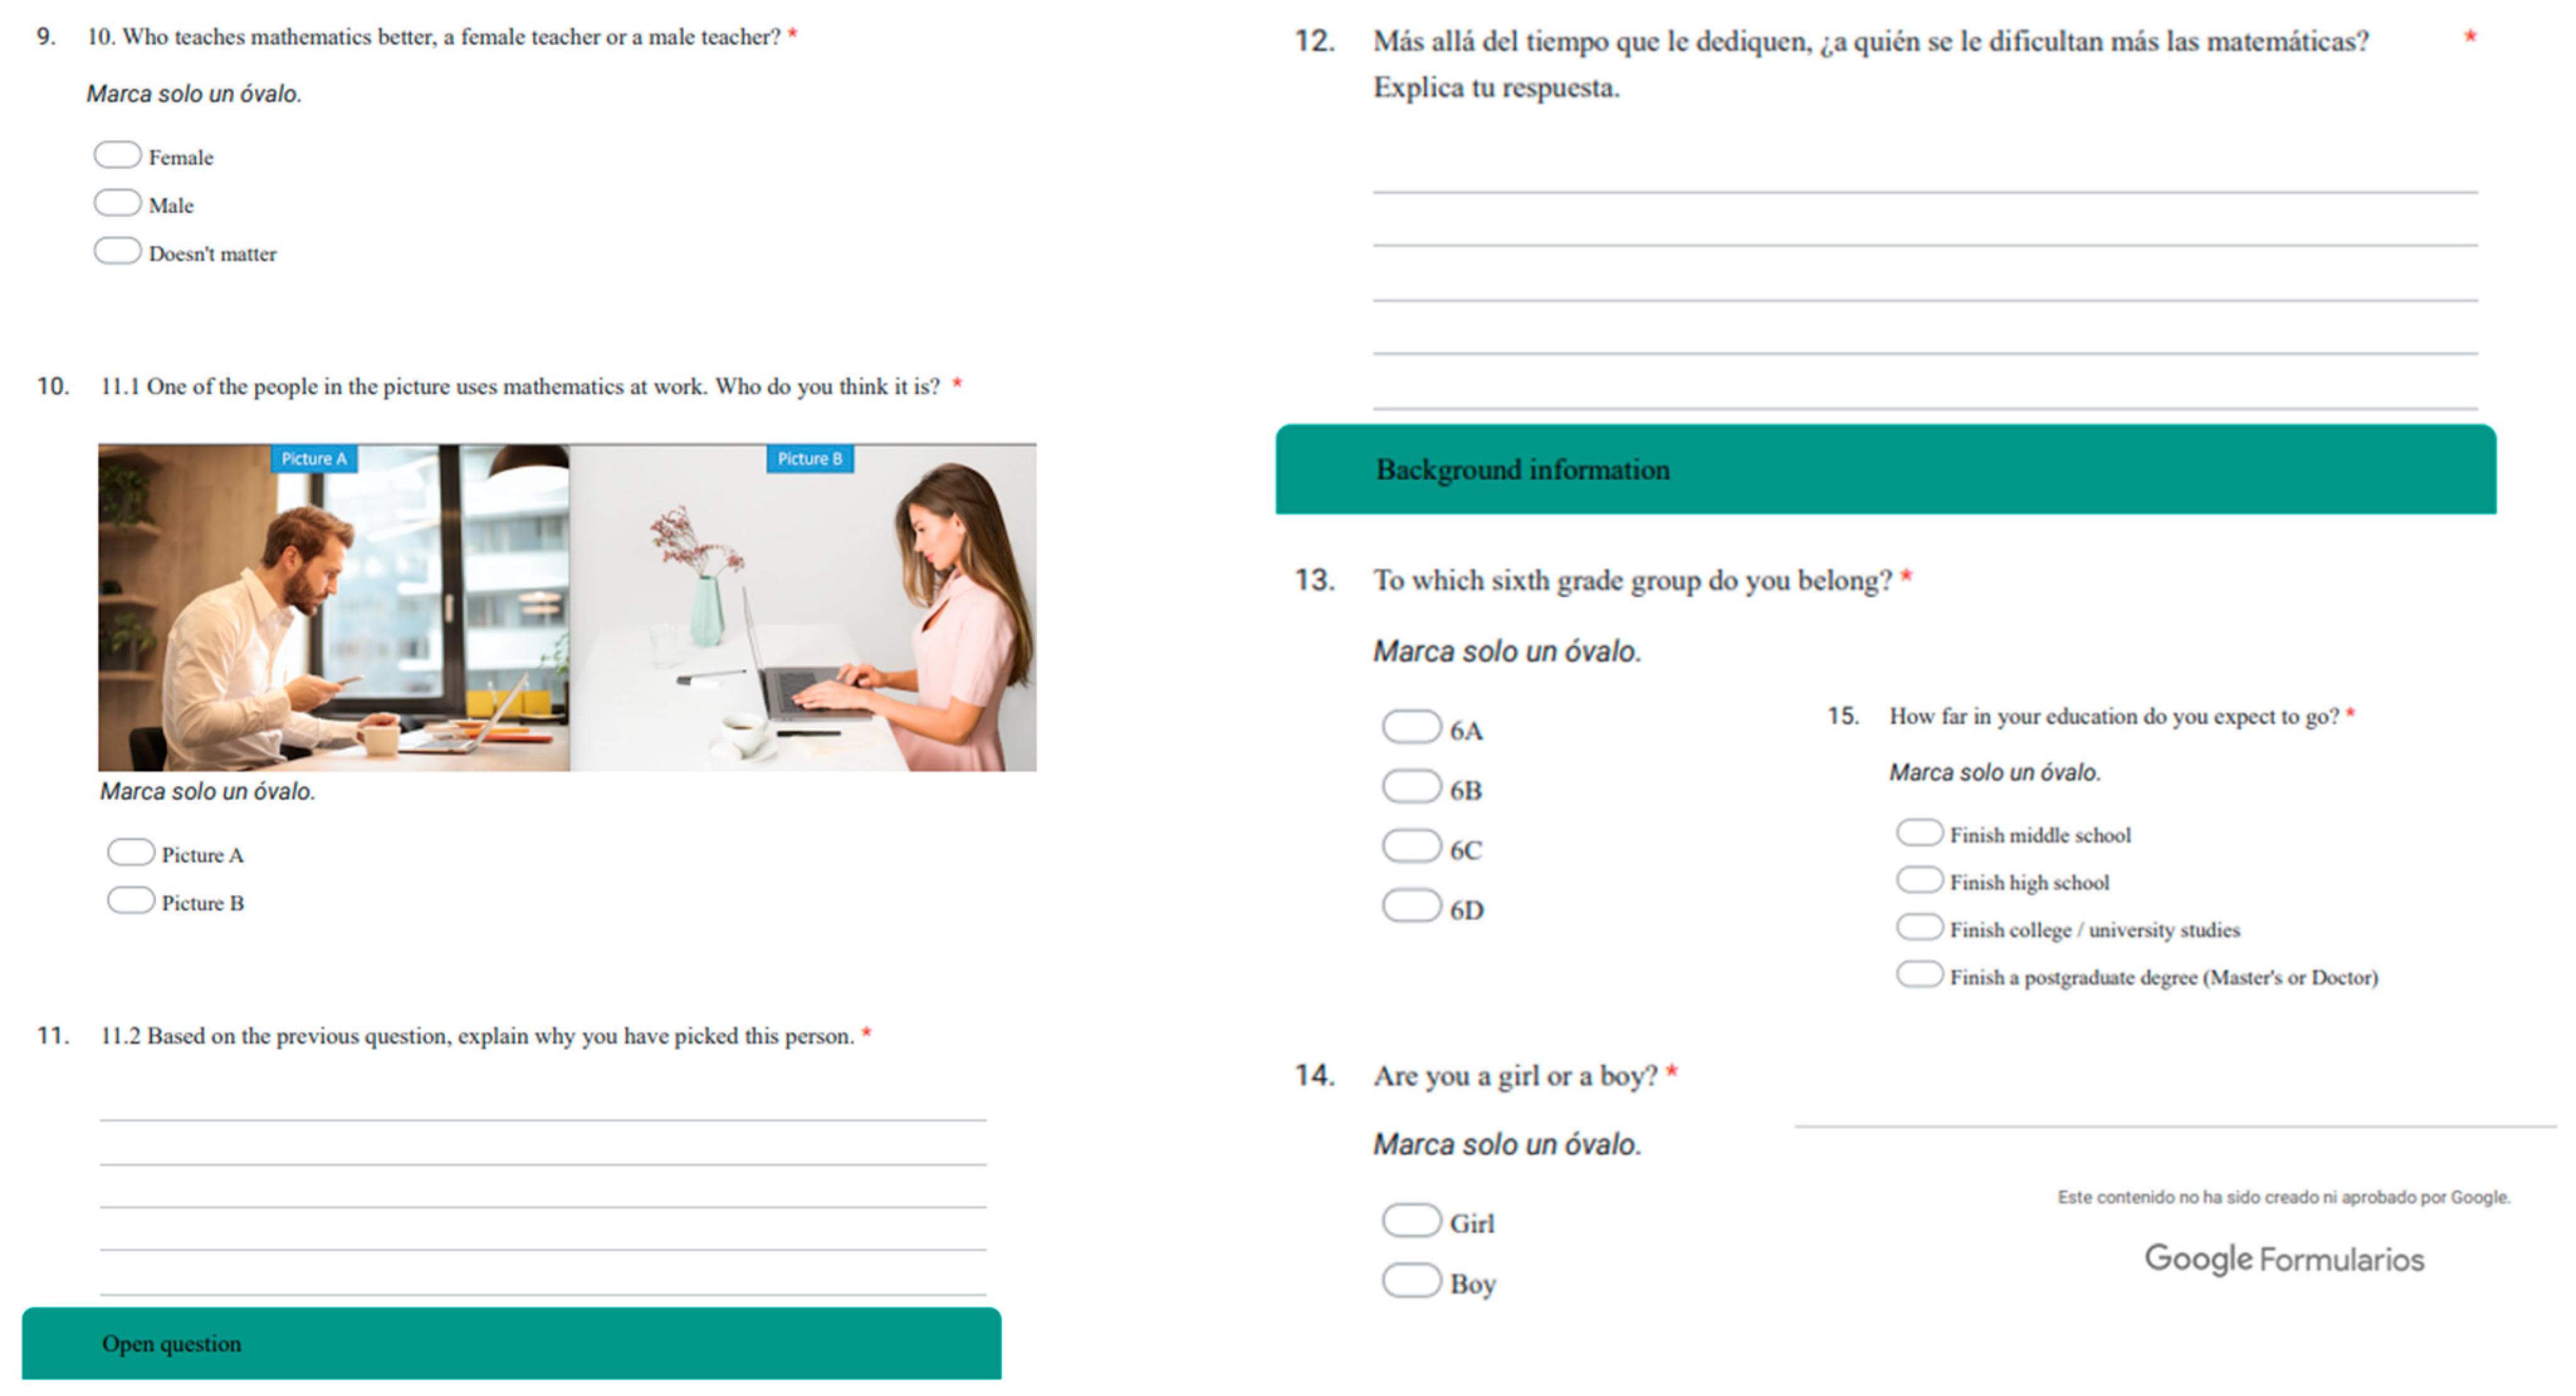
This stage also included a test on gender stereotypes toward mathematics, which was originally created by Forgasz and Markovits [18], with six closed questions and one open-ended question. The first six questions offer three alternatives for students to decide to whom the statements correspond to: women, men, or indifferent. Meanwhile, the open question presented two images, one of a man and the other of a woman, both working on a laptop. The images were chosen to be as similar as possible and were obtained as public domain resources. They can be observed in Appendix A. Students had to answer the following question: “One of the people in the picture uses mathematics at work. Who do you think it is? Explain why you have picked this person.”
After the pretest stage, the intervention ensued. In this stage, only one group participated. It took place at the beginning of their school day during a timeframe of four weeks, three times per week. During each day of the intervention, the group was exposed to a video from YouTube of a STEM professional. After watching the video, students had to answer an open-ended questionnaire on their self-perception in STEM careers. This questionnaire was created by the author of this study after identifying topics that were not addressed in the answers from the pretest. It included two questions: “What ideas can motivate you to choose a career in STEM?” and “Do you think you could succeed in this occupation? Why?” All answers were registered on a collaborative board in Nearpod.
The final stage consisted of the reapplication of both the attitudes toward mathematics test and the gender stereotypes toward the mathematics test. This included the original open-ended question used by Forgasz and Markovits [18] as well as a new question, which was added based of the trends identified in the answers from the intervention: “Beyond the time spent on it, who finds mathematics more difficult?” All answers from the tests were collected through Google Forms. The instruments used during the pretest, intervention, and post-test can be found in Appendix B, Appendix C and Appendix D, respectively.

2.3. Analysis Strategy

This section presents the steps followed throughout the analysis. Figure 1 shows the sequence in which both quantitative data (shown in green) and qualitative data (shown in blue) were obtained and analyzed. The figure differentiates between the group that participated in the intervention stage and the rest of the population, which is considered the control group.
The interaction between the quantitative and qualitative data can be observed in Figure 1. Initially, quantitative and qualitative data were collected and analyzed simultaneously. The results of the pretests were then used to create the questionnaire that was applied during the intervention. Consequently, the results of the intervention were used to design the questionnaire that was integrated to the post-tests with the intention to explore possible gender stereotypes. The combination of a simultaneous analysis of quantitative and qualitative data and their use to generate two more instruments, with a final collective analysis, contributed to this study having a concurrent triangulation design blended with elements of an embedded model [19].
The test results were analyzed through Excel by obtaining means and standard deviations of each statement. These were divided by gender to determine the association of gender with the previously mentioned objectives. For this purpose, the following assumptions were established:
  • Gender is associated with the affective domain toward mathematics in middle school students (SA.1).
  • Gender is associated with gender stereotypes toward mathematics in middle school students (SB.1).
On the other hand, the discursive data obtained were qualitatively analyzed using Atlas TI software (version 23.1.1.0). After their collection, the analysis was carried out based on the following three steps: discovery, codification, and relativization [20]. Both the qualitative and quantitative data were incorporated in the analysis to obtain a complete view of students’ perceptions. The findings from the multi-staged analysis were used to propose a model, which represents the association between all studied elements [19].

3. Results and Discussion

Given the nature of a mixed methodology study, the results were simultaneously collected, analyzed, and discussed. Thus, this section is divided into a qualitative analysis part, followed by a subsection corresponding to the quantitative analysis. Within each of these subsections, the results of each analysis are discussed; afterwards, a final subsection containing a general comparison of these results is presented.

3.1. Qualitative Analysis

Both objectives 1 and 2 are addressed through the qualitative analysis of the three open-ended instruments. These comprise the initial question about the use of mathematics in the workspace, the intervention’s questionnaire on the self-perception in STEM careers, and the final questionnaire on the use and ease of mathematics from the post-test. A subsection for each is presented below, starting with the coding strategy used during the qualitative analysis.

3.1.1. Coding Strategy

As mentioned previously, Atlas TI software was used to carry out the coding procedure. Given that this study was part of a student’s requirements for completing their master’s degree, coding was performed by the student under the supervision of her advisor. First, answers collected from each instrument were added as separate documents into the software. A gender label was assigned to each quotation based on the participant who wrote it (female or male student). Secondly, exhaustive coding was performed among the responses based on the topics mentioned by the students and the concepts related to the learning domains [1]. Next, these codes where repeatedly refined until a likeness was identified with the concepts reviewed in the literature. Finally, they were grouped into ten common categories. These categories were created based on both the literature and common themes that presented themselves among the participants’ answers. The codes concerning the affective domain were categorized into interest/enjoyment of mathematics, mathematical self-concept, and the perceived value/utility of mathematics [16]. Meanwhile, the relationship between gender and mathematics was studied by three groupings: peer beliefs, adult beliefs, and stereotypes of people working in STEM [18]. Four additional categories were created based on the emerging themes: contextual elements and events, cognitive skills, study areas, and attitudes. Table 1 presents the total frequencies of the generated codes according to the instrument with which they were identified.
In Table 1, it can be observed that most of the 574 quotations are distributed among two categories. Firstly, most of them encompass the interest/enjoyment category, with a total of 209 quotations; secondly, they encompass the self-concept category, with 145 quotations. These frequencies suggest that both of these affective domain elements could have the most significant influence on middle school students’ attitudes toward mathematics in. Thus, this trend is further explored amongst the results of each instrument, as presented in the following sections. The criteria used to select the examples of students’ opinions are derived from their clarity, the depth of their reasoning, and the connections they manage to make. Each participation was coded based on the collection instrument, the gender of the student, the student’s group (A,B,C,D), and a random number assigned to order responses (e.g., PS.C.M.6 as the abbreviated form of Post-test.GroupC.Male.6). In the case of the participants who underwent the intervention, rather than identifying the group they belonged in, the day and question was also added (e.g., IN.F.3.D5.Q1 as the abbreviated form of Intervention.Female.3.Day5.Question1). This was completed with the purpose of identifying participants’ answers while maintaining their anonymity.

3.1.2. Pretest: Question about the Use of Mathematics in the Workspace

This open question asks students to indicate who uses mathematics in their job from the two images presented—whether the man or the woman. In total, 75% of the students chose the man. This aligns with Bond’s [6] findings, in which the exposure to stereotypical models reinforces the idea of men as commonly working in STEM fields. The said approach explains why most of the participants naturally envisioned the man as a STEM professional and validates the strong influence of the stereotypical male role model in STEM fields. On the other hand, Ikkatai et al. [21] suggest that the lack of female role models is related to women’s disinterest in STEM, adding to the notion that selecting the man reflects the image of a traditional role model.
Participants justified their decisions on who uses mathematics in their job based on the individual’s surroundings and expressions. In total, 80% of the students selected the person working in STEM based on the objects around them and their expressions. They noticed that the man was using a cell phone possibly as a calculator, while the woman might have been using a notebook for writing various procedures. Additionally, the other 20% of the participants related the bodily and facial expressions of both individuals to the difficulty or displeasure associated with mathematics. For example, participant PR.D.F.8 chose the man because the woman appeared relaxed, whereas he seemed “more focused and stressed because mathematics can be difficult at times”. In this way, both concentration and focus were associated with the study of mathematics.
Another topic mentioned was gender’s influence on who works with mathematics. About 11% of the participants mentioned gender in their results, all stating that it has no influence on working with mathematics; from these participants, two thirds were female students. For instance, student PR.D.M.7 wrote, “I chose the woman because many people think that only men can work using mathematics in their daily lives, but women have the same opportunities to work in a company using numbers and mathematics”. Such responses demonstrate the students’ awareness of gender stereotypes in STEM and a desire to transcend the constraints imposed by their own experience of the equitable abilities of men and women. In the literature, it has been reported that the awareness of gender stereotypes in STEM increases during middle school, impacting academic performance [22] and warranting further study [23]. It has been suggested that promoting the awareness of gender stereotypes in STEM might improve STEM identity and, consequently, improve mathematical self-perception [24].

3.1.3. Intervention: Questionnaire about Self-Perception in STEM Careers

The intervention involved watching a video of a STEM professional in each session; afterwards, students in this group responded to the two questions that made up the questionnaire about self-perception in STEM careers. As stated above, the presented examples of students’ opinions are derived from their clarity, depth of their reasoning, and connections they managed to establish.
Regarding the first question, “what ideas could motivate you to choose a career in STEM?”, a total of 153 responses were obtained. Among them, the most prominent category was interest/enjoyment, with 96 quotations corresponding to it. When searching for reasons to pursue careers in STEM, the participants referred to the motivations of the individual featured in the viewed video. Approximately 27% of the students referred to their prior interests as a source of motivation. For example, participant IN.F.3.D2.Q1 referred to their favorite subjects by writing, “If I like design and physics, I could become an electronic engineer”.
Another relevant category was interest/enjoyment of mathematics. The responses reflect that liking mathematics is a primary motivating factor. Among them, 10 participants express a neutral interest/enjoyment of mathematics (30.8% male, 69.2% female), 19 lean toward a negative attitude (31.6% male, 68.4% female), and 67 manifest a positive interest/enjoyment of mathematics (35.4% male, 64.8% female). For instance, student IN.M.3.D2.Q1 identified with the person in the video by stating, “Her favorite subjects [the person in the video] were mathematics and physics, and those are my favorite subjects”. In contrast, student IN.F.9.D7.Q1 mentioned that “nothing [can motivate her] because she doesn’t like those things, but if someone did like them, there would be a higher chance of choosing [a STEM career]”.
The value/utility category was less frequent, but it was still present in the collected data. Out of the 23 responses that corresponded to value/utility, most were related to professional growth. Meanwhile, four students indicated that making money and having fun serve as motivators for pursuing STEM careers (50% male, 50% female), particularly in technology-related professions. The idea of helping others was also prevalent among 8 students (75% male, 25% female). Student IN.F.1.D1.Q1 mentioned that her motivation could be “the feeling that I’m working very hard for useful things that will benefit society”. Another participant, IN.M.1.D5.Q1, wrote, “STEM has a lot to offer, and you can go to places with engineering, mathematics, science and technology”. Viewing STEM careers as tools for a humanistic impact on society was not exclusive to females, which was in conflict with the expected results based on the literature [25]. The results suggest that STEM careers are seen as a means of upward social mobility, which partially characterizes the interest in pursuing STEM careers in Mexico [26].
Regarding the second question, “Do you think you could succeed in this occupation? Why?”, 90 answers corresponded to the self-concept. Moreover, 60% of the responses conveyed that they could not succeed in the profession because they were not “good” or skilled in it. Student IN.F.3.D4.Q2 commented, “I don’t consider myself good at this type of thing, so I focus on what I [do] consider myself good at”. Of the quotations with codes indicating a lack of skill, knowledge, confidence, or understanding, 73% were written by female students. Conversely, 60% of the quotations coded for a positive self-concept (ability, success, and confidence) were written by male students. This confirms the presence of a lower self-concept among female students in the pretest and in the literature [1]. These results are also linked to classroom dynamics, which favor different attitudes and actions between male and female students [27].
Responses with a high self-concept include comments such as “Yes, because I like building things, like Legos!” by participant IN.F.6.D7.Q2 or “Yes, because my dad is an app developer, and I’m good at it too, so I’d like to have that career” by student IN.M.5.D6.Q2. These responses indicate students’ belief that they could succeed due to their interest and skills, referring to a contextual, social, or academic element that reinforces their talent in STEM. Considering this, interest/enjoyment can be linked to the self-perceived ability in mathematics, which corresponds to the self-concept.
As an observation made by the researcher during the intervention itself, it is highlighted that the second question provoked an abundance of negative comments. These comments, spoken out loud by students, emphasize their written answers. Students, mainly female students, were vocal and confident in not pursuing STEM careers due to STEM’s difficulty and their perceived inability. Once more, this is in agreement with the literature, which reports that women have a lower mathematical self-concept than men [1].

3.1.4. Post-Test: Questionnaire about the Use and Ease of Mathematics

For the post-test, the question regarding the use of mathematics in the workspace was reused, and the following open-ended question was added: “Beyond the time dedicated to it, who finds mathematics more challenging?” This question was included due to the frequent mention of the difficulty of mathematics during the intervention and due to the results from the pretest, which indicated that female to perceive mathematics as more challenging. Therefore, it was decided to explore possible gender stereotypes that could lead to these results.
The most frequent codes in this section are consistent with those in the pretest. Contextual inference was used by 26% of the participants as the main method to determine who works with mathematics. By observing the posture and expressions of the individuals in the pictures, students associated mathematics with attention, stress, or lack of relaxation. A student coded as PS.D.F.7 commented, “I think it’s A because I feel that mathematics can be confusing or difficult, and image A looks just like me in [math] class”.
The quotations that corresponded to the self-concept presented a characteristic trend. Among the 26 responses that were coded for the self-concept, all of them presented a negative perspective toward their skills in mathematics (50% male, 50% female). The most frequent theme was the difficulty of mathematics, especially in the second open-ended question. Among those who believed the question was related to gender, fourteen students referred to equality (6.3% male, 85.7% female), while six students chose one gender over the other (100% male, 0% female). In terms of equality, participant PS.D.F.9 wrote, “I couldn’t say if it’s more difficult for someone because it depends on each person, everyone learns in their own way and at their own pace”. Further, 29 responses mentioned that laziness, forgetfulness, and procrastination are characteristics of people who find mathematics challenging (65.5% male, 34.5% female). Student PS.B.M.1 wrote, “It’s difficult for people who don’t apply themselves and don’t want to learn”.
Being among those who selected a gender over the other, participant PS.B.F.7 wrote, “maybe for female students [mathematics is more difficult]; I’m not sure if it’s because I’m a female and I find it a bit difficult, but I’ve seen more male students understand it than female students”. A different participant, student PS.D.M.6, expressed, “I think it’s men because at an early age, everything distracts us, and women are organized from a young age, so I think a woman would learn mathematics faster than men.” Another student stated that men are interested in topics like soccer; in contrast, a different student commented that in their classroom, female students struggle more with mathematics. Thus, there is no consensus, but there is a tendency for personal preferences and interests to define the perceived difficulty of mathematics for each student. Therefore, the observable trend seen in these results aligns with the proposition that we should prioritize increasing students’ interests in mathematics and, consequently, in STEM careers [1].

3.2. Quantitative Analysis

Subobjective 1 was primarily addressed through the quantitative analysis of the data obtained from the tests in both stages: the pretest and the post-test. The following subsections present an analysis of the responses obtained per instrument. For this analysis, the responses were separated by gender, and the means were calculated for each statement in the tests. The means of the results for male students were compared with the means of the results for female students to determine differences in perception between each gender.

3.2.1. Pretest

The results of the pretest regarding the section on attitudes toward mathematics were analyzed. In Table 2, the six statements that did show gender differences can be observed. They are divided into the three categories corresponding to the element of the affective domain contained in the test.
Table 2 shows that the means are one level lower for female students than for male students in statements 4 and 6 of the interest/enjoyment category, indicating a lower level of interest and enjoyment. For the self-concept, in statement 6, the mean of the results for female students was 2 (somewhat disagree), while for male students, it was 3 (somewhat agree), indicating that male students find it easier to solve difficult math problems. Similarly, the mean for statement 9 of the self-concept category was 3 for female students, indicating that math confuses them. Statement 3 of value/utility corresponds to a mean of 4, compared to a mean of 3 for female and male students, respectively. In contrast, statement 5 has a mean of 3 for male students’ responses, while for female students, it is 2. Therefore, female students appear to feel more pressure regarding their performance in mathematics to ensure their academic future, even though male students are more inclined to have a job involving mathematics. These results reflect a lower interest and self-concept among female students. The trend of a lower mathematical self-concept among women has been previously reported and observed in this study [1].
In the section of the test on gender stereotypes toward mathematics, the same differentiation of responses by gender was carried out. The mean responses did not reflect differences between the responses of male and female students, and it was observed that all responses fell into the neutral option.

3.2.2. Post-Test

Table 3 illustrates the differences between the answers of male and female students in the post-test regarding attitudes toward mathematics. Once more, these are split into three categories according to the corresponding element of the affective domain from the test.
In Table 3, it can be observed that the means of statement 6 in the interest/enjoyment category, statement 6 in the self-concept category, and statement 3 in the value/utility category showed the same gender differences as in the pretest. Statement 3 in the self-concept category reflects that, in contrast to the male students, female students do not consider mathematics as one of their strengths. On the other hand, in indicator 6 of the value/utility category, male students attribute greater importance to mathematics with regard to their future success. This time, in the section related to gender stereotypes, no differences were recorded between the group means.

3.2.3. Pretest vs. Post-Test

Table 4 depicts the eight statements from the pretest and post-test that changed between the two data collections. The results are separated by gender and by the type of group, experimental, and control to observe if the intervention had an impact on the students’ responses.
Table 4 illustrates the differences between the results of the pretest and post-test. Among the observed changes, interest/enjoyment improved regarding two statements for the students that did not undergo the intervention. However, for the same indicators, the mean scores of the students in the intervention group showed lower interest, and the scores for the female students remained the same. Regarding self-concept, female students in the intervention group exhibited contradictory changes. In the post-test, they were more inclined to agree that mathematics is not one of their strengths; however, at the same time, they became more inclined to agree with being good at solving difficult mathematical problems. In addition to this disparity, it should be noted that the intervention led to male students finding mathematics more confusing than before.
From the “value/utility” category, students who did not undergo the intervention considered it less necessary to perform well in mathematics to enter a university of their choice. After the intervention, the female students shifted to somewhat disagree with the idea of working in something involving mathematics. The entire population that did not complete the intervention and male students that underwent the intervention showed a higher acceptance of the importance of learning mathematics to succeed.
The said results did not exhibit the consistency to determine that the intervention impacted attitudes toward mathematics or students’ gender equity perspectives. The changes were not exclusive to the intervention group, and gender differences were not consistent across the groups. In fact, the changes between the pretest and the post-test, rather than indicating a trend, contradicted each other. The intervention included an equal number of videos featuring male and female professionals, so an equitable improvement in attitudes toward mathematics for both genders was expected after the intervention.

3.3. General Contrast of Results

This section considers the results obtained from the entire body of discursive data for qualitative analysis. Table 5 below presents the 30 most frequently mentioned words within the entire data collection.
To obtain the list of words in Table 5, all documents analyzed through Atlas TI were considered: the question about the use of mathematics in the workplace during the pretest, the self-perception questionnaire in STEM careers during the intervention, and the questionnaire on the use and ease of mathematics during the post-test. Among the words that appeared with a frequency greater than 50, “bueno” (good) and “difícil” (difficult) stood out. Participants used “bueno” to refer to their ability to perform an action. Therefore, the students’ discourse suggests that their attitudes toward mathematics are associated with their self-perceived capacity. Meanwhile, a reference was made to the generalized perception of mathematics being difficult. Among the words with a frequency of less than 50, “enfocar” (focus/concentrate) and “motivar” (motivate) were prominent. Both concentration and motivation are cognitive aspects that were indicated as essential to encourage a vocation for STEM careers [2,7,13,25,28,29].
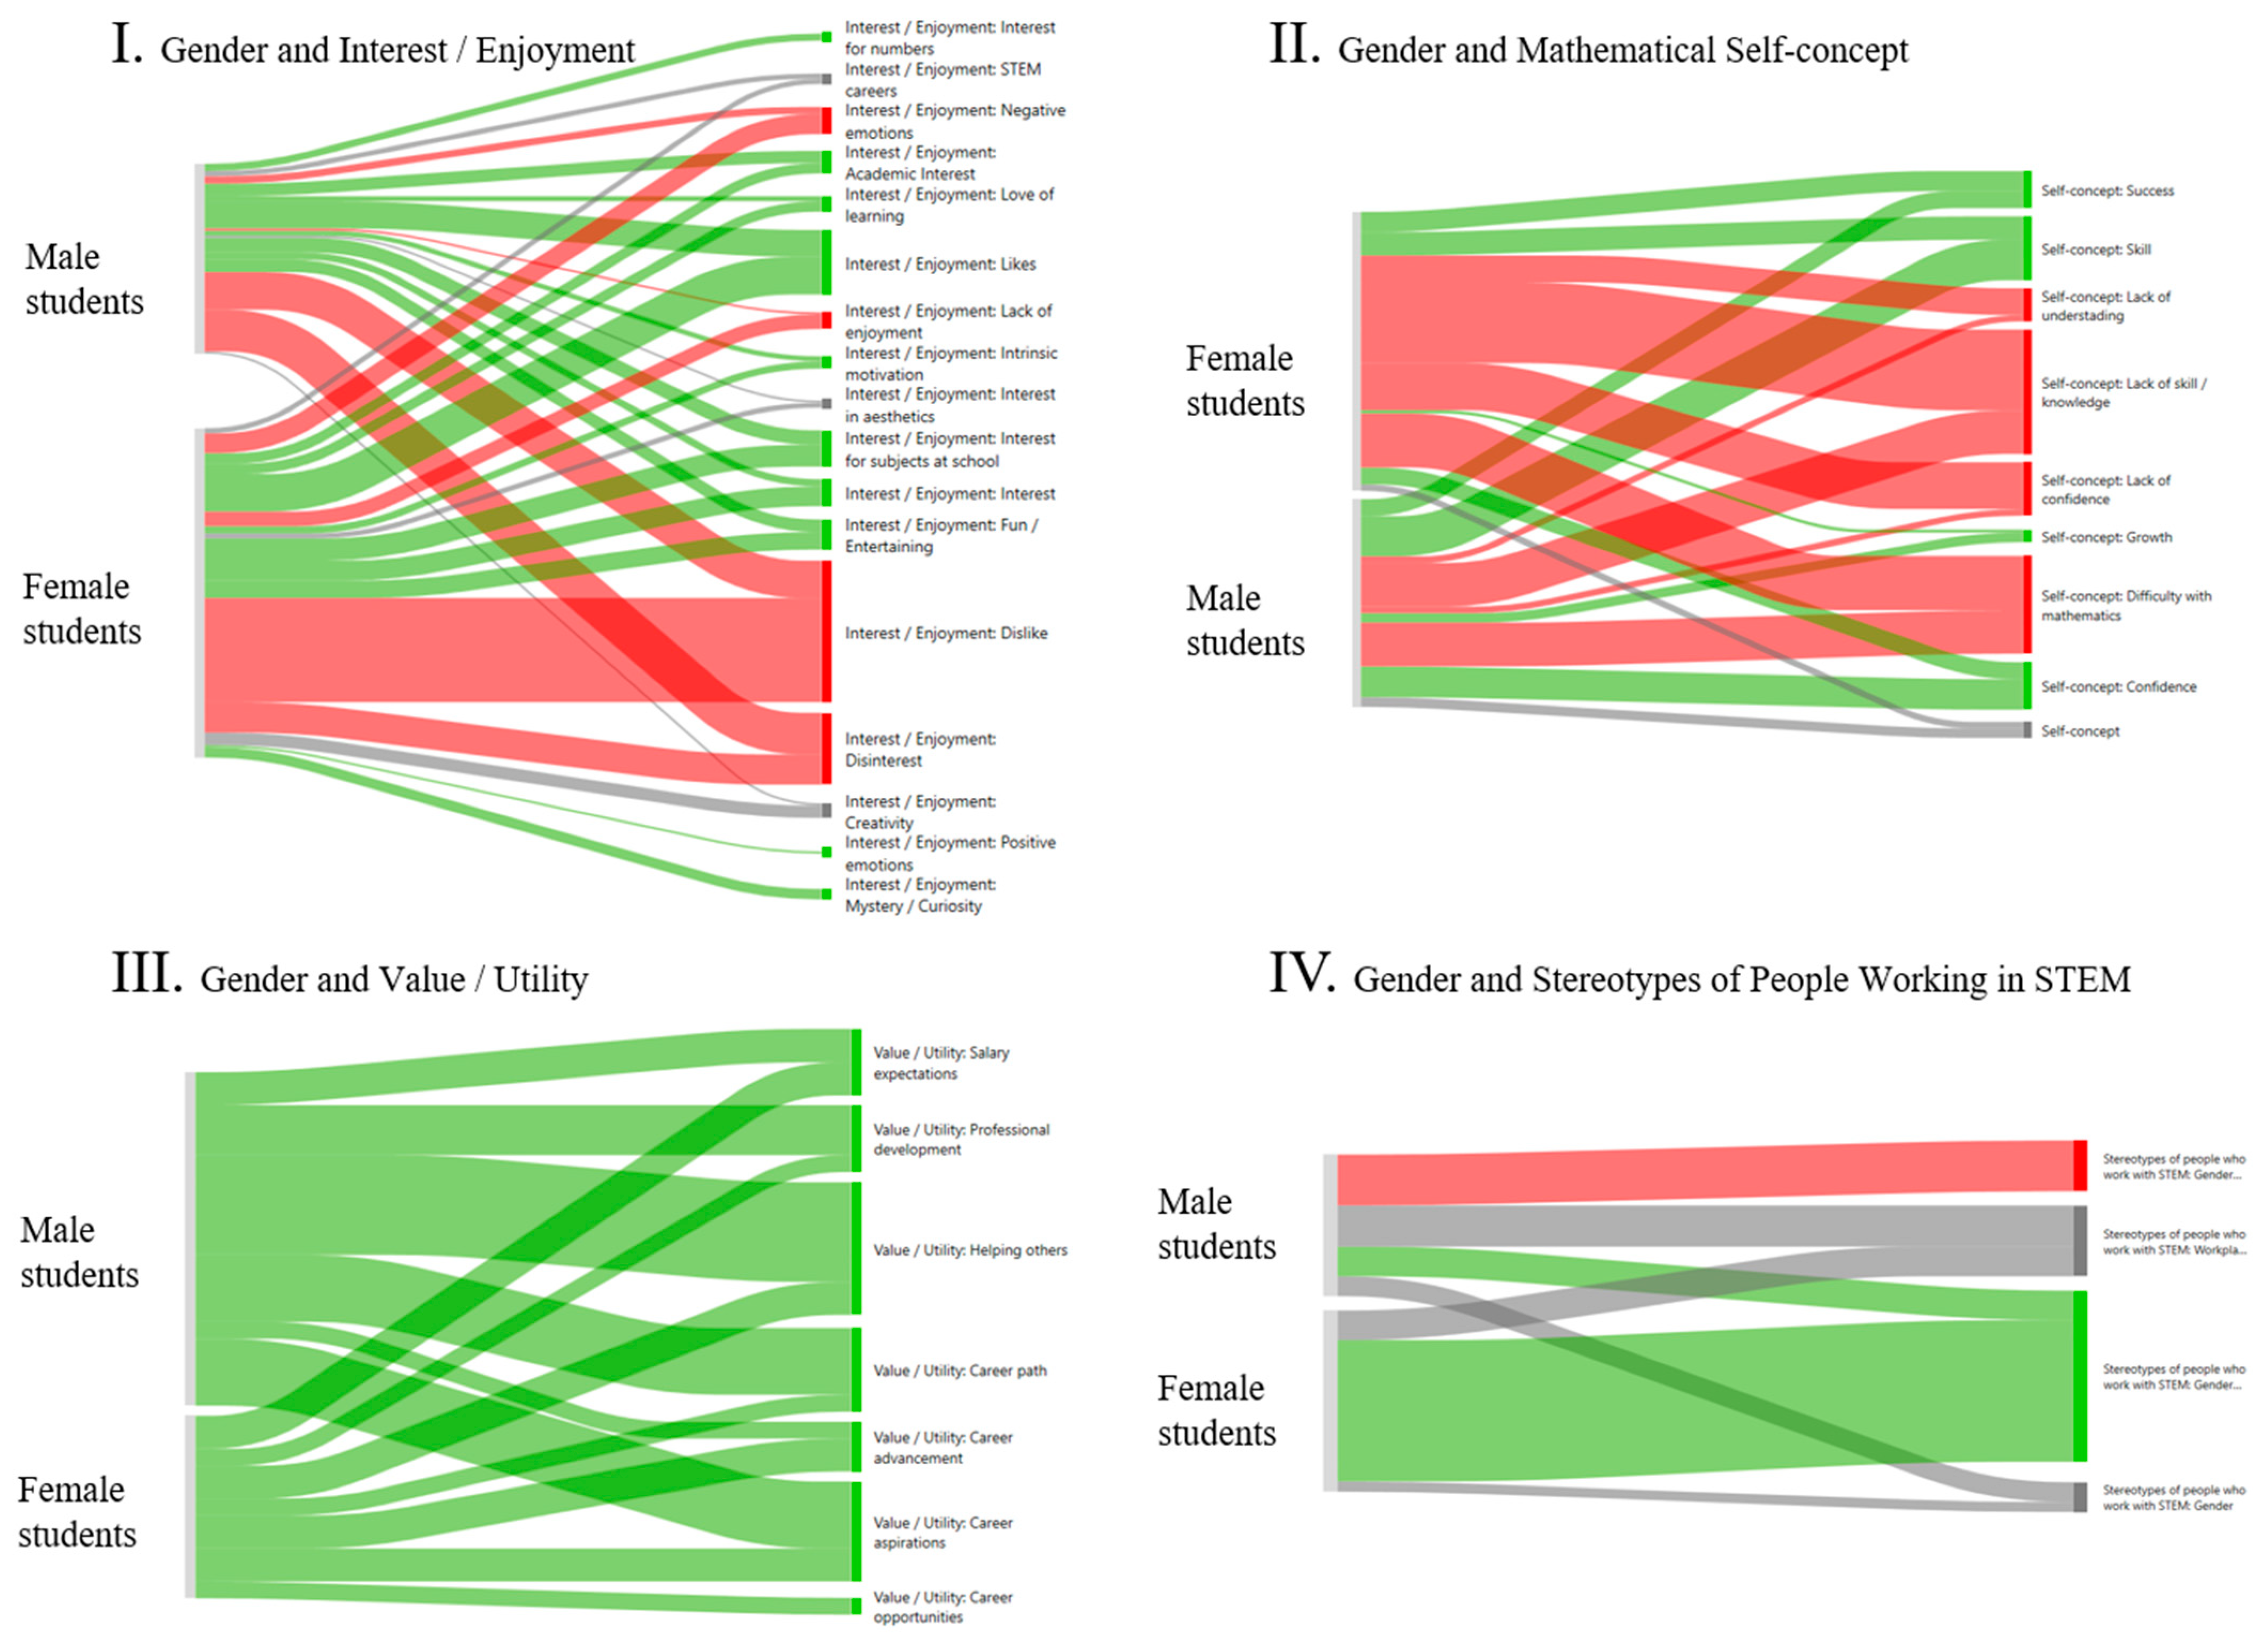
Additionally, the association between categories was analyzed using co-occurrence diagrams. Atlas TI software enables the creation of Sankey Diagrams (SDs), which illustrate the co-occurrence of two codes within the same quotation, signifying an association between them. Codes denoting positive attitudes were marked in green, negative attitudes in red, and neutral attitudes in gray. As seen below, Figure 2 provides four co-occurrence diagrams between gender and other selected categories.
Figure 2 contains a Sankey Diagram I (SD I) related to interest/enjoyment, which shows an equal distribution of positive and negative codes among male and female students, although the negative labels tend to be more associated with female students. This SD aligns with Table 1, where it is observed that interest/enjoyment is the most frequently coded category and exhibits the greatest variety of codes. Moreover, in SD II, most of the negative codes related to self-concept are concentrated among female students, confirming the discussed trend in the literature and in the previous measurement points of a lower mathematical self-concept among women [1].
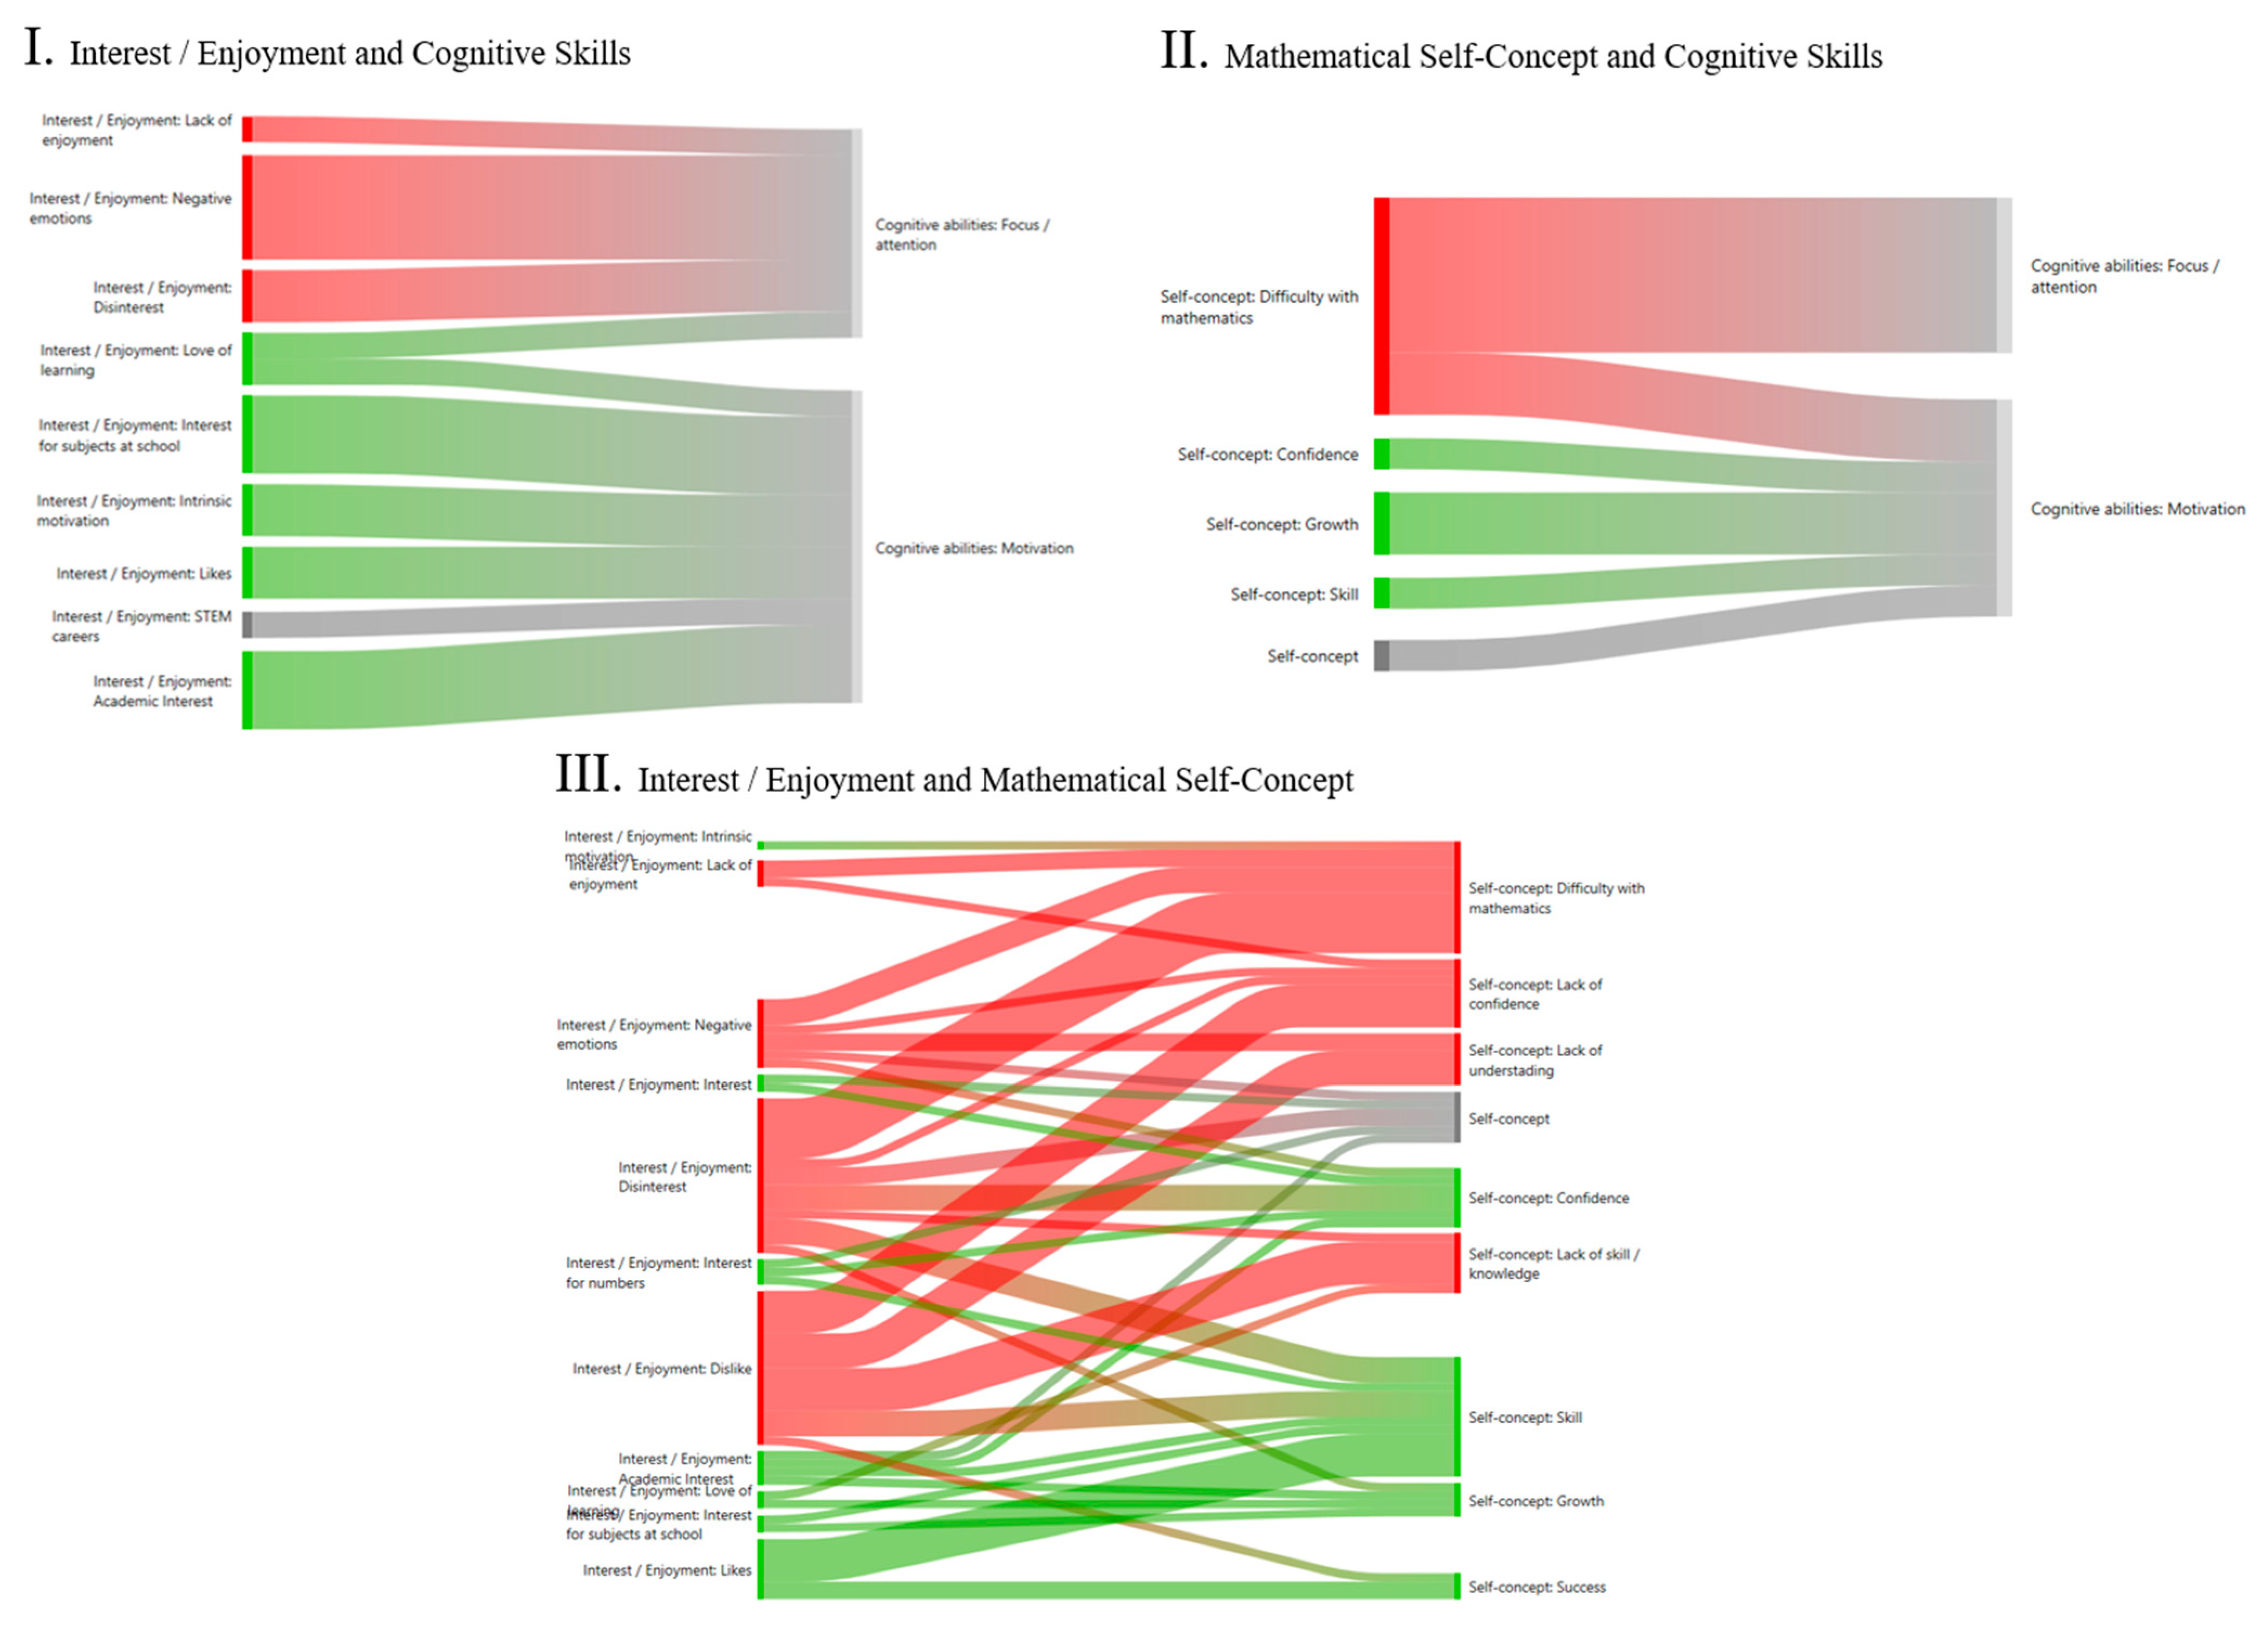
The SD III outlining value/utility presents a scenario in which all codes are positive, and despite having a larger population of female students, these codes are more concentrated among male students. This is consistent with the post-test, where male students emphasized the importance of mathematics for succeeding in life. However, it contrasts with what was reported by Sáinz et al. [29], possibly due to the high labor and economic expectations associated with men in the Mexican context. SD IV shows that all codes indicating gender differences belonged to quotations from male students, while most quotations with a gender equity stance belonged to female students. On the other hand, Figure 3, which is presented below, contains Sankey Diagrams (SDs) representing the most interesting relationships between some of the created categories.
In Figure 3, the codes in SD I denoting negative interest/enjoyment were connected to attention, while the codes indicating positive interest/enjoyment were linked to motivation. A similar trend is observed in SD II, where motivation is connected with positive mathematical self-concept codes, whereas the students associate focus or the need to pay attention with the difficulty of mathematics. Both figures indicate that the attention required by mathematics is perceived negatively, impacting self-concept and the ability to enjoy the study of mathematics. From these diagrams, it can be inferred that motivation is linked to a high self-concept and positive feelings toward mathematics.
DS III demonstrates a link between the lack of interest or displeasure in mathematics and a low mathematical self-concept in the same way that interest and enjoyment of mathematics appear to be associated with a high mathematical self-concept. This trend was observed in the intervention, where it was also indicated that interest in mathematics seems to be defined by the mathematical self-concept and that a negative attitude toward mathematics partly stems from a lack of interest in this subject.
These results highlight the key role of certain elements of the affective domain, such as the mathematical self-concept and interest/enjoyment, in shaping students’ attitudes toward mathematics. Furthermore, they demonstrate that gender plays a role in determining self-perception, which reflects internalized stereotypes that individuals attribute to themselves and to their peers. Given this information, to answer the research question, “how are gender stereotypes associated with attitudes toward mathematics?”, it can be stated that this association is linked to the mathematical self-concept and interest/enjoyment of mathematics.
The secondary research question, “how is the affective domain of middle school students linked to their attitudes toward mathematics and their gender stereotypes?”, highlights the two previously mentioned elements, the mathematical self-concept and interest/enjoyment of mathematics, as the means through which the affective domain is connected to attitudes toward mathematics and gender stereotypes. Both concepts need to be further explored to develop strategies that improve attitudes toward mathematics in middle school students and increase the interest of students in STEM careers in the long term.

4. Conclusions and Lessons Learned

The conducted research presents findings open to discussion and examination that can be used to enhance the understanding of the field. The association between gender and gender stereotypes is a gray area as the test results we obtained did not indicate gender differences. However, discourse analysis revealed a connection between the stereotypes of the gender and people who work in STEM. Although there is evidence of the association between gender and the affective domain, this is primarily due to a lower mathematical self-concept and more negative feelings toward mathematics among female students. This supports the notion that self-concept and interest/enjoyment both influence attitudes toward mathematics. Having said this, Figure 4 illustrates the integration of these findings into a new model. This model connects gender stereotypes, the affective domain, and attitudes toward mathematics from a gender perspective.
In Figure 4, the elements of gender stereotypes are depicted within an orange circular frame, while the elements of the affective domain are contained in a blue circular frame. Additionally, the categories of motivation and areas of study are also separately included as they both emerged as separate factors influencing students’ perceptions toward STEM during the analysis. Solid lines represent direct associations, like the connection between gender stereotypes of people that work in STEM, the mathematical self-concept, and the perceived value/utility of mathematics. Conversely, the indirect association between gender stereotypes and the affective domain is represented with a dashed line. It positions the affective domain as a mediator between gender stereotypes and attitudes toward mathematics. Two elements are marked with stars, representing that they influence each other and students’ attitudes toward mathematics, and they are the most affected by motivation.
Particularly, the role of gender in the mathematical self-concept is highlighted since it negatively influences female students. Moreover, this element’s effects and is affected by interest/enjoyment, which stands out as the element with the greatest impact on students’ attitudes toward mathematics. Thus, a connection can be made between elements. It is reasoned that gender stereotypes influence the mathematical self-concept and subsequently affect interest/enjoyment, which can determine middle school students’ attitudes toward mathematics.
A secondary objective of this study was to analyze the effect of exposing the participating sample of students to videos of STEM professionals on their perspectives on gender equity and attitudes toward mathematics. No consistent differences were registered between the results of the pretest and the post-test, nor where there any indications of there being changes in students’ gender perspectives or their attitudes throughout the intervention. The available research [5,6,30,31] supports that attitudes toward STEM improve after exposing middle school students to STEM role models. Nevertheless, the efforts made in this study shed light on understanding that the link between attitudes and role models depends on additional factors; this provides insights for future studies that will be carried out in this field.
On the other hand, this study’s main limitations revolved around its population size, the size of the intervention sample, and the duration of the intervention itself. It would be valuable to conduct an intervention with a larger sample since the variation between the tests could be attributed to the reduced sample size, which can be observed by looking at the standard deviations obtained in the Results section. For future studies, we also suggest researchers to employ instruments that offer more analytical depth, such as employing focus groups or conducting interviews. These suggestions are particularly important to consider when analyzing sensitive topics, such as gender stereotypes.
This study reveals clear trends and uncovers associations that warrant further exploration to enhance this study’s findings. After unraveling the importance of the self-concept and its gender-related differences, it is valuable to consider investigating how the development of the mathematic self-concept is influenced by the social dimension of middle school students in Mexico. Additionally, an examination into the link between the mathematical self-concept and interest/enjoyment can inform educational models and practices. Another aspect important to cover would be to delve deeper into the specific type of exposure to STEM professionals that would have the most positive impact on middle school students’ attitudes toward mathematics. Furthermore, we propose researchers to investigate the impacts of the awareness of gender stereotypes on their endorsement and their potential effects on mathematical self-perception.
Gender stereotypes plague students’ traditional learning experience, particularly in a context, like Mexico’s, which still holds gender-biased beliefs at its core. Such beliefs tend to limit one’s opportunities and should be challenged. Hopefully, this study’s findings become a tool for researchers and educators for paving the way for female empowerment in their search for equal representations and conditions of equity in all learning and professional environments, particularly in STEM fields.

Author Contributions

Conceptualization, M.G.-A. and S.T.; methodology, M.G.-A. and S.T.; software, M.G.-A.; validation, S.T.; formal analysis, M.G.-A.; investigation, M.G.-A.; resources, not applicable; data curation, M.G.-A.; writing—original draft preparation, M.G.-A.; writing—review and editing, S.T.; visualization, M.G.-A. and S.T.; supervision, S.T.; project administration, S.T.; funding acquisition, not applicable. All authors have read and agreed to the published version of the manuscript.

Funding

This research received no external funding.

Institutional Review Board Statement

This study was reviewed by the Institutional Research Ethics Committee of Tecnológico de Monterrey on 9 May 2024 (with the tracking code CO-EHE-2404-01) agreeing that since it poses no risk, it is not necessary to require an ethical approval.

Informed Consent Statement

Informed consent was obtained from all subjects involved in this study. Written informed consent was obtained from the parents and tutors of the students involved in this study to publish this paper.

Data Availability Statement

Due to the nature of this study, it is not possible to share further data, mainly since the involved students are underage.

Acknowledgments

The authors acknowledge the technical support of the Writing Lab, Institute for the Future of Education, Tecnológico de Monterrey, Mexico, in the production of this work.

Conflicts of Interest

The authors declare no conflicts of interest.

Appendix A

Figure A1 shows the images used in the pretest and post-test. Both are part of the public domain since they have a CC0 1.0 DEED license, which allows for their free use, modification, and distribution.
Figure A1. Images included in the pretest and post-test. Picture (A) has a man looking at his computer’s screen while using his phone as if working. Picture (B) has a woman who is looking at her computer’s screen and has both hands placed on it as if working.
Education 14 00594 g0a1

Appendix B

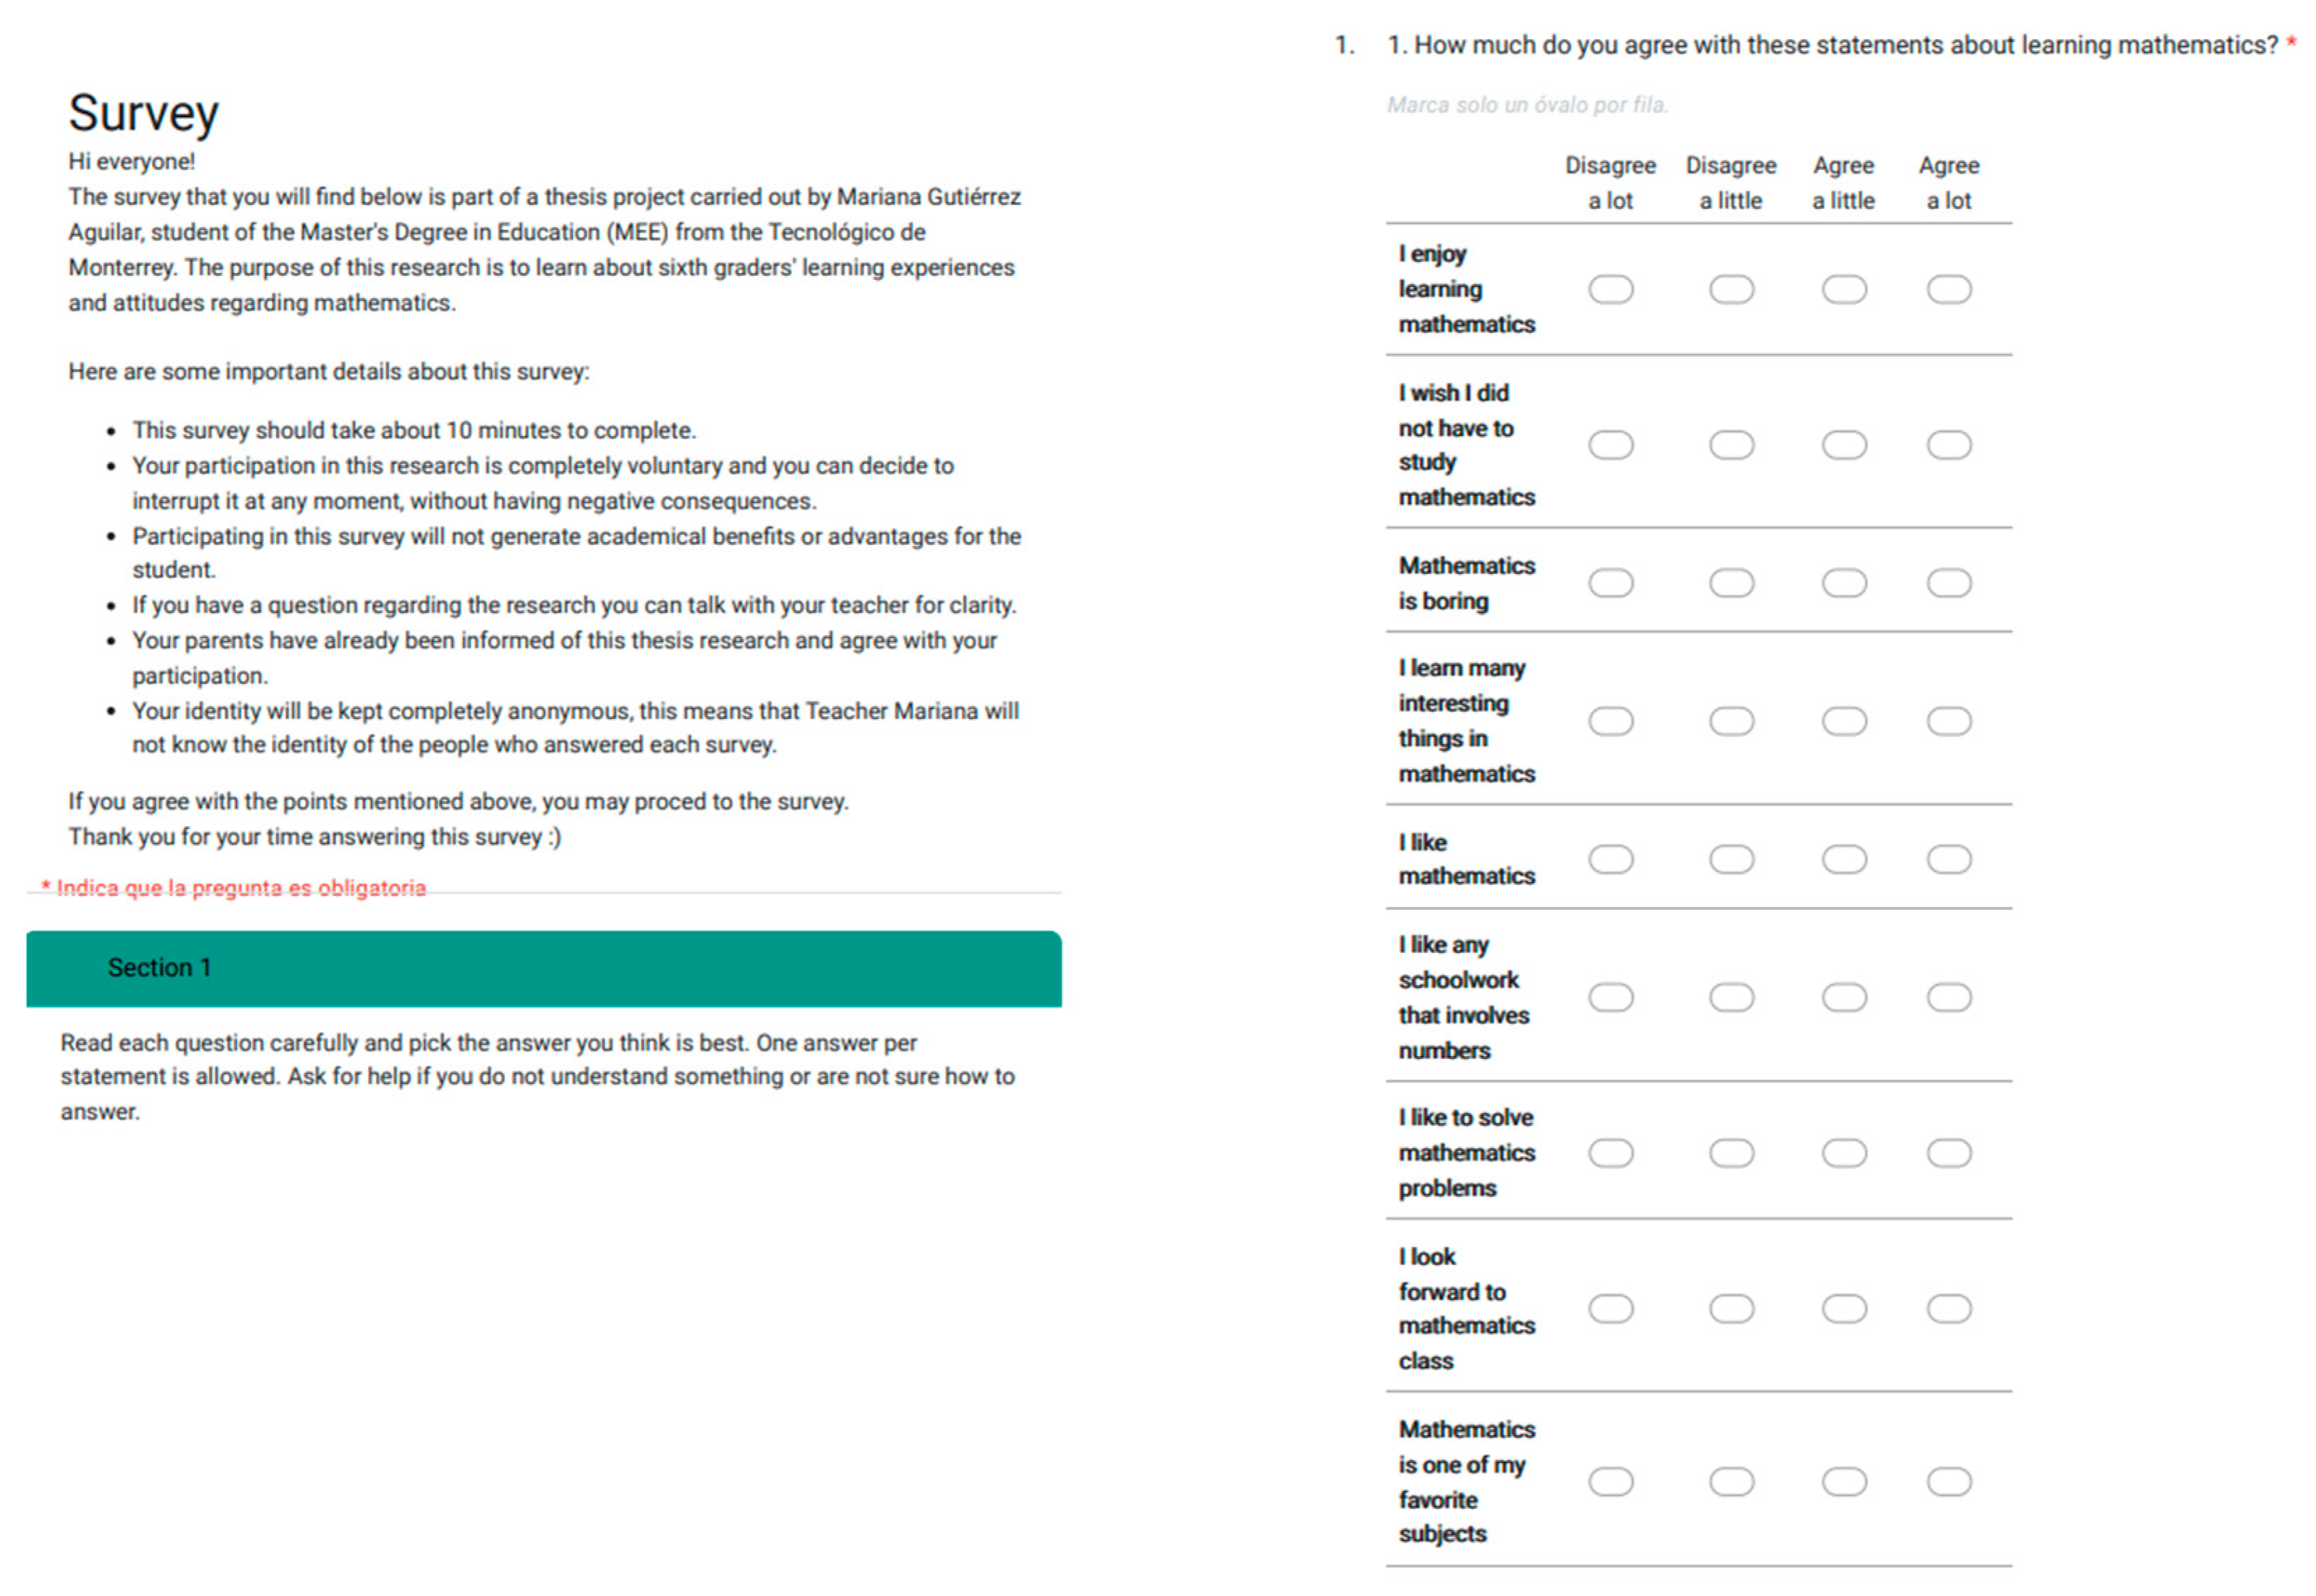
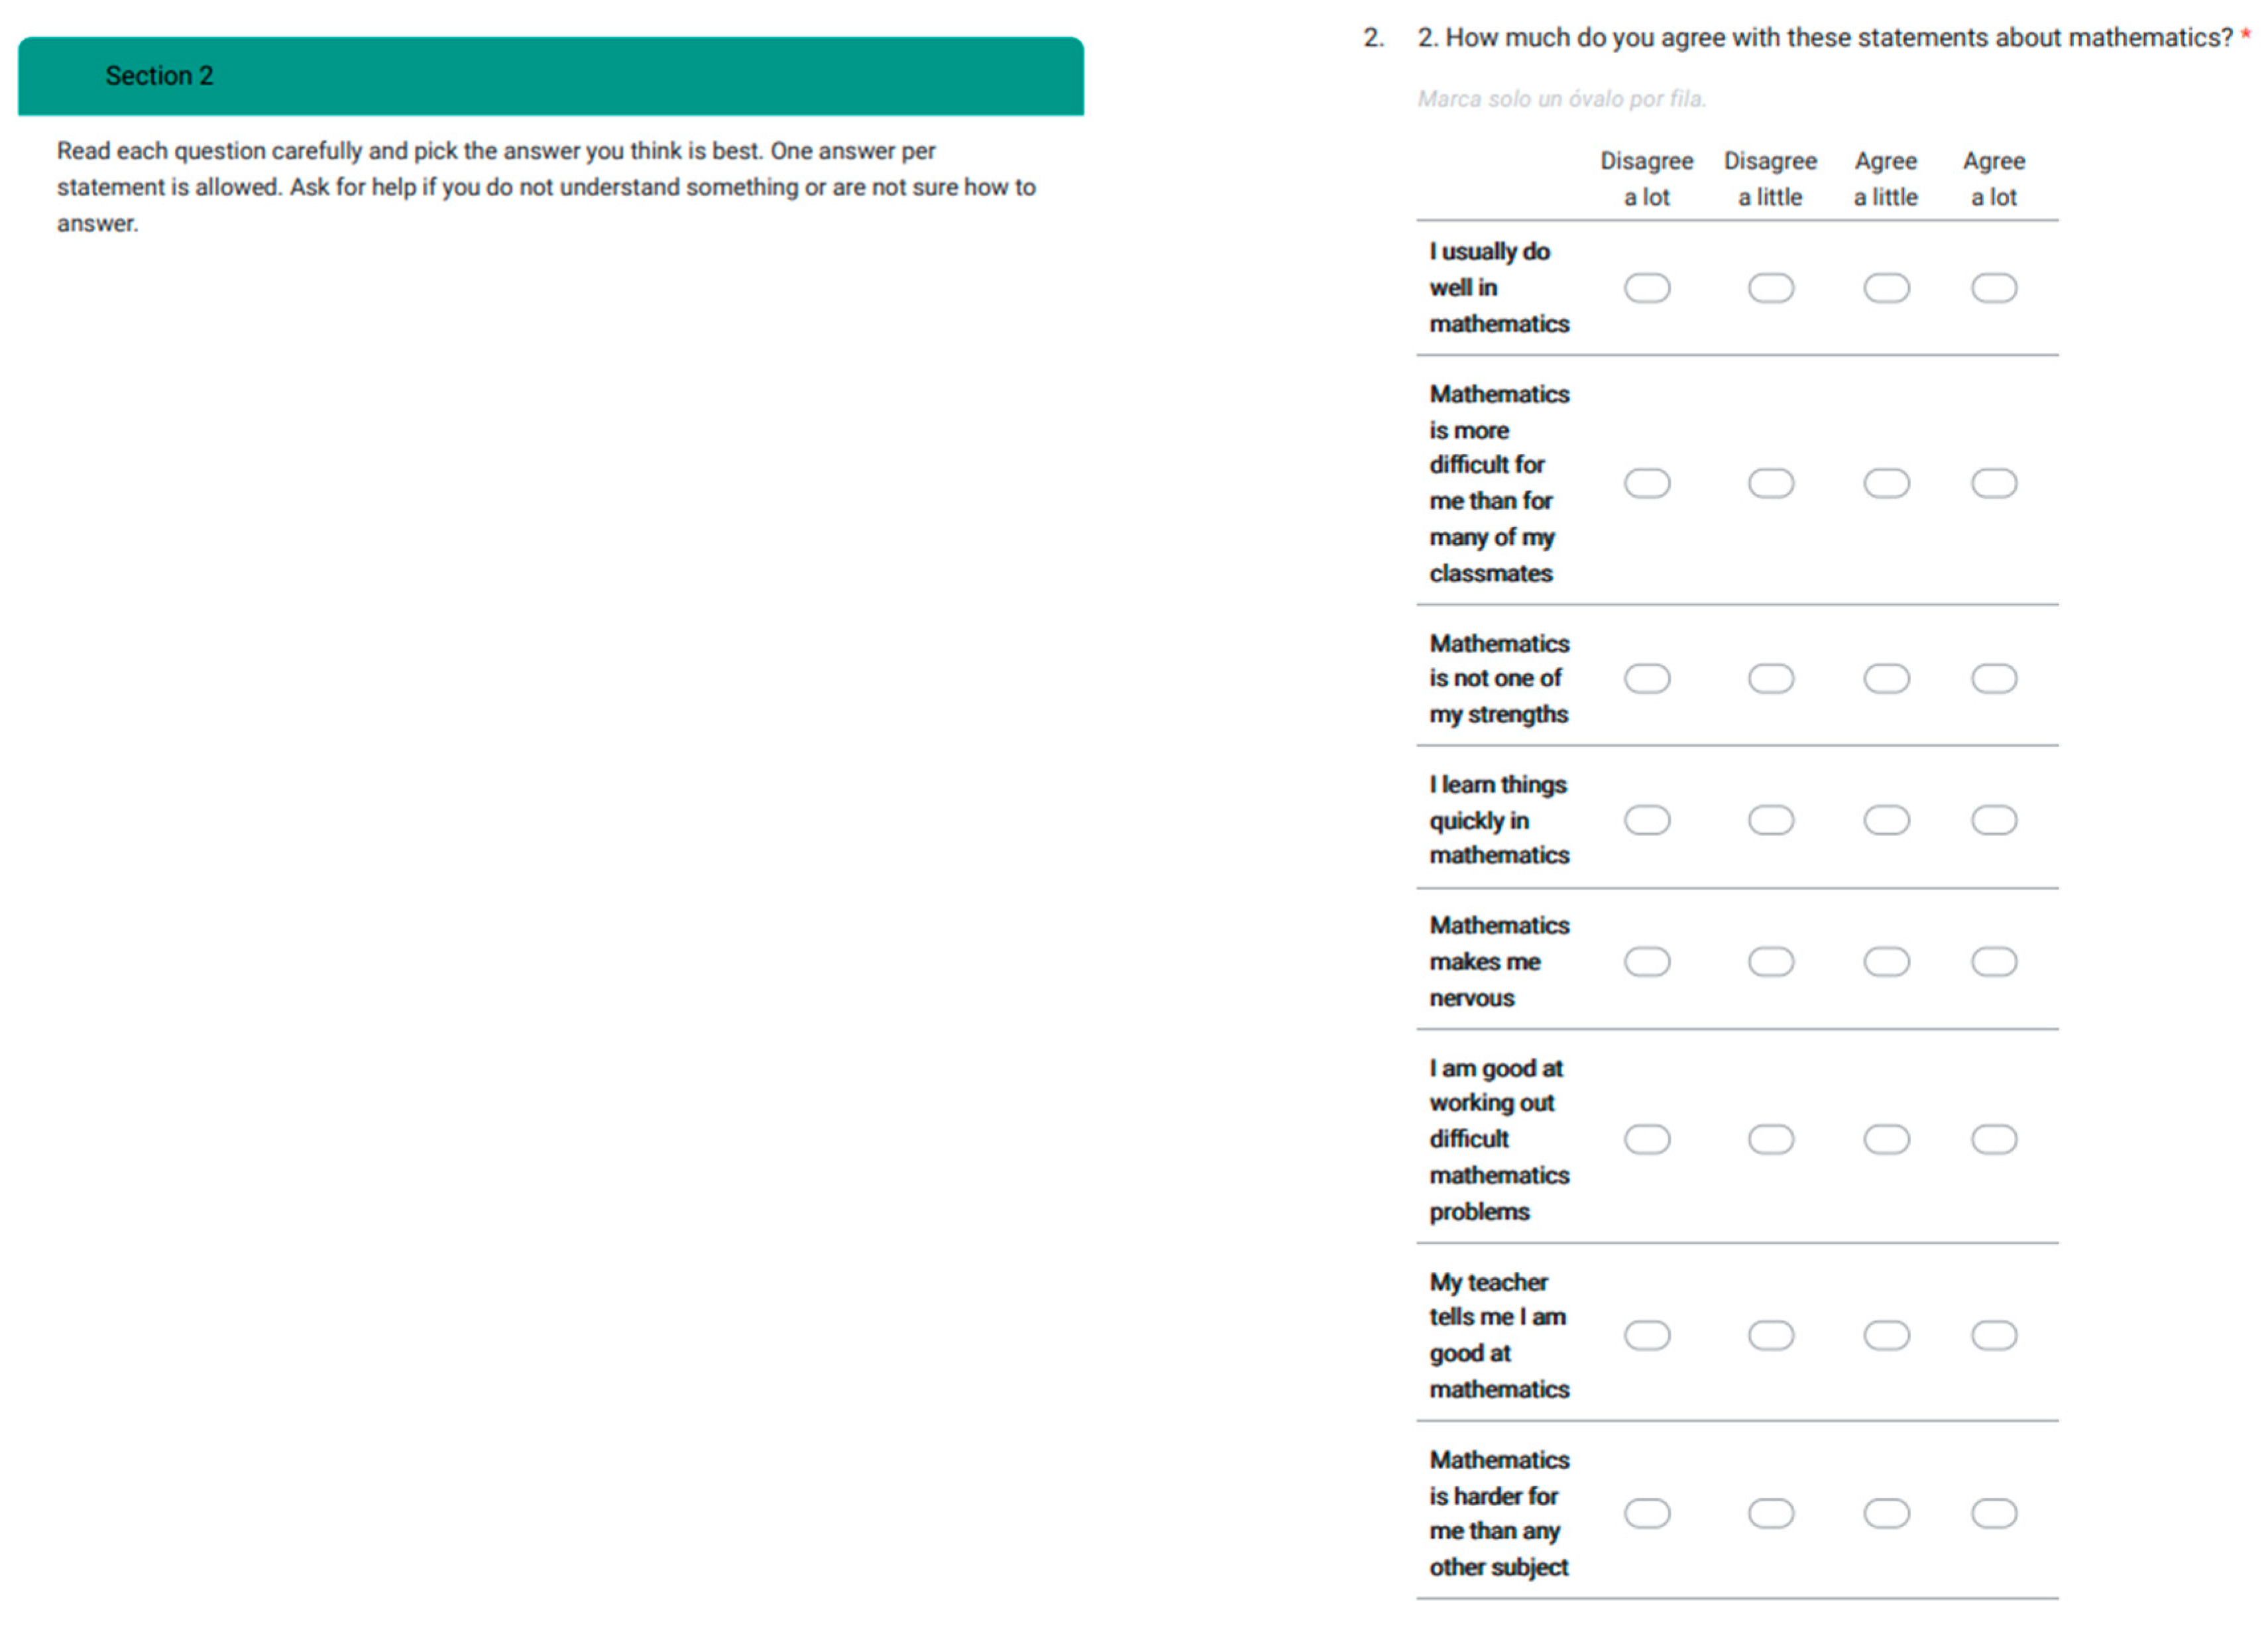
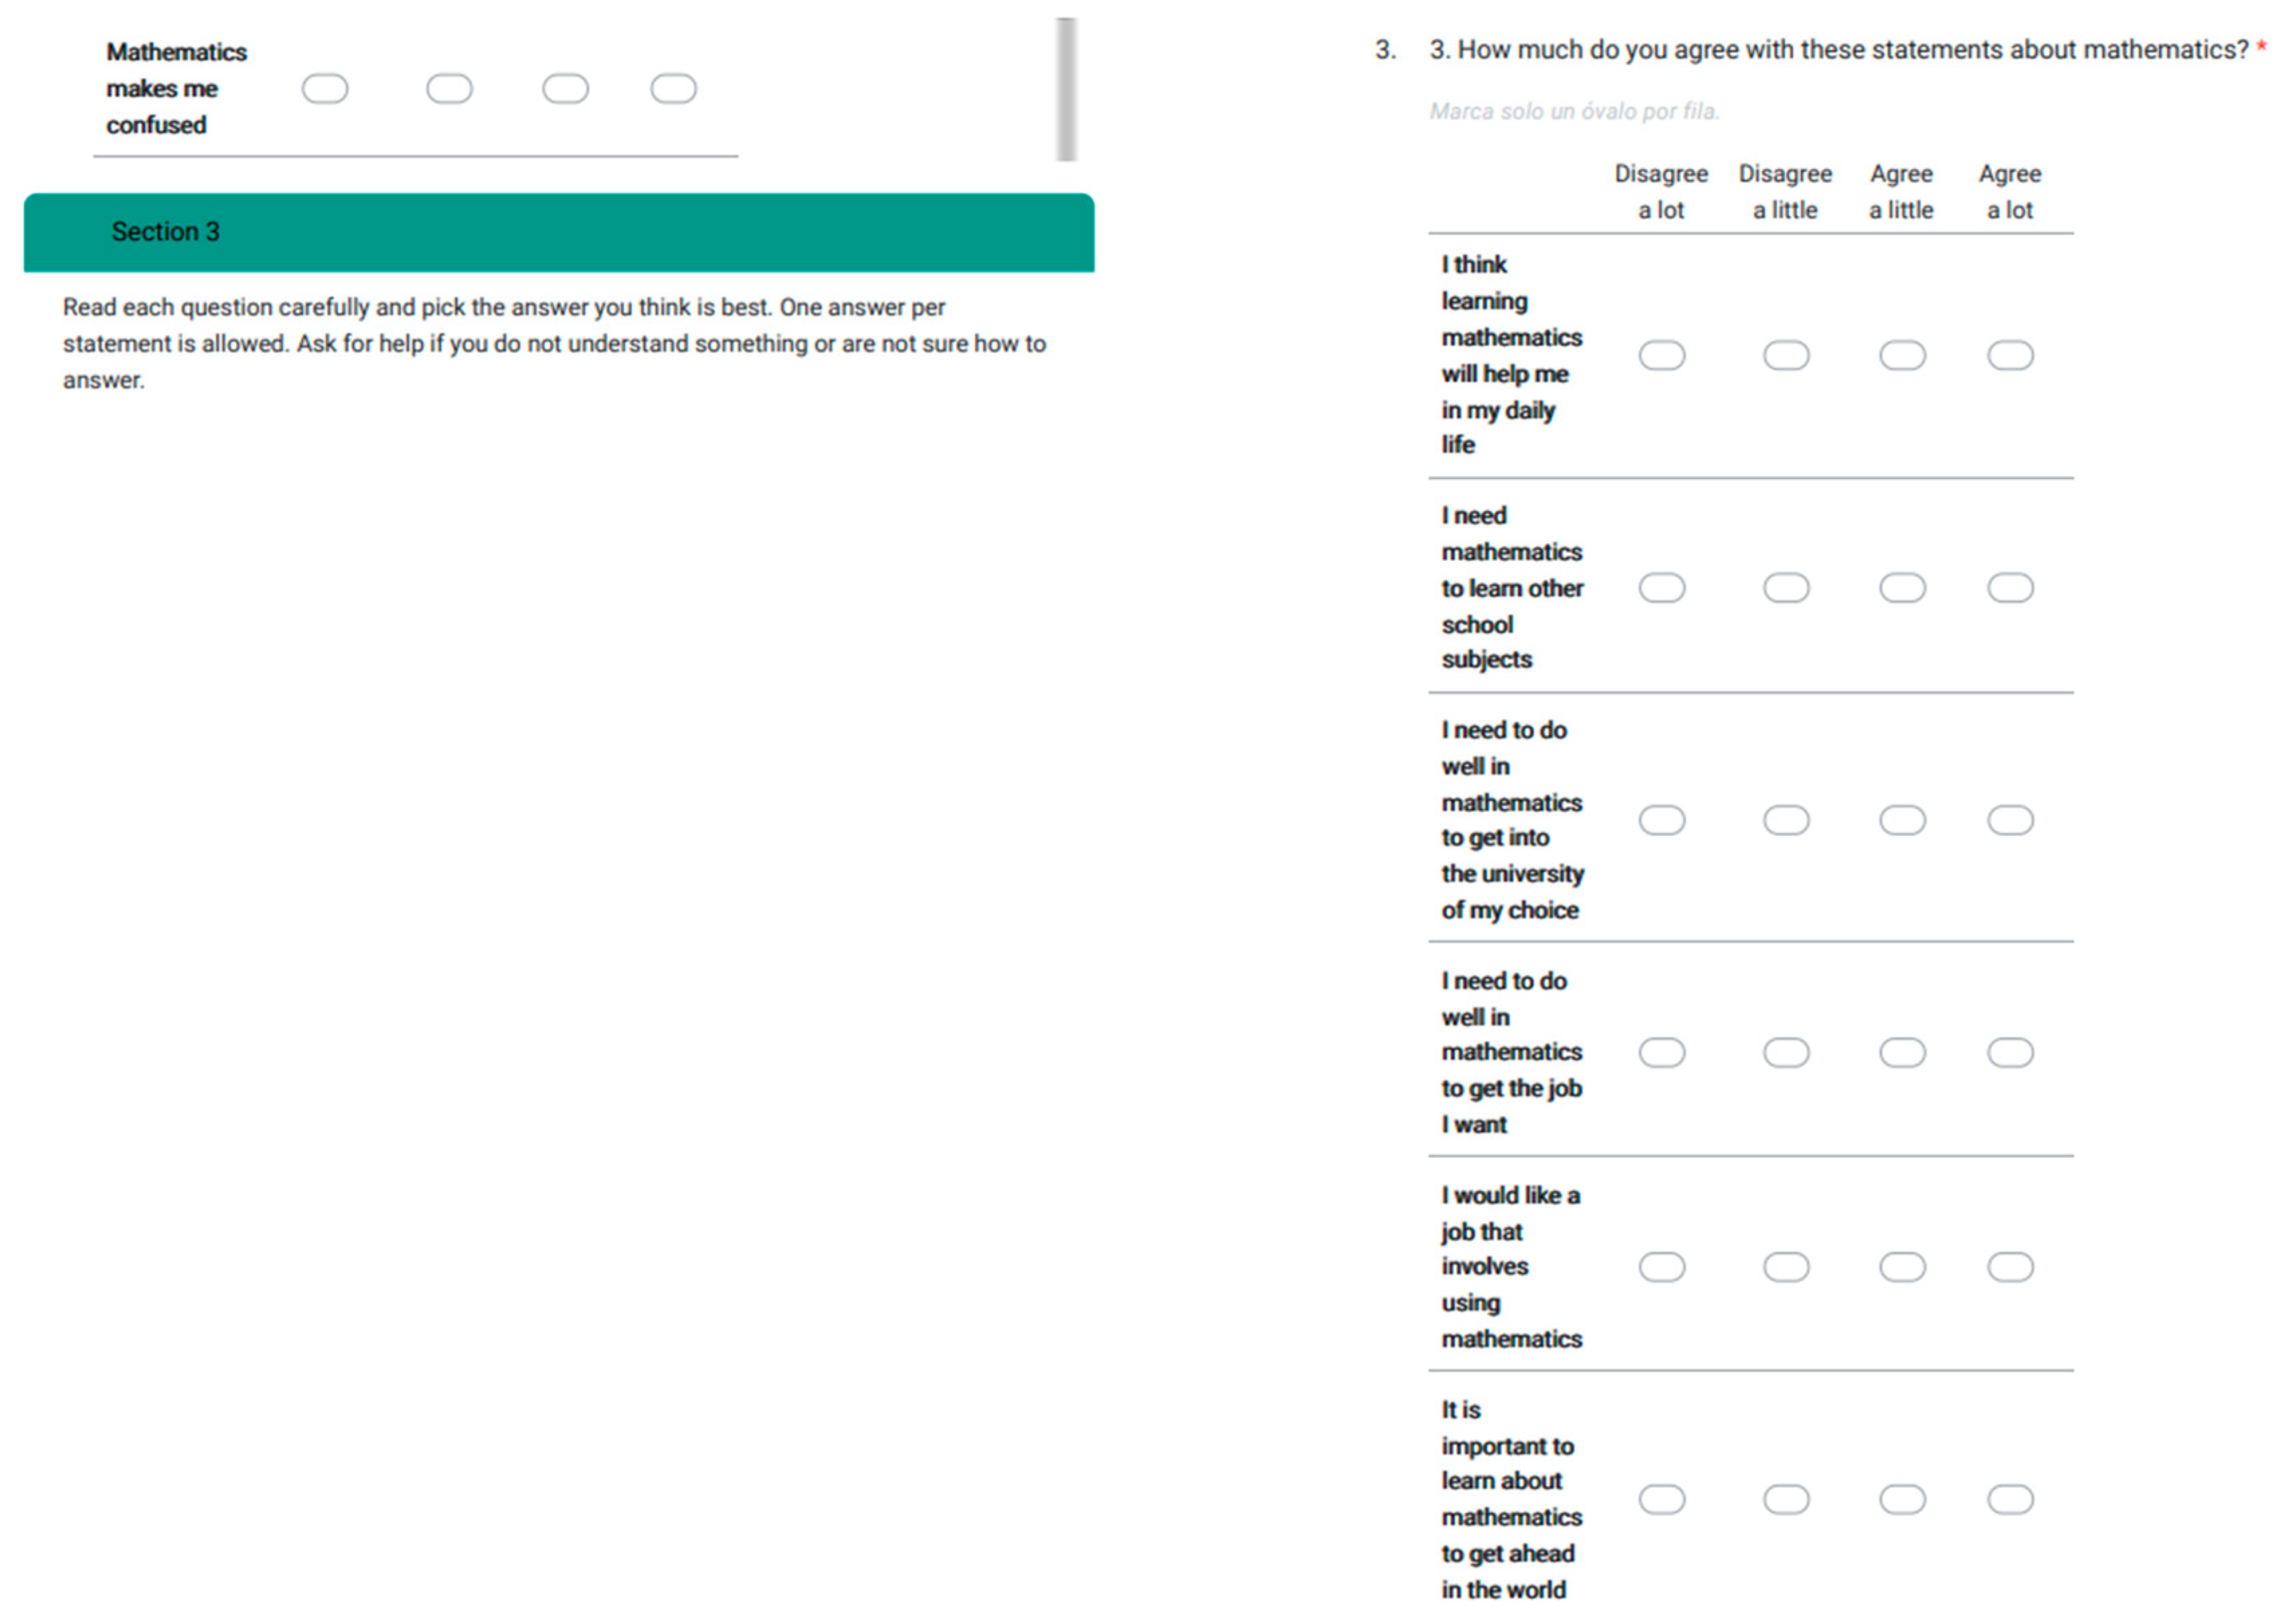
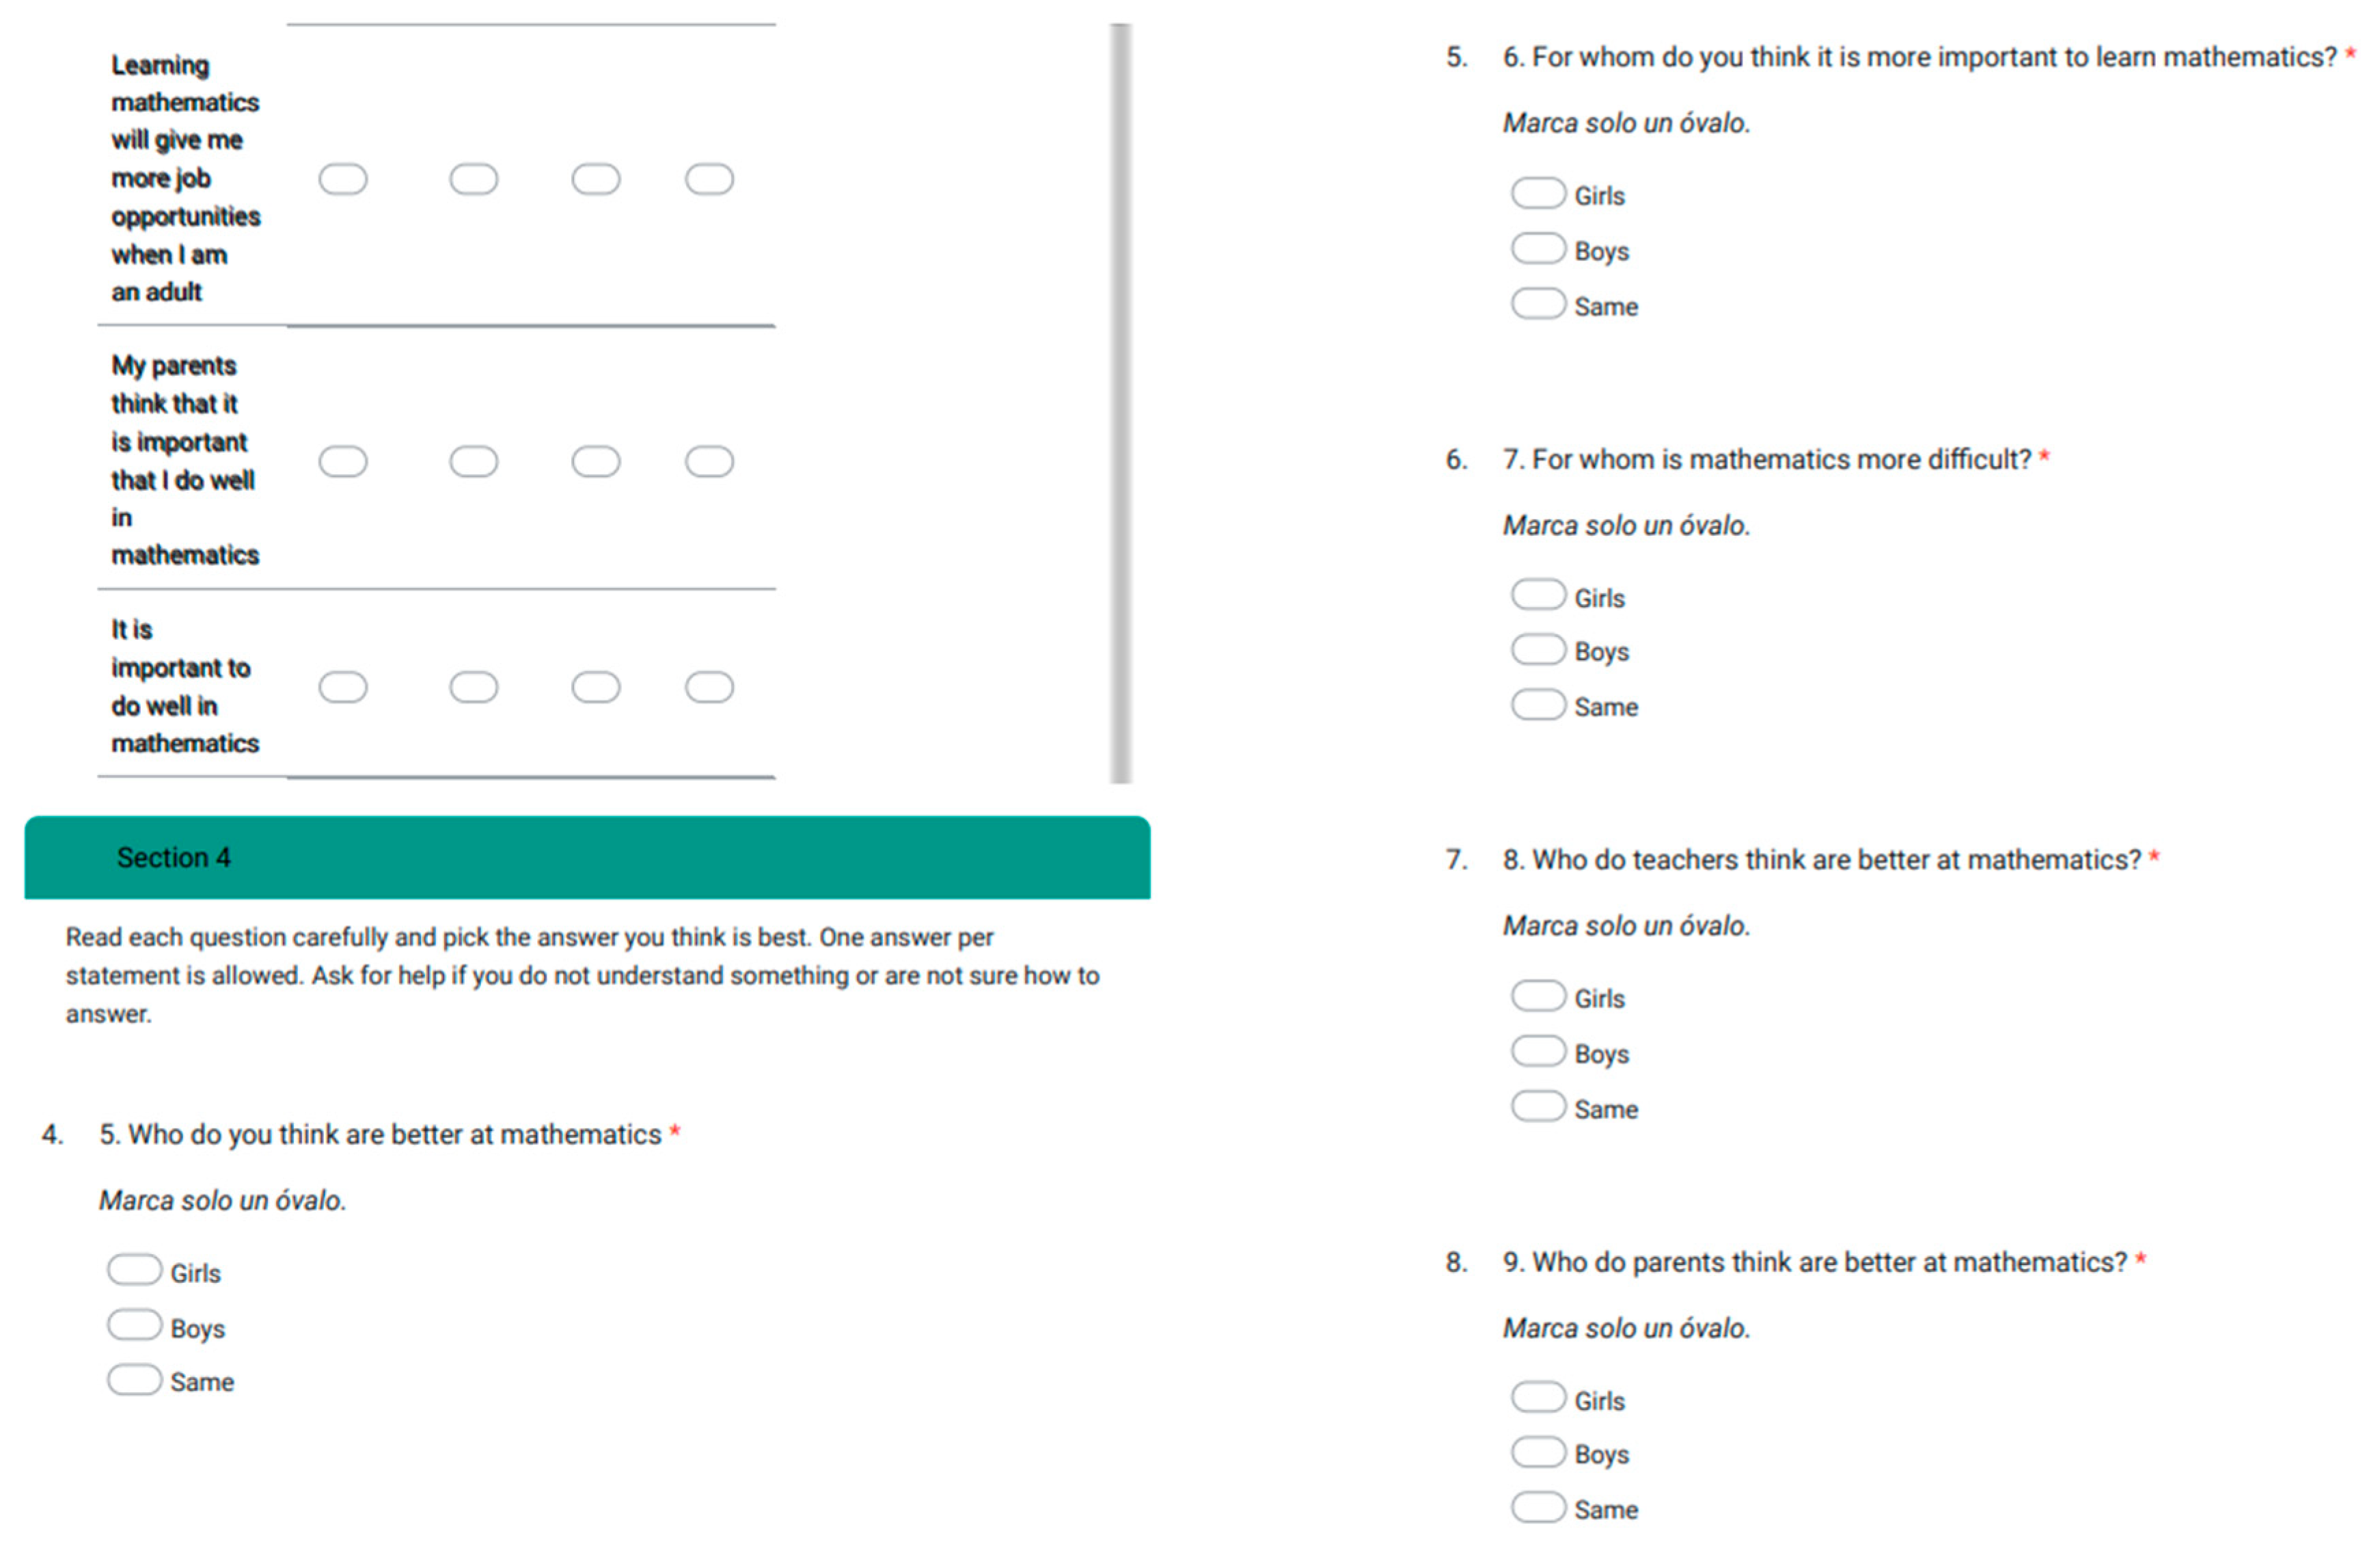
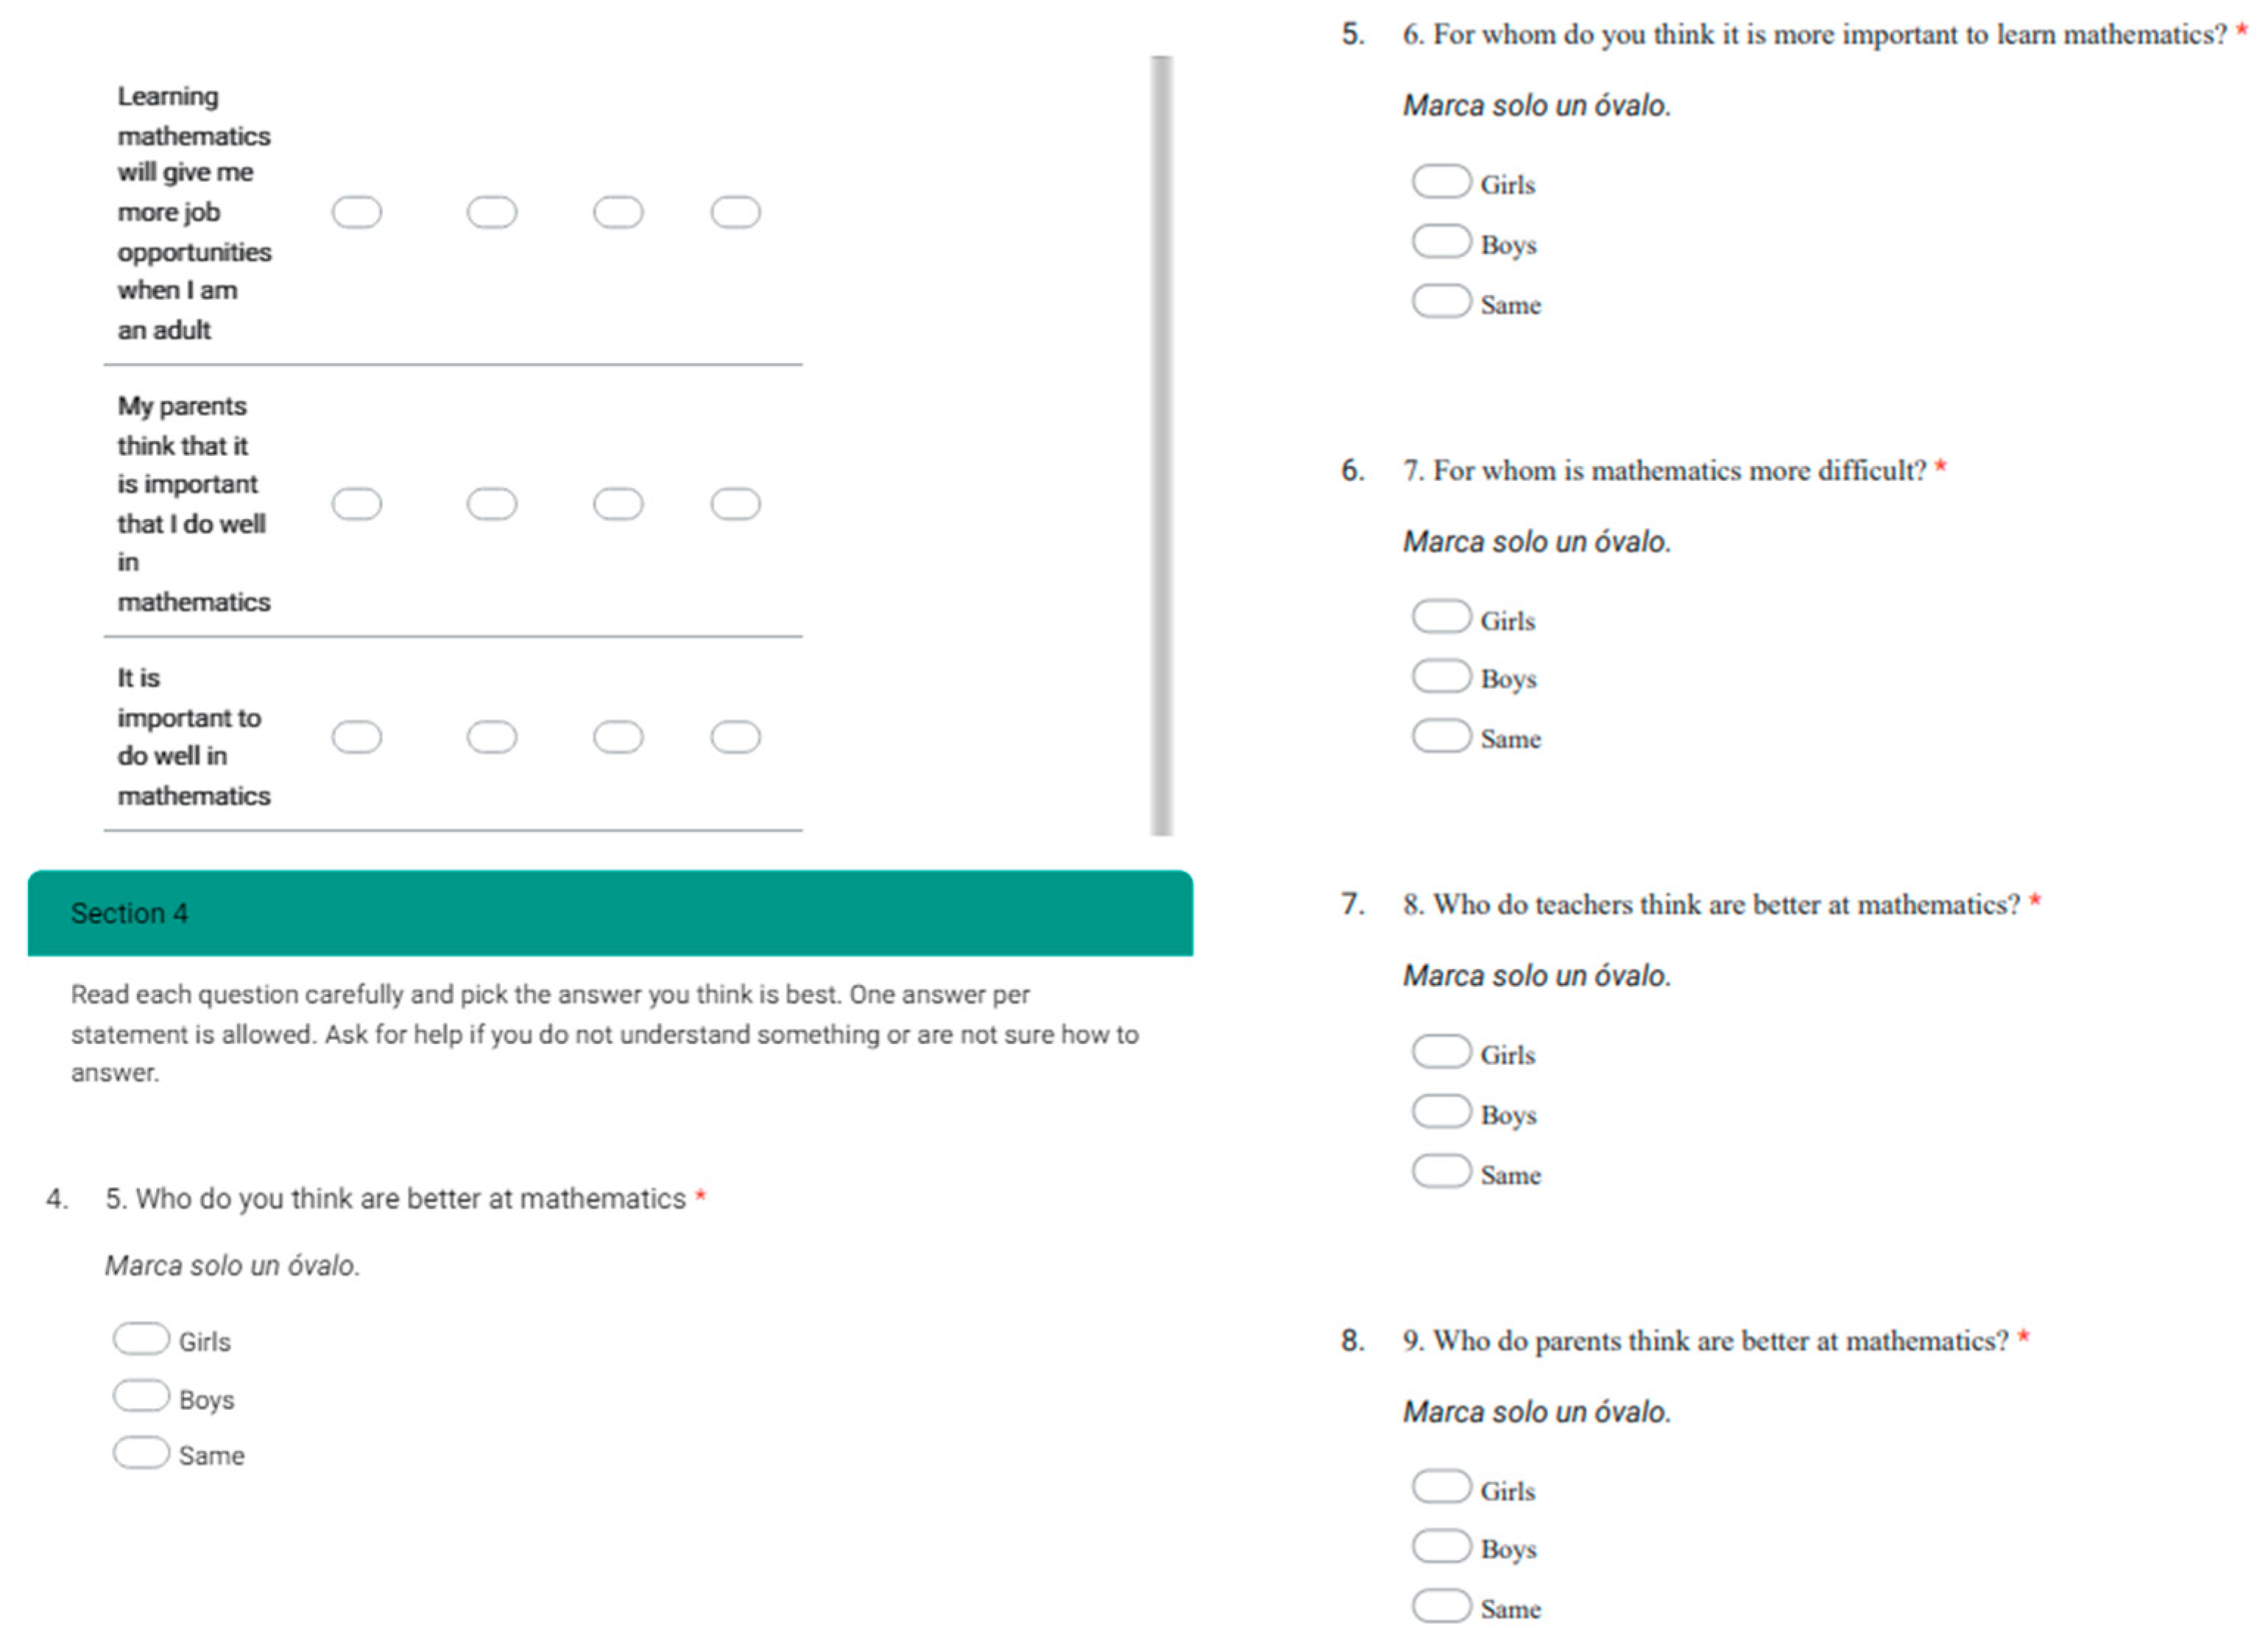
The following figures (Figure A2, Figure A3, Figure A4, Figure A5 and Figure A6) show each section of the pretest in the form that it was shared digitally with the participants through Google Forms.
Figure A2. Instructions and Section 1 of the pretest.
Education 14 00594 g0a2
Figure A3. Section 2 of the pretest.
Education 14 00594 g0a3
Figure A4. Continuation of Sections 2 and 3 of the pretest.
Education 14 00594 g0a4
Figure A5. Continuation of Sections 3 and 4 of the pretest.
Education 14 00594 g0a5
Figure A6. Continuation of Sections 4 and 5 (background information) of the pretest.
Education 14 00594 g0a6

Appendix C

During the intervention, responses were collected using Nearpod. The following figures (Figure A7, Figure A8 and Figure A9) are part of results obtained during the second day of the intervention. They are provided as an example of the instrument used and the format through which answers were collected.
Figure A7. The first two slides that were presented to participants to introduce an activity and a reproduction of one of the videos.
Education 14 00594 g0a7
Figure A8. The collected answers for the first question.
Education 14 00594 g0a8
Figure A9. The collected answers for the second question.
Education 14 00594 g0a9

Appendix D

The following figures (Figure A10, Figure A11, Figure A12, Figure A13 and Figure A14) show each section of the post-test in the form that it was shared digitally with the participants through Google Forms.
Figure A10. Instructions and Section 1 of the post-test.
Education 14 00594 g0a10
Figure A11. Section 2 of the post-test.
Education 14 00594 g0a11
Figure A12. Continuation of Sections 2 and 3 of the post-test.
Education 14 00594 g0a12
Figure A13. Continuation of Sections 3 and 4 of the post-test.
Education 14 00594 g0a13
Figure A14. Continuation of Section 4, Section 5 (open question), and Section 6 (background information) of the post-test.
Education 14 00594 g0a14

References

  1. Galende, N.; Arrivillaga, A.R.; Madariaga, J.M. Attitudes towards Mathematics in Secondary School Students. Personal and Family Factors. Cult. Educ. 2020, 32, 529–555. [Google Scholar] [CrossRef]
  2. Christensen, R.; Knezek, G. Indicators of Middle School Students’ Mathematics Enjoyment and Confidence. Sch. Sci. Math. 2020, 120, 491–503. [Google Scholar] [CrossRef]
  3. Amemiya, J.; Wang, M. Transactional Relations between Motivational Beliefs and Help Seeking from Teachers and Peers across Adolescence. J. Youth Adolesc. 2017, 46, 1743–1757. [Google Scholar] [CrossRef]
  4. Dare, E.A.; Roehrig, G.H. “If I Had to Do It, Then I Would”: Understanding Early Middle School Students’ Perceptions of Physics and Physics-Related Careers by Gender. Phys. Rev. Phys. Educ. Res. 2016, 12, 020117. [Google Scholar] [CrossRef]
  5. Steinke, J.; Applegate, B.; Penny, J.R.; Merlino, S. Effects of Diverse STEM Role Model Videos in Promoting Adolescents’ Identification. Int. J. Sci. Math. Educ. 2022, 20, 255–276. [Google Scholar] [CrossRef]
  6. Bond, B.J. Fairy Godmothers > Robots. Bull. Sci. Technol. Soc. 2016, 36, 91–97. [Google Scholar] [CrossRef]
  7. Dominguez, A.; Tejeda, S.; Ruiz, B. Influencing Factors to Choose STEM Areas: The Case of Strongly STEM-Oriented High School Students. In Proceedings of the 2020 IEEE Integrated STEM Education Conference (ISEC), Princeton, NJ, USA, 1 August 2020. [Google Scholar] [CrossRef]
  8. González-Jiménez, R.M. Evaluation of Training Strategies to Improve Attitudes towards Mathematics in Secondary. Educ. Mat. 2019, 31, 176–203. [Google Scholar] [CrossRef]
  9. Ursini, S.; Ramírez Mercado, M. Equidad, Género y Matemáticas En La Escuela Mexicana. Rev. Colomb. Educ. 2017, 211, 213–233. [Google Scholar] [CrossRef]
  10. Ergün, A. Identification of the Interest of Turkish Middle-School Students in Stem Careers: Gender and Grade Level Differences. J. Balt. Sci. Educ. 2019, 18, 90–104. [Google Scholar] [CrossRef]
  11. Riegle-Crumb, C.; Morton, K.; Nguyen, U.; Dasgupta, N. Inquiry-Based Instruction in Science and Mathematics in Middle School Classrooms: Examining Its Association With Students’ Attitudes by Gender and Race/Ethnicity. AERA Open 2019, 5, 1–17. [Google Scholar] [CrossRef]
  12. Aikman, S.; Halai, A.; Rubagiza, J. Conceptualising Gender Equality in Research on Education Quality. Comp. Educ. 2011, 47, 45–60. [Google Scholar] [CrossRef]
  13. Chan, R.C.H. A Social Cognitive Perspective on Gender Disparities in Self-Efficacy, Interest, and Aspirations in Science, Technology, Engineering, and Mathematics (STEM): The Influence of Cultural and Gender Norms. Int. J. STEM Educ. 2022, 9, 37. [Google Scholar] [CrossRef]
  14. Levy, H.E.; Fares, L.; Rubinsten, O. Math Anxiety Affects Females’ Vocational Interests. J. Exp. Child Psychol. 2021, 210, 105214. [Google Scholar] [CrossRef] [PubMed]
  15. Kaur, T.; McLoughlin, E.; Grimes, P. Mathematics and Science across the Transition from Primary to Secondary School: A Systematic Literature Review. Int. J. STEM Educ. 2022, 9, 13. [Google Scholar] [CrossRef]
  16. O’Rourke, I.; Prendergast, M. Mathematics as a Gendered Subject: A Deeper Insight into Students’ Attitudes in Irish Post-Primary Schools. Ir. Educ. Stud. 2021, 40, 627–646. [Google Scholar] [CrossRef]
  17. International Association for the Evaluation of Educational Achievement (IEA). Student Questionnaire, Grade 8: Trends in International Mathematics and Science Study; IEA: Boston, MA, USA, 2018. Available online: https://nces.ed.gov/timss/pdf/T19_GR8_StudentQ_USA_Questionnaire.pdf (accessed on 14 April 2023).
  18. Forgasz, H.; Markovits, Z. Elementary Students’ Views on the Gendering of Mathematics. Eur. J. Educ. Res. 2018, 7, 867–876. [Google Scholar] [CrossRef]
  19. Hernández-Sampieri, R.; Mendoza Torres, C.P. Metodología De La Investigación—Las Rutas Cuantitativa, Cualitativa y Mixta, 7th ed.; McGraw-Hill Intereamericana Editores: Ciudad de México, Mexico, 2018. [Google Scholar]
  20. Taylor, S.; Bogdan, R. Introducción a Los Métodos Cualitativos de Investigación, 2nd ed.; Paidós: Buenos Aires, Argentina, 1994; ISBN 84-7509-816-9. [Google Scholar]
  21. Ikkatai, Y.; Inoue, A.; Minamizaki, A.; Kano, K.; McKay, E.; Yokoyama, H.M. Effect of Providing Gender Equality Information on Students’ Motivations to Choose STEM. PLoS ONE 2021, 16, e0252710. [Google Scholar] [CrossRef] [PubMed]
  22. Flore, P.C.; Wicherts, J.M. Does Stereotype Threat Influence Performance of Girls in Stereotyped Domains? A Meta-Analysis. J. Sch. Psychol. 2015, 53, 25–44. [Google Scholar] [CrossRef] [PubMed]
  23. Master, A. Gender Stereotypes Influence Children’s STEM Motivation. Child Dev. Perspect. 2021, 15, 203–210. [Google Scholar] [CrossRef]
  24. Cohen, S.M.; Hazari, Z.; Mahadeo, J.; Sonnert, G.; Sadler, P.M. Examining the Effect of Early STEM Experiences as a Form of STEM Capital and Identity Capital on STEM Identity: A Gender Study. Sci. Educ. 2021, 105, 1126–1150. [Google Scholar] [CrossRef]
  25. García-Holgado, A.; Verdugo-Castro, S.; Dominguez, A.; Hernández-Armenta, I.; García-Peñalvo, F.J.; Vázquez-Ingelmo, A.; Sánchez-Gómez, M.C. The Experience of Women Students in Engineering and Mathematics Careers: A Focus Group Study. In Proceedings of the 2021 IEEE Global Engineering Education Conference, Vienna, Austria, 21–23 April 2021; pp. 50–56. [Google Scholar]
  26. Mendoza Cazarez, D.C. Exploring Influences on the Choice of Fields of Study in Higher Education: Evidence from Mexico. Int. J. Educ. Dev. 2022, 93, 102643. [Google Scholar] [CrossRef]
  27. Wieselmann, J.R.; Dare, E.A.; Ring-Whalen, E.A.; Roehrig, G.H. “I Just Do What the Boys Tell Me”: Exploring Small Group Student Interactions in an Integrated STEM Unit. J. Res. Sci. Teach. 2020, 57, 112–144. [Google Scholar] [CrossRef]
  28. Klee, H.L.; Miller, A.D.; Buehl, M.M. Mathematics Anxiety, Self-Concept, and Self-Efficacy: A Multidimensional Scaling Consideration of Measures. J. Exp. Educ. 2022, 91, 494–516. [Google Scholar] [CrossRef]
  29. Sáinz, M.; Fàbregues, S.; Rodó-de-Zárate, M.; Martínez-Cantos, J.L.; Arroyo, L.; Romano, M.J. Gendered Motivations to Pursue Male-Dominated STEM Careers Among Spanish Young People: A Qualitative Study. J. Career Dev. 2020, 47, 408–423. [Google Scholar] [CrossRef]
  30. Cheryan, S.; Plaut, V.C.; Handron, C.; Hudson, L. The Stereotypical Computer Scientist: Gendered Media Representations as a Barrier to Inclusion for Women. Sex Roles 2013, 69, 58–71. [Google Scholar] [CrossRef]
  31. Gladstone, J.R.; Cimpian, A. Which Role Models Are Effective for Which Students? A Systematic Review and Four Recommendations for Maximizing the Effectiveness of Role Models in STEM. Int. J. STEM Educ. 2021, 8, 59. [Google Scholar] [CrossRef]
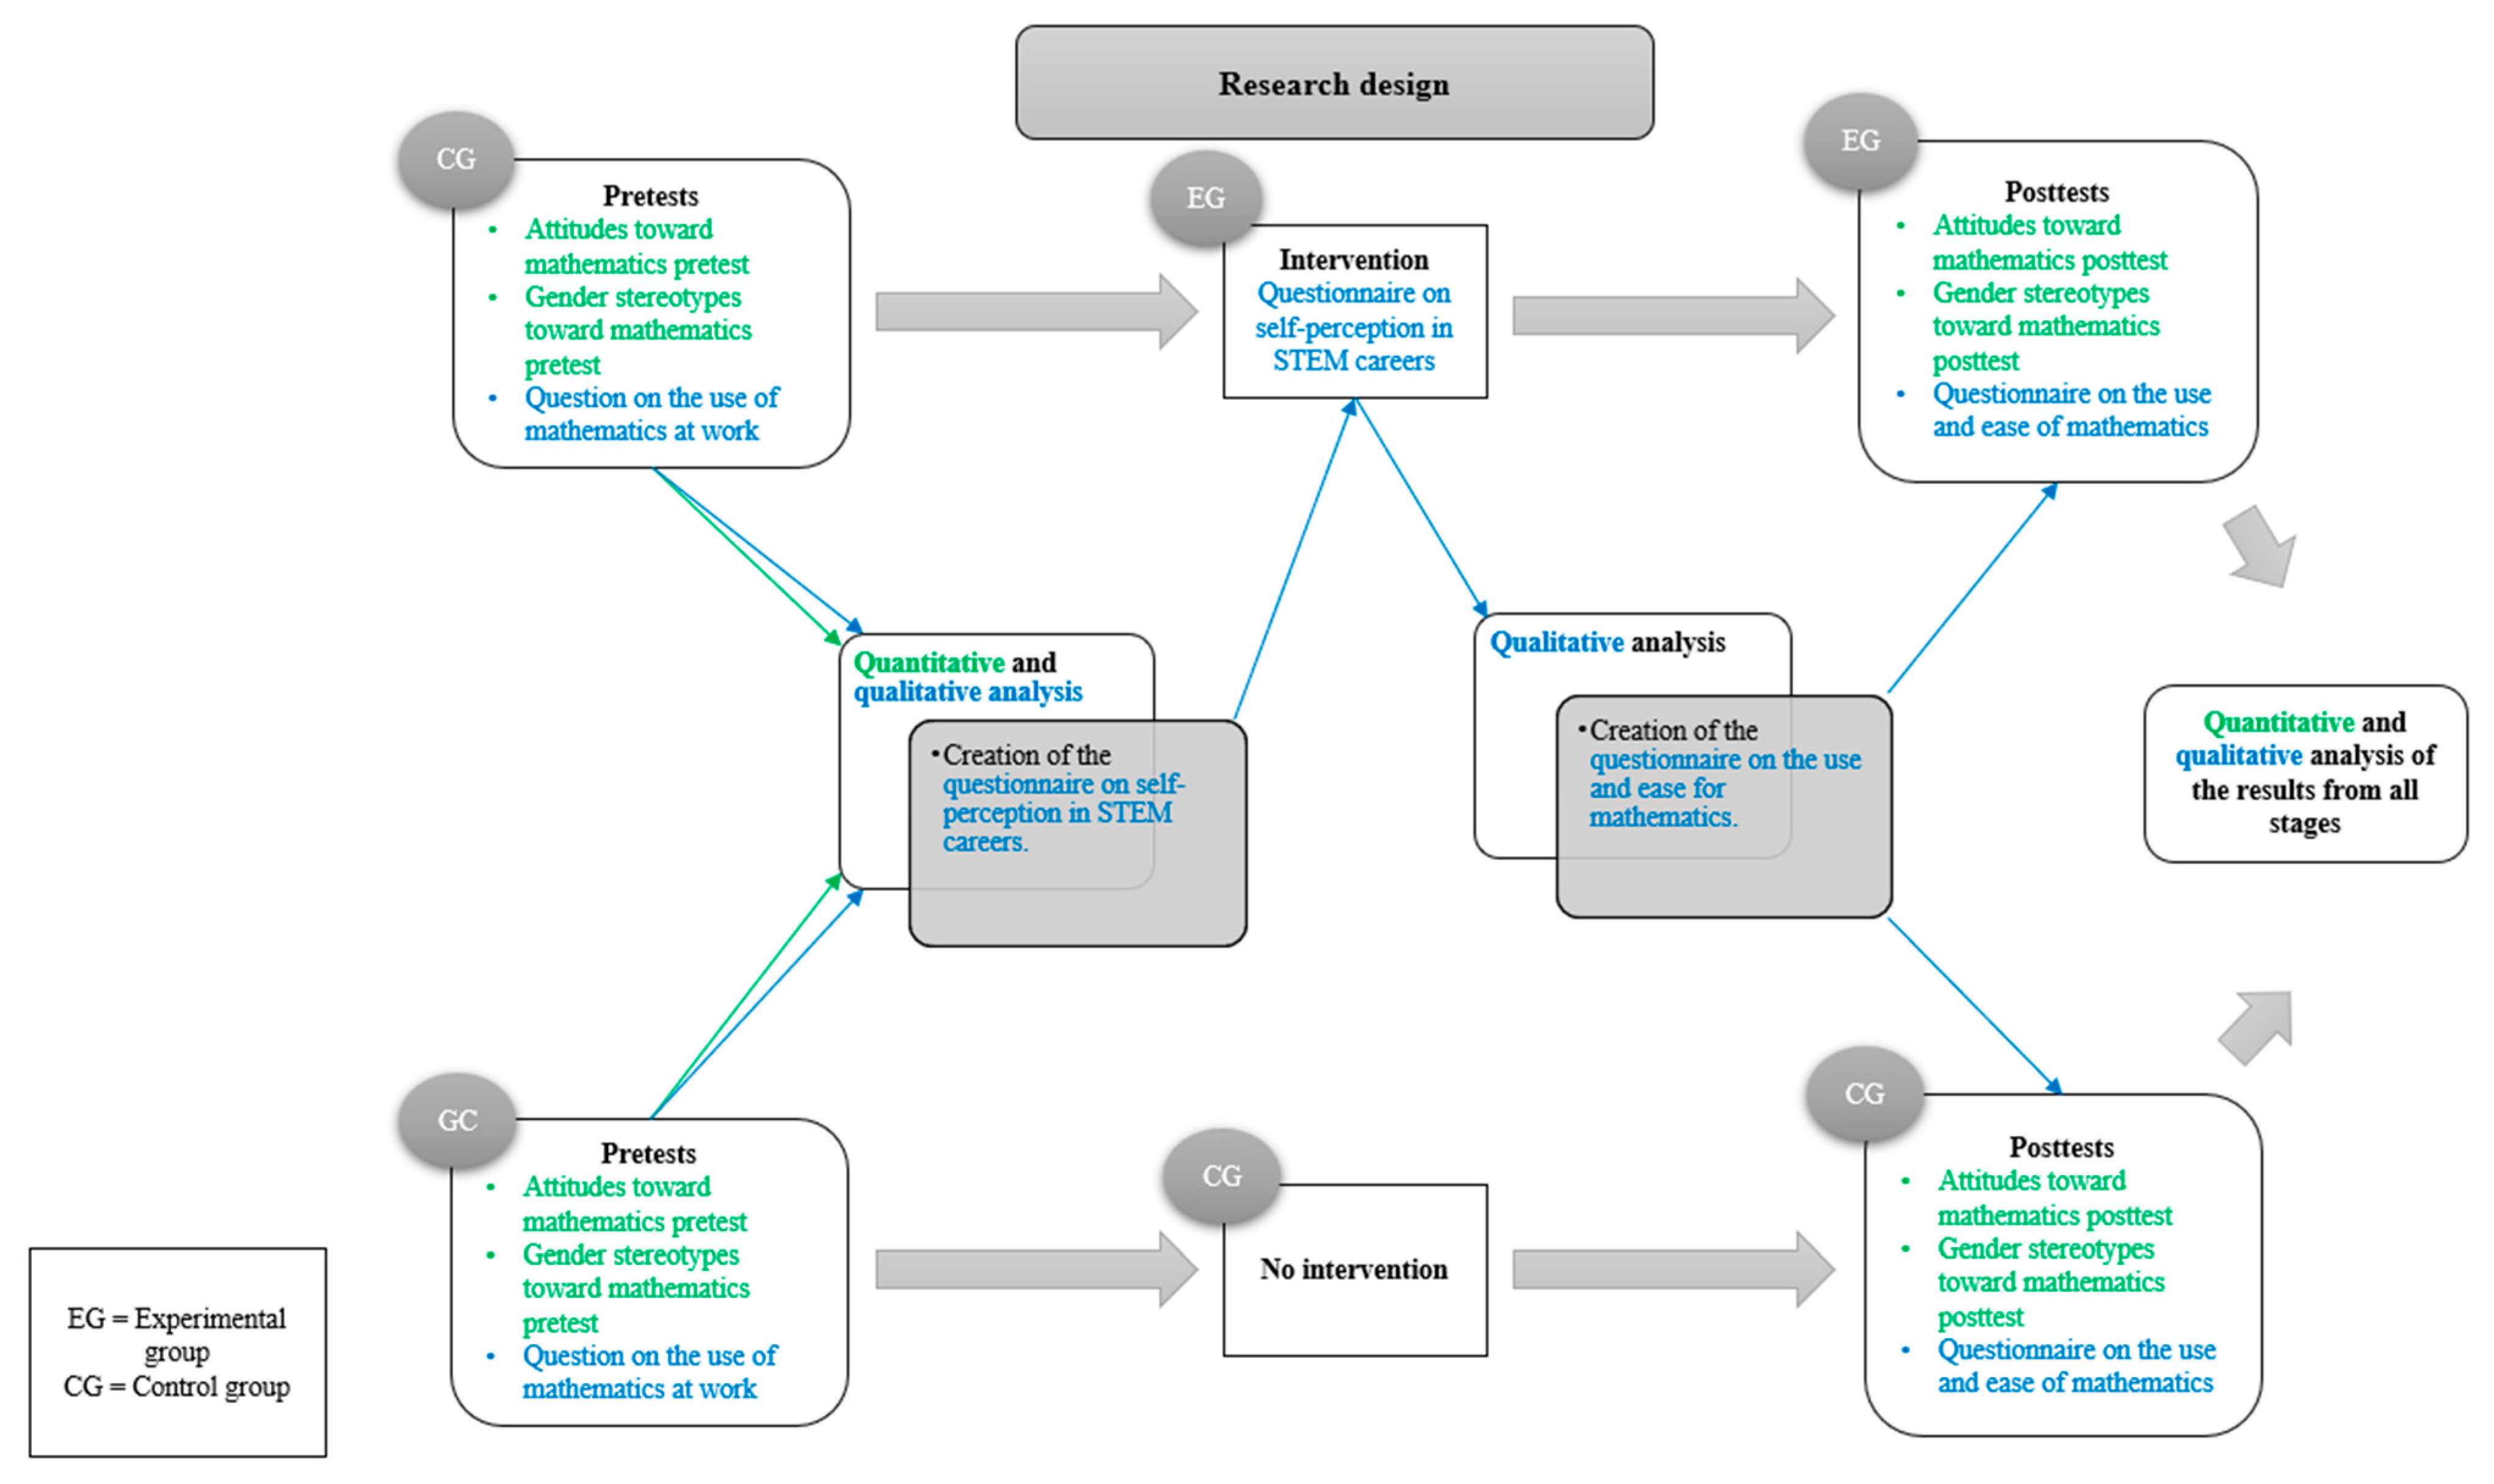
Figure 1. The research design presents a summary of the instruments and the types of analyses employed. Green is used in the text to indicate the obtention of quantitative data, while blue indicates the obtention of qualitative data.
Education 14 00594 g001
Figure 2. Co-occurrence between gender and interest/enjoyment (I), self-concept (II), value/utility (III), and the stereotypes of people who work in STEM (IV).
Education 14 00594 g002
Figure 3. Co-occurrence between the interest/enjoyment and cognitive skills (I), self-concept and cognitive skills (II), and interest/enjoyment and self-concept (III).
Education 14 00594 g003
Figure 4. Elements that link gender and attitudes with mathematics based on the findings.
Education 14 00594 g004
Table 1. Frequency of identified categories per instrument.
CategoryPretest
Question about the Use of Mathematics in the Workspace
Post-Test
Questionnaire about the Use and Ease of
Mathematics
Intervention
Questionnaire about Self-Perception in STEM Careers
Total
Interest/enjoyment326180209
Self-concept326116145
Perceived value/utility003131
Peer influence0123
Adult influence011011
Stereotypes of people that work in STEM923032
Contextual elements and events21151248
Cognitive skills6151536
Study areas114850
Attitudes0549
Total43113418574
Table 2. Differences by gender represented as means of the population in the pretest.
CategoryStatementMale StudentsFemale Students
Meanσ 1Meanσ 1
Interest/Enjoyment4. I learn many interesting things in mathematics40.5730.84
6. I like any schoolwork that involves numbers31.0521.00
Self-concept6. I am good at working out difficult mathematics problems31.0021.07
9. Mathematics makes me confused21.0330.68
Value/Utility3. I need to do well in mathematics to get into the university of my choice30.7540.44
5. I would like a job that involves using mathematics.30.9221.02
1 Standard deviation.
Table 3. Differences by gender in the means of the population in the post-test.
CategoryStatementMale StudentsFemale Students
Meanσ 1Meanσ 1
Interest/Enjoyment6. I like any schoolwork that involves numbers31.0320.73
Self-concept6. I am good at working out difficult mathematics problems21.1930.98
9. Mathematics makes me confused31.0321.04
Value/Utility3. I need to do well in mathematics to get into the university of my choice30.7340.40
5. I would like a job that involves using mathematics.40.5630.55
1 Standard deviation.
Table 4. Differences between the results of the pretest and post-test.
StatementsPretest: interest/enjoyment resultsPost-test: interest/enjoyment results
Control groupExperimental groupControl groupExperimental group
MalesFemalesMalesFemalesMalesFemalesMalesFemales
Interest/EnjoymentMeanσ 1MeanΣMeanσMeanσMeanσMeanσMeanσMeanσ
4. I learn many interesting things in mathematics40.6230.6940.5230.9940.6840.5530.8230.67
6. I like any schoolwork that involves numbers20.9820.8731.1321.1430.8520.7621.2120.71
Pretest: self-concept resultsPost-test: self-concept results
Control groupExperimental groupControl groupExperimental group
MalesFemalesMalesFemalesMalesFemalesMalesFemales
Mathematical Self-ConceptMeanσMeanΣMeanσMeanσMeanσMeanσMeanσMeanσ
3. Mathematics is not one of my strengths21.0631.0821.1621.1021.0630.9521.3331.01
6. I am good at working out difficult mathematics problems30.8720.9631.1321.1730.9720.7531.1031.33
9. Mathematics makes me confused31.0330.7321.0430.6331.1530.9531.0531.00
Pretest: value/utility resultsPost-test: value/utility results
Control groupExperimental groupControl groupExperimental group
MalesFemalesMalesFemalesMalesFemalesMalesFemales
Value/UtilityMeanσMeanσMeanσMeanσMeanσMeanσMeanσMeanσ
3. I need to do well in mathematics to get into the university of my choice40.7640.5530.7440.3230.6340.4730.8240.33
5. I would like a job that involves using mathematics21.1921.0730.6430.9721.0120.9231.2220.97
6. It is important to learn about mathematics to get ahead in the world30.6930.6431.0630.6740.5740.5840.5530.53
1 Standard deviation.
Table 5. Most frequent words in the entire data collection.
#WordTotal Frequency#WordTotal Frequency
1Students/boys9616Computer19
2Students/girls8317Notebook19
3Good8218Engineer18
4Think8019STEM17
5Mathematics7120Cars16
6Work/job6421Problems15
7Calculator5122Sciences13
8Career/studies5123Courses13
9Difficult5124Fun12
10Focus/concentrate3525Nature12
11Know3526Create11
12Image/picture3027Stress11
13Women2928Success11
14Motivate2729Process11
15Numbers2630Cellphone10
Disclaimer/Publisher’s Note: The statements, opinions and data contained in all publications are solely those of the individual author(s) and contributor(s) and not of MDPI and/or the editor(s). MDPI and/or the editor(s) disclaim responsibility for any injury to people or property resulting from any ideas, methods, instructions or products referred to in the content.