Article

Mastery of the Concept of Percentage and Its Representations in Finnish Comprehensive School Grades 7–9

by
Jorma Joutsenlahti
1,* and
Päivi Perkkilä
2
1
Faculty of Education and Culture, Tampere University, 33014 Tampere, Finland
2
Department of Teacher Education, University of Turku, 20014 Turku, Finland
*
Author to whom correspondence should be addressed.
Educ. Sci. 2024, 14(10), 1043; https://doi.org/10.3390/educsci14101043
Submission received: 28 August 2024 / Revised: 12 September 2024 / Accepted: 17 September 2024 / Published: 24 September 2024
(This article belongs to the Special Issue Editorial Board Members’ Collection Series in “STEM Education”)

Abstract

:
This research was conducted in 2019 in collaboration with Japanese colleagues, with the research tasks translated from the original Japanese. In Finland, a total of 1112 students from grades 7–9 in primary school participated in the study. In our article, we examine Finnish students’ mastery of the concept of percentages and how they express their mathematical thinking about percentages in a multimodal way. A multimodal expression of mathematical thinking can typically take the form of natural language, written mathematics, pictorial representations, mathematical symbolic language, or combinations of these, which can be used to manage information, such as through tables. Our focus is on Finnish primary-school students’ mastery of the concept of percentages, and we then narrow our analysis to tasks where students have used a multimodal approach. We analyze the representations of the concept of percentages and the related thought processes. The concept of percentages was best mastered in grade 9 and weakest in grade 7. Students mostly used a combination of pictorial language, natural language, and mathematical symbolic language to describe their solution processes. However, describing their thinking in different ways did not necessarily highlight possible errors in their reasoning.

1. Introduction

In this article, we examine Finnish students’ (n = 1112) mastery of the concept of percentages and how they express their mathematical thinking in multimodal ways related to the concepts of percentages and the closely related concept of ratios. Mastery of these concepts is fundamentally linked to an understanding of fractions, which are related to the concepts of rational number, ratio, division, and probability [1,2]. Research (e.g., [1,2,3,4,5,6]) has shown that fractions and related concepts are challenging in school mathematics. Teaching and learning fractions, ratios, proportionality, and percentages in grades 7–9 are complex processes [7]. In particular, students struggle with understanding fractions as numbers that extend the whole-number system to rational numbers [1,8,9].
Poor understanding of fractions and related concepts, such as rational numbers, is common not only among students but also among teacher candidates and teachers [1,2,10]. It is possible that students interpret their classroom experiences in learning situations as they express their conceptual understanding [10]. If instruction is based solely on performing calculations and symbolic mathematics, students may easily come to view mathematics as merely counting.
Many studies have shown that school mathematics learning is enhanced when students are given the opportunity to build bridges between everyday situations and the symbolic language of mathematics, and vice versa [11,12,13,14]. Focusing solely on symbolic computation and logical reasoning, as in traditional counting-based instruction, does not emphasize multimodal expressions such as natural language and pictorial explanations in the presentation of mathematical meaning-making. The multimodal approach mentioned above highlights the variety of ways [8] in which students and teachers can express mathematical thinking. If teaching and learning situations emphasize counting and symbolic mathematical language, students might find it challenging to express their mathematical thinking in a multimodal way. However, the use of natural language, pictorial explanations, and symbolic mathematics is necessary because students must learn how to transfer abstract symbolic mathematical knowledge into concrete situations and vice versa [11].
In many areas of basic education, vocational education and training, polytechnics, and universities, students need a strong understanding of percentages, ratios, and other concepts related to fractions. Students need to be familiar with a variety of real-life situations that embody mathematical symbolic information and understand their relationships to these situations [15]. This means that basic mathematics education should support and maintain the meaning-making of mathematical concepts, fostering an enduring, sophisticated understanding and lifelong learning for all. Through meaning-making, students build the core foundation for sustainable development in education [1,2].
Education for Sustainable Development (ESD) is a long-term process that provides tools for improving life in various areas, including social, economic, and environmental domains [1,2]. In the context of mathematics education, this means that we must develop students’ competencies in basic mathematics education so that they can apply mathematical concepts and exhibit creativity in solving and modeling ESD-based mathematical problems in different fields of society [16].
In this study, we explore 7th–9th graders’ mastery of the concepts of percentages and ratios, as well as their expressions of mathematical thinking based on their solutions to questionnaire tasks related to these concepts. In the questionnaire tasks (Appendix A), we asked students to use drawings, natural language (their mother tongue), and mathematical symbolic language in their solutions. Through these questionnaire tasks, we aim to determine the nature of conceptual meaning-making in the spirit of sustainable mathematics education among the 7th–9th graders involved in the study, specifically how they describe their thinking in a multimodal way. It should be noted that the current Finnish Core Curriculum (FCC) for Basic Education emphasizes the description of mathematical thinking in multimodal terms [17].
In the general section of the FCC, the role of sustainable development is described as the “school’s role in building a sustainable future that can be strengthened in the organization of education” [17]. In mathematics education, it is widely recognized that mathematics acts as a gatekeeper: students with strong mathematical knowledge are more likely to achieve higher success in mathematics than those who underperform in this subject [2,16]. Additionally, we aim to determine the number of correct and incorrect answers among grades 7–9 in students’ performance on the tasks presented in this study. The research questions are as follows:
  • How did Finnish students in grades 7–9 perform on the problems related to the concepts of percentage and ratio?
  • How did Finnish students in grades 7–9 express their mathematical thinking in solving the problems?
Next, we will explore the theoretical perspectives related to the research tasks. First, we will describe the concepts of percent and ratio and their relationship to fractions and related concepts. Second, we will discuss multimodality. We have previously introduced sustainable development in mathematics education in our earlier articles, “Academic Literacy Supporting Sustainability in Mathematics Education: A Case of Collaborative Working as a Meaning-Making Process for ‘2/3’” [1] and “Sustainability Development in Mathematics Education: A Case Study on the Meanings Prospective Class Teachers Attribute to the Mathematical Symbol ‘2/3’” [2].

2. Theoretical Framework

2.1. Concepts of Percent and Ratio in the Finnish Core Curriculum (FCC)

The key concepts of school mathematics in this study are percentages and ratios. The concepts of percentage and ratio are descended from the concept of fraction, which is introduced in the mathematics curriculum for grades 3–6 in the FCC [17]. In grades 3–6, the goal is to learn the concept of fractions and practice calculating fractions in various situations. The concept of percentages is also first introduced in FCC [17] within the mathematics content for grades 3–6. Teaching and learning activities should introduce the concept of percentages and lay the foundation for understanding and practicing percentage calculations and values in simple cases.
From the perspective of fractions and percentages, the FCC [17] emphasizes the connections between fractions, decimals, and percentages, in turn, supporting a focus on sustainable learning. The teaching of percentages is concentrated in grades 7–9, where it is one of the items included in the final assessment. In fact, according to the FCC [17], in the final assessment for grades 7–9, students must demonstrate their understanding of percentages. They must be able to calculate percentages, as well as percentage changes and comparisons. They should also be able to apply their understanding of percentages in various situations.
The FCC [17] for grades 7–9 in mathematics emphasizes students’ ability to express their mathematical thinking and meaning-making in a multimodal way during the final assessment of the concept of percentages. The focus on conceptual understanding and the multimodal presentation of mathematical thinking supports the sustainability of mathematics learning [1,2].
In the FCC [17], the concept of ratio takes a back seat compared to the concept of percentages in the content and objectives of basic mathematics education. The word “ratio” is not directly mentioned in the mathematics education content and objectives, despite its close relationship to the concept of fractions, which is already taught in primary school. The mathematical concept of ratio in the FCC [17] is only explicitly found in the geography content for grades 7–9: “The pupil can measure distances on a map using both the line segment and ratio scales” [17]. Although the concept of ratio is less emphasized in the FCC [17], related concepts can still be found in the curriculum (Table 1).
The mathematical notation “a/b” can be interpreted in many ways: part–whole, operator, measurement, division, ratio, rational number, probability, etc. [2,18,19]. When considering the notation “a/b,” at least two approaches can be distinguished: the pedagogical approach and the mathematical–historical approach [2]. In this article, we adopt the pedagogical approach and will partially apply it to the interpretation of the concept of percentage.
The mathematical notation of p, percent, is often presented as
p% = p/100.
The notation (1) gives several possibilities to interpret it as a mathematical expression (Figure 1).
The expression (1) can be interpreted as a fraction (with p as the numerator and 100 as the denominator) or as a ratio (the ratio of the number p to the number 100). Both interpretations can be applied when solving word problems focused on percentages. A third possible interpretation of the expression (1) is as a division operation; in the context of percentages, this means converting a fraction to a decimal number or calculating the value of a ratio (Figure 1). The fact that percentage expressions can be interpreted in multiple ways may confuse students, especially since these different approaches are rarely emphasized in primary education. This could help explain the significant challenges students face in understanding the concepts of percentages and fractions [2].
Percentages and ratios are taught in schools through everyday experiences familiar to students, such as percentage discounts in shop sales and mixing ratios of juice concentrate and water. In these cases, teaching can be seen as situational. In traditional mathematics teaching, teachers and teaching materials consider everyday experiences in problem-solving. Research suggests that expressing students’ thinking verbally, or in a more complex manner, structures and develops their mathematical thinking [4,8]. In what follows, we use the term “languaging”, which we will discuss in more detail in the Section 2.2.

2.2. Multimodal Expressions of Student’s Mathematical Thinking

Researchers Zhou and Zheng [11] discuss a three-component model of mathematical meaning: situational, verbal, and symbolic mathematics. These three components can be mapped onto one another when new mathematical concepts are taught. Situational mathematics emphasizes the real-life contexts in which mathematical knowledge is applied, supporting the processing of mathematical concepts. Verbal mathematics refers to the use of natural language in learning and teaching situations, allowing students to express their mathematical thinking in everyday language. Symbolic mathematics involves the use of formal mathematical language. For example, instead of situational mathematics, Joutsenlahti and Kulju [8] use the term “languaging”, which, in mathematics learning contexts, involves the use of natural language, pictorial explanations, and symbolic language to express mathematical thinking and meaning-making. In this article, we use the term “languaging” to describe students’ expressions of mathematical thinking in the research tasks.
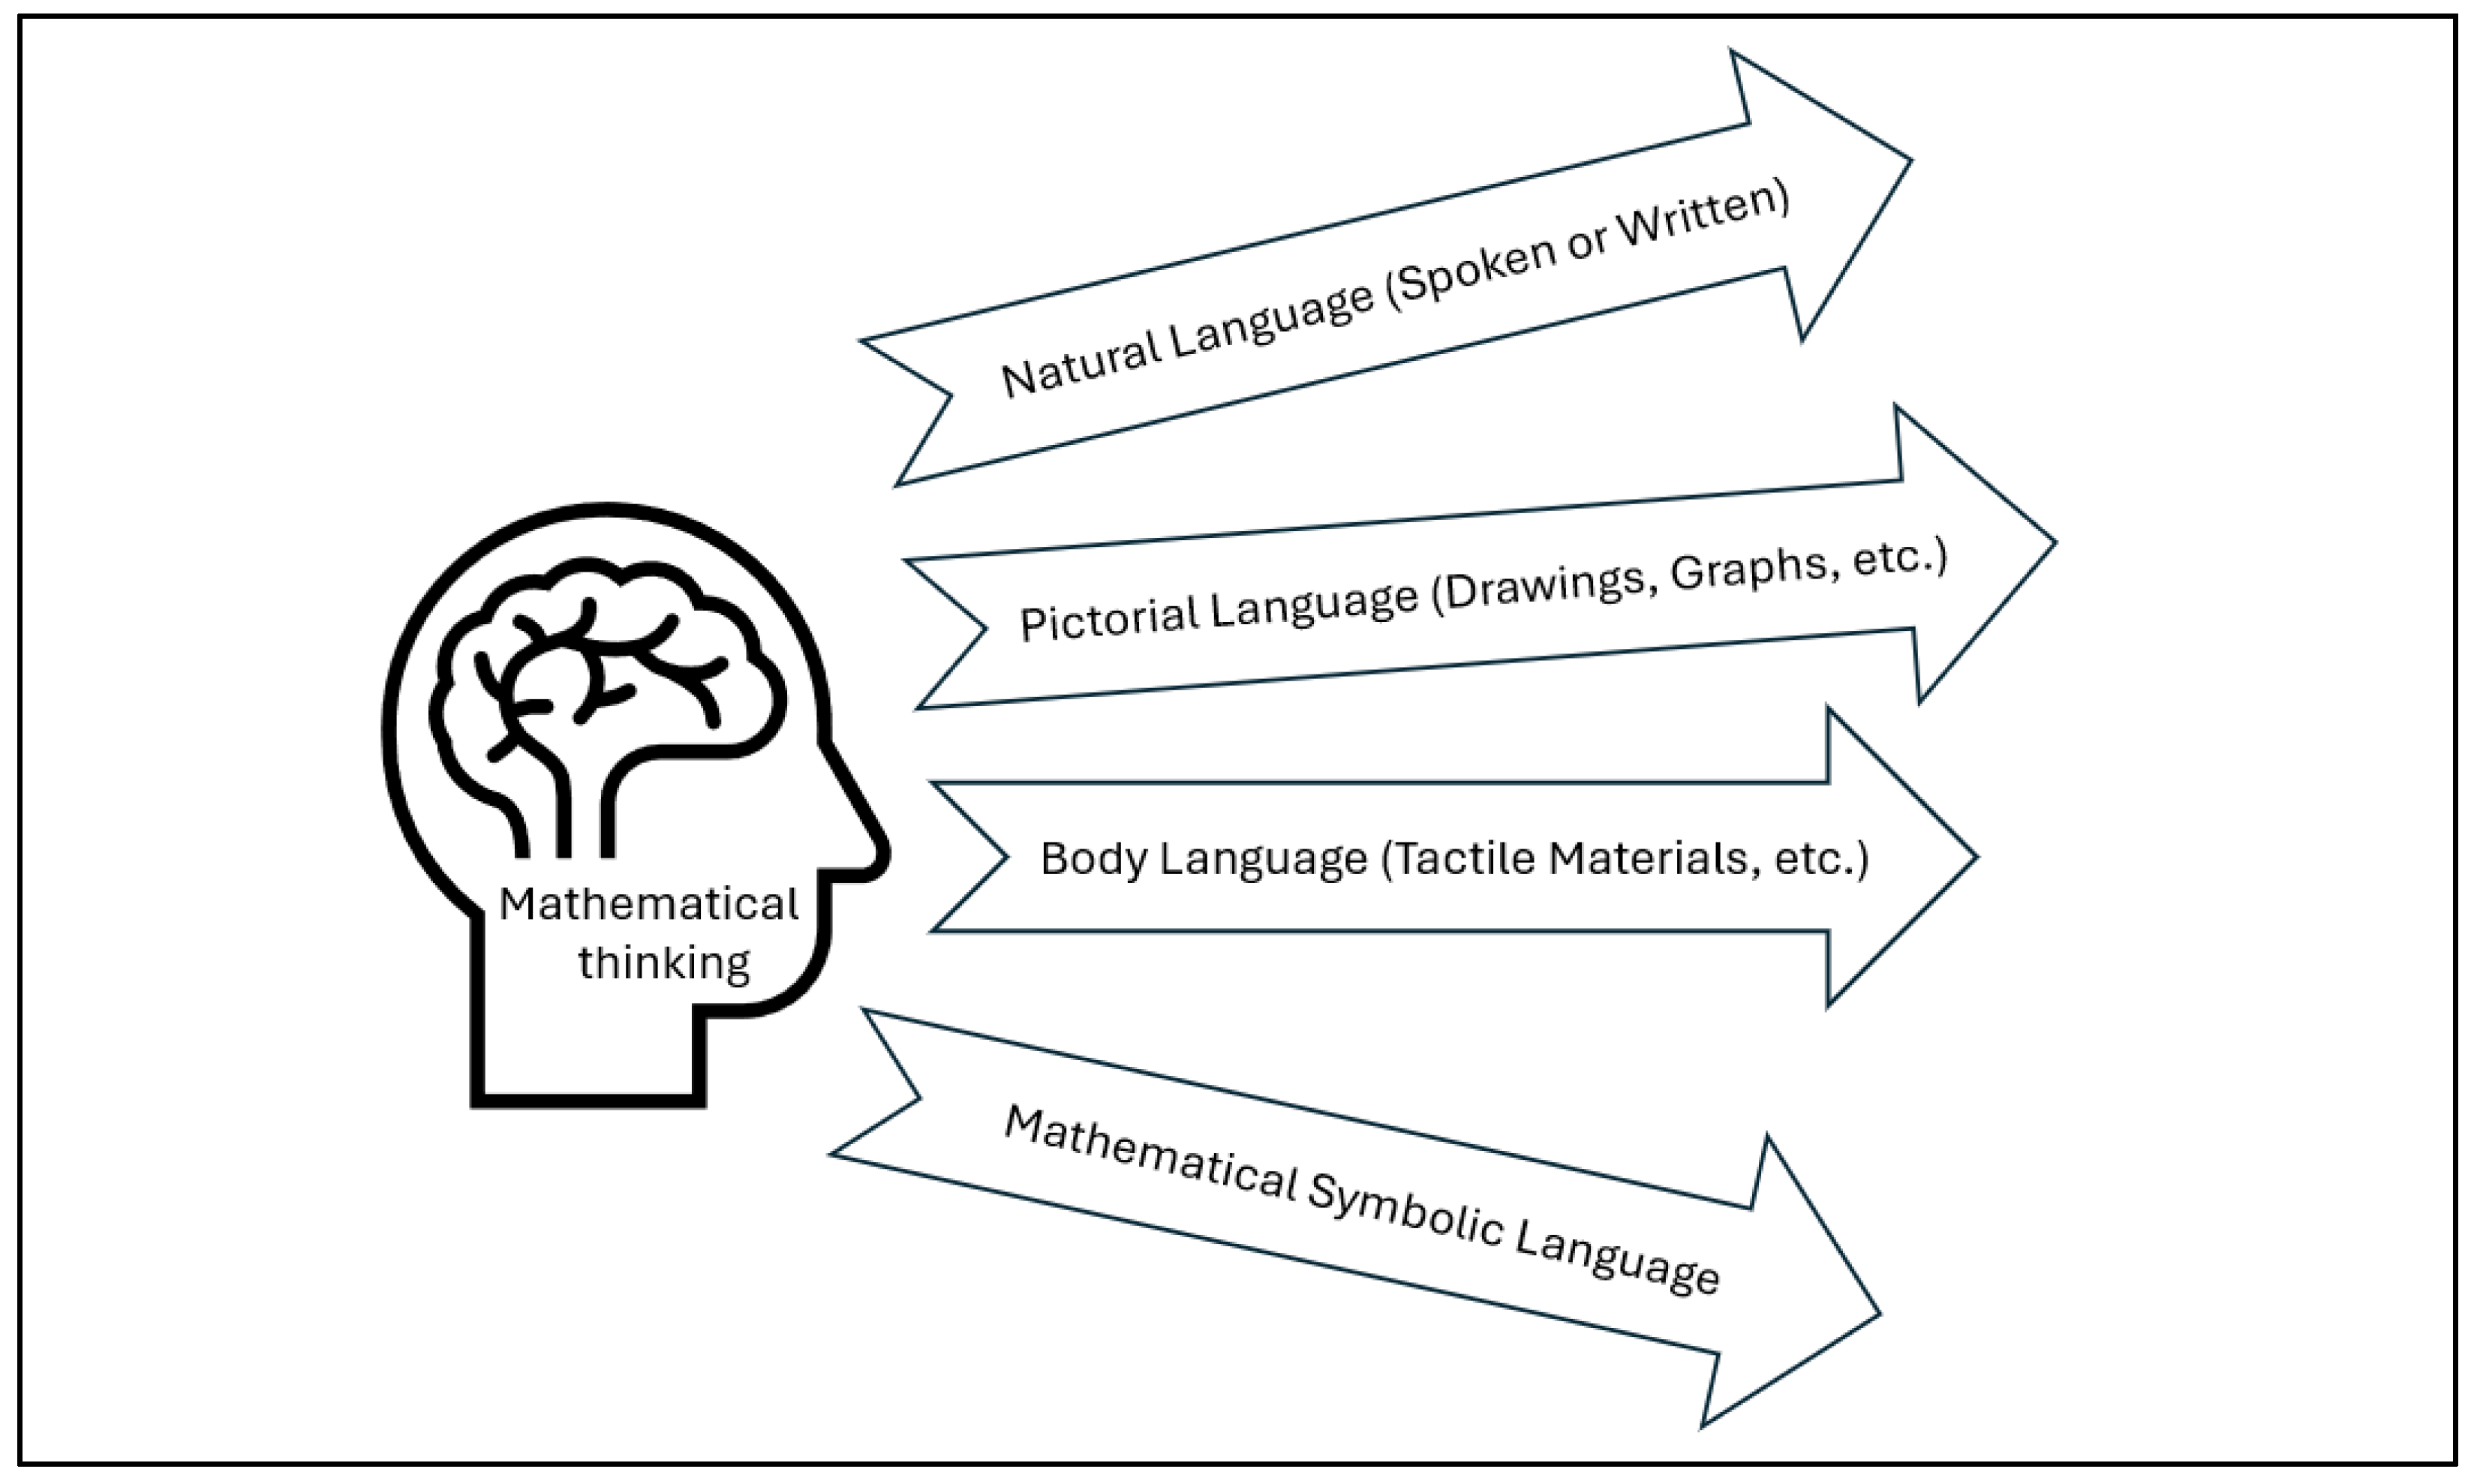
One of the key aims of the mathematics curriculum is to help develop students’ mathematical thinking [17]. In this article, by mathematical thinking, we mean the processing of mathematical knowledge (conceptual, procedural, or strategic) as guided by the learner’s metacognition [20,21]. Expressing a student’s mathematical thinking is important for assessing and guiding their learning processes. Expressions in the student’s natural language (typically their mother tongue) reveal their thinking and reasoning, whether spoken or written. Some students prefer to articulate their thinking through drawings, which we refer to as pictorial language. Primary-school students can also make their thinking visible in a tactile or bodily way, especially when working with hands-on activity materials, which we call body language. The fourth language in this model (Figure 2) is mathematical symbolic language. We use the term “languaging” to describe the process in which a student employs multimodal expressions (natural language, pictorial language, body language, and/or mathematical symbolic language) to reveal their mathematical thinking.
Languaging mathematical concepts, such as percentages, fractions, or ratios, using a multimodal approach (Figure 2) provides the foundation for a student’s meaning-making process in learning. Additionally, a student’s own languaging of their thinking helps them organize their thoughts in mathematics and formulate more understandable written answers for readers.
Guidance on languaging (multimodal expressions) can be found in the Finnish Pre-primary Education Curriculum (FPEC) [26], as well as in the curricula of Finnish comprehensive [17] and upper secondary schools [27]. In the FPEC [26], children are encouraged to articulate what they think and how they think. In primary school, grades 1–2, teaching should develop students’ abilities to express their mathematical thinking using concrete tools, oral communication, writing, drawing, and interpreting images [17]. In grades 3–6, teaching should encourage students to present their conclusions and solutions to others through concrete tools, drawings, speech, and writing, including the use of information and communication technology [17]. In grades 7–9, teaching should encourage students to develop their mathematical thinking through verbal and written mathematical expressions [17]. Upper-secondary-school students are also encouraged to use drawings and tools that support thinking, as well as to transition between different forms of mathematical expression [27].

3. Methods

3.1. Research Tasks

We have been collaborating with Japanese colleagues for several years. They studied the mastery of the concepts of percentage and ratio among both secondary-school students and students training to become classroom teachers [28,29]. We found that similar challenges exist in teaching and learning these concepts in both Finland and Japan. Therefore, in the spring of 2019, we launched a joint research project between Finland and Japan to investigate middle-school students’ mastery of these concepts in both countries. Our goal was to explore how Finnish and Japanese middle-school students understand percentage and ratio concepts in various practical situations and how they describe their mathematical thinking in different ways.
In this article, we present the results of a study on Finnish 7th–9th graders’ mastery of the concepts of percentage and ratio. For our study, we used an international set of seven tasks (Appendix A) compiled by Kumakura and his research team [28], who had previously piloted the functionality of the tasks in their own study. We adapted the task set to align with the Finnish curriculum criteria. The content of the tasks identifies areas in everyday situations where percentage calculations are needed. In two tasks, Q3 and Q4, students were asked to compare the areas of Finland and Japan. In the questionnaire, items Q3 and Q4 corresponded to items a (Q3) and b (Q4) of the same task. The aim of this task was to assess students’ understanding of the concept of ratio and whether they comprehended what was being compared to what. To analyze the tasks, we renumbered task 3a and 3b, so that item a became Q3 and item b became Q4.

3.2. Participants and Data Collection

Our study involved 1151 secondary-school students from thirteen schools across Finland. The volunteer schools and grades (7–9) that participated in the study were identified through a network of mathematics teachers. We did not collect data on the number of special-needs students, and not doing so may have influenced the survey results.
The mathematics teachers in the participating schools (n = 13) were responsible for administering the survey. One lesson was allocated for completing the questionnaire, and the use of calculators was permitted. We followed the guidelines for good scientific practice, as outlined by the Finnish National Board on Research Integrity [30]. Ethical guidelines were adhered to by obtaining permission from education authorities, school principals, teachers, parents, and students in the participating schools. Students also had the option to opt out of the survey at any time. All parties were informed in detail about how the study results would be published, and we ensured that the identity of schools and students remained confidential. Students were not asked to provide names or any other identifying information in their responses. All research papers and materials were securely stored, and student response papers were coded with a sequential number based on grade level. Each participating teacher received a report on the average performance of their class, including the number of correct responses, but individual student results were not provided.

3.3. Analysis

Although 1151 students participated in the data collection, only 1112 were included in the analysis. Some responses had to be discarded due to incompleteness or being left blank. The final analysis was based on 1112 completed questionnaires. To gain an overview of Finnish students’ mastery of the concept of percentages in grades 7–9, we used quantitative content analysis to classify students’ solutions as correct or incorrect by grade level. First, we coded the survey data into groups based on category levels. Using the correct and incorrect answers, we calculated typical statistical indicators to describe students’ performance on the tasks. Quantitative content analysis was well-suited for this, as the correct and incorrect responses were categorized accordingly [31].
Additionally, we classified the responses to task Q2 (Appendix A) based on how students justified their mathematical reasoning. This coding followed a qualitative content analysis approach by combining two strategies: (a) a concept-driven method, which involved applying our prior knowledge of the solution process (correct/incorrect) and how students expressed themselves through different modes (pictorial, verbal, and symbolic); and (b) a data-driven method, allowing categories (e.g., pictures, tape diagrams, line segment diagrams, number line diagrams, tables, pie charts, arrows, other, and no answer/partial answer) to emerge from the data. This approach reflects the different ways students explained their solutions to task Q2. The data-based coding focused on the various modes of expression and the correctness of the solution process.
We checked the reliability of the coding by comparing the categories assigned by each researcher. If any discrepancies arose during this comparison, we reviewed the coding together and made the necessary adjustments to reach a consensus [32]. In the next section of our article, we present the results of our study, both for the entire questionnaire and specifically for task Q2, focusing on the expressions of mathematical thinking.

4. Results

4.1. Students’ Understanding of Percentage and Ratio in the Questionnaire

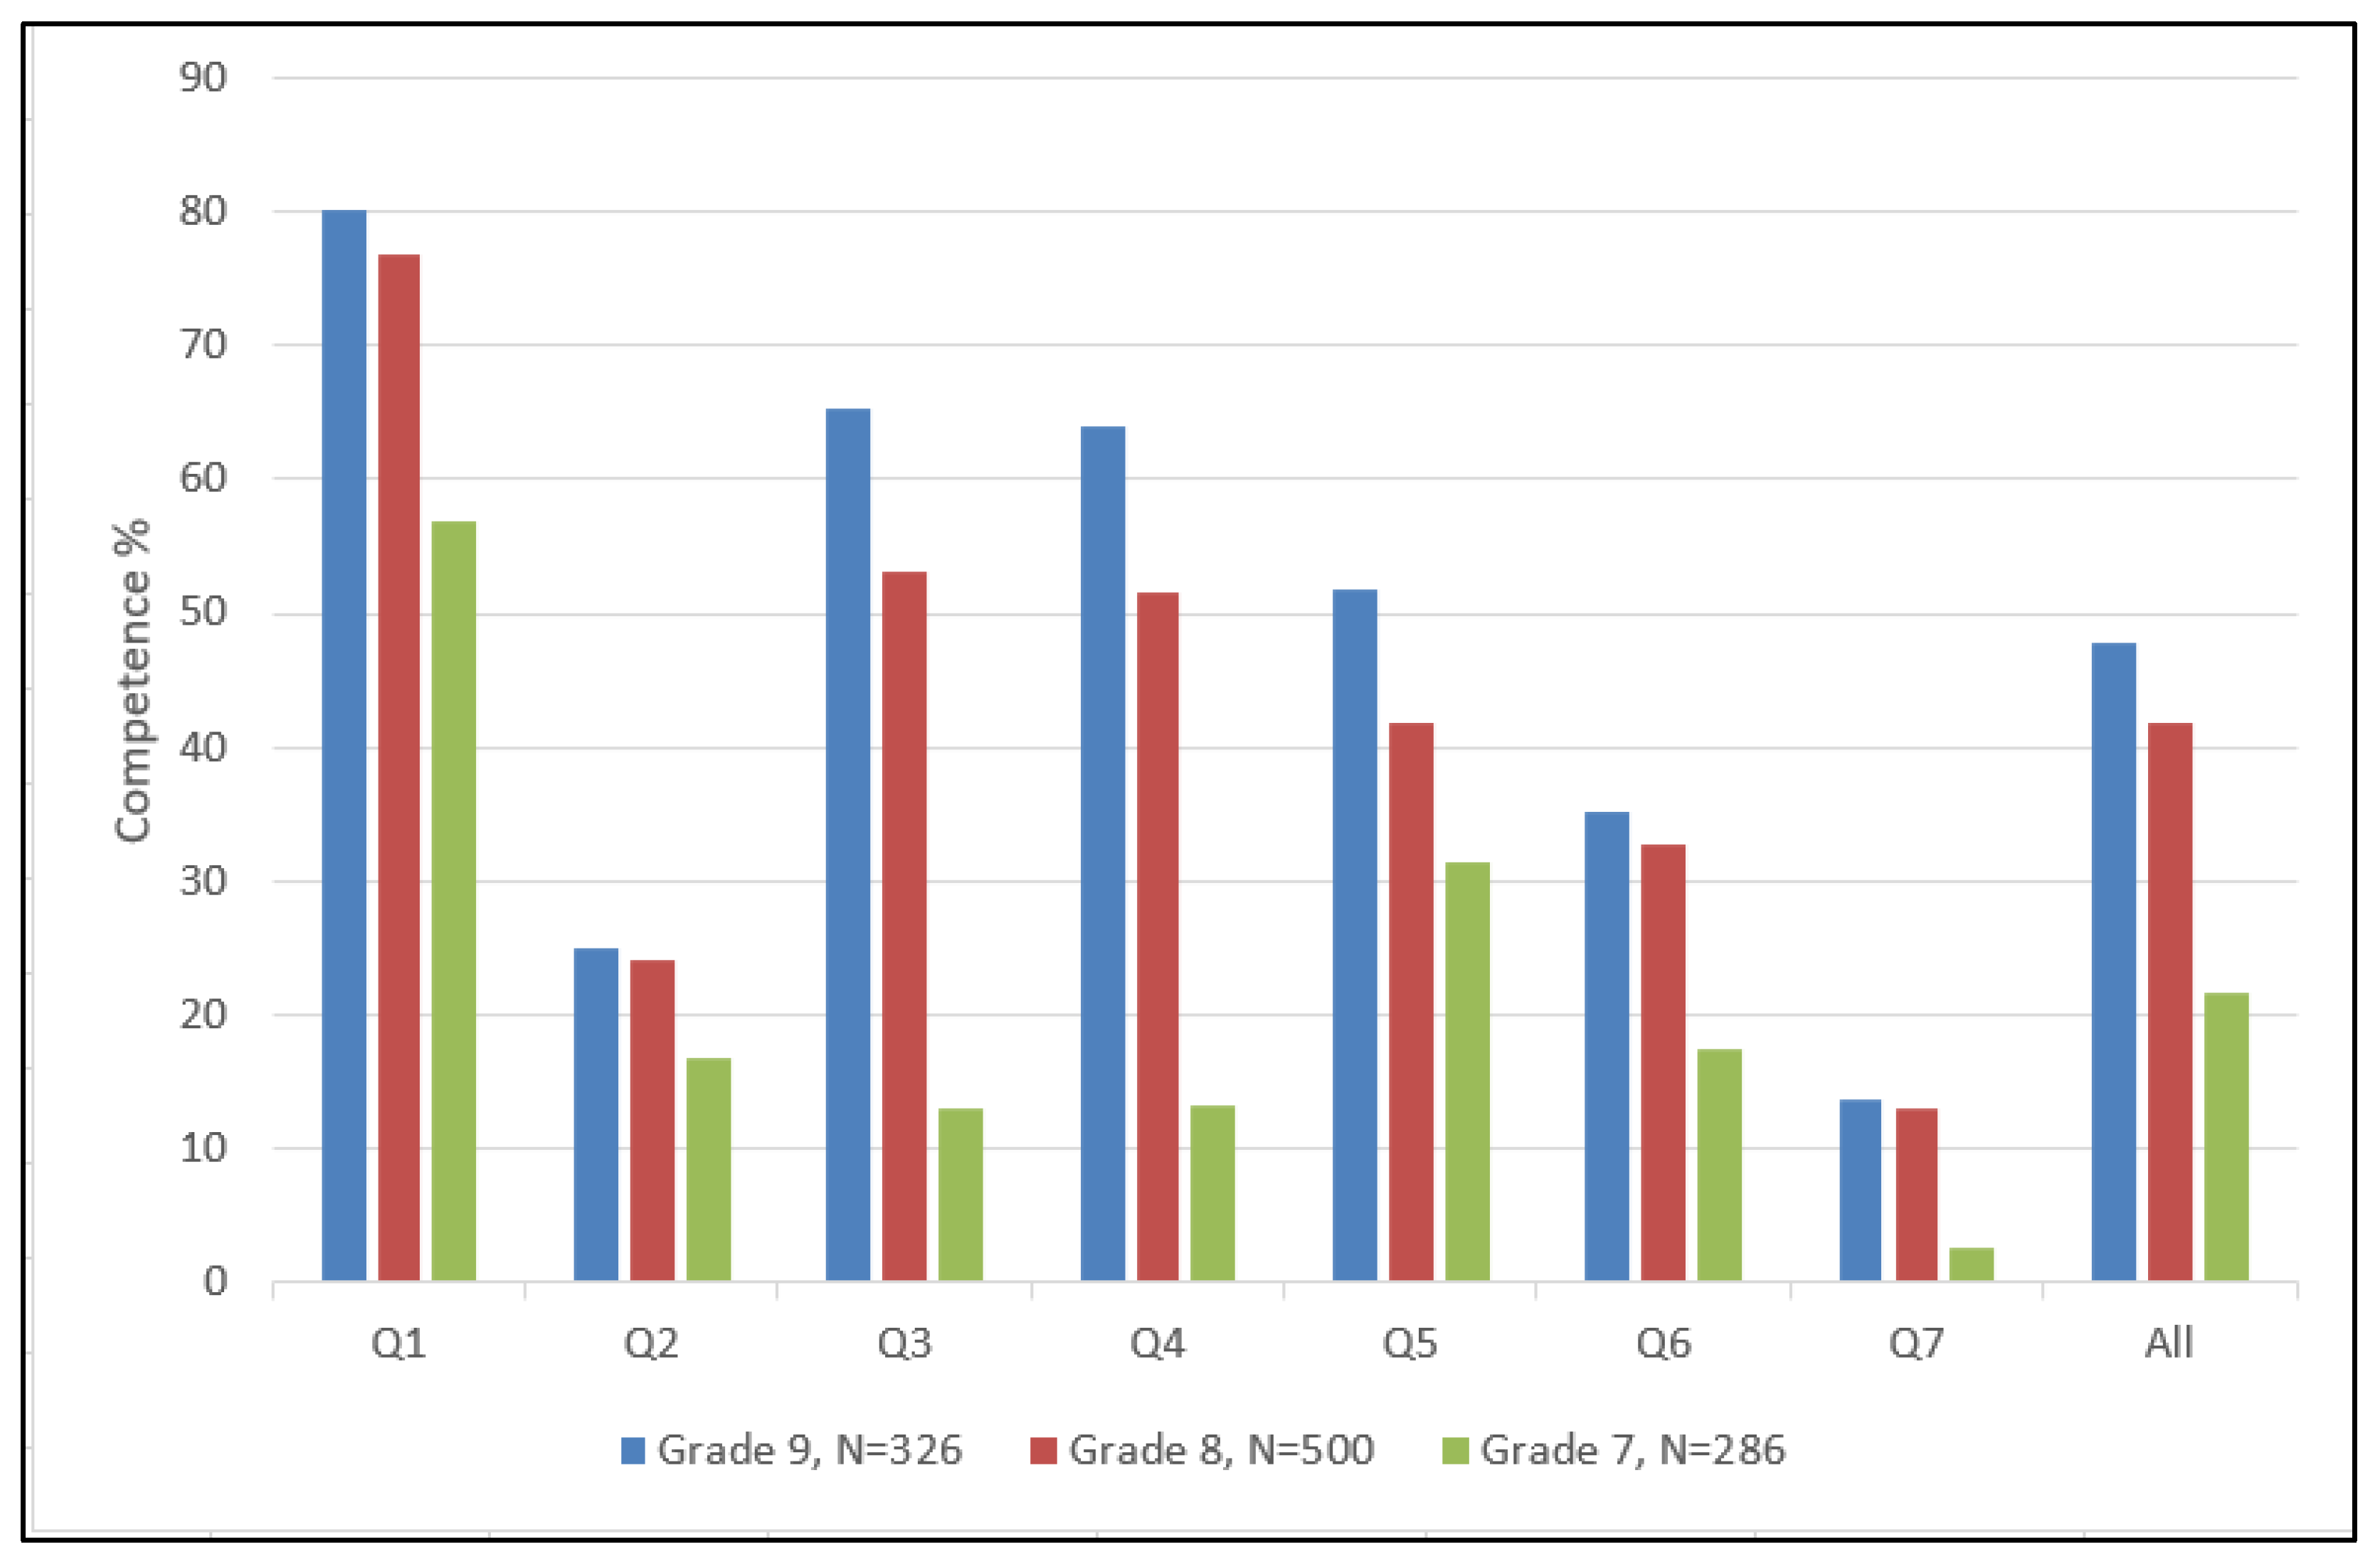
For the final analysis, we included the responses of 1112 students. The remaining responses were too incomplete to be appropriately included in the task-by-task analysis. The bar chart in Figure 3 shows the average percentage of students who correctly answered questions Q1–Q7 (Appendix A), broken down by grade level (7th, 8th, and 9th grades).
On average, the overall performance across all grades was less than half of the total possible score. The upper ranges (75th percentile) of total scores (maximum 14 points) for each grade level (9th, 8th, and 7th) were as follows: 10 points, 8 points, and 4 points, respectively. The highest standard deviation (4.26) was observed in grade 9, while the lowest (2.99) was in grade 7.
Questions Q3 and Q4 in the task set focused on scale (ratio), whereas the other tasks dealt with percentage calculation and the presentation of solutions. As shown in the bar chart in Figure 3, the tasks generally appear to be ordered from easiest to hardest, with the exception of task Q2. This pattern is particularly evident in the results for grades 9 and 8. Students primarily applied percentage concepts in their solutions through fraction interpretation (see Figure 1), which is a typical strategy in Finnish mathematics textbooks.
The results indicate that 9th-grade students performed the best on the tasks, followed by 8th-grade students. The differences in task performance between grades 7 and 8 are statistically significant (chi-square) for each task. This outcome is expected, given that the curriculum emphasizes teaching the concept of percentage and its applications in these grades.
Tasks Q3 and Q4 were fairly well mastered by students in grades 9 and 8. In this questionnaire, the concept of “ratio” (scale) seems to be understood, at least in terms of forming an expression, but these tasks do not provide any indication of a deeper understanding of the concept of ratio.
Task Q1 required calculating a reduced price, i.e., a percentage of a given base value. This task measures the basics of percentage calculation, which is important for practical life and further studies. Grade 9 students performed well (80%), as did grade 8 students (77%). In task Q2, the majority of students did not have a correct understanding of how to calculate the percentage of the base value, which is reflected in the poor performance on this task. Only about a quarter of the students mastered the task. It is somewhat surprising that students performed better on tasks Q5 (52% of 9th graders) and Q6 (35% of 9th graders) than on task Q2 (25% of 9th graders). Task Q7 proved to be the most difficult in the set, likely because it did not have a given base value and may have required the application of the concept of ratio. There are still relatively few tasks of this type in upper primary schools in Finland.

4.2. Students’ Mathematical Thinking Processes in Solving Task Q2

In this article, we focus particularly on task Q2 of the questionnaire (Appendix A); in Q2b, we asked students to explain their solution to task Q2a using multimodal ways. First, we examined the number of ways in which students used languaging to articulate their mathematical reasoning. We then categorized the responses based on the types of languaging the students employed. The students utilized various methods, including drawings, rectangle diagrams (e.g., tape or rectangle figures), line-segment diagrams (where the steps of the solution are represented by lines), tables, pie charts, arrows (used between different steps of solving the task), verbal expressions, and other forms of expression (e.g., no answer and incomplete responses) to address task Q2 (see Table 2).
Another correct explanation of the solution to task Q2 was provided by Student 228 (9th grade). This student used a table to demonstrate the construction of the equation and the process of cross-multiplying to simplify it. The student applied the concepts of ratio and proportion to solve the equation and understood that they needed to find the original weight (base value) of the canned salmon, which is less than the new weight of 180 g. Thus, the student correctly identified that the given weight of 180 g included the original weight plus an increase.
In the incorrect solutions, Students 38 and 71 (8th grade) failed to understand that the task involved a base value to which additional weight had been added. They mistakenly considered 180 g as representing 100%, without realizing that this new weight corresponds to 120%.
In summary, 9th and 8th graders were better at expressing their thinking in a multimodal way compared to 7th graders (Table 2). Overall, the students in the study (N = 1112) struggled to use natural language and drawings to support and express their mathematical thinking (Table 2). While students were able to correctly calculate solutions to problems, they often could not express their reasoning in a multimodal manner. Conversely, students could logically express their mathematical thinking based on incorrect solution patterns (e.g., answer: 144 g), but the use of drawings and natural language explanations did not help in identifying errors in their reasoning (Table 3).

5. Discussion

5.1. The Concept of Percentage

Research has shown that the concept of fractions, along with closely related concepts such as percentages and ratios, presents significant challenges in school mathematics [1,2,3,4,5,6,33]. These concepts are not only difficult for students to grasp but also pose challenges for educators in terms of effective instruction [7].
From a sustainability perspective, it is crucial that mathematics education is structured in such a way that mathematical knowledge and conceptual understanding are transformed into practical information that students can apply, particularly in solving future environmental problems [16].
In the assessment of student tasks, the focus was primarily on obtaining the correct result, with little emphasis on the reasoning process or the articulation of their thought processes. Generally, it was observed that expressing solutions linguistically posed a significant challenge. Encouraging students to articulate their thinking is a skill that warrants greater attention in future mathematics teaching, as it is essential for higher-level studies and helps foster a deeper understanding of mathematical concepts.
A closer examination of the typical responses to the weakly performed task Q2 (Table 4) reveals that the correct answer (150 g) was not the most common. The most frequent response (N = 279) was 144 g, indicating a fundamental misunderstanding of the expression 180 g−0.20 180 g, where the incorrect base value was used for the percentage calculation.
These erroneous solutions frequently demonstrated that students struggled to grasp that the initial weight of the salmon canister (180 g) already included a weight increase. Understanding the growth rate proved challenging for many students. Those who produced incorrect solutions often had difficulty determining the correct base value from which to calculate the 20% increase. Consequently, they were unclear about how to identify the original base value needed for the task and what it means when the added weight is 20%, leading to a final weight of 180 g, which is 20% greater than the original weight of the salmon preserve.
Since 0.20∙180 g = 36 g, the answer of 216 g in Table 4 was 180 g + 36 g. The answers 160 g (=180 g−20 g) and 179.80 g (=180 g−0.20 g) show a poor understanding of the concept of percent. The interesting answer is 171 g, as it is the result of the expression 180 g−180 g:20, the structure of which was not disclosed to the reader in the solutions.
In percentage calculations, understanding the base value is crucial, as it is closely related to the concept of fractions (Figure 1). For students to comprehend fractions, it is essential that they grasp the concept of the whole and what a fraction represents. Students should recognize, even within the context of fractions, that the whole is not a constant but can be redefined depending on the situation. This understanding is directly linked to their comprehension of the base value in percentage calculations and the concept of changes in the base value.
Thus, difficulties in percentage calculations can largely be attributed to students’ challenges in understanding previously studied fractions and their application in various contexts (cf. [2]). Another contributing factor is the lack of emphasis in the mathematics curriculum [17] and textbooks on exploring the connections between mathematical concepts, such as the relationship between percentages, fractions, and ratios. Typically, these concepts are taught in isolation, without illustrating their potential interconnections. Specifically, the teaching of the concepts of ratio and proportion (Figure 1) is often fragmented in instructional materials, leaving students with an incoherent understanding of these concepts and their relatedness (e.g., ESD) [1,2].

5.2. Multimodal Expressions in Students’ Solutions of the Task

In solving problem Q2a, students employed equation solving and logical reasoning. For some who used equation solving, an interesting issue emerged in task Q2, particularly in explanation Q2b. It became evident that, while students knew how to form an equation, they struggled to translate their thinking from the symbolic language of mathematics back into the everyday context. They were able to model the equation based on an everyday situation but failed to explain how the equation related to the real-world context of task Q2. Zhou and Zheng [11] have highlighted the importance of building mathematical thinking and meaning-making by bridging everyday contexts with the symbolic language of mathematics, and vice versa—modeling the symbolic language of mathematics to align with everyday events. According to these researchers, this approach would enhance understanding and learning in mathematics.
This perspective reflects the concept of sustainable development in education, where the knowledge acquired becomes practical and applicable. Although the FCC [17] emphasizes diverse approaches to languaging and constructing mathematical thinking, students may find it unfamiliar to model symbolic mathematical expressions on everyday phenomena [1,2,8,11]. Instruction tends to focus more on translating everyday phenomena into the language of mathematics, with less emphasis on connecting common mathematical expressions back to everyday situations (cf. [8]).

6. Conclusions

Hargreaves, Hargreaves, and Fink [34] described sustainability as addressing “how particular initiatives can be developed without compromising the development of others in the surrounding environment now and in the future”. Traditionally, primary-school mathematics teaching has focused on developing procedural competence. However, as evidenced by the results of our test (Figure 1), procedural competence cannot be fully developed without a strong foundation of conceptual understanding. Ensuring this foundation is essential for the development of sustainable mathematics education. By exploring mathematical concepts and their interconnections in greater depth, teachers can enable students to construct meaningful understandings of these concepts. This approach would significantly contribute to comprehensible learning, serving as a basis for procedural mastery.
In our view, the most effective way to achieve this goal is to develop a pedagogy for mathematics instruction that places the languaging of students’ mathematical thinking (Figure 2) at the center. The responses to item Q2b of the test (Table 2 and Table 3) indicated that Finnish students are not well trained in expressing their mathematical thinking using natural or pictorial language. However, such rich expression through words and images would clarify students’ thinking and ultimately lead to a deeper conceptual understanding of the mathematical framework (e.g., [8]).
One limitation of this study is that part of the data collection occurred at the end of the school year, which may have resulted in test results that were not significant to students. This could have been reflected in a lack of effort and careless work.
Another limitation of the study is that we did not conduct interviews with any of the students about their problem-solving processes during data collection. When analyzing the data, we realized that interviewing a few students would have been beneficial, as many struggled to explain their solutions to task Q2 using written descriptions, drawings, verbal explanations, or mathematical symbols. Conducting interviews would have allowed us to gain deeper insights into students’ understanding of the concept of percentages and their use of language to express mathematical thinking. On the other hand, the COVID-19 pandemic caused delays in processing and analyzing the material. From an interview perspective, too much time had passed between the test completion and the potential student interviews.
As a direction for future research, we should explore and develop optimal pedagogical methods and sequences for teaching the related concepts of percentage, fractions, ratios, proportions, and division. The goal should be to ensure that as many students as possible develop a logical and coherent conceptual understanding of these terms. In the future, teacher training could place greater emphasis on approaches to mathematical concepts, procedures, and problem-solving that encourage students to discuss the lesson topics based on their own experiences, using pictorial and body language, in addition to natural and mathematical symbolic language. This would help students build a stronger understanding of mathematical structures.

Author Contributions

J.J. and P.P., conceptualization, methodology, formal analysis, investigation, resources, data curation, writing—original draft preparation, writing—review and editing, and visualization. All authors have read and agreed to the published version of the manuscript.

Funding

This research received no external funding.

Institutional Review Board Statement

Institutional Review Board Statement: Ethical review and approval were waived for this study because none of The Human Sciences Ethics Committee criteria were met in this study (TENK’s guideline “Ethical principles of research with human participants and ethical review in the human sciences in Finland” (https://tenk.fi/en/ethical-review/ethical-review-finland, accessed on 15 August 2023).

Informed Consent Statement

Informed consent was obtained from all subjects involved in the study.

Data Availability Statement

Data is unavailable due to privacy or ethical restrictions.

Acknowledgments

We would like to acknowledge our colleagues, Hiroyuki Kumakura (Shizuoka University, Japan), Shinichiro Matsumoto (Shizuoka University, Japan), Yutaka Kondo (Nara University of Education, Japan), and Kazuyuki Kambara (Mukogawa Women’s University, Japan).

Conflicts of Interest

The authors declare no conflicts of interest.

Appendix A

Table A1. The original test which was made by H. Kumakura [29].
Code of QuestionQuestion
Q1If a cake with a price of EUR 20 is sold at a 30% discount, what is the price after the discount? Write down the method and the answer.
Q2A company is selling 180 g of canned salmon; the weight of the salmon is 20% more than that sold in the previous year. What was the weight of the canned salmon sold in the previous year?
(a) Write down the answers to the problem.
(b) If you were to explain to a friend who does not understand how to find (a), how would you explain it in a way that is easy to understand using diagrams, tables, pictures, etc.? Write it down below. It is not necessary to use all the figures, tables, pictures, etc.
Q3The approximate land areas of Finland and Japan are shown in the table below.
Country     Land area
Finland      340,000 km2
Japan         380,000 km2
(a) Write an equation to find the approximate percentage of Finnish land area based on the Japanese land area. It is not necessary to find the answer.
Q4The approximate land areas of Finland and Japan are shown in the table below.
Country     Land area
Finland      340,000 km2
Japan         380,000 km2
(b) Write an equation to find the approximate percentage of the Japanese land area based on the Finnish land area. It is not necessary to find the answer.
Q5In lower secondary school A, 30% of the students commute to school by bicycle, 60% of which are boys. What percentage of boys commute to school by bicycle? Write the answer and how to find it.
Q6It is checked the annual number of visitors at the zoo from 2015 to 2017. The number of visitors in 2016 increased by 10% compared to the number of visitors in 2015. Conversely, the number of visitors in 2017 decreased by 10% compared to the number of visitors in 2016. How did the number of visitors in 2017 compare to the number of visitors in 2015? Check one correct answer from the following, (a) to (c), and write the reason for the answer.
(a) Increased, (b) remained the same, or (c) decreased
Q7The ratio of the area of forest to the total area of town A was 50% ten years ago, but it was 30% this year. Write the answer and how to find it. The total area of town A has not changed between 10 years ago and this year.

References

  1. Perkkilä, P.; Joutsenlahti, J. Academic Literacy Supporting Sustainability for Mathematics Education—A Case: Collaborative Working as a Meaning Making for “2/3”? In Transitioning to Quality Education; Jeronen, E., Ed.; Transitioning to Sustainability; MDPI: Basel, Switzerland, 2021; Volume 4, pp. 163–188. [Google Scholar] [CrossRef]
  2. Joutsenlahti, J.; Perkkilä, P. Sustainability Development in Mathematics Education—A Case Study of What Kind of Meanings Do Prospective Class Teachers Find for the Mathematical Symbol “ 2 3 ”? Sustainability 2019, 11, 457. [Google Scholar] [CrossRef]
  3. Mullis, I.V.S.; Martin, M.O.; Foy, P. TIMSS 2007 International Mathematics Report: Findings from IEA’s Trends in International Mathematics and Science Study at the Fourth and Eighth Grades; Chestnut Hill: Boston College, MA, USA, 2008. [Google Scholar]
  4. Morgan, C. The place of pupil writing in learning, teaching and assessing mathematics. In Issues in Mathematics Teaching; Gates, P., Ed.; Routledge: London, UK, 2001; pp. 234–244. [Google Scholar]
  5. Perkkilä, P. Oppikirja ja uskomukset alkuopettajien matematiikan opetuksessa (Textbook and beliefs in the teaching of mathematics by primary teachers). In Tutkimus Kouluopetuksen Kehittämisessä; Ahtineva, A., Ed.; Faculty of Education, University of Turku: Turku, Finland, 2001; Volume 17, pp. 112–125. (In Finnish) [Google Scholar]
  6. Vosniadou, S. Capturing and modelling the process of conceptual change. Learn. Instr. 1994, 4, 45–69. [Google Scholar] [CrossRef]
  7. Adjiage, R.; Pluvinage, F. An Experiment in Teaching Ratio and Proportion. Educ. Stud. Math. 2002, 65, 149–175. [Google Scholar] [CrossRef]
  8. Joutsenlahti, J.; Kulju, P. Multimodal Languaging as a Pedagogical Model—A Case Study of the Concept of Division in School Mathematics. Educ. Sci. 2017, 7, 9. [Google Scholar] [CrossRef]
  9. Siegler, R.S.; Fazio, L.K.; Bailey, D.H.; Zhou, X. Fractions: The new frontier for theories for numerical development. Trends Cogn. Sci. 2013, 17, 13–19. [Google Scholar] [CrossRef] [PubMed]
  10. Fuson, K.C. Overcoming Errors in Fraction Computation by Emphasizing Unit Fractions, Length Drawings, and Student Explanations. Univers. J. Educ. Res. 2019, 7, 1663–1678. [Google Scholar] [CrossRef]
  11. Zhou, X.; Zeng, J. Three-component mathematics for students. Infant Child Dev. 2022, 31, e2283. [Google Scholar] [CrossRef]
  12. Brooks, C. Making Maths useful: How two teachers prepare adult learners to apply their numeracy skills in their lives outside the classroom. Adults Learn. Math. 2015, 10, 24–39. [Google Scholar]
  13. Freudenthal, H. Mathematics as An Educational Task; Springer Science & Business Media: Dordrecht, The Netherlands, 2012. [Google Scholar]
  14. Zhou, X.; Li, M.; Li, L.; Zhang, Y.; Cui, J.; Liu, J.; Chen, C. The semantic system is involved in mathematical problem solving. NeuroImage 2018, 166, 360–370. [Google Scholar] [CrossRef] [PubMed]
  15. Swain, J.; Baker, E.; Holder, D.; Newmarch, B.; Coben, D. ‘Beyond the Daily Application’: Making Numeracy Teaching Meaningful to Adult Learners; National Research and Development Council (NRDC): London, UK, 2005. [Google Scholar]
  16. Díez-Palomar, J.; Flecha, A.; de Sanmamed, F.; García-Carrión, R.; Molina-Roldán, S. Pathways to equitable and sustainable education through the inclusion of roma students in learning mathematics. Sustainability 2018, 10, 2191. [Google Scholar] [CrossRef]
  17. FCC. Finnish Core Curriculum for Basic Education 2014. 2016. Available online: https://www.oph.fi/sites/default/files/documents/perusopetuksen_opetussuunnitelman_perusteet_2014.pdf (accessed on 5 August 2023).
  18. Park, J.; Guҫler, B.; McGrory, R. Teaching prospective teachers about fractions: Historical and pedagogical perspectives. Educ. Stud. Math. 2013, 82, 455–479. [Google Scholar] [CrossRef]
  19. Pantziara, M.; Philippou, G. Levels of students’ conception of fractions. Educ. Stud. Math. 2012, 79, 61–68. [Google Scholar] [CrossRef]
  20. Joutsenlahti, J. Lukiolaisen Tehtäväorientoituneen Matemaattisen Ajattelun Piirteitä: 1990-Luvun Pitkän Matematiikan Opiskelijoiden Matemaattisen Osaamisen Ja Uskomusten Ilmentämänä (Characteristics of Upper-Secondary Students’ Task-Oriented Mathematical Thinking: As Reflected in the Mathematical Knowledge and Beliefs of 1990’ s Long Mathematics Students). Doctoral Thesis, University Tampere, Tampere, Finland, 2005. Acta Universitatis Tamperensis 1061. Available online: https://trepo.tuni.fi/handle/10024/67453 (accessed on 8 August 2023).
  21. Kilpatrick, J.; Swaford, J.; Findell, B. Adding It Up: Helping Children Learn Mathematics; National Academy Press: Washington, DC, USA, 2001. [Google Scholar]
  22. Moschkovich, J.N. A sociocultural approach to academic literacy in mathematics for adolescent English learners: Integrating mathematical proficiency, practices, and discourse. In Multilingual Learners and Academic Literacies: Sociocultural Contexts of Literacy Development in Adolescents; Molle, D., Sato, E., Boals, T., Hedgspeth, C.A., Eds.; Routledge: New York, NY, USA, 2015; pp. 75–104. [Google Scholar]
  23. Moschkovich, J.N. Codeswitching and mathematics learners: How hybrid language practices provide resources for student participation in mathematical practices. In Codeswitching in the Classroom. Critical Perspectives on Teaching, Learning, Policy, and Ideology. Language Education Tensions in Global and Local Contexts; Swan, J.M., Faltis, C.J., Eds.; Routledge: New York, NY, USA; Center for Applied Linguistics: Washington, DC, USA, 2019. [Google Scholar]
  24. Moschkovich, J.N.; Zahner, W. Using the academic literacy in mathematics framework to uncover multiple aspects of activity during peer mathematical discussions. ZBM 2018, 50, 999–1011. [Google Scholar] [CrossRef]
  25. Joutsenlahti, J.; Rättyä., K. Kielentämisen käsite ainedidaktisissa tutkimuksissa (The concept of languaging in didactic studies). In Rajaton Tulevaisuus. Kohti Kokonaisvaltaista Oppimista. Proceedings of the Didactics Symposium, Jyväskylässä, Finland, 13–14 February 2014; Kauppinen, M., Rautiainen, M., Tarnanen, M., Eds.; Ainedidaktisia Tutkimuksia 8; University of Jyväskylä: Jyväskylä, Finland, 2014; pp. 45–61. [Google Scholar]
  26. FPEC. The Finnish Pre-Primary Education Curriculum 2014. 2016. Available online: https://www.oph.fi/sites/default/files/documents/esiopetuksen_opetussuunnitelman_perusteet_2014.pdf (accessed on 5 August 2023).
  27. NCC. National Core Curriculum for Education. 2019. Available online: https://www.oph.fi/sites/default/files/documents/lukion_opetussuunnitelman_perusteet_2019.pdf (accessed on 5 August 2023).
  28. Kumakura, K.; Kunimune, S.; Matsumoto, S. A survey study on the understanding of proportion among junior and senior high school students. Bull. Cent. Educ. Pract. 2019, 29, 80–89. [Google Scholar]
  29. Kambara, K. Understanding “proportion” and mathematical identity: A study of Japanese elementary school teachers. LUMAT Int. J. Math Sci. Technol. Educ. 2022, 10, 239–255. [Google Scholar] [CrossRef]
  30. Guideline of the Board on Research Integrity TENK 2019. Available online: https://tenk.fi/en/research-integrity-ri (accessed on 15 August 2023).
  31. Tuomi, J.; Sarajärvi, A. Laadullinen Tutkimus ja Sisällönanalyysi (Qualitative Research and Content Analysis); Tammi: Helsinki, Finland, 2018. [Google Scholar]
  32. Schreier, M. Qualitative Content Analysis in Practice, 1st ed.; SAGE Publications, Inc.: London, UK, 2012. [Google Scholar] [CrossRef]
  33. Lepik, M.; Grevholm, B.; Viholainen, A. Using textbooks in the mathematics classroom—The teachers’ view. Nord. Stud. Math. Educ. 2015, 20, 129–156. [Google Scholar]
  34. Hargreaves, A.; Fink, D. Sustaining leadership. Phi Delta Kappan 2003, 84, 693–700. [Google Scholar] [CrossRef]
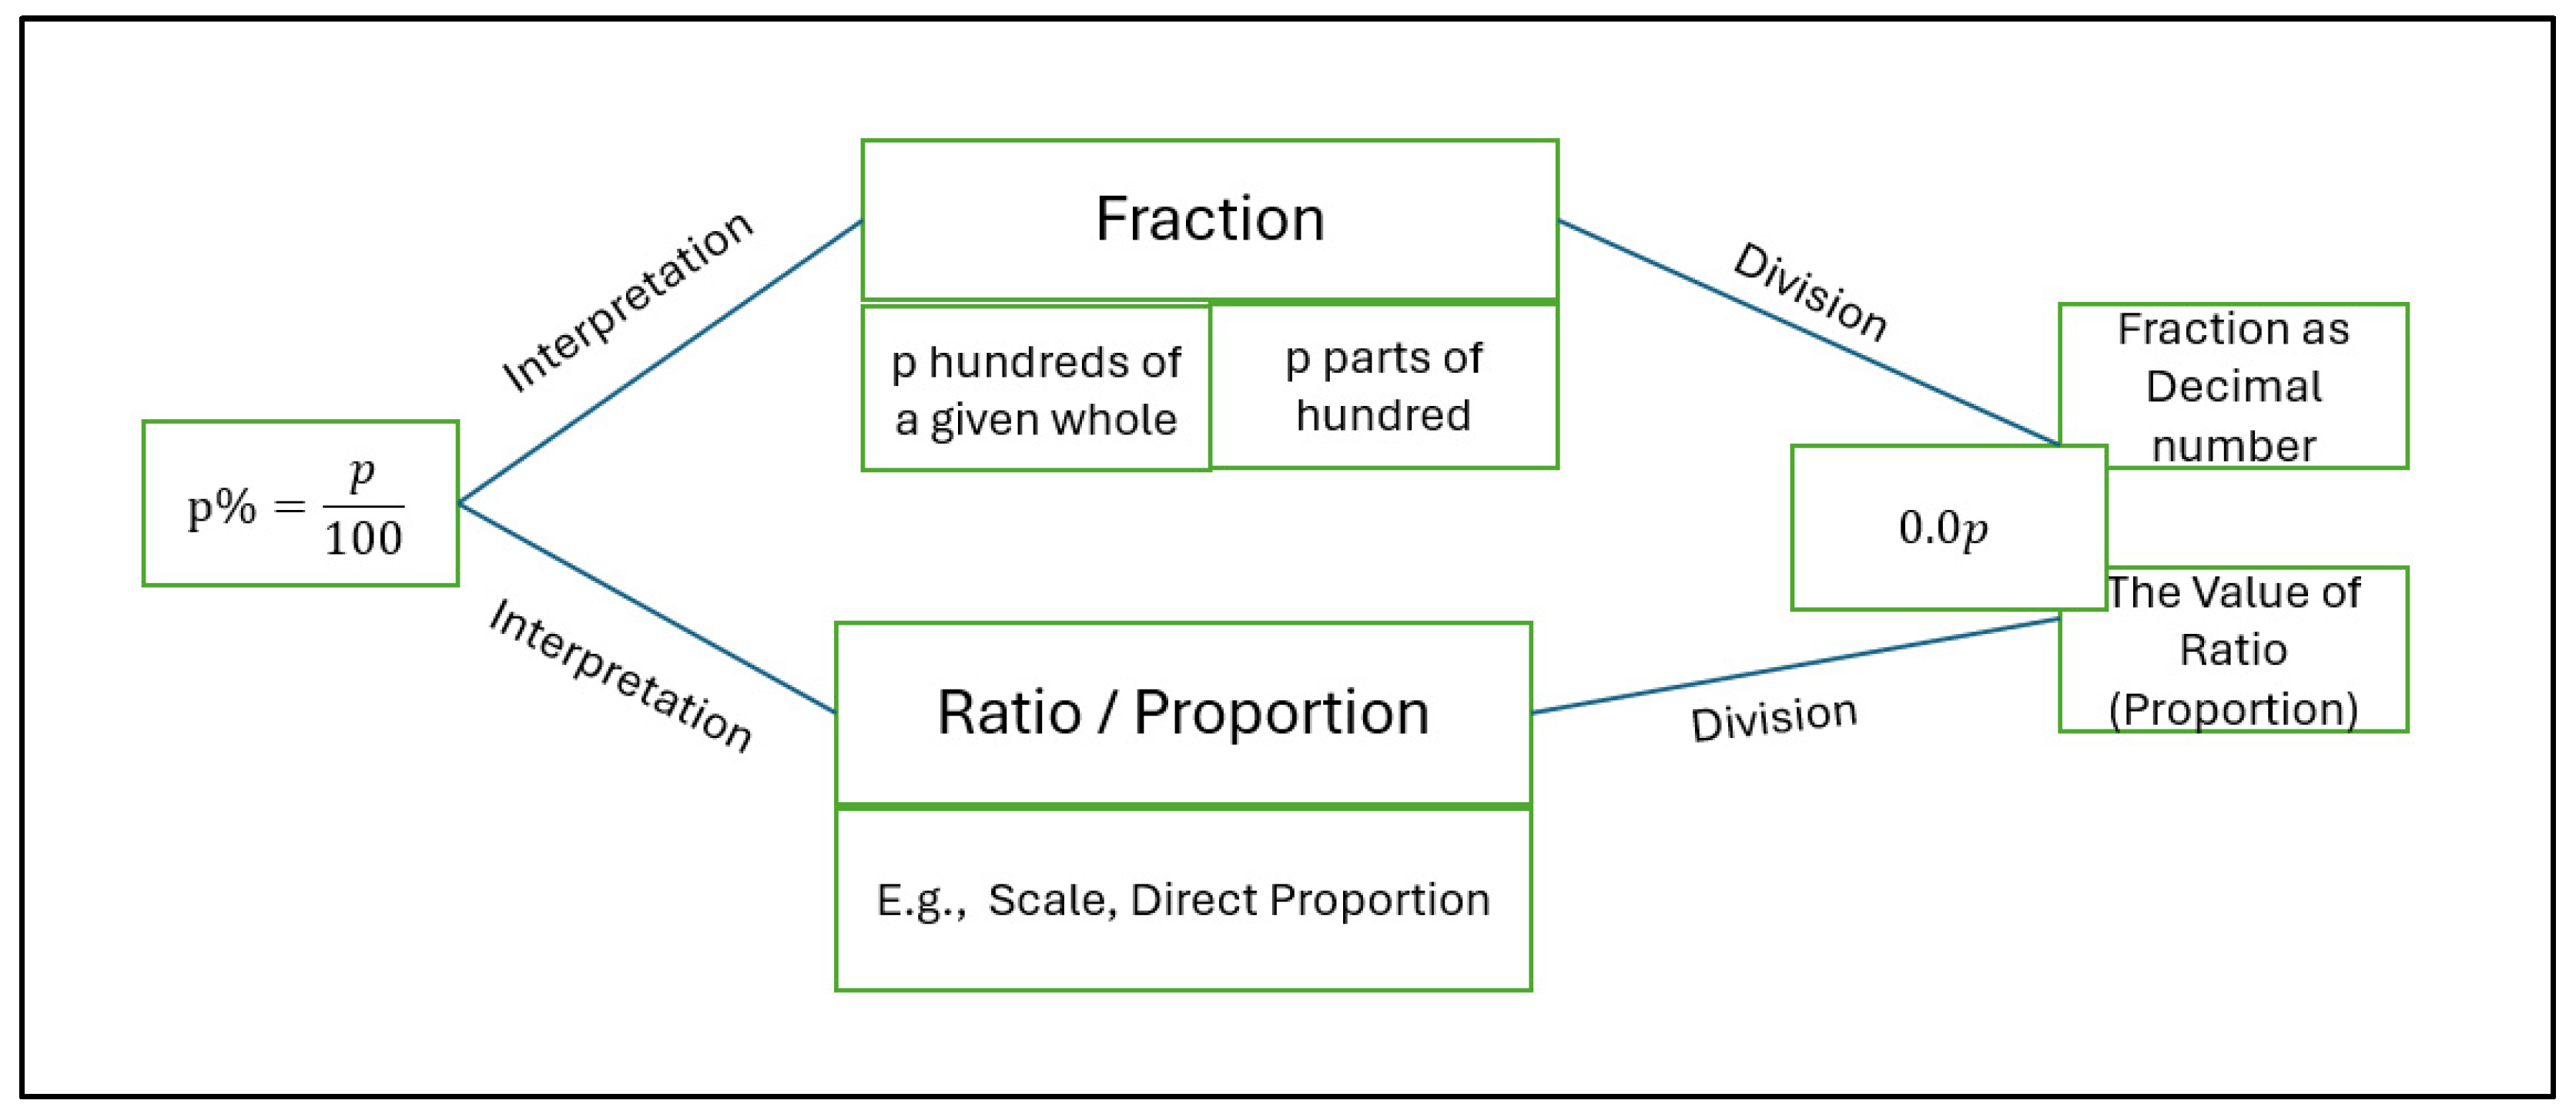
Figure 1. The mathematical symbolic text could have different interpretations depending on contexts. Here is one example of how the concepts of fraction, ratio, and division could be seen in the different interpretations of the given mathematical expression (p belongs to natural numbers).
Education 14 01043 g001
Figure 2. A multimodal approach to expressing mathematical thinking in school, reduced to four languages that students can use individually or in a variety of combinations [22,23,24,25]. The process is called languaging [8].
Education 14 01043 g002
Figure 3. Finnish students’ (grades 9–7) competence % (correct solution) in solving questions (Appendix A) related to percentage (questions Q1, Q2, Q4, Q5, Q6, and Q7) and ratio (question Q3) divided into different grade levels, 9–7. Number of students is indicated by N.
Education 14 01043 g003
Table 1. Contents of concepts percentage and ratio in the Finnish Core Curriculum [17].
GradesPercentageRatio
3–6Understanding the percentage and its value and practice calculating them in simple cases.
 
Connections between the concepts of fractions, decimals, and percentages.
Scale
 
Enlargement
 
Reduction
7–9Ensure understanding of the concept of the percentage.
 
Practice calculating the percentage and counting the amount of a whole number indicated by the percentage.
 
Learn to calculate the changed value, the base value, the percentage of change, and the reference percentage.
Proportion
 
Direct proportionality
 
Inverse proportion
Table 2. Type of expressions and the number of multimodal expressions in the answers to Q2b (Appendix A).
Grade Level/
Type of Expression
Grade 7
(N = 9)
Grade 8
(N = 69)
Grade 9
(N = 45)
Sum
(N = 123)
Pictures, etc.49922
Rectangle diagram07512
Line segment diagram0505
Tables091120
Pie chart1203
Arrows1719
Expressions only0181432
Other (including no answer312520
Halfway through)
Table 3. Examples of the students’ solutions to task Q2 (Appendix A) by the means of languaging. Task Q2 is as follows: “A company is selling 180 g of canned salmon; the weight of the salmon is 20% more than that sold in the previous year. What was the weight of the canned salmon sold in the previous year?”.
Student’s Response Number and
Grade Level
Mathematical Symbolic
Language
Pictorial
Language
Natural
Language
Student 142
Grade 7
Education 14 01043 i001Last year
Education 14 01043 i002
(A rectangle diagram)
20% is 1 5 , so you have to divide by six, because that is 6 5 , of last year’s weight, and then multiply by five to get last year’s weight.
Student 38
Grade 8
Education 14 01043 i003The starting point
Education 14 01043 i004
(Picture)
Student 71
Grade 8
Education 14 01043 i005Year
Education 14 01043 i006
Last year
(Arrows)
Student 228
Grade 9
x = original weight
Education 14 01043 i007
Education 14 01043 i008
Note! Uses the concepts of proportion and ratio.
(Table)
I used a table to form the equation.
I cross multiplied the quantities. An equation was created, and the solution gave me the answer.
In Finland students use decimal comma.
Table 4. Students’ answers for task Q2 (N = 580; the correct answer is 150 g).
Answer (g)N%
36.00 7 1
144.00 279 48
150.00 174 30
160.00 13 2
171.00 7 1
179.80 10 2
216.00 12 2
Others 78 13
Disclaimer/Publisher’s Note: The statements, opinions and data contained in all publications are solely those of the individual author(s) and contributor(s) and not of MDPI and/or the editor(s). MDPI and/or the editor(s) disclaim responsibility for any injury to people or property resulting from any ideas, methods, instructions or products referred to in the content.