
Validation of Educational Quality as a Tool to Measure the Degree of Satisfaction of University Students

 , ,
, ,
Abstract
:1. Introduction
2. Materials and Methods
3. Results
3.1. Exploratory Factor Analysis
3.2. Confirmatory Factor Analysis
4. Discussion
5. Conclusions
Author Contributions
Funding
Institutional Review Board Statement
Informed Consent Statement
Data Availability Statement
Conflicts of Interest
References
- United Nations Educational Scientific and Cultural Organization [UNESCO]. Education for Sustainable Development Goals, 441st ed.; UNESCO: Paris, France, 2017; pp. 1–68. Available online: https://unesdoc.unesco.org/ark:/48223/pf0000247444 (accessed on 29 September 2023).
- Casanova, M. El diseño curricular como factor de calidad educativa. Rev. Iberoam. Cal. Efic. Y Camb. Educ. 2012, 4, 7–20. [Google Scholar] [CrossRef]
- Ventura, A.C. Estilos de aprendizaje y prácticas de enseñanza en la universidad: Un binomio que sustenta la calidad educativa. Perf. Educ. 2011, 33, 142–154. [Google Scholar]
- Bernate, J.A.; Guataquira, A.; Romero, E.N.; Reyes, P.C. Satisfacción de la Calidad Educativa en Educación Superior. Podium 2020, 38, 37–50. [Google Scholar] [CrossRef]
- Avendaño, C.; William, R.; Montes, P.; Parada-Trujillo, L.; Abad, E. Estudio de factores de calidad educativa em diferentes instituciones educativas del municipio de Cúcuta. Investig. Des. 2016, 2, 329–354. [Google Scholar] [CrossRef]
- Llarena, M.; Villodre, S.; Pontorerio, F.; Cattapan, A. Modelo de sistema de gestión de calidad para la puesta en marca de cursos no presenciales: Instrumentos de seguimiento y evaluación. Form. Univ. 2014, 6, 3–16. [Google Scholar] [CrossRef]
- Campo, B.; Ciscar, J.; Souto, X.M. Los espacios de la periferia escolar. Scrip. Nova 2014, 18, 1–19. [Google Scholar]
- Fukuzaki, T.; Iwata, N. Association between the five-factor model of personality and work engagement: A meta-analysis. Ind. Health 2022, 60, 154–163. [Google Scholar] [CrossRef]
- Martínez, G.; Mapén, F.J.; Ortega, M.E. Clima organizacional y su impacto en la calidad educativa universitaria. Int. Journ. Educ. Res. Innov. 2021, 16, 55–73. [Google Scholar] [CrossRef]
- Teeroovengadum, V.; Kamalanabhan, T.J.; Seebaluck, A.K. Measuring service quality in higher education: Develop. of a hierarchical model (HESQUAL). Qual. Assur. Educ. 2016, 24, 244–258. [Google Scholar] [CrossRef]
- Lagunas, E.A.; Ramírez, D.M.; Téllez, E.A. Percepción de la calidad educativa: Caso aplicado a estudiantes de la Universidad Autónoma de Nuevo León y del Instituto Tecnológico de Estudios Superiores de Monterrey. Rev. Educ. Super. 2016, 45, 55–74. [Google Scholar] [CrossRef]
- Hwang, Y.-S.; Choi, Y.K. Higher education service quality and student satisfaction, institutional image, and behavioral intention. Soc. Behav. Personal. Int. J. 2019, 47, 1–12. [Google Scholar] [CrossRef]
- Prodanova, J.; Kocarev, L. Universities’ and Academics’ Resources Shaping Satisfaction and Engagement: An Empirical Investigation of the Higher Education System. Educ. Sci. 2023, 13, 390. [Google Scholar] [CrossRef]
- Tepayakul, R.; Rinthaisong, I. Job Satisfaction and Employee Engagement among Human Resources Staff of Thai Private Higher Education Institutions. Int. J. Behav. Sci. 2018, 13, 68–81. [Google Scholar]
- Álvarez, J.; Chaparro, E.; Reyes, D. Estudio de la Satisfacción de los estudiantes con los servicios educativos brindados por instituciones de eduación superior del Valle de Toluca. Rev. Iberoam. Cald. Efic. Camb. Educ. 2015, 2, 5–26. [Google Scholar] [CrossRef]
- Rochnia, M.; Radisch, F.; Kastens, C. Theory Application in School and Meaning-Oriented Learning Opportunities at University—Resources for Teaching Quality. Educ. Sci. 2023, 13, 381. [Google Scholar] [CrossRef]
- Aguila, V. El concepto calidad en educación universitaria: Clave para el logro de competitividad institucional. Rev. Iberoam. Educ. 2005, 36, 1–7. [Google Scholar] [CrossRef]
- Falabella, A.; Cortázar, A.; Godoy, F.; González, M.P.; Romo, F. Aseguramiento de la calidad en la educación infantil temprana: Lecciones de la experiencia internacional. Gest. Política Públ. 2018, 27, 309–340. [Google Scholar] [CrossRef]
- Lesbia, C.; Torres, G.A.; Miranda, S.O.; Pernett, J.C. Calidad educativa como base de la transformación universitaria: Encuentros. Rev. Hum. Teor. Soc. Pensam. Crítico 2021, 13, 192–200. [Google Scholar] [CrossRef]
- Olmos-Gómez, M.d.C.; Luque-Suárez, M.; Ferrara, C.; Cuevas-Rincón, J.M. Quality in Higher Education and Satisfaction among Professors and Students. Eur. J. Investig. Health Psychol. Educ. 2021, 11, 219–229. [Google Scholar] [CrossRef]
- Méndez, C.; Rondón, M.A. Introducción al análisis factorial exploratorio. Rev. Colomb. Psiq. 2012, 41, 197–207. [Google Scholar]
- Elosua, P.; Zumbo, B. Reliability coefficients for ordinal response scales. Psicothema 2008, 20, 896–901. [Google Scholar]
- Cabezas, R.; Aguirre, C.M.; Cabezas, J.A.; Izquierdo, D.R. Validez factorial del Maslach Burnout inventory version española en una población multiocupacional ecuatoriana. Sapienza Inter. J. Interdisciplin. Stud. 2022, 1, 776–785. [Google Scholar] [CrossRef]
- Barrios, M.; Coscullela, A. Fiabilidad. In Psicometría; Editorial UOC: Barcelona, Spain, 2013; pp. 75–140. [Google Scholar]
- Manzano, A. Introducción a los modelos de ecuación estructurales. Rev. Investig. Educ. Med. 2018, 25, 368–952. [Google Scholar] [CrossRef]
- Kline, R.B. Convergencia del Modelado de Ecuaciones Estructurales y Modelado Multinivel. In Hanbook of Innovation in Social Research Methods; SAGE: Newcastle upon Tyne, UK, 2018. [Google Scholar] [CrossRef]
- Ruiz, M.A.; Pardo, A.; San Martín, R. Modelos de ecuaciones estructurales. Pap. Psic. 2010, 1, 34–45. [Google Scholar]
- Gimenez, V. Gestión Universitaria e información. Bibl. Canales Investig. 2021, 4, 1–4. [Google Scholar]
- Córdoba, N.C.; Cuahonte, L.C.; Hernandez, G. Creación y aplicación de recursos materiales online para lograr aprendizajes significativos en primaria, bachillerato y universidad. Perspect. Doc. 2014, 54, 23–30. [Google Scholar] [CrossRef]
- Garay, U.; Tejada, E.; Romaero, A. Rendimiento y satisfacción de estudiantes universitarios en una comunidad en línea de prácticas. Rev. Mex. Investig. Educ. 2017, 75, 1239–1256. [Google Scholar]
- Bentler, P.M. Sobre pruebas e índices para evaluar modelos estructurales. Person. Dif. Ind. 2007, 5, 825–829. [Google Scholar] [CrossRef]
- Herrero, J. El análisis factorial confirmatorio en el estudio de la estructura y estabilidad de los instrumentos de evaluación: Un ejemplo con el cuestionario de autoestima CA-14. Phychosoc. Interv. 2010, 3, 12–36. [Google Scholar] [CrossRef]
- Olivero-Sánchez, F.; Valdano-Cabezas, G.; Iglesias-Mora, M. Sistema de evaluación, seguimiento y acreditación de la calidad educativa en Venezuela. Mito O Real. Rev. Cienc. Unemi. 2017, 10, 119–128. [Google Scholar]
- Bonifaz, E.F.; Barba, E. La calidad de la educación universitaria: Una visión desde el direccionamiento y la gestión estratégica. Rev. Boletín Redipe. 2019, 8, 106–116. [Google Scholar] [CrossRef]
- Olano del Castillo, R. Gestión estratégica, Políticas y Calidad educativa en el Contexto Universitario. REICE. Rev. Electrónica de Investig. en Cienc. Económicas 2020, 8, 26–38. [Google Scholar] [CrossRef]
- Olmos-Gómez, M.d.C.; Luque-Suárez, M.; Ferrara, C.; Olmedo-Moreno, E.M. Quality of Higher Education through the Pursuit of Satisfaction with a Focus on Sustainability. Sustainability 2020, 12, 2366. [Google Scholar] [CrossRef]
- Correia, S.M.; Miranda, F.J. DUAQUAL: Calidad percibida por docentes y alumnos en la gestión universitaria. Cuad. de Gest. 2012, 12, 107–122. [Google Scholar] [CrossRef]
- Montoya, C.A.; Boyero, M.R. El recurso humano como elemento fundamental para la gestión de calidad y la competitividad organizacional. Rev. Cient. Visión de Futuro 2016, 20, 1–20. [Google Scholar]
- Vergara, J.C.; Quesada, V.M. Análisis de la calidad en el servicio y satisfacción de los estudiantes de Ciencias Económicas de la Universidad de Cartagena mediante un modelo de ecuaciones estructurales. Rev. Electron. Investig. Educ. 2011, 13, 108–122. [Google Scholar]
- Urrea, P.; Bernate, J.; Fonseca, I.; Martínez, A. Impacto social de los graduados de la Licenciatura en Educación Física, Recreación y Deporte UNIMINUTO. Educ. Fís. Cienc. 2020, 20, 52–53. [Google Scholar] [CrossRef]
- Martínez-Martínez, A.; Olmos-Gómez, M.D.C.; Tomé-Fernández, M.; Olmedo-Moreno, E.M. Analysis of Psychometric Properties and Validation of the Personal Learning Environments Questionnaire (PLE) and Social Integration of Unaccompanied Foreign Minors (MENA). Sustainability 2019, 11, 2903. [Google Scholar] [CrossRef]
- Long, J. Covariance Structure Models: An Introduction to LISREL; Sage University Paper Series on Quantitative Applications in the Social Sciences; SAGE Publications Inc.: Newbury Park, CA, USA, 1990. [Google Scholar]
- Broadbent, J.; Poon, W.L. Self-regulated learning strategies and academic achievement in online higher education learning enviroments: A systematic review. Int. High. Educ. 2015, 27, 1–13. [Google Scholar] [CrossRef]
- Ibarra-Sáiz, M.S.; Lukas-Mujika, J.F.; Ponce-González, N.; Rodríguez-Gómez, G. Percepción del profesorado universitario sobre la calidad de las tareas de evaluación de los resultados de aprendizaje. RELIEVE 2023, 29, 1–21. [Google Scholar] [CrossRef]
- Pedraja-Rejas, L.; Marchioni-Choque, Í.A.; EspinozaMarchant, C.J.; Muñoz-Fritis, C.P. Liderazgo y cultura organizacional como factores de influencia en la calidad universitaria: Un análisis conceptual. Form. Univ. 2020, 13, 3–14. [Google Scholar] [CrossRef]
- Hernández, H.; Martínez, D.; Rodríguez, J. Gestión de la calidad aplicada en el mejoramiento del sector universitario. Rev. Esp. 2017, 38, 29. [Google Scholar]

| Items | Asymmetry | Kurtosis |
|---|---|---|
| 1. Faculty’s management of its teaching resources | −0.175 | 0.812 |
| 2. The undergraduate/postgraduate university’s coordination of its teaching activities | −0.161 | −0.116 |
| 3. Existing faculty regulations | −0.063 | −0.303 |
| 4. Communication between students and teaching staff | −0.075 | −0.558 |
| 5. The general level of satisfaction with the university degree/postgraduate course | 0.075 | −0.360 |
| 6. Access to information regarding the undergraduate/postgraduate syllabus (media or web page) | 0.105 | −0.792 |
| 7. The information service of the undergraduate/postgraduate curriculum | 0.086 | −0.208 |
| 8. New student orientation | 0.076 | −0.460 |
| 9. Satisfaction with the competences offered in the university curriculum | 0.174 | 0.280 |
| 10. Subjects in the university curriculum | 0.060 | −0.313 |
| 11. Teaching methodology in the curriculum | 0.267 | −0.300 |
| 12. Satisfaction level regarding internships offered | −0.076 | 0.055 |
| 13. Extra-curricular activities that contribute to students’ development and integral formation | −0.200 | −0.029 |
| 14. The existing relationship between the faculty’s training activities and other external institutions | −0.088 | 0.074 |
| 15. Evaluation methods used | −0.348 | 0.575 |
| 16. Level of satisfaction with the university degree/postgraduate course | −0.140 | 0.119 |
| 17. Teacher involvement in curriculm teaching and learning methods | −0.192 | −0.041 |
| 18. Degree of collaboration between students | 0.275 | −0.140 |
| 19. Degree of professional involvement with students | 0.021 | −0.124 |
| 20. Degree of satisfaction with the educational community | −0.159 | 0.041 |
| 21. The state of classrooms and equipment | −0.049 | −0.421 |
| 22. Access to bibliographic resources (web pages, books, etc.) | −0.050 | −0.504 |
| 23. ICT use in teaching and learning processes | −0.208 | −0.023 |
| 24. Space available for independent work | −0.243 | −0.158 |
| 25. Access to the faculty’s internet network | −0.107 | −0.496 |
| 26. Degree of satisfaction with material resources and facilities | −0.167 | 0.233 |
| Items | Factors | Comunalities | ||
|---|---|---|---|---|
| 1 | 2 | 3 | ||
| 1. Faculty’s management of its teaching resources | 0.582 | −0.107 | 0.050 | 0.353 |
| 2. The undergraduate/postgraduate university’s coordination of its teaching activities | 0.634 | −0.343 | 0.001 | 0.519 |
| 3. Existing faculty regulations | 0.581 | −0.204 | 0.070 | 0.384 |
| 4. Communication between students and teaching staff | 0.699 | −0.288 | 0.037 | 0.573 |
| 5. The general level of satisfaction with the university undergraduate/postgraduate degree | 0.637 | −0.231 | 0.287 | 0.542 |
| 6. Access to information regarding the undergraduate/postgraduate syllabus (media or web page) | 0.640 | −0.194 | 0.323 | 0.552 |
| 7. The information service of the university undergraduate/postgraduate curriculum | 0.606 | −0.354 | 0.323 | 0.597 |
| 8. New student orientation | 0.612 | −0.076 | −0.169 | 0.409 |
| 9. Satisfaction with the competences offered in the university curriculum | 0.739 | −0.117 | −0.102 | 0.570 |
| 10. Subjects in the university curriculum | 0.608 | −0.227 | −0.021 | 0.422 |
| 11. Teaching methodology in the curriculum | 0.752 | −0.063 | −0.017 | 0.570 |
| 12. Satisfaction level regarding internships offered | 0.580 | 0.098 | −0.438 | 0.538 |
| 13. Extra-curricular activities that contribute to student’s development and integral formation | 0.528 | −0.036 | −0.566 | 0.601 |
| 14. The existing relationship between the faculty’s training activities and other external institutions | 0.630 | −0.004 | −0.375 | 0.537 |
| 15. Evaluation methods used | 0.633 | 0.270 | −0.189 | 0.509 |
| 16. Level of satisfaction with the university degree/postgraduate course | 0.659 | −0.291 | 0.040 | 0.520 |
| 17. Teacher involvement in curriculum teaching and learning methods | 0.745 | −0.043 | −0.133 | 0.575 |
| 18. Degree of collaboration between students | 0.534 | −0.124 | −0.067 | 0.305 |
| 19. Degree of professional involvement with students | 0.725 | 0.156 | −0.112 | 0.562 |
| 20. Degree of satisfaction with the educational community | 0.709 | 0.117 | −0.127 | 0.533 |
| 21. The state of classrooms and equipment | 0.622 | 0.447 | 0.163 | 0.613 |
| 22. Access to bibliographic resources (web pages, books, etc.) | 0.631 | 0.183 | 0.393 | 0.586 |
| 23. ICT use in teaching and learning processes | 0.615 | 0.328 | 0.284 | 0.567 |
| 24. Space available for independent work | 0.604 | 0.389 | 0.120 | 0.530 |
| 25. Access to the faculty’s internet network | 0.394 | 0.262 | 0.124 | 0.239 |
| 26. Degree of satisfaction with material resources and facilities | 0.617 | 0.580 | 0.066 | 0.721 |
| Model | NPAR | X2 | df | p | X2/gl |
|---|---|---|---|---|---|
| Default model | 70 | 484.186 | 229 | 0.000 | 2.114 |
| Saturated model | 299 | 0.000 | 0 | ||
| Independence model | 23 | 2449.179 | 276 | 0.000 | 8.874 |
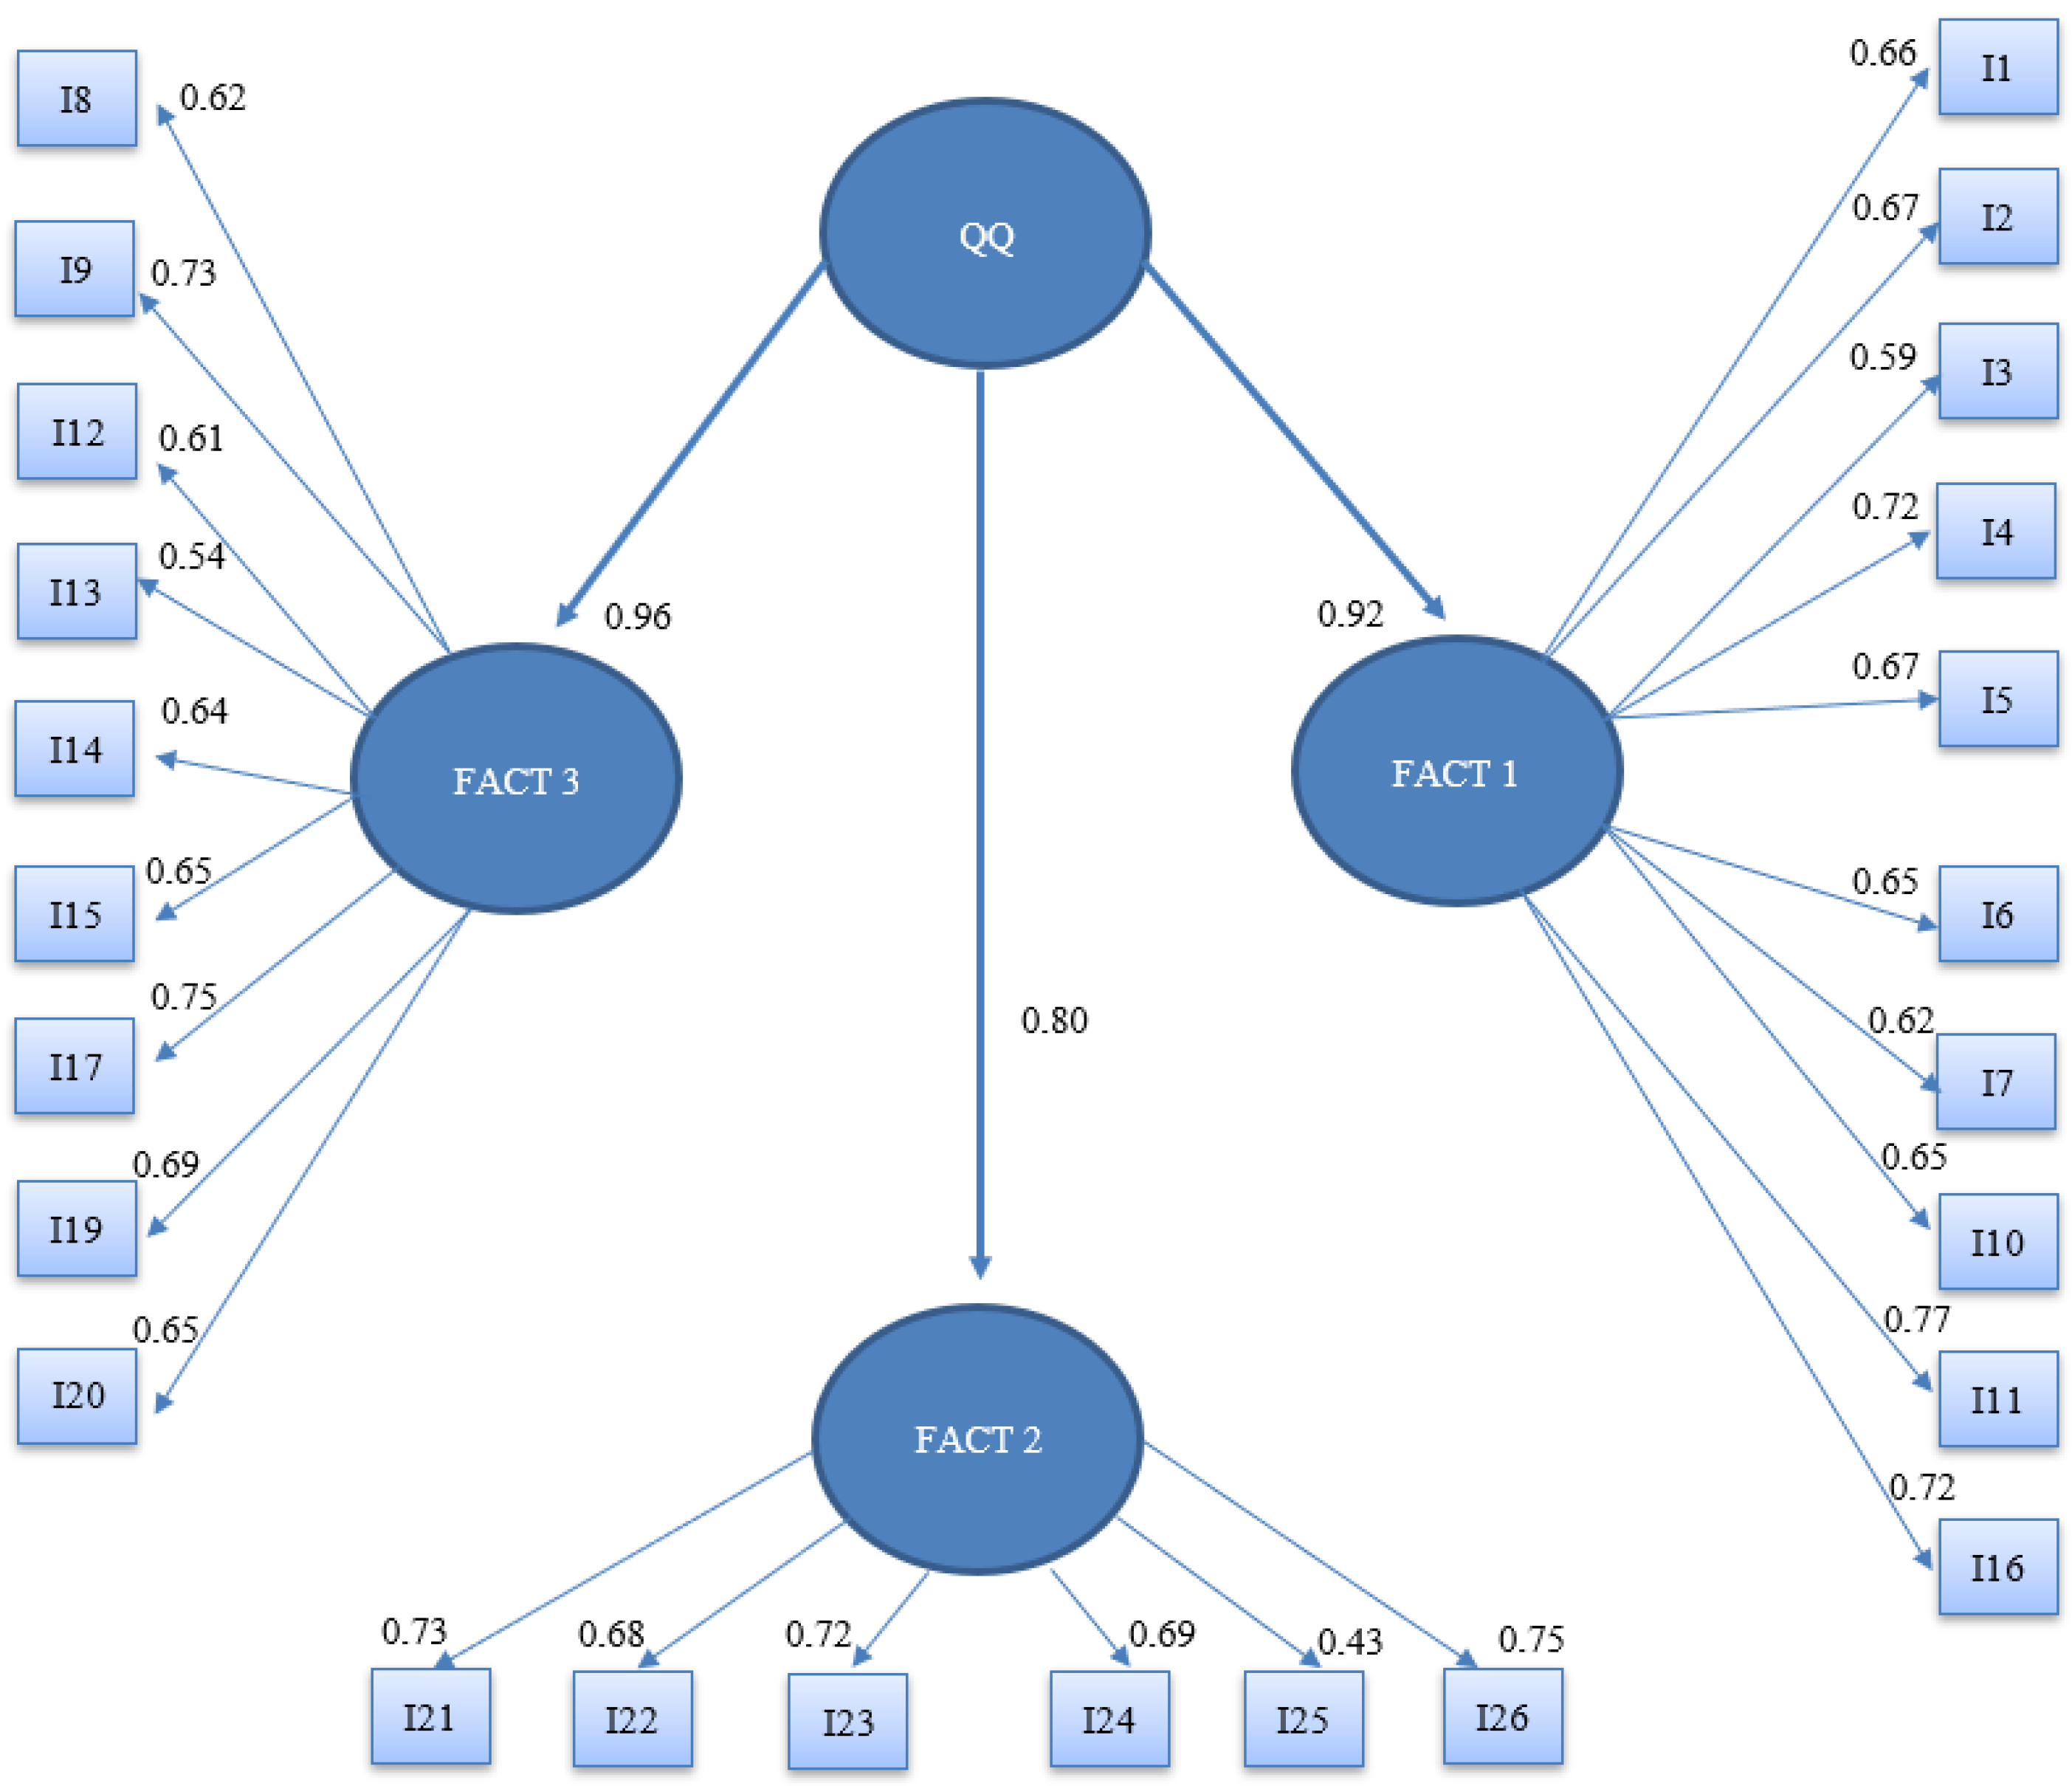
| Item | Estimate | S.E. | C.R. | p | SRW | ||
|---|---|---|---|---|---|---|---|
| FACT3 | <--- | 1.000 | 0.963 | ||||
| FACT2 | <--- | 1.000 | 0.802 | ||||
| FACT1 | <--- | 1.000 | 0.921 | ||||
| I1 | <--- | FACT1 | 1.000 | 0.663 | |||
| I2 | <--- | FACT1 | 1.064 | 0.108 | 9.842 | *** | 0.665 |
| I3 | <--- | FACT1 | 1.007 | 0.119 | 8.486 | *** | 0.587 |
| I4 | <--- | FACT1 | 1.328 | 0.123 | 10.838 | *** | 0.724 |
| I5 | <--- | FACT1 | 1.027 | 0.103 | 9.991 | *** | 0.675 |
| I6 | <--- | FACT1 | 1.079 | 0.113 | 9.535 | *** | 0.648 |
| I7 | <--- | FACT1 | 0.952 | 0.104 | 9.128 | *** | 0.624 |
| I10 | <--- | FACT1 | 0.970 | 0.100 | 9.655 | *** | 0.655 |
| I11 | <--- | FACT1 | 1.195 | 0.101 | 11.849 | *** | 0.773 |
| I16 | <--- | FACT1 | 1.115 | 0.102 | 10.893 | *** | 0.723 |
| I20 | <--- | FACT3 | 1.000 | 0.650 | |||
| I19 | <--- | FACT3 | 1.120 | 0.109 | 10.271 | *** | 0.692 |
| I17 | <--- | FACT3 | 1.168 | 0.104 | 11.274 | *** | 0.747 |
| I15 | <--- | FACT3 | 1.021 | 0.106 | 9.605 | *** | 0.655 |
| I14 | <--- | FACT3 | 1.069 | 0.115 | 9.316 | *** | 0.639 |
| I13 | <--- | FACT3 | 0.949 | 0.123 | 7.713 | *** | 0.541 |
| I12 | <--- | FACT3 | 1.076 | 0.123 | 8.760 | *** | 0.605 |
| I9 | <--- | FACT3 | 1.065 | 0.097 | 10.998 | *** | 0.733 |
| I8 | <--- | FACT3 | 1.192 | 0.133 | 8.989 | *** | 0.620 |
| I26 | <--- | FACT2 | 1.000 | 0.748 | |||
| I25 | <--- | FACT2 | 0.689 | 0.116 | 5.931 | *** | 0.433 |
| I24 | <--- | FACT2 | 1.021 | 0.100 | 10.187 | *** | 0.692 |
| I23 | <--- | FACT2 | 1.077 | 0.101 | 10.662 | *** | 0.718 |
| I22 | <--- | FACT2 | 1.014 | 0.102 | 9.965 | *** | 0.680 |
| I21 | <--- | FACT2 | 1.175 | 0.108 | 10.861 | *** | 0.730 |
| Model | CMIN | p | Absolute Adjustment Indexes | Incremental Adjustment Indexes | ||||
|---|---|---|---|---|---|---|---|---|
| LO 90 | HI 90 | RMSEA | NFI | CFI | TLI | |||
| M 1:3 factors, 25 items | 606.705 | 0.000 | 0.070 | 0.086 | 0.058 | 0.773 | 0.858 | 0.832 |
| M 2:3 factors, 23 items | 484.186 | 0.000 | 0.066 | 0.084 | 0.045 | 0.892 | 0.903 | 0.901 |
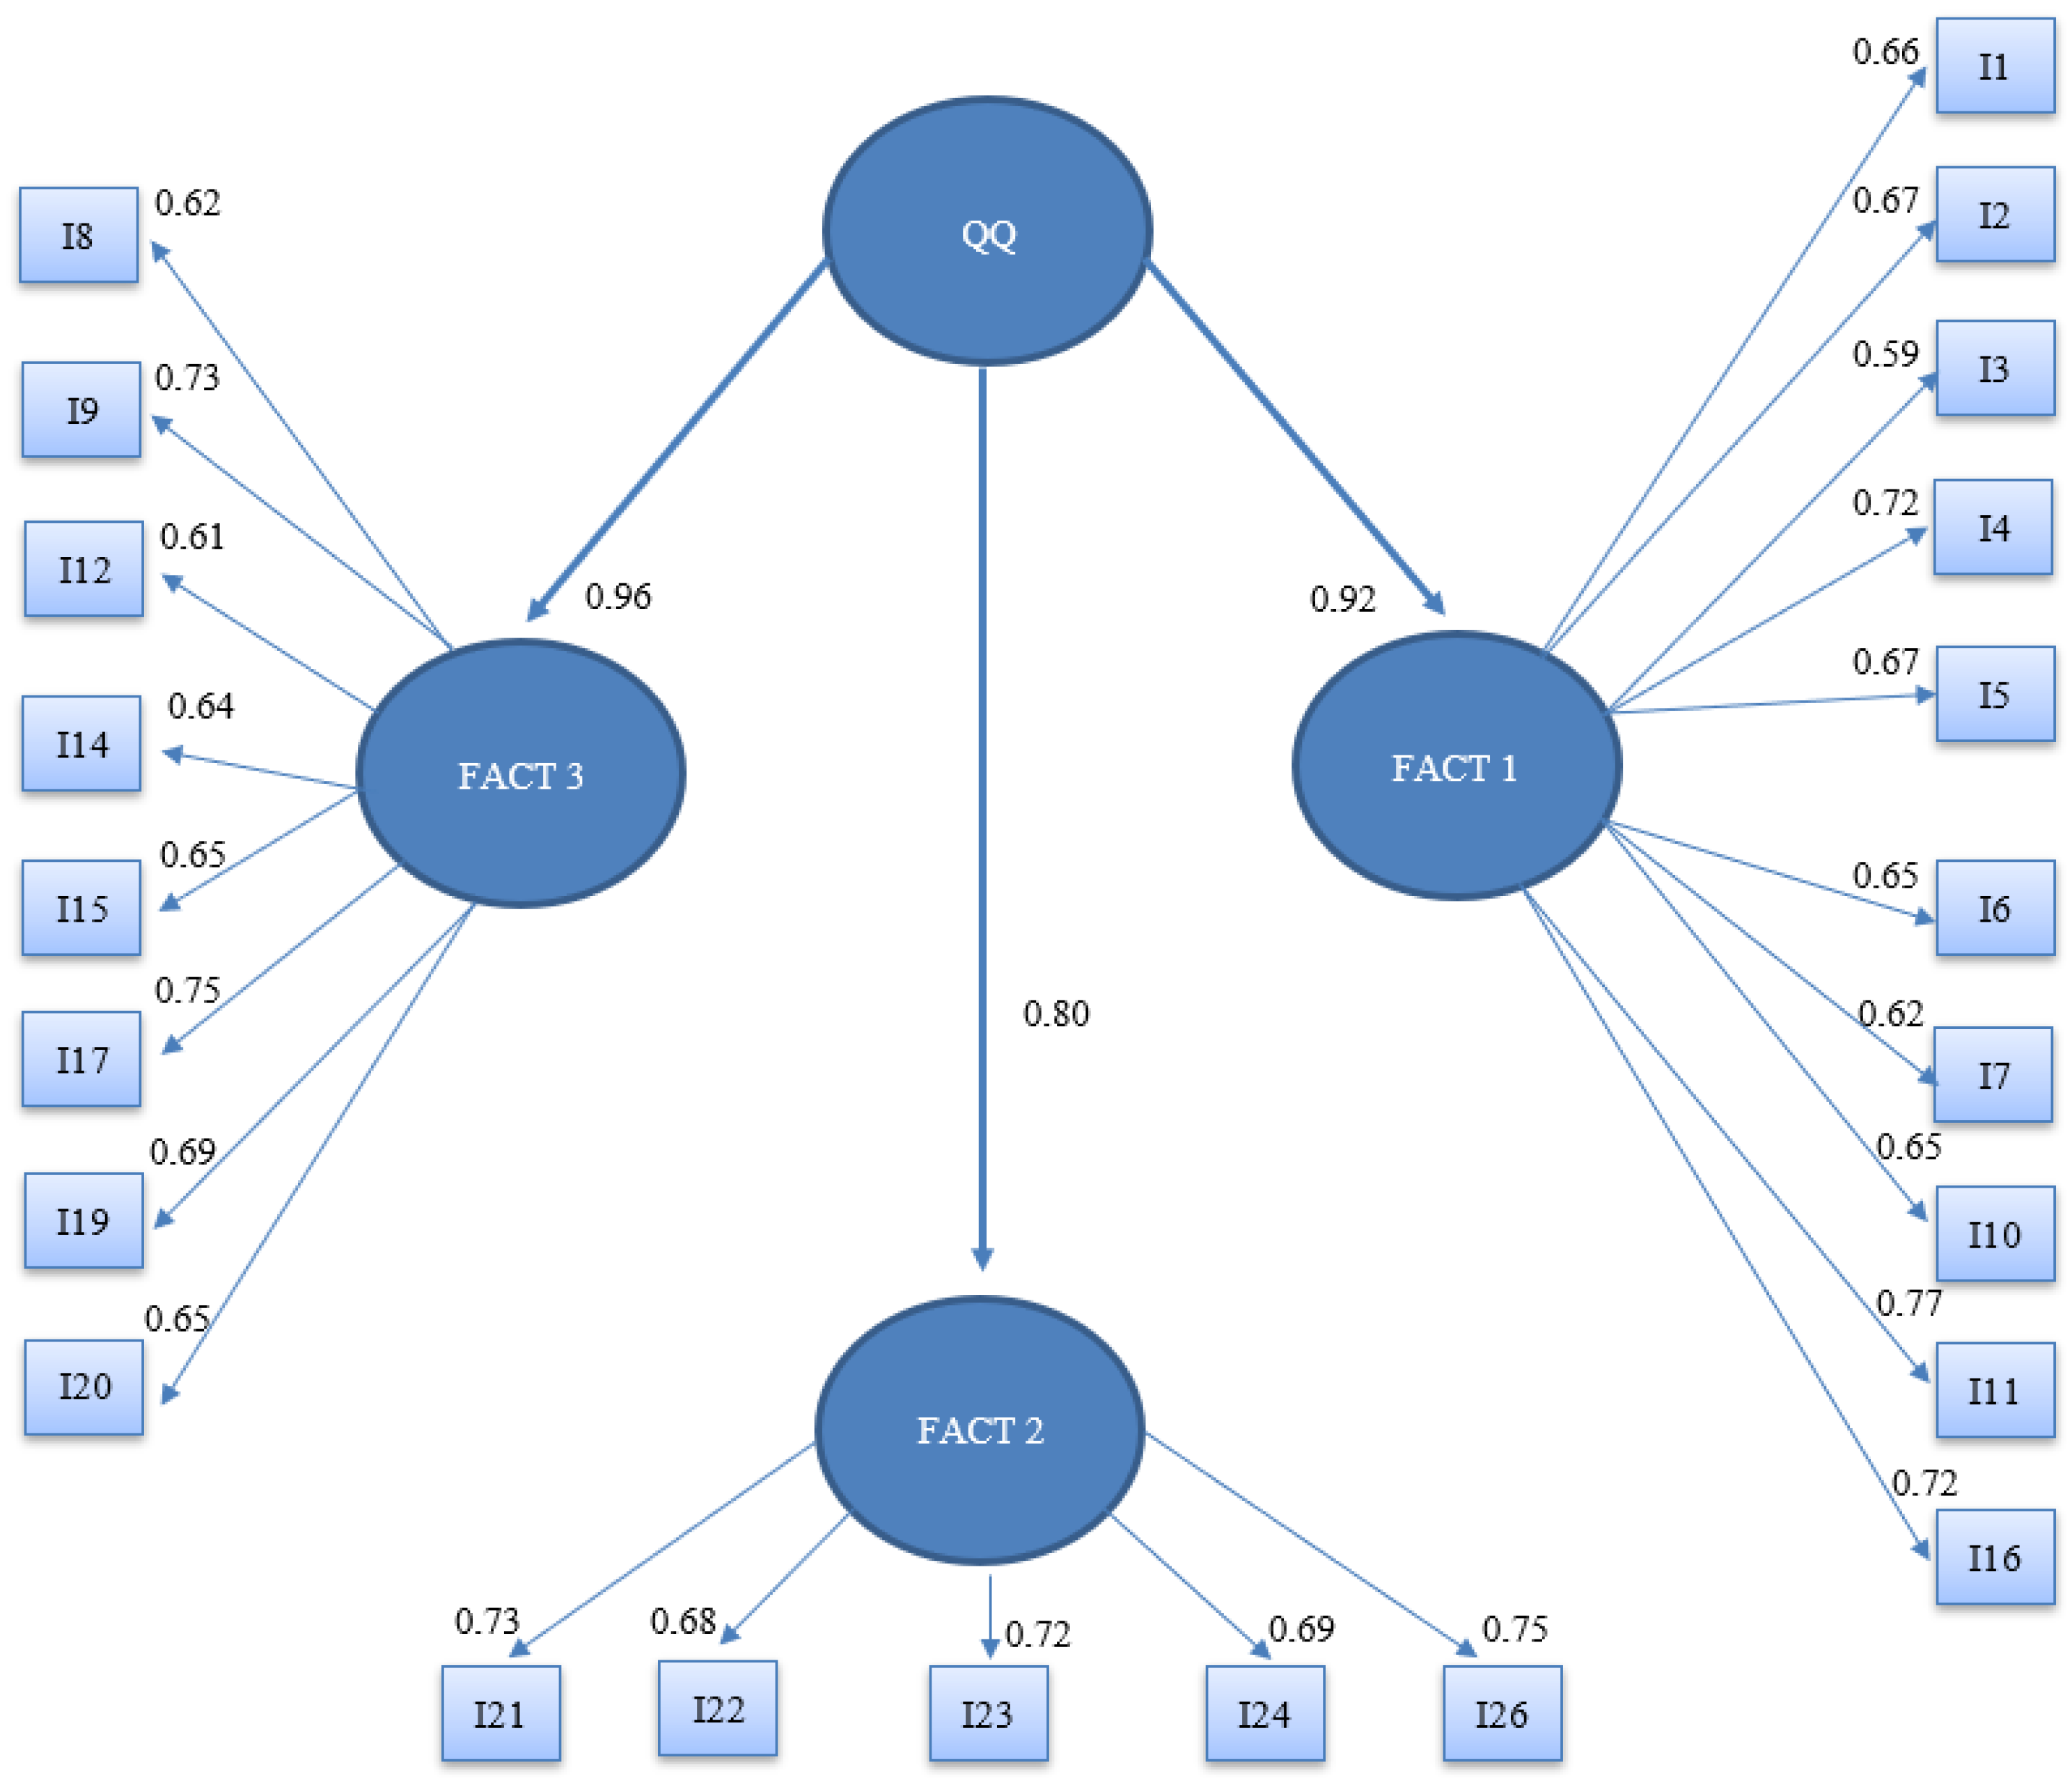
| Item | Estimate | S.E. | C.R. | p | SRW | ||
|---|---|---|---|---|---|---|---|
| FACT3 | <--- | 1.000 | 0.981 | ||||
| FACT2 | <--- | 1.000 | 0.808 | ||||
| FACT1 | <--- | 1.000 | 0.917 | ||||
| I1 | <--- | FACT1 | 1.000 | 0.665 | |||
| I2 | <--- | FACT1 | 1.059 | 0.107 | 9.851 | *** | 0.665 |
| I3 | <--- | FACT1 | 1.004 | 0.118 | 8.514 | *** | 0.588 |
| I4 | <--- | FACT1 | 1.319 | 0.122 | 10.836 | *** | 0.723 |
| I5 | <--- | FACT1 | 1.028 | 0.102 | 10.075 | *** | 0.678 |
| I6 | <--- | FACT1 | 1.069 | 0.113 | 9.500 | *** | 0.645 |
| I7 | <--- | FACT1 | 0.944 | 0.104 | 9.104 | *** | 0.622 |
| I10 | <--- | FACT1 | 0.969 | 0.100 | 9.715 | *** | 0.657 |
| I11 | <--- | FACT1 | 1.194 | 0.100 | 11.934 | *** | 0.776 |
| I16 | <--- | FACT1 | 1.109 | 0.102 | 10.913 | *** | 0.723 |
| I20 | <--- | FACT3 | 1.000 | 0.642 | |||
| I19 | <--- | FACT3 | 1.153 | 0.111 | 10.417 | *** | 0.700 |
| I17 | <--- | FACT3 | 1.196 | 0.105 | 11.360 | *** | 0.750 |
| I15 | <--- | FACT3 | 1.042 | 0.108 | 9.628 | *** | 0.656 |
| I14 | <--- | FACT3 | 1.054 | 0.118 | 8.960 | *** | 0.618 |
| I12 | <--- | FACT3 | 1.072 | 0.126 | 8.538 | *** | 0.592 |
| I9 | <--- | FACT3 | 1.086 | 0.099 | 11.014 | *** | 0.733 |
| I8 | <--- | FACT3 | 1.208 | 0.135 | 8.939 | *** | 0.617 |
| I26 | <--- | FACT2 | 1.000 | 0.739 | |||
| I24 | <--- | FACT2 | 1.029 | 0.101 | 10.144 | *** | 0.692 |
| I23 | <--- | FACT2 | 1.084 | 0.102 | 10.587 | *** | 0.717 |
| I22 | <--- | FACT2 | 1.031 | 0.103 | 10.034 | *** | 0.686 |
| I21 | <--- | FACT2 | 1.208 | 0.109 | 11.078 | *** | 0.744 |
Disclaimer/Publisher’s Note: The statements, opinions and data contained in all publications are solely those of the individual author(s) and contributor(s) and not of MDPI and/or the editor(s). MDPI and/or the editor(s) disclaim responsibility for any injury to people or property resulting from any ideas, methods, instructions or products referred to in the content. |
© 2023 by the authors. Licensee MDPI, Basel, Switzerland. This article is an open access article distributed under the terms and conditions of the Creative Commons Attribution (CC BY) license (https://creativecommons.org/licenses/by/4.0/).
Share and Cite
Olmos-Gómez, M.d.C.; Luque-Suárez, M.; Castán-García, M.; Portillo-Sánchez, R. Validation of Educational Quality as a Tool to Measure the Degree of Satisfaction of University Students. Educ. Sci. 2024, 14, 2. https://doi.org/10.3390/educsci14010002
Olmos-Gómez MdC, Luque-Suárez M, Castán-García M, Portillo-Sánchez R. Validation of Educational Quality as a Tool to Measure the Degree of Satisfaction of University Students. Education Sciences. 2024; 14(1):2. https://doi.org/10.3390/educsci14010002
Chicago/Turabian StyleOlmos-Gómez, María del Carmen, Mónica Luque-Suárez, María Castán-García, and Raquel Portillo-Sánchez. 2024. "Validation of Educational Quality as a Tool to Measure the Degree of Satisfaction of University Students" Education Sciences 14, no. 1: 2. https://doi.org/10.3390/educsci14010002
APA StyleOlmos-Gómez, M. d. C., Luque-Suárez, M., Castán-García, M., & Portillo-Sánchez, R. (2024). Validation of Educational Quality as a Tool to Measure the Degree of Satisfaction of University Students. Education Sciences, 14(1), 2. https://doi.org/10.3390/educsci14010002