Abstract
Introducing computational thinking at elementary school can develop students’ capabilities and interest in Computing skills. In this study, we introduced the Computer Science unplugged (CS-unplugged) technique in Pakistan. We use paper-based activities to equip students with basic Computer Science skills without introducing any programming language. This study contributes twofold: First, we report the impact of CS-Unplugged training on more than 350 elementary students. The empirical study reveals that the students perform better in solving problems after unplugged training. Improved results in the post-training activity support this impact. Second, we applied machine learning to predict students’ performance. We employed different supervised machine learning algorithms to predict the students’ performance. Our results indicate that the Logistic regression-based model can predict the positive response of the student with a 0.91 receiver operating characteristic curve (ROC curve). This pilot study results encourage introducing unplugged techniques at elementary schools in third-world countries. The goal is to have minimal changes in infrastructure and focus on better student learning. In the future, we plan to introduce more unplugged problem-solving techniques to elementary students by providing little training to the science or math teacher.
1. Introduction
Pakistan’s educational system is struggling to attain the sustainable development goal articulated by the UN. By 2030, “Ensure inclusive and equitable quality education and promote lifelong learning opportunities for all”. However, the latest education reports state alarming statistics in every aspect [1]. About 22 million children aged 5–16 have never been to school. Also, the dropout rate is very high, and enrollment for grade 3 is reported at 16%, which decreases to 4% at grade 10. Unlike these statistics, Islamabad, the capital of Pakistan, has a 91% enrollment. These figures reflect that the literacy rate is not uniformly distributed in all cities of the country. These elementary students do not own any form of computer and do not have access to the internet as well.
These students are mainly introduced to Mathematics, Literacy in English and Urdu, science, and social studies. The report does not have any data about computer science studies. In 1998, some efforts were made to integrate computers into the everyday teaching curriculum in Pakistan [2]. However, even after twenty years, either Computer Science is not being taught in many schools, or there is no course material present on the subject.
Unlike other primary subjects like mathematics and science, computer science is given minimal attention in Pakistani elementary schools. Many schools still do not have computer labs. We surveyed public elementary schools in Islamabad and found that there were only 1 out of 20 schools with a computer lab. Also, there is an acute shortage of trained faculty to teach students the fundamental principles of computing, especially in rural areas.
The current limitations end up with a lack of infrastructure and a lack of skilled human resources to bring in computer science studies at the elementary level. However, committed to the mission of teaching problem-solving skills at a young age, we introduced Computer Science Unplugged (CS-Unplugged) in an elementary school in Pakistan to understand the feasibility and sustainability of our mission.
CS-Unplugged is a way of imparting computer science fundamentals through interactive activities. The activities can be done using simple educational materials like papers and cards. The activities are designed and performed in such a way that helps students to understand the concepts of Computational thinking. The main goal of these activities is to provide hands-on experience to make Computer Science an interesting and fun course without introducing any programming language or computers. These activities help students develop Computational thinking.
Students have the greatest ability to develop such skills at a younger age [3]. The ability to learn and develop new skills is also formed in the early years. According to Piaget’s five stages of cognitive development, a child between ages 7 and 11 develops complex problem-solving skills [4]. Therefore, CS unplugged activities can greatly improve analytical thinking among elementary students.
Besides, the teacher who performs these activities with the students does not necessarily have to be a computer science major. Any Math or Science teacher can perform these activities with minimal training. CS unplugged overcomes the barrier of learning a programming language to understand how a computer works to solve problems. These activities can also help to develop an interest in students for computers who may not own one or have access to them. These activities are simple yet powerful in delivering the concept.
CS-unplugged is a way to instill Computational thinking. Computational thinking (CT) was a term first coined by Papert [5], who defined it as procedural thinking and programming. Later, Wing [6] defined CT as a problem-solving skill set that everyone could learn. CT in academia refers to the processes that enable students to formulate problems and identify solutions that are presented in a form that could be conducted by information processing and programmable agents [7].
CT can be applied to different kinds of problems that do not necessarily include programming [8]. The terms commonly used in CT are (1) Sequencing: a cognitive ability that generates skills to arrange objects or actions in the correct order [9]. (2) Conditionals: Instructions to make decisions when given some conditions [10]. (3) Iterations/loops: Repeated processes in which the code segment is executed once [11]. (4) Testing and debugging: The process of finding bugs and errors and how learners correct the bugs found during testing [10]. (5) Pattern recognition: creating rules and observing patterns in data [12]. (6) Modularity: A divide and conquer skill to separate the problems into smaller problems through sub-program/modules [13]. (7) Algorithm Design: Creating an ordered series of instructions to solve similar problems or to perform a task [13].
In one study, the researchers utilized tools such as board games, toys, cards, puzzles, and papers [14,15]. Some researchers have conducted case studies by developing new unplugged games for CT training courses. In one research, three life-size board games are created to introduce unplugged, gamified, low-threshold introduction to CT for primary school children [16]. Few other researchers developed CT implementation through interacting with the agents (e.g., robotics, objects in the Scratch program, and electronic toys); students can consider steps and use technical skills to manipulate the machines/agents to solve problems [13,17,18].
We are specifically interested in CT inclusion via CS-unplugged techniques because they do not require larger infrastructural change and yet are useful in developing skills needed by students. Consequently, CS-unplugged activities are the best substitute for resource-limited environments like the Pakistan public school system; these activities provide skills on paper and pen, without computers, and with a math or science teacher with minimal training.
We will now highlight use cases of CS-Unplugged worldwide in related work. We will discuss our quest framework and project design in the Section 3, Methods and Materials. We will explain our machine-learning framework in the Section 4, Supervised Machine Learning Algorithms. Later, Section 5, Results and Discussions, and Section 7, Conclusion, will wrap up the discussion.
2. Related Work
“Equity, rigor, and scale” are the fundamental principles for formulating the computing curriculum [19]. That means irrespective of gender and social class, all students must be given equal learning opportunities; computer teachers must be provided proper training to ensure rigor, and the curriculum must not include expensive devices for wider dissemination of knowledge.
Though the curriculum in developed countries is already based on critical thinking, as far as Computer Science is concerned, these countries also face issues like high dropout rates. This is mainly because Computer Science is taught as a tool rather than a discipline like mathematics or physical sciences [20,21,22]. Therefore, it was recommended to teach students Computer Science fundamentals gradually starting from the elementary school level to impart a deeper understanding of the discipline as mentioned in the survey done by [23]; they observed that the students who lack problem-solving skills, struggle in introductory programming classes.
Tim Bell also emphasized in their survey that many students in developed countries do not opt for Computer Science as a career mainly because the subject is taught as a tool, not a discipline. They suggested teaching Computer Science at K-12 in three levels, where during the first two levels, a basic understanding of Computer Science concepts should be conveyed through projects like CS Unplugged and Scratch. Later, in the third level, students should be familiarized with the technical details of using a particular tool or technology [24].
Another more comprehensive work is based on incorporating fundamental concepts in the K-12 curriculum [25]. They argue that teaching programming should not be the objective of a Computer Science curriculum—rather, teachers should be made aware of the broader picture of Computer Science. One drawback of the programming-focused approach is that technologies change rapidly, making it challenging for Computer Science teachers to keep pace with emerging programming languages. Since these foundational concepts are not specific to any technology, they are more suitable for teachers at the primary and secondary levels with no background in Computer Science. CS4FN (Computer Science for Fun) developed by [26]. CS4FN has many unplugged-style engaging activities and approaches by emphasizing kinaesthetic activity. Similar proof of study is being conducted by the Computational thinking test (CTt). CTt is a performance test generated by [27] for middle school students. This an online test to evaluate students on all the terms of CT by asking 28 questions. Another research group developed core CT content [28]. This framework is commonly known as Bebras Tasks. These tasks can assist in elementary student’s CT learning and skill development.
Scientists have coined the term “Big Ideas” in computer science based on the principles of big ideas in science: it represents ten computing principles that every 12th grade child should be aware of. These ideas are related to how a computer stores information. How is it processed? Who processes it? Can we simulate it? Can we automate it? What is the extent of automation? These ideas are listed here: (1) Image representation in a computer, (2) Algorithm interacts with data, (3) The performance of the algorithm can be evaluated, (4) An algorithm cannot solve some computational problems, (5) Program express algorithm and data in computer understandable form, (6) Human designs digital systems to serve human, (7) digital system creates a virtual representation of a phenomenon, (8) Data protection is critical, (9) Time-dependent operations must be incorporated, (10) Digital system communicates with each other [25].
Sentance et al. evaluated various challenges teachers face in imparting Computer Science fundamentals at the K-12 level [29]. They mentioned active learning via unplugged techniques is one fun way to incorporate. The Teaching London Computing Project is one successful example of recent work done in Computer Science Education [30]. This resource provides many unplugged activities.
In another study [21], the importance of Computer Science education was examined from an economic, social, and cultural perspective. They concluded that professional teacher training is the key factor in coping with the various challenges of implementing pedagogical approaches.
Hossein et al. applied a cost-effective game methodology for imparting Computer Science fundamentals that do not require digital games [31]. Their focus was on introducing game-based learning in higher education, where they redesigned the traditional curriculum for core Computer Science courses such as “Data Structures and Algorithms” by introducing sorting and traversal algorithms through cards. Later, they compared “regular” and “game-based” teaching as per Bloom’s taxonomy of learning.
Recent work has been done in Italy about the effectiveness of developing critical thinking according to guidelines provided by the project K-12 Computer Science. They have adapted the code.org approach for their study, where students design projects using drag-and-drop control structures [3].
Unfortunately, in developing countries such as Pakistan, elementary public schools are neither equipped with computers nor skilled teachers available. Therefore, we decided to analyze the effectiveness of the CS-Unplugged approach [32] in the context of developing countries. This is our pilot study in one school. However, in the future, we plan to extend our project to other schools and incorporate activities related to all 10 big ideas.
3. Methods and Materials
3.1. CS Unplugged Activity
We conducted a CS Unplugged activity at an elementary school and assessed the student’s performance based on training. This project was conducted on 360 students from grades 3–5.41% of the participating students were males, and 59% were females. The age of the students ranges from 7 to 14 years old. We introduced finding the shortest path algorithm for elementary students by using only a certain set of moves. The experiment setup was as follows: The students were given a printed activity in which they were asked to move from point A to point B, taking the shortest possible route using the legal moves only. This activity was conducted to introduce students to an understanding of efficiency and why it is important in computers and computing programs.
3.2. Experimental Setup
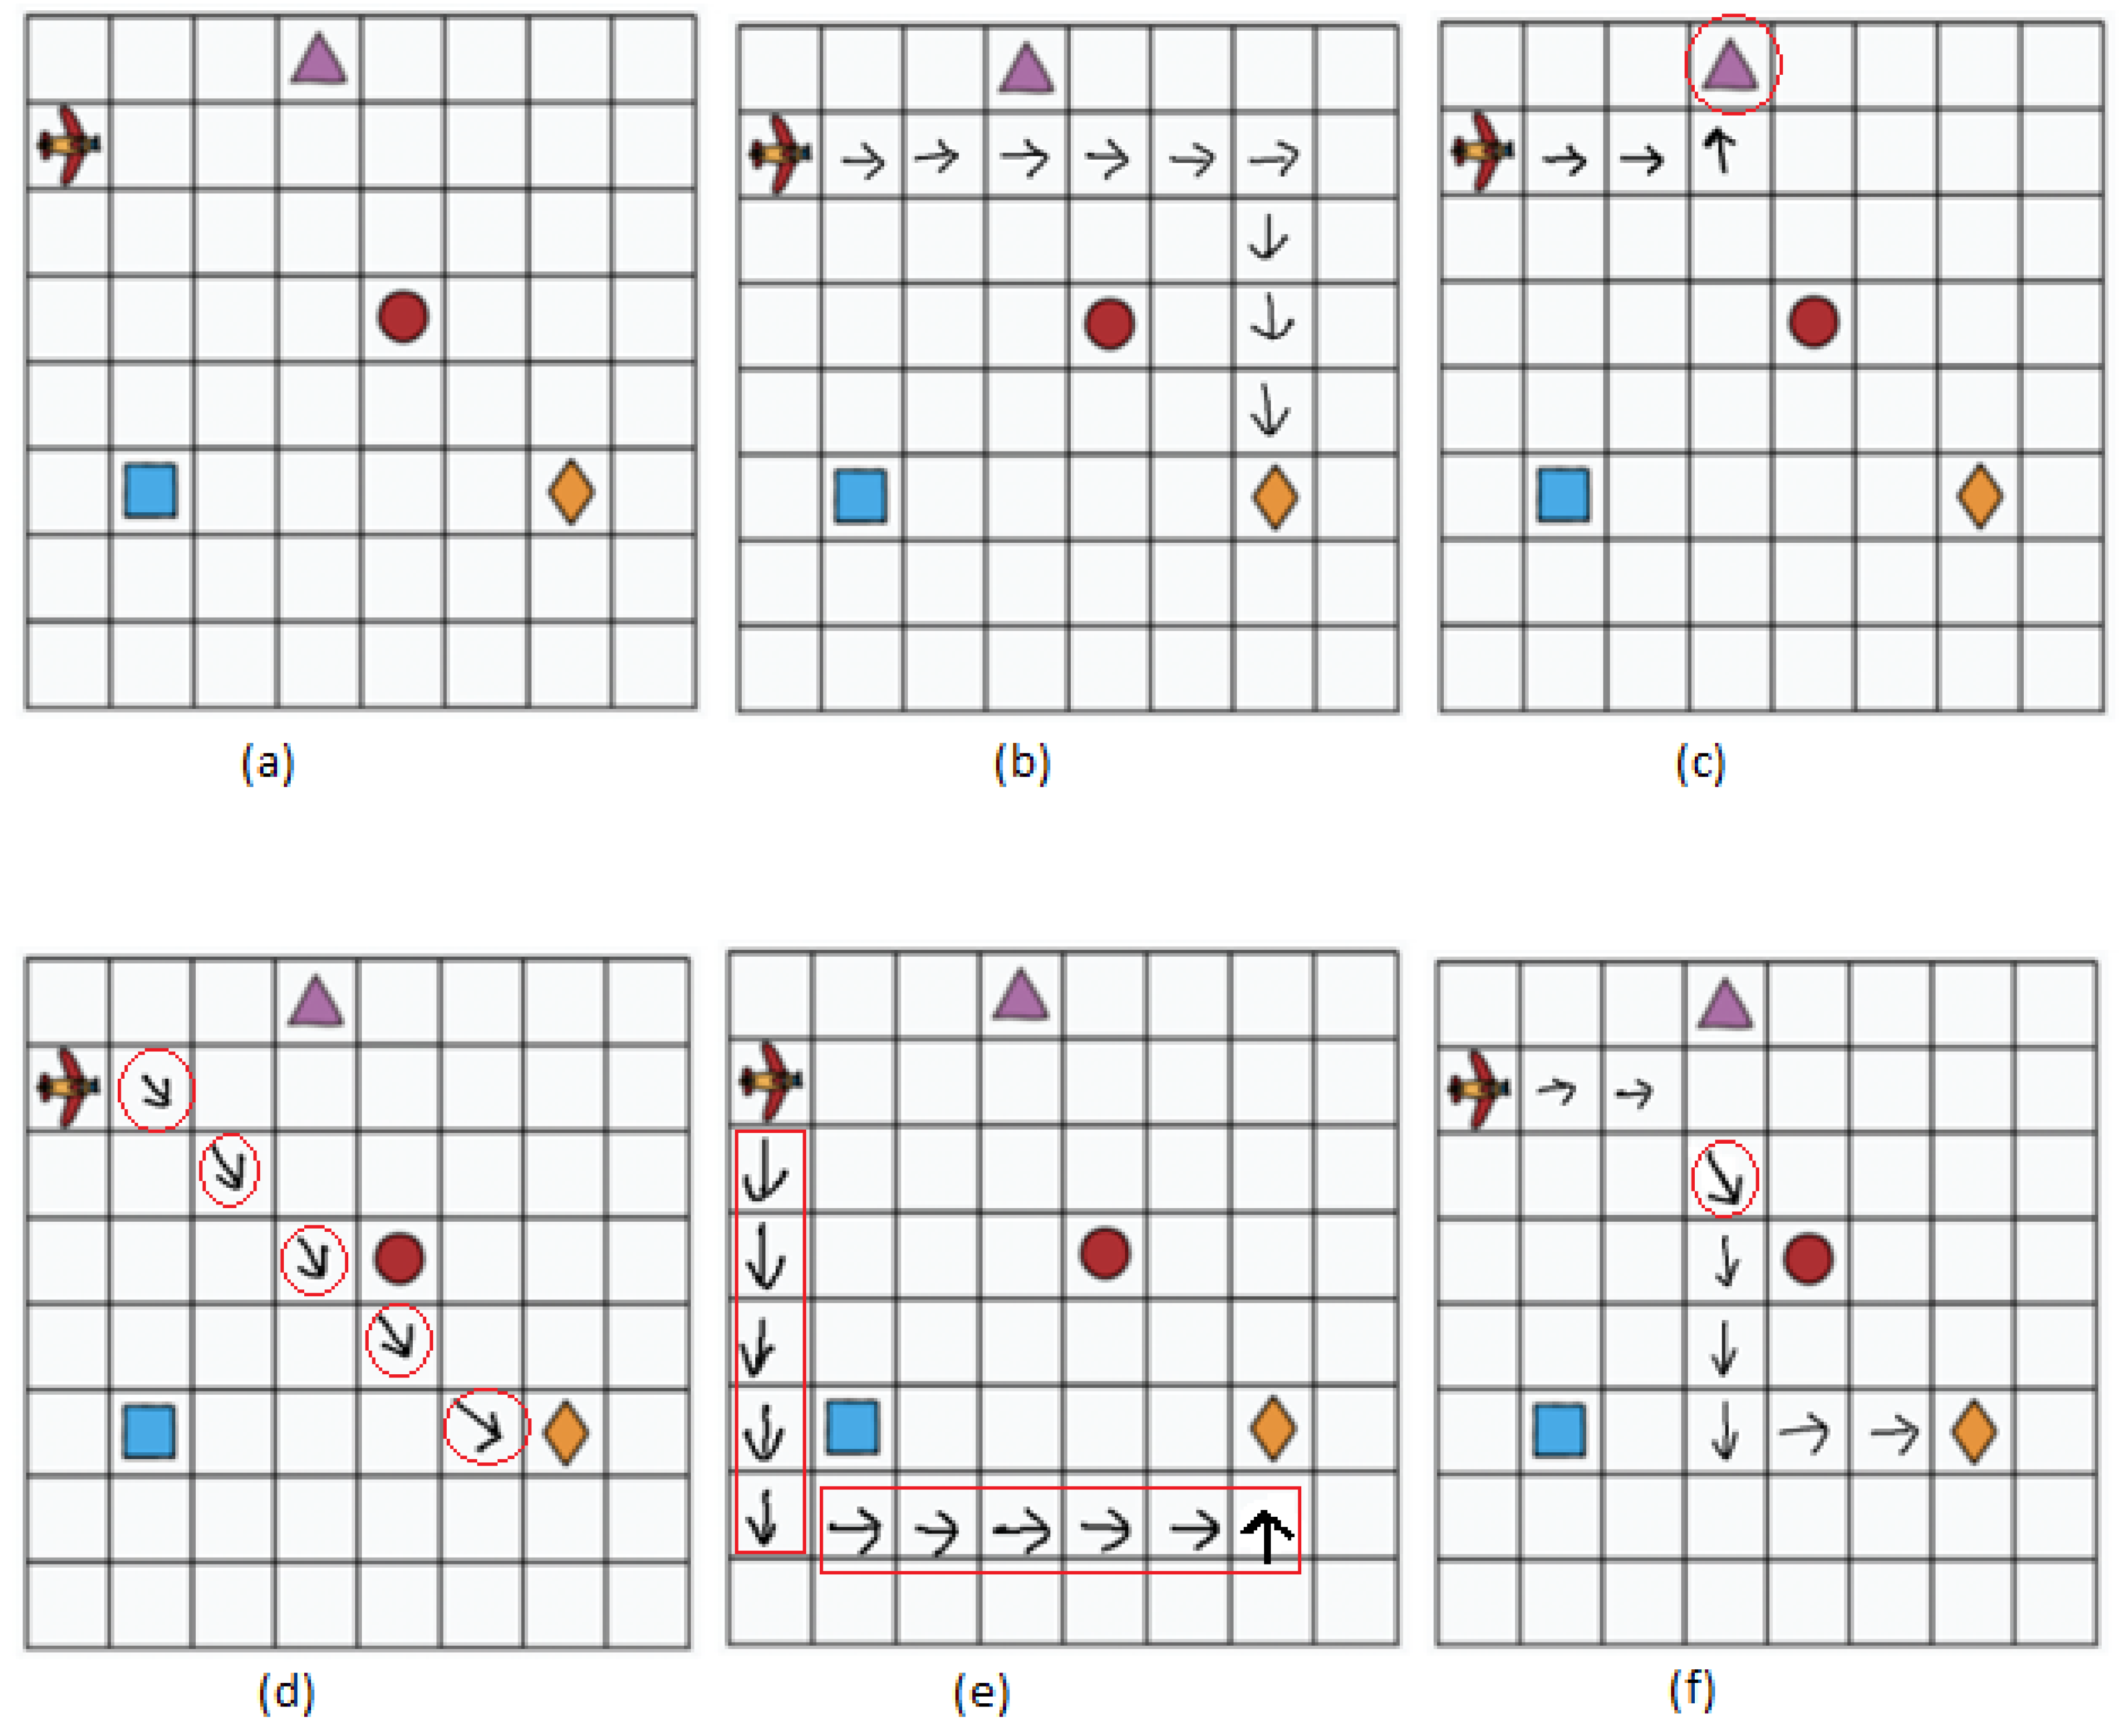
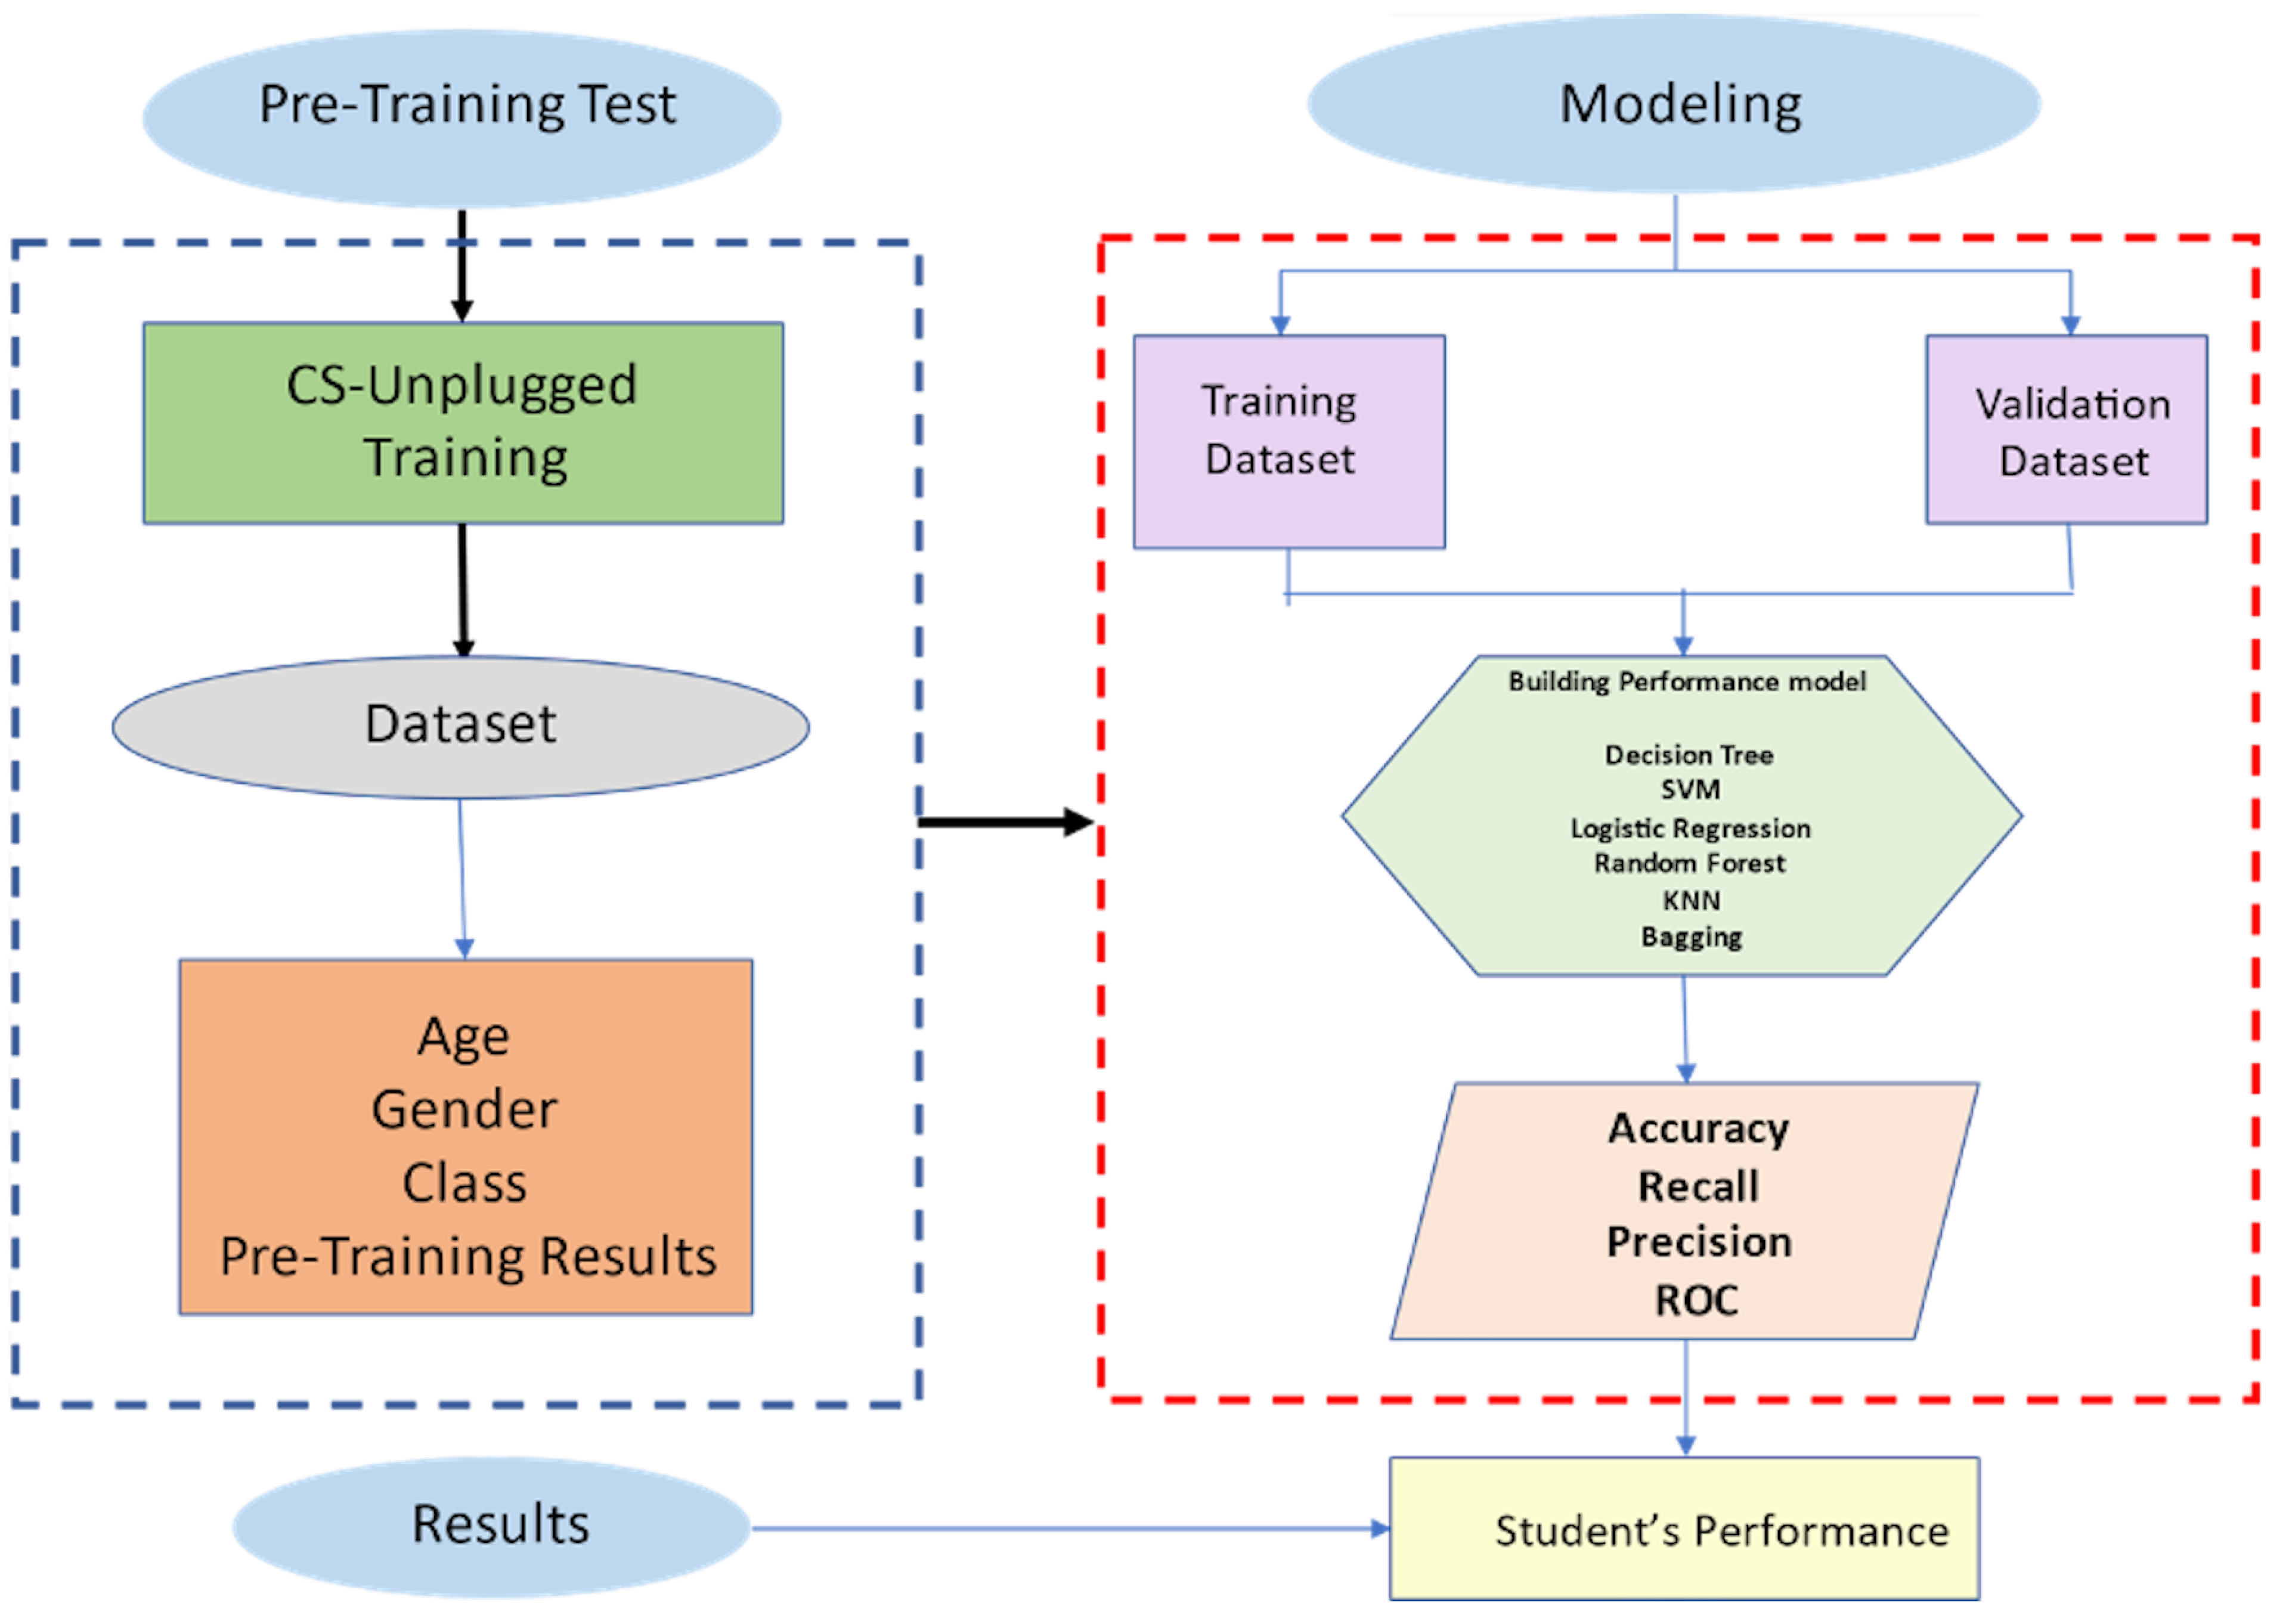
The activity was conducted in two phases, namely pre-training and post-training, and shown in Figure 1. The students were asked to perform the pre-training task without prior information or training. The assigned task was to move up, down, right, or left in the grid to move from the source point (airplane) to the destination point (Diamond Shape) shown in Figure 2a. The students then formed their logic and completed the activity with varying levels of success. Figure 2b displays one of the possible correct solutions. We will discuss other samples in the Section 5, Results and Discussions.

Figure 1.
Flow chart of introducing CS-Unplugged activity.
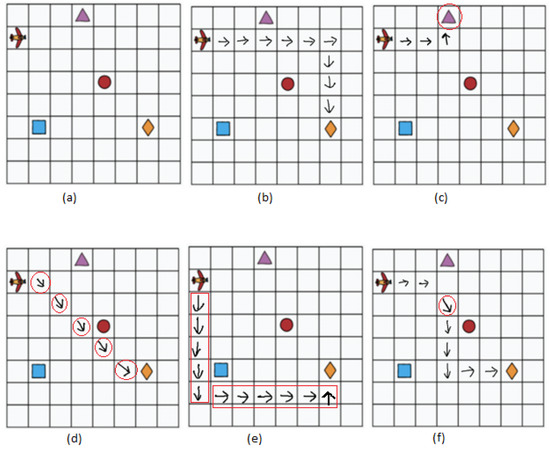
Figure 2.
CS-Unplugged the shortest path finding activity sheet, and a possible solution, and students sample. The target is to collect diamonds using right, left, up, and down moves only. Students cannot move diagonally. All the errors are highlighted in red. (a) a Pre-training activity, (b) One possible solution, and (c) Moving to the closest incorrect object. (d) Using illegal moves for the activity (diagonal move). (e) Not using the shortest path. (f) Student sample using an illegal move only once.
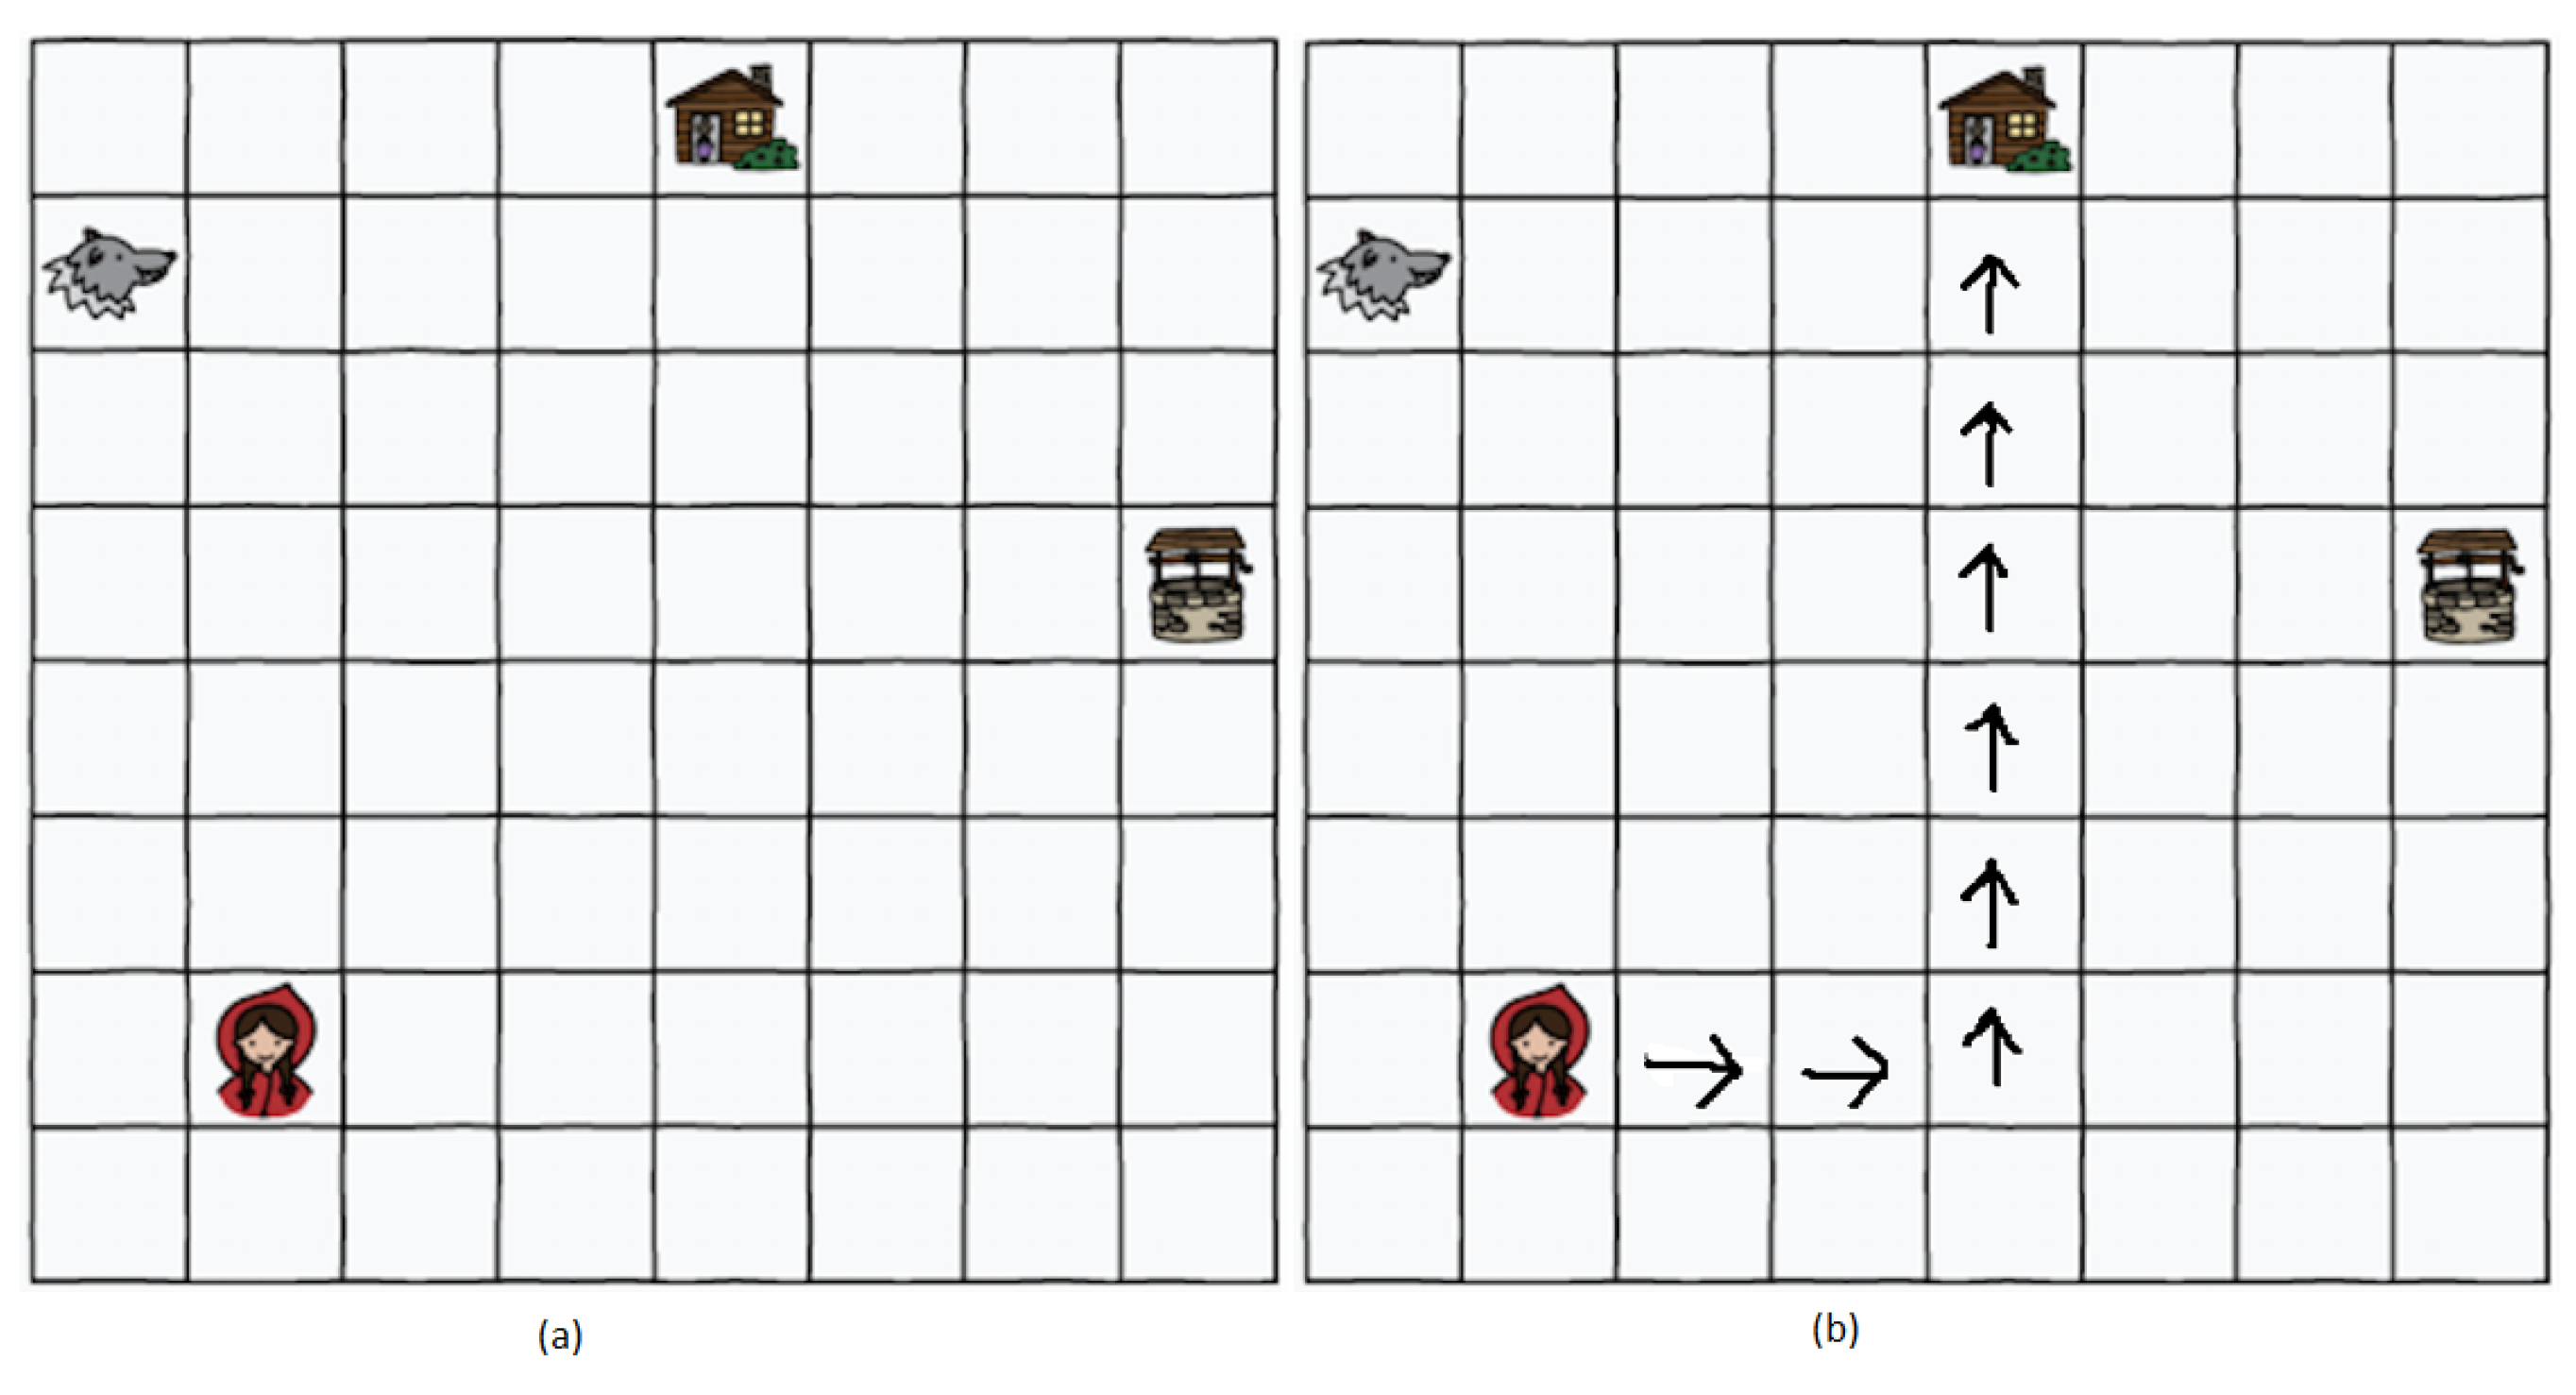
Later, the shortest path concept was discussed in a 5 min lecture. To reinforce the idea, interactive training was given to students. The students were asked to move in the classroom from one place to another using different directions while counting the steps and avoiding any hurdles. Their Math teacher performed this activity, and we provided the prior training to the instructor. The students also practiced understanding the concept by changing the possible set of moves; for instance, they were allowed to move diagonally or move back, and so on. After 40 min of practice, students were asked to perform the post-activity. We chose the Rescue Mission activity from the CS-Unplugged project [32] for the post-activity. The idea of a rescue mission using kid bots was explained to students by retelling the story of Red Riding Hood. The students could only move in four directions (up, down, left, and right). This activity was originally created and tested in developed countries like New Zealand. The suggested duration is 30 min, and the target age is specified as 5–7. We performed this activity on older kids, keeping in mind the local educational framework, and the training process took 40 min. The post-training activity and a possible solution are shown in Figure 3.
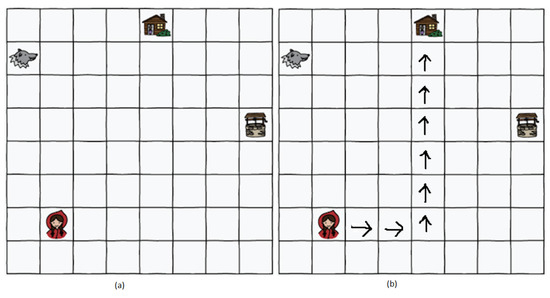
Figure 3.
CS-Unplugged the shortest path finding post-training activity and a possible solution. (a) The empty sheet provided students with the instructions to move only up, down, left, and right to reach the home with fewer steps. (b) One possible solution using the defined moves.
4. Supervised Machine Learning Algorithms
We employed supervised machine learning algorithms to determine the student’s performance for a given unplugged activity. The goal was to predict results and find the best prediction model [33].
Supervised learning algorithms determine the labels for the unseen data based on the pattern learned from the labeled data by using a mapping function . This mapping function produces an output y for each input x (or a probability distribution over condition . Several forms of mapping functions exist, including decision trees, logistic regression, support vector machines, neural networks, etc. In this study, we perform a machine learning-based analysis to predict the students’ performance after introducing the CS-Unplugged concept, as discussed above. There are two questions that we are addressing using machine learning approaches.
- Q1.
- Can our model predict whether a student will pass the CS-Unplugged activity after the training? We used the following features as input to our models: Age, gender, class, and Pre-Training Result. Our label for this question is the Post-training results, where a student can either pass or fail a test. This makes it a binary classification problem.
- Q2.
- How useful is our CS-Unplugged training to introduce the computer science concept? We used the above-mentioned features with the following concept of labels. These labels are also summarized in Table 1:
 Table 1. Outcome assessment for our prediction model.
- a.
- If the student’s pre-training result is F and post-training, the result is P. We consider it a positive response.
- b.
- If the student’s pre-training result is P and post-training, the result is P. We consider it a negative response.
- c.
- If the student’s pre-training result is F and post-training, the result is F too, we consider it a negative response.
- d.
- If the student’s pre-training result is P and the post-training result is F, we consider it a negative response.
We have the following setup. We have 360 students; among them, 157 are positive responses, and the rest are negative. We consider these students as negative responses as these students did not benefit from the training either because they already were producing correct answers or even after training, they failed to get the correct answer.
This is a binary classification problem: our y is either positive means pass or negative means fail. In our experiments, we applied Logistic Regression, Decision Tree, Support Vector Machine, K-Nearest Neighbors, Random Forest, and Bagging to analyze which algorithm would perform best for the given problem. The selection was made to rely not only on the parametric algorithm but on non-parametric algorithms as well as the ensemble algorithms. For our model selection, we used Stratified Cross-Validation. We kept 10 splits. The summary of the methodology pipeline is provided in Figure 4.
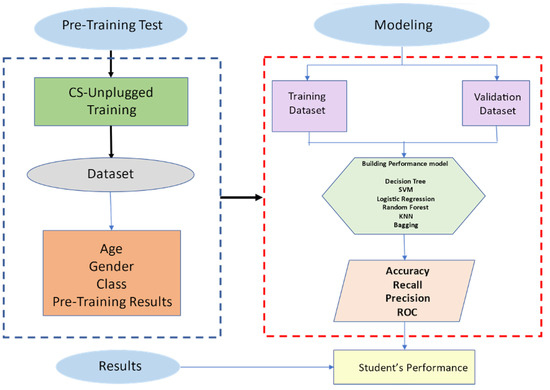
Figure 4.
Student’s performance prediction model for CS-unplugged activities.
We will now briefly introduce the algorithms applied and the evaluation metrics used. Later, we will discuss the results, leading to the experiment’s conclusion.
4.1. Machine Learning Models
4.1.1. Logistic Regression
Logistic Regression is one of the simplest machine-learning techniques for classification [34]. This model learns the parameters by estimating the class-posterior probabilities with the sigmoid function. In this model, the kernel function looks at a discriminant function to solve the classification problem.
4.1.2. Decision Tree
A decision tree uses a tree-like graph or model of choices and their attainable consequences [35]. A decision tree is a flowchart-like structure. It begins with a root node that separates the classes based on the highest information gain, and every internal node represents a “test” on an attribute (such as whether the student has passed the test or not).
4.1.3. Support Vector Machine
Support Vector Machines (SVM) are supervised linear classification models that use hyperplanes. Hyperplanes are the separation margin between classes. Data classification is done based on the margin that is wide and viable. When training the model, the vector w and the bias b must be estimated by the solution to a quadratic equation [36].
4.1.4. K-Nearest Neighbor
K-nearest neighbor (KNN) is known as one of the simplest machine learning algorithms. The classification is done based on the distances between samples. The classification data set contains observations in the form of X and Y in the training data. Hence, is the vector containing the feature values while is the class label [37].
4.1.5. Random Forest
Random Forest is essentially a collection of unpruned classification trees. This algorithm performs excellently on several practical problems, mainly because it is neither sensitive to noise in the data set nor subject to overfitting. Random forest is made up of independent Decision Trees. Where each tree sets conditional features differently. When a sample arrives at a root node, it is traversed to all the trees. As an outcome, each tree predicts the class label for the sample. In the end, the majority class is assigned to that sample. This algorithm works fast and generally outperforms many other tree-based algorithms [38].
4.1.6. Bagging (Boosting Aggregate)
Bagging can be performed when the random forest decisions are taken from different learners and combined into one prediction only. Combining the decisions in the case of classification is voting. The same weights are taken by the models in bagging. The experts are individual decision trees or decision stumps, which are united by making them vote on every test. Later, the majority rule is applied for the classification [39].
4.2. Evaluation Metrics
Some important result metrics that were tested throughout the experiment were accuracy, precision, recall, F1-score, and receiver-operating characteristics (ROC) curve.
Accuracy is defined as the ratio of the total number of CorrectPredictions achieved to the measure of TotalPredictions, regardless of correct or incorrect predictions.
Precision is given as
where TP stands for true positives, i.e., how many true correct predictions are made by the classifier, and FP stands for false positives, which is the measure of the incorrectly predicted positive.
Recall is given as follows:
Also called sensitivity or the true positive rate ratio of correct predictions to the total number of positive examples.
The F measure combines precision and recall; a good F measure suggests low false positives and low false negatives. A perfect F1 score will be 1, while the model is a total failure at 0. The formula for the F1 score is
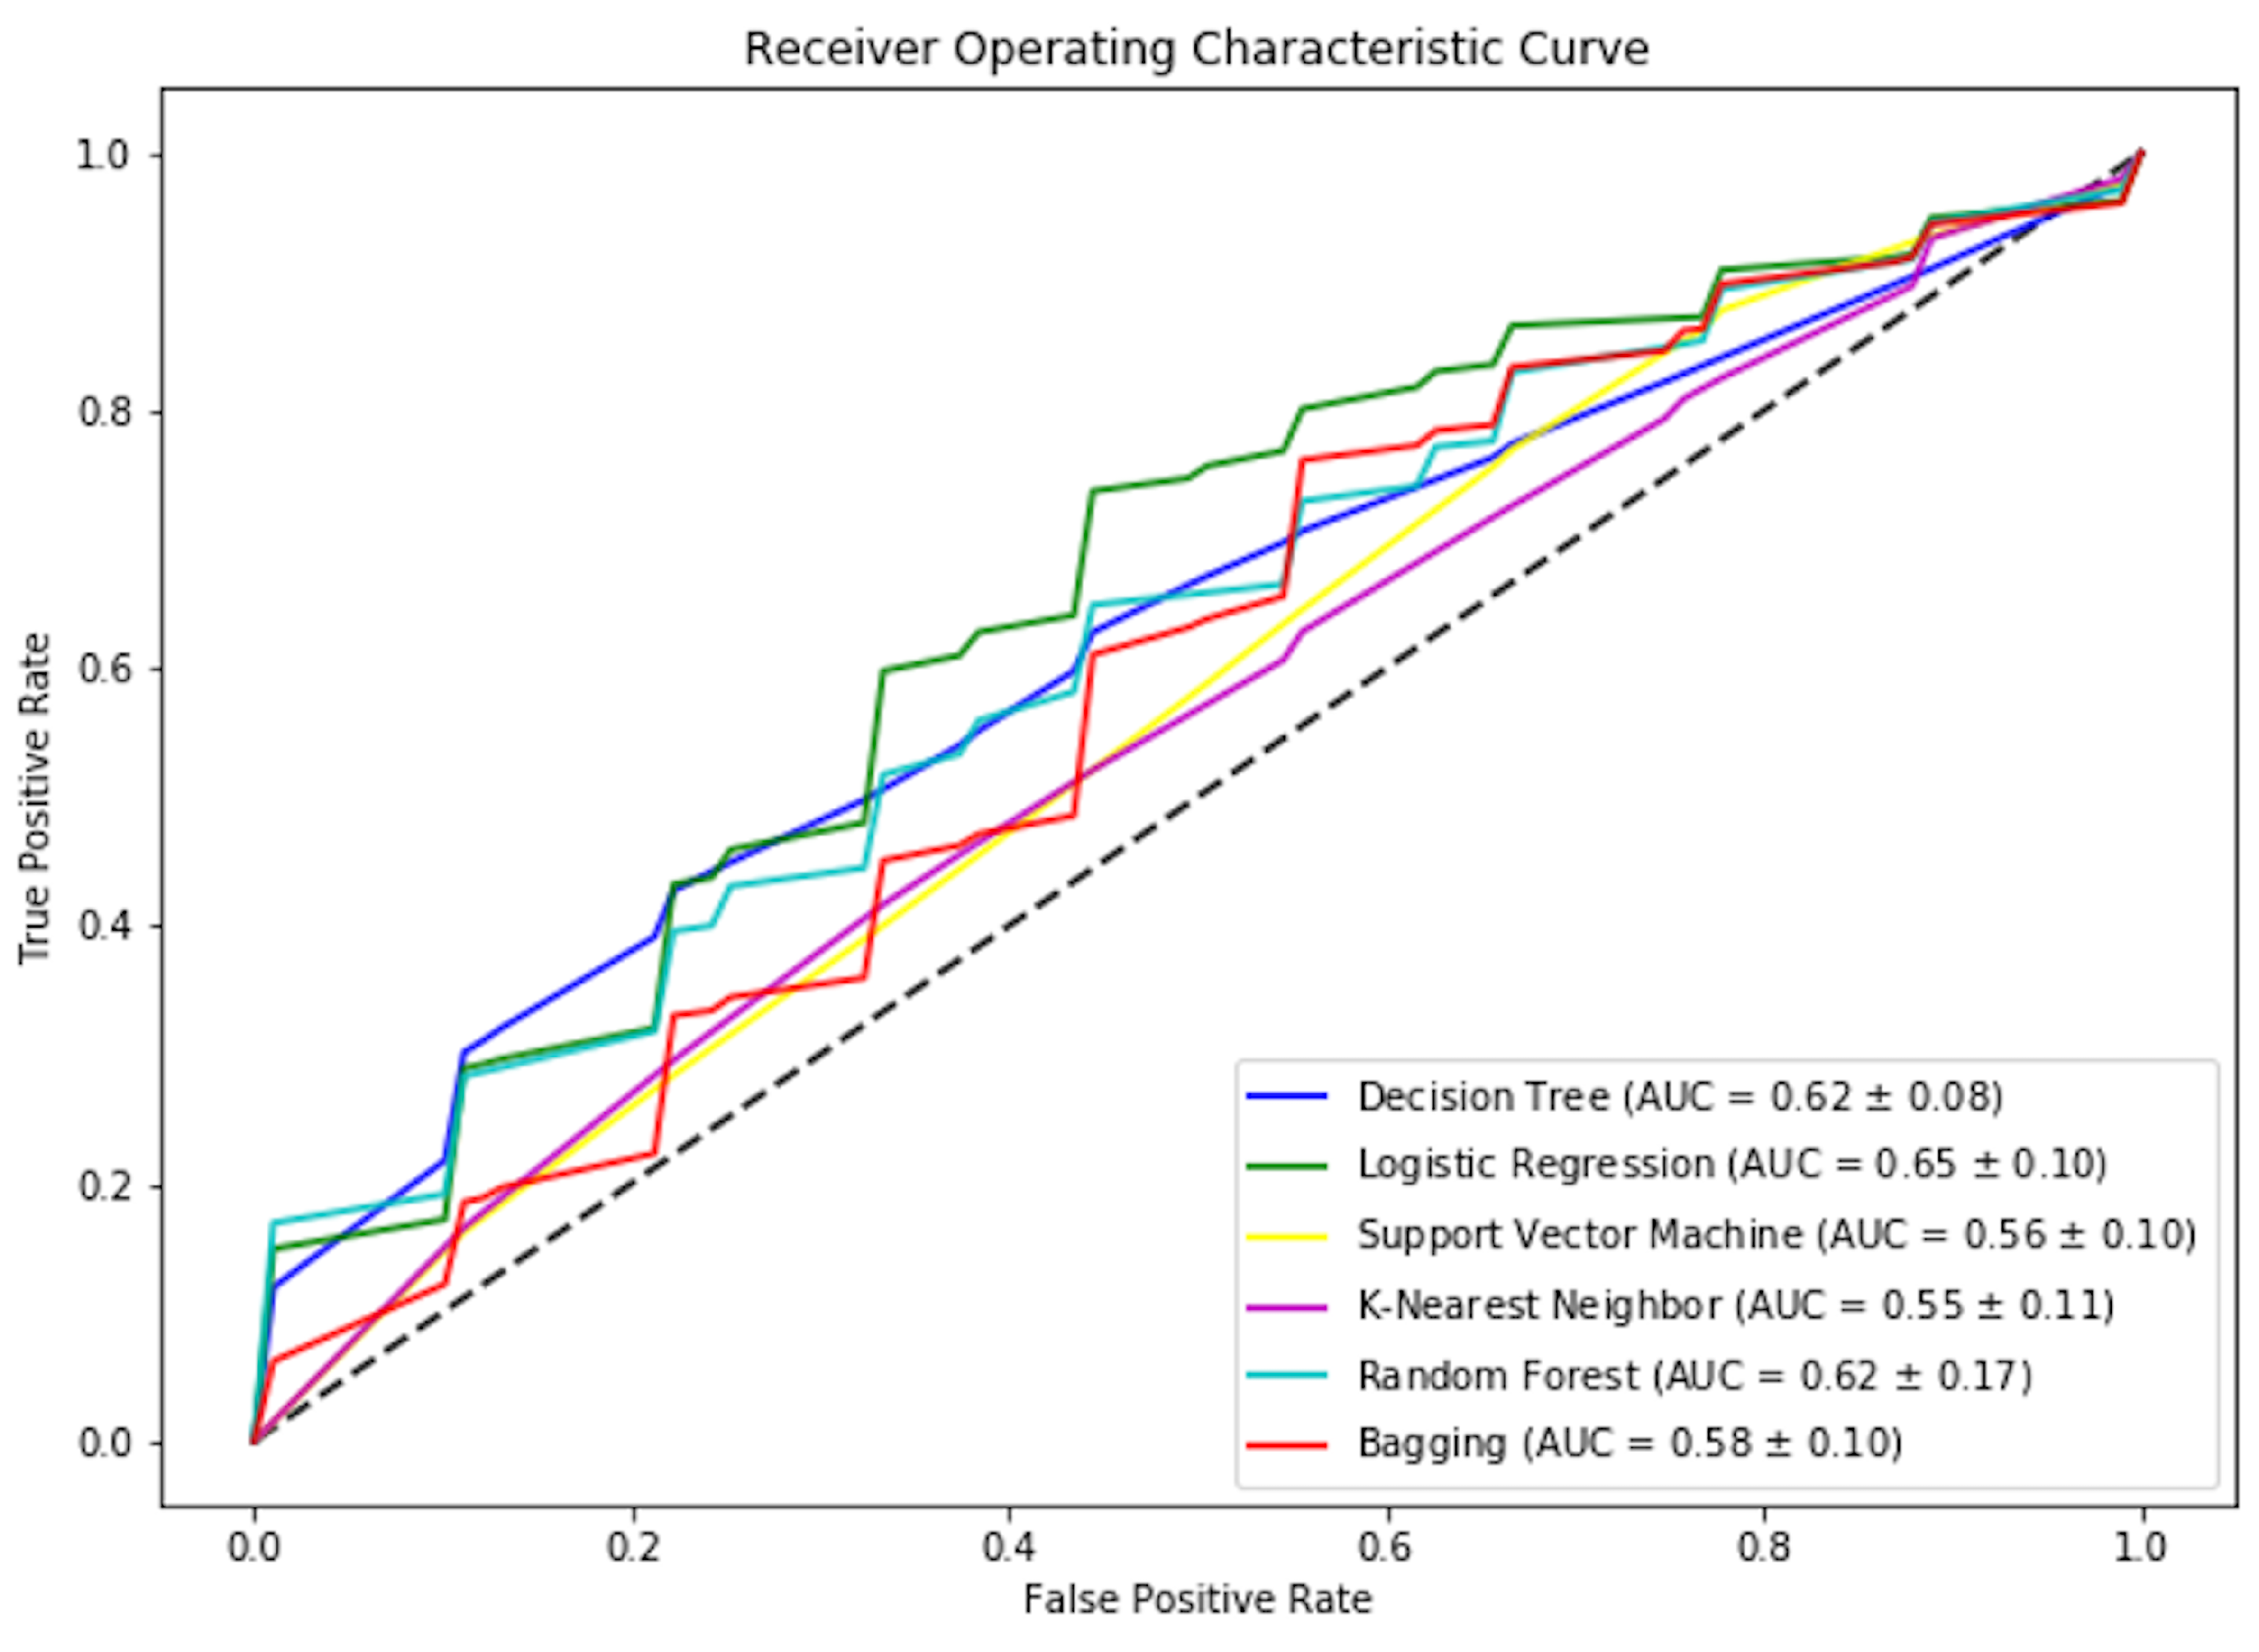
The receiver operation characteristic (ROC) curve is a commonly used performance measure for the classification problem at various thresholds. ROC is a probability curve, while AUC represents the measure of separability. The basic purpose is to get an inference about how much the model is capable of classification distinctly. The higher the AUC score reflects the better performance of the model. The ROC curve is plotted with TPR against the FPR. The TPR is on the y-axis, and FPR is on the x-axis. Thus, the higher percent values for the performance metrics indicate a better model. The performance measures increase if the number of chosen samples is correctly classified.
5. Results and Discussions
In this section, we will discuss the results of pre-training and post-training activities and also discuss our Machine learning models.
5.1. Pre-Training and Post-Training Results
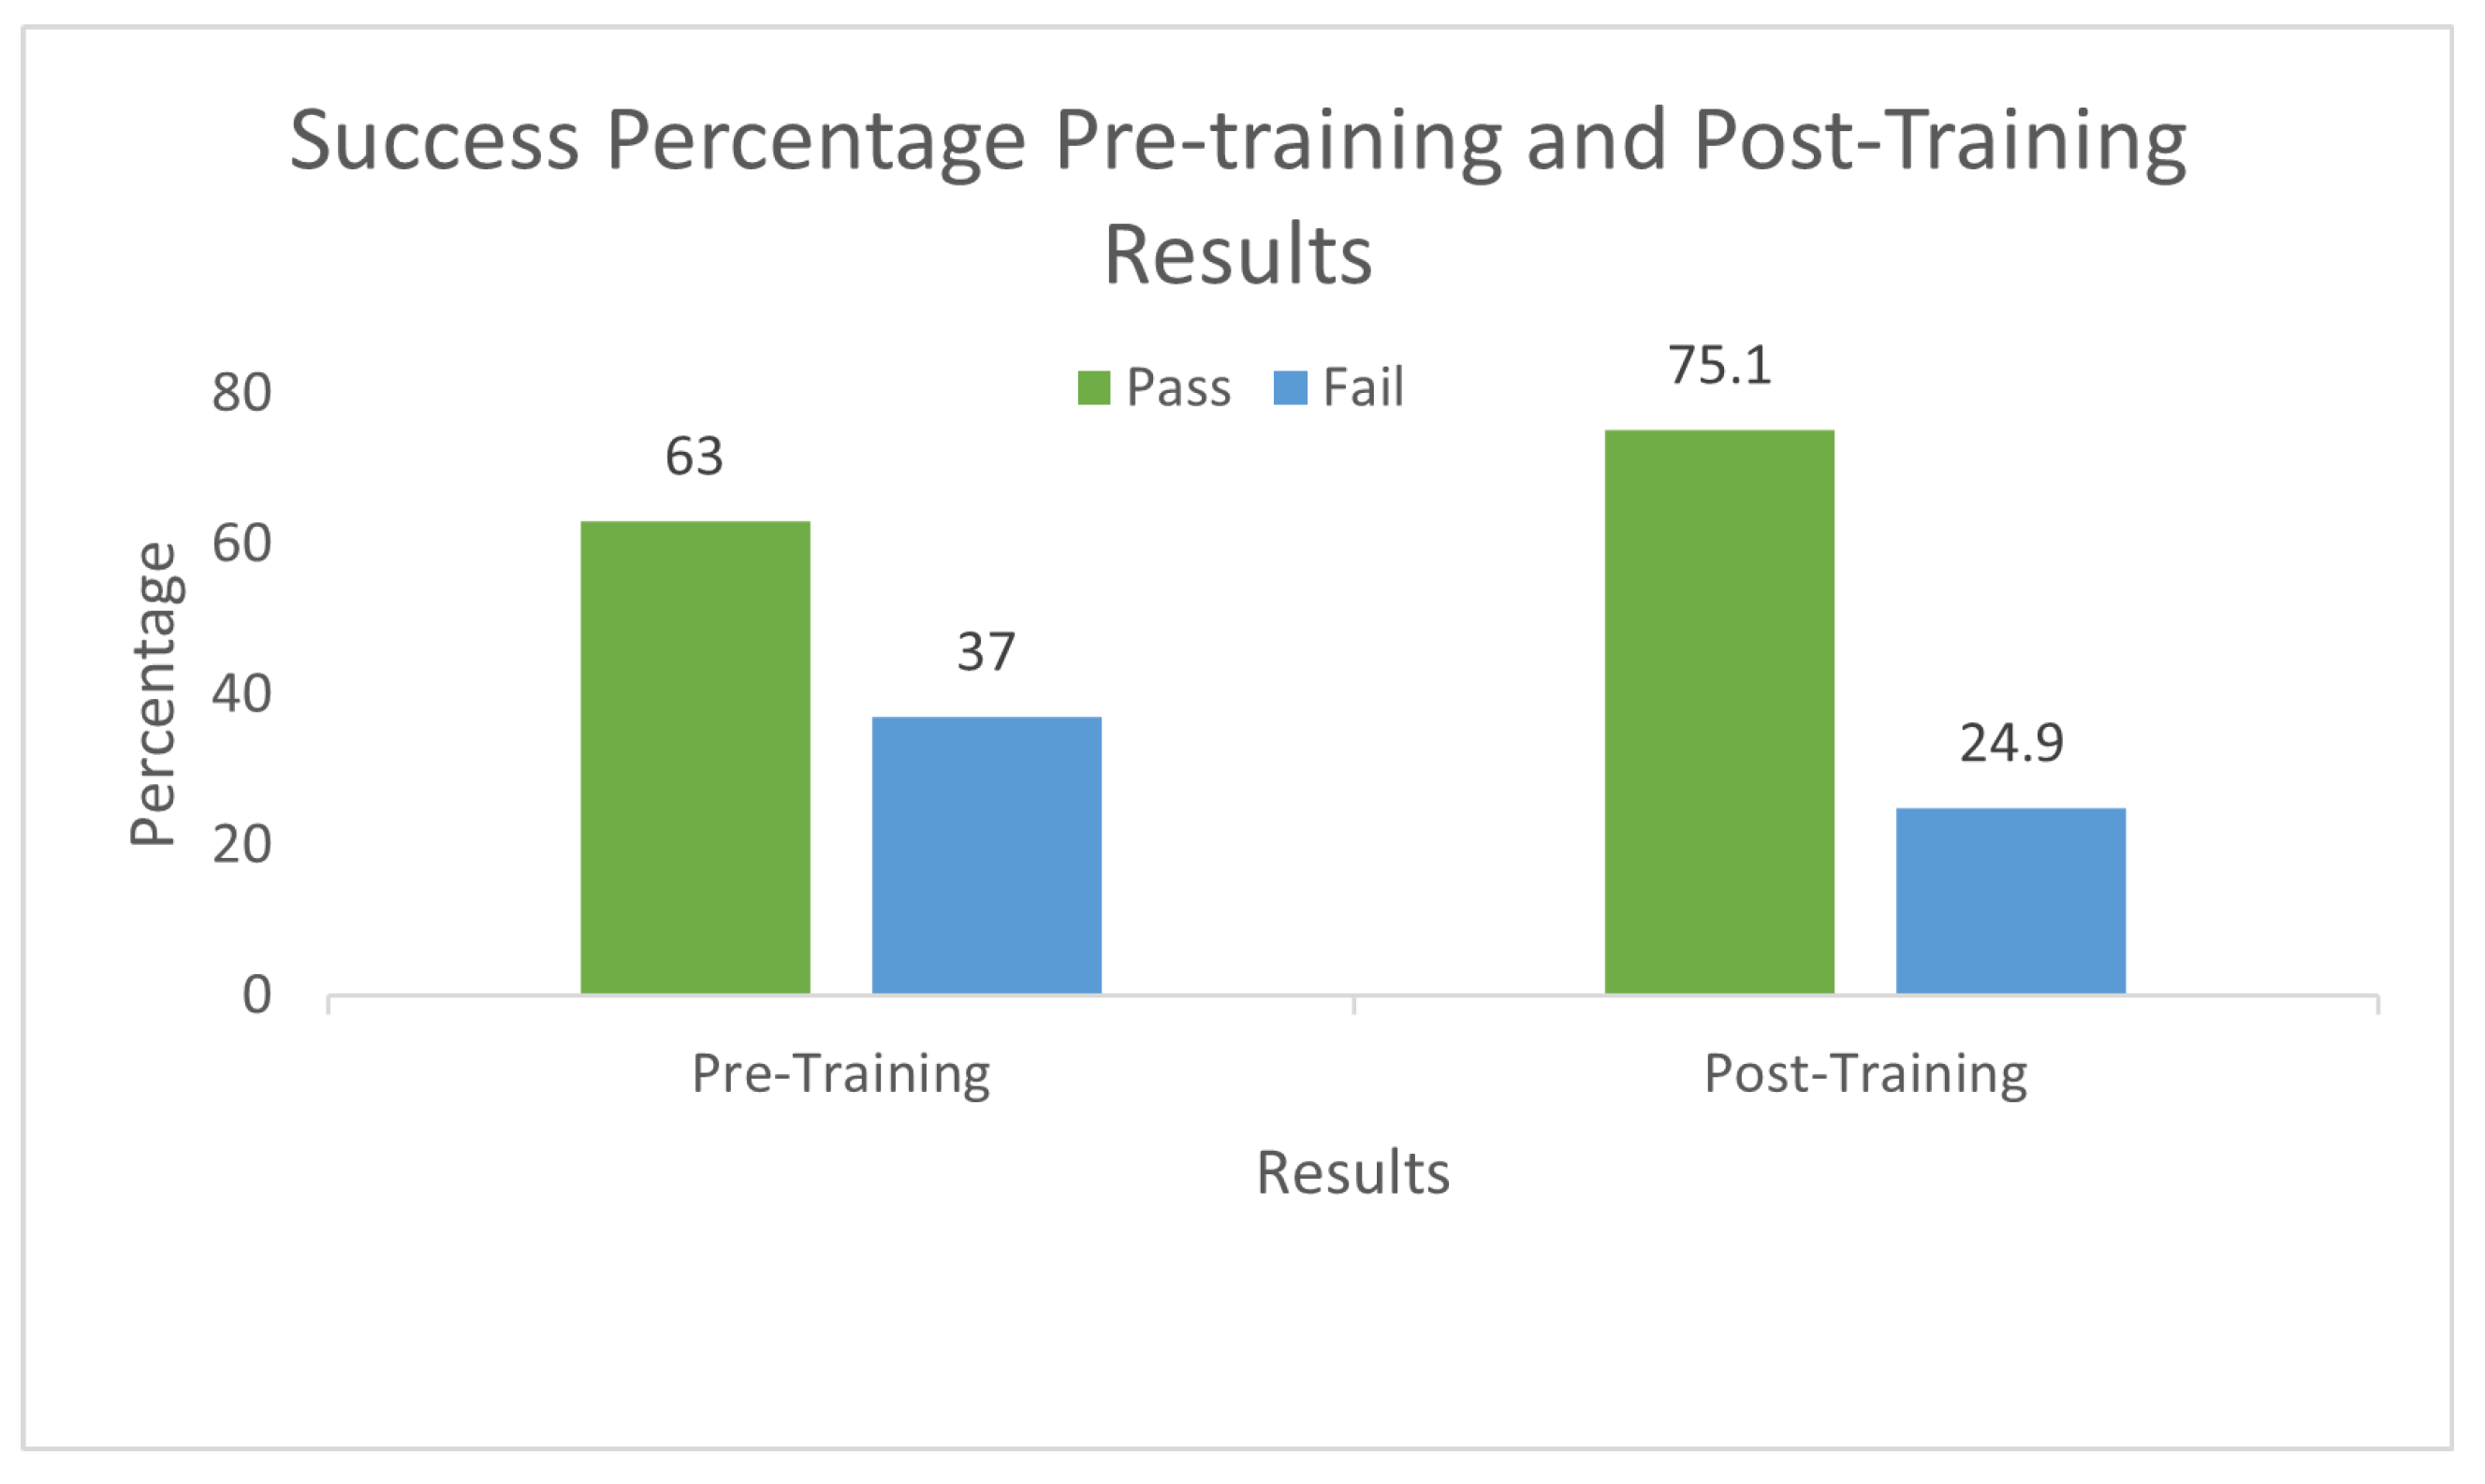
Let us discuss a few sample results. These samples are reproduced for clarity purposes. Figure 2b is one of the possible correct solutions. In Figure 2c, we display the solution where the student could not recognize the question well and moved toward the closest object instead of finding the correct object. Figure 2d does not follow directions and uses illegal moves. Figure 2e is not the shortest path, and Figure 2f uses an illegal move only one time. Figure 2f was one of the common mistakes students made. The detailed results are shared in Figure 2; according to the results, only 37% of the students passed the pre-training activity. For the post-training activity, the students were given new sheets of paper with similar activity. However, instructions regarding the basic algorithm for reaching the destination were given and demonstrated this time. The results were then compiled to see if the CS-unplugged activity was effective or not. 75% of the students passed the post-training activity, reflecting the success of the CS-unplugged training. The complete results are shared in Figure 5.
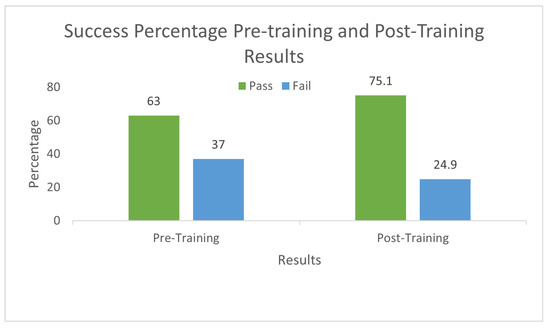
Figure 5.
CS-Unplugged Pre-training and Post-training results.
5.2. Gender Based Results
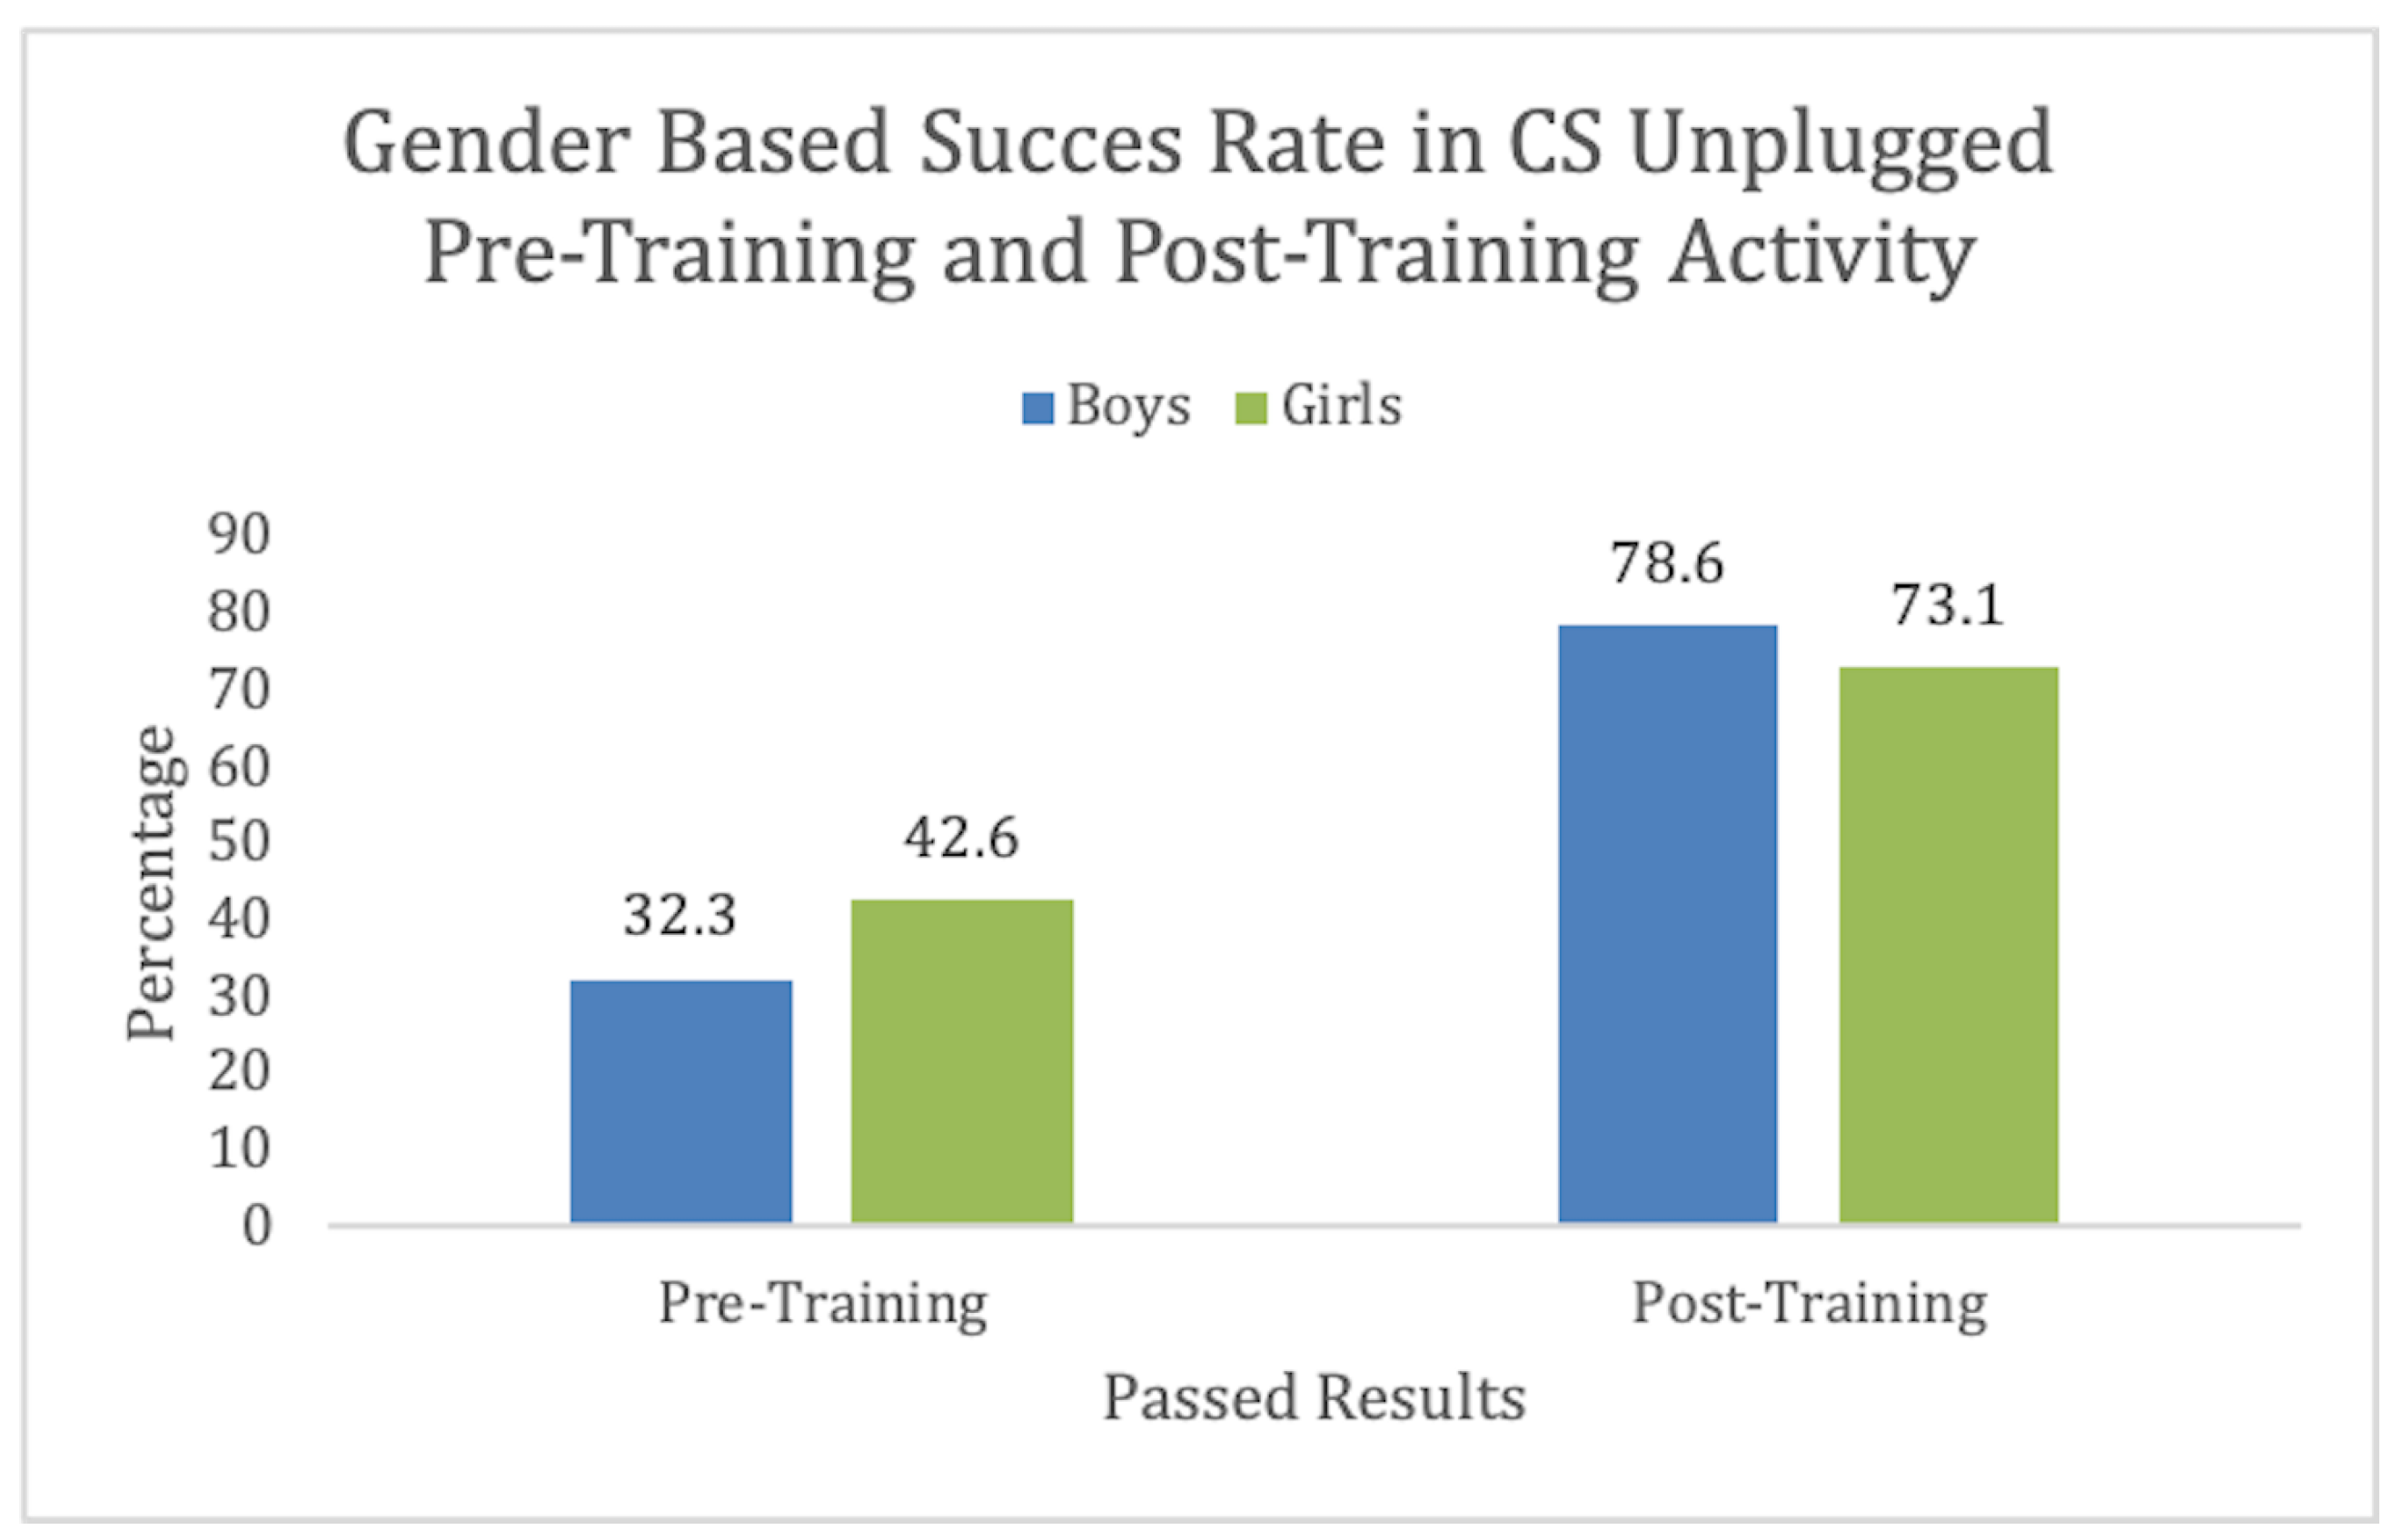
The bar plot in Figure 6 depicts the pass or fail percentage among girls and boys. We observed that 32.3% of the boys passed the pre-training activity. On the other hand, 43.6% of the girls passed the pre-training. In the post-training activity, 78.6% of the boys passed, and 73.1% of the girls passed the post-training activity. We can observe from the data that training was more useful for the boys than the girls. This depicts that both genders found the training useful with more than 70% increase in success rate. Notably, the success rate was lower in females. Similar results can be found in [8], where when CTt was conducted, females scored 1 point less than boys. This provides an opportunity to improve training for better inclusion.
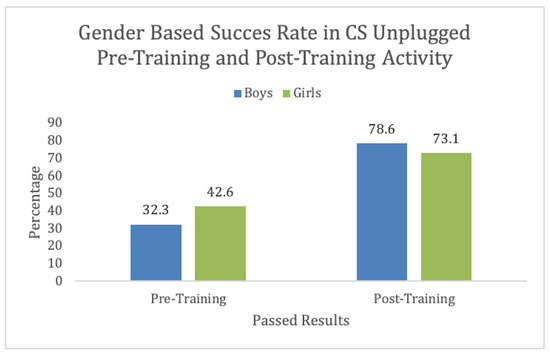
Figure 6.
CS-Unplugged Gender-based information.
5.3. Age Based Results
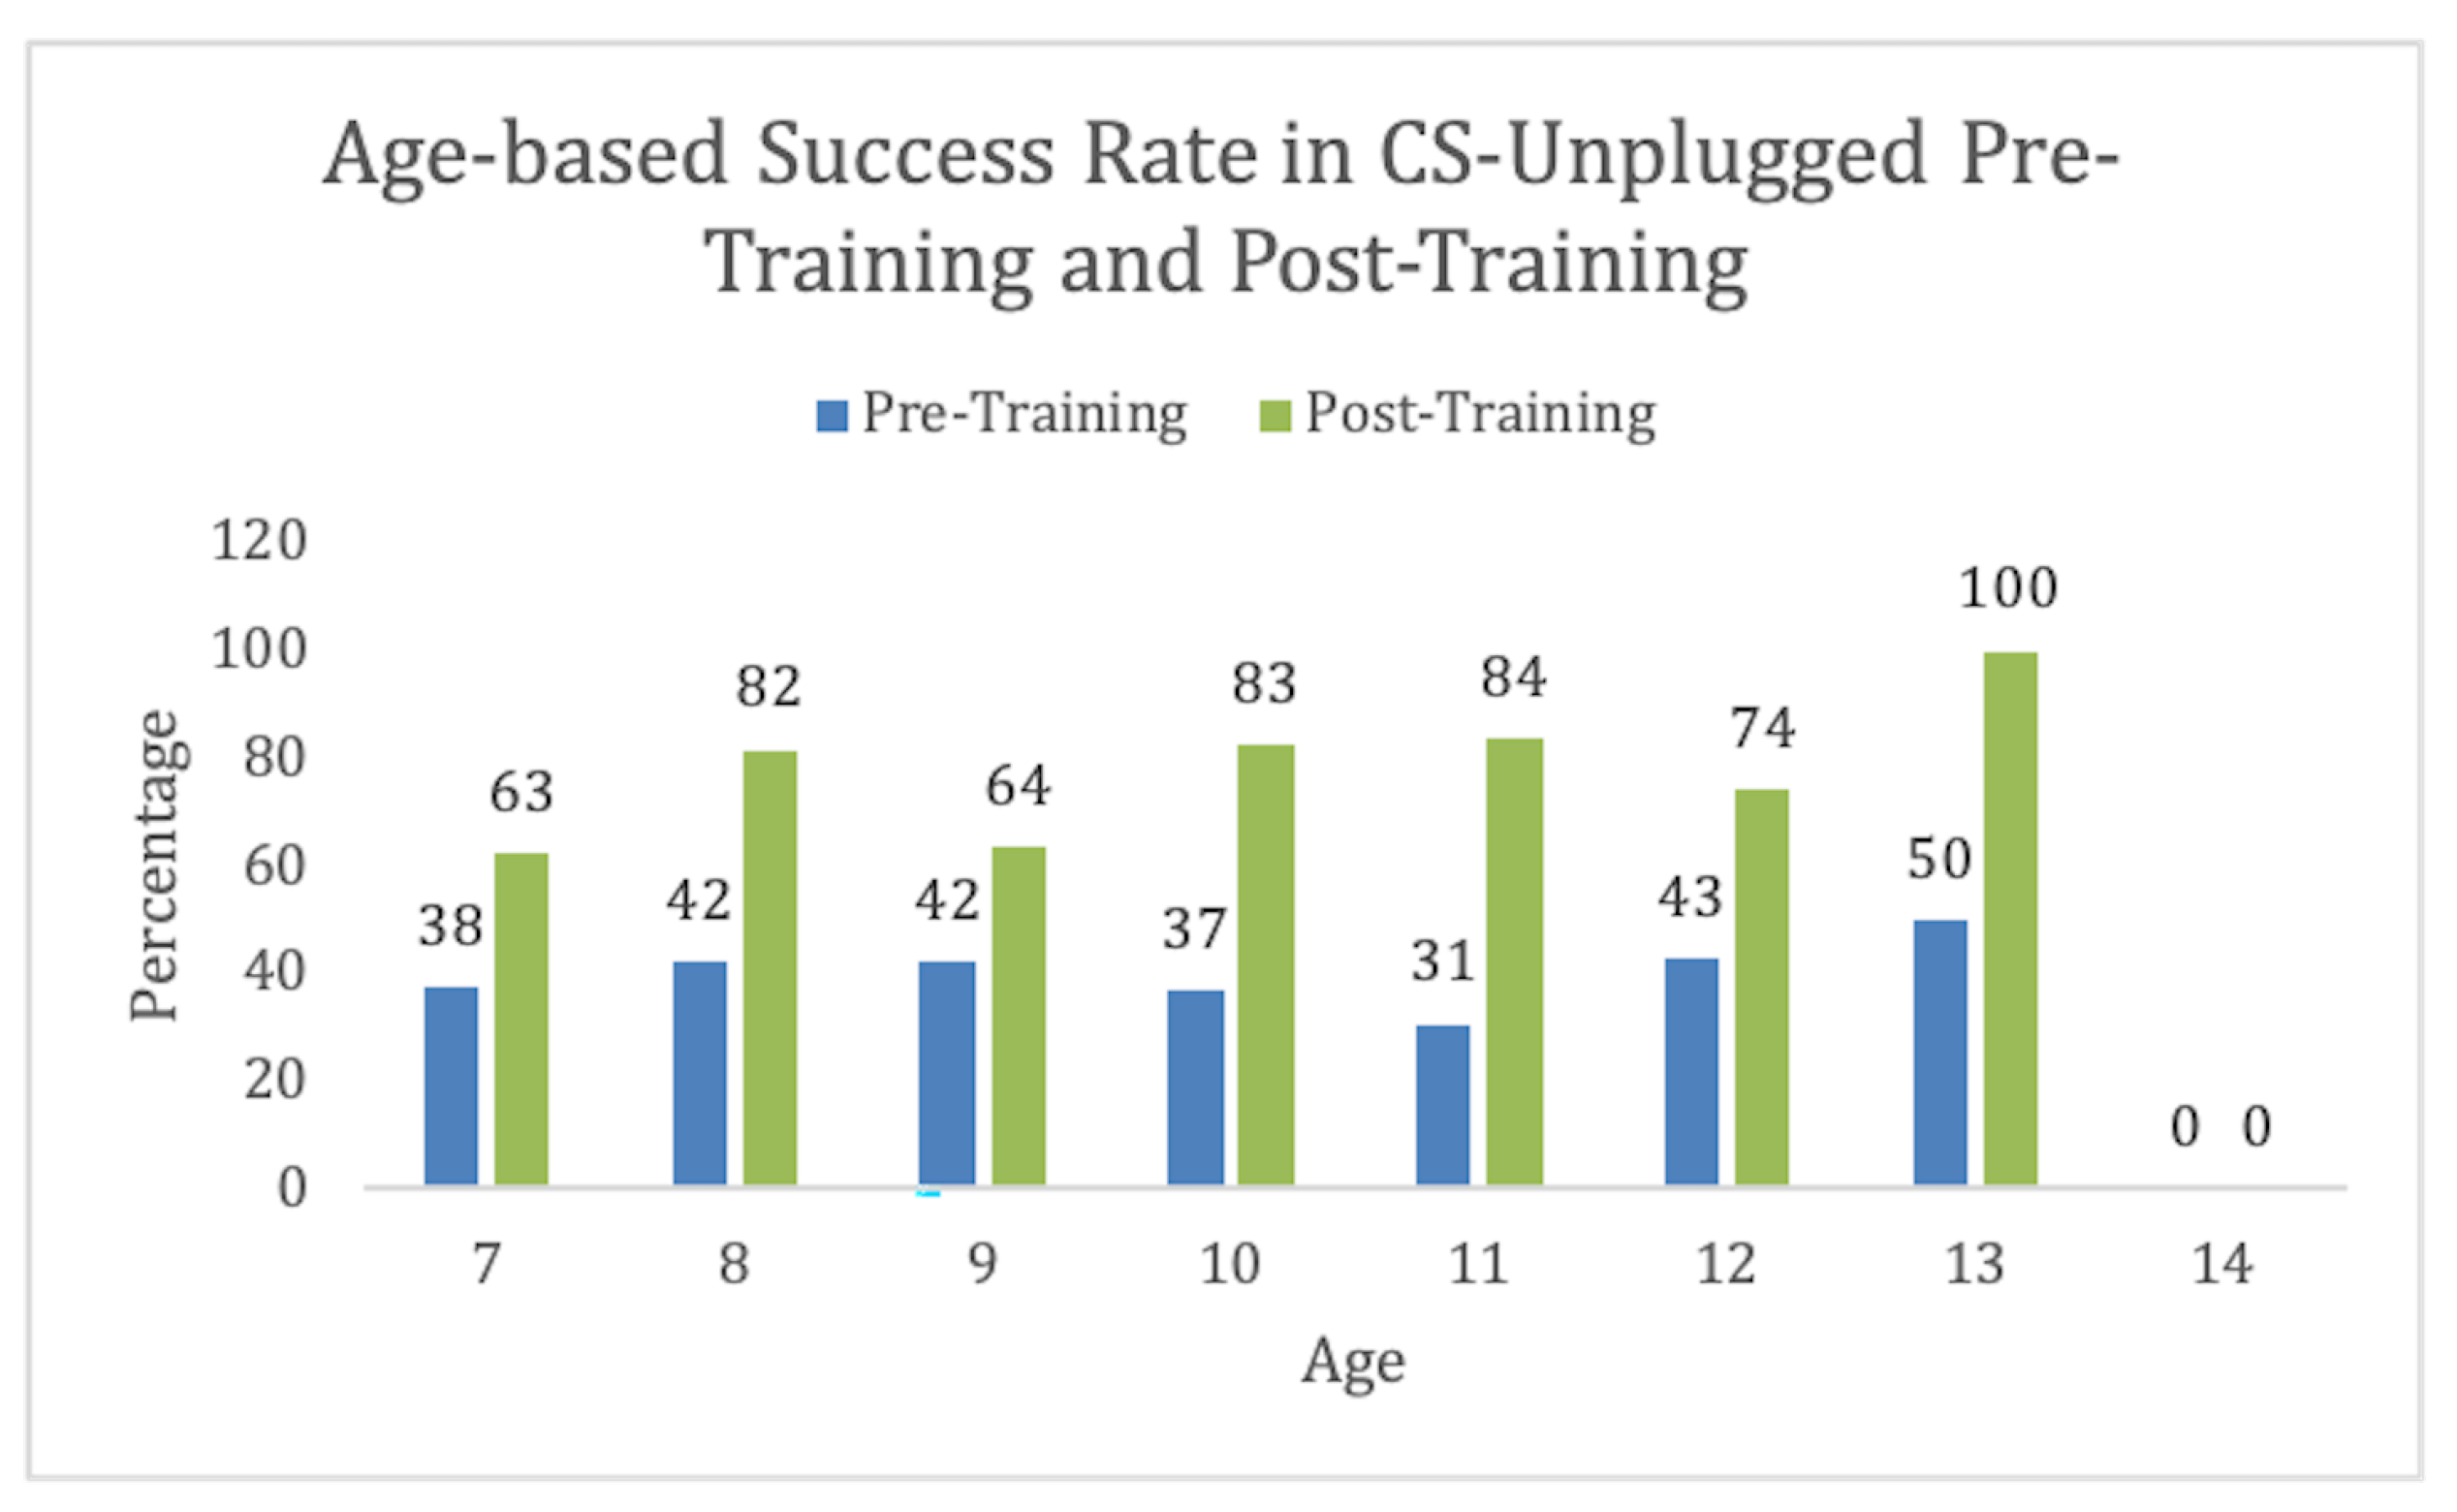
The experiment was conducted on students aged 7–13, as shown in Figure 7. We found that this activity was easily understandable for the age group 10–11. We had one 14-year-old student who could not pass the activity even after the training. This might be due to any other unrelated issue. For our further analysis, we excluded this student from our data set. However, training was effective for all ages.
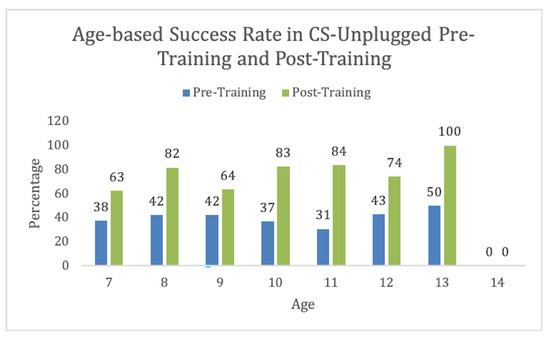
Figure 7.
CS-Unplugged Aged-based information.
5.4. Class Based Results
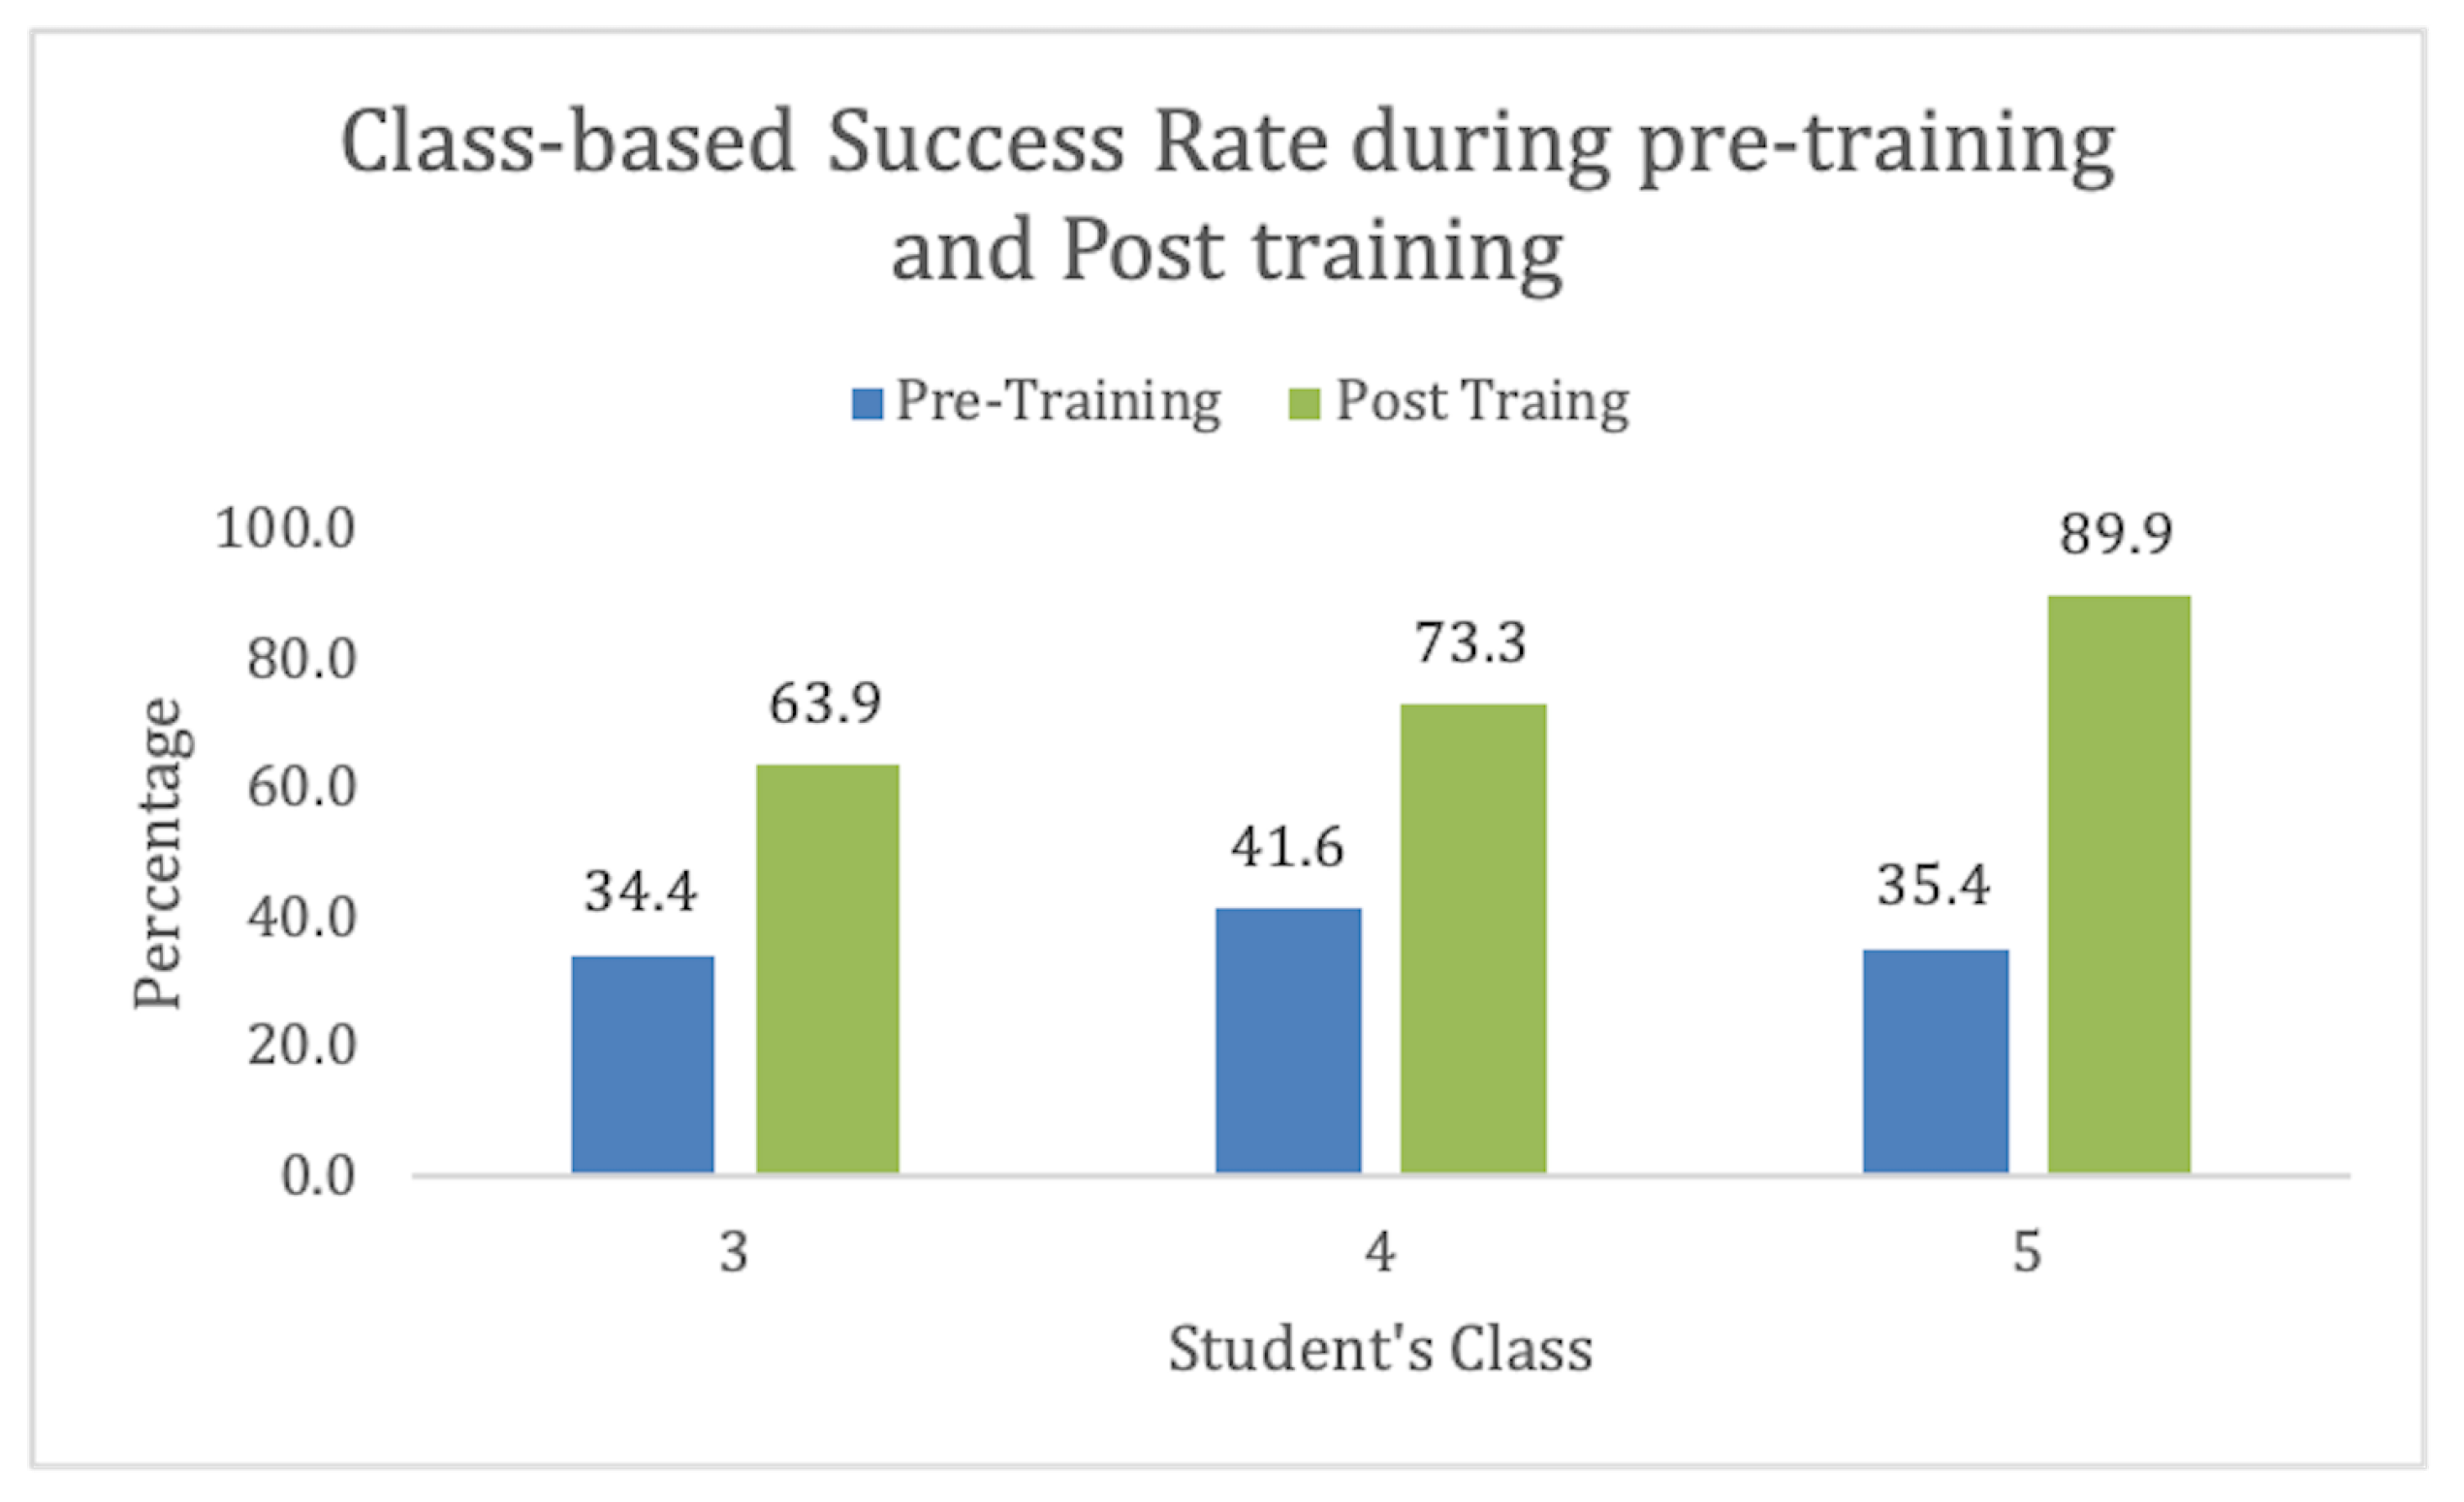
We had students from 3rd grade, 4th grade, and 5th grade. We found the training more effective for 5th grade. Also, these kids were old enough to understand the concept. This also depicts that the suitable age group for this activity in Pakistan is 11–13. These results are shown in Figure 8.
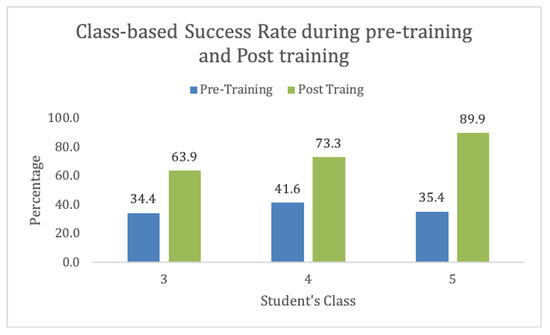
Figure 8.
CS-Unplugged Class-based information.
This analytical study helped us make our decision policy about which activity is more easily understandable by age, class, and gender so that we can focus and modify our content accordingly. We found that students could understand the concept and were more confident after training. We found a linear relation with each variable (age, gender, and academic level) here, and our post-training results encouraged us to continue with CS-Unplugged activities.
5.5. Supervised Machine Learning
Now, we will discuss the results related to our machine-learning model. Table 2 is curated to represent the fine-tuned hyper-parameters for optimization using several machine learning algorithms. We used the Sigmoid linear function for Logistic regression and performed an L2 penalty for regularization. In the decision tree, we used ID3 and kept the depth of the tree up to 4. We also performed a grid search for the optimization of the C and gamma parameters in SVM, and for our Q1, it was set to C = 0.001 and gamma = 100; for Q2, it was set to C = 10 and Gamma = 0.1.

Table 2.
Algorithms details along with tuned hyper-parameters for the setup.
Our first problem was to predict how the student would perform in the post-training activity, given the age, gender, class, and results of pre-training. Table 3 will represent the results for problem 1 when we used several algorithms:

Table 3.
Evaluation scores for the prediction of how the student will perform provided after training.
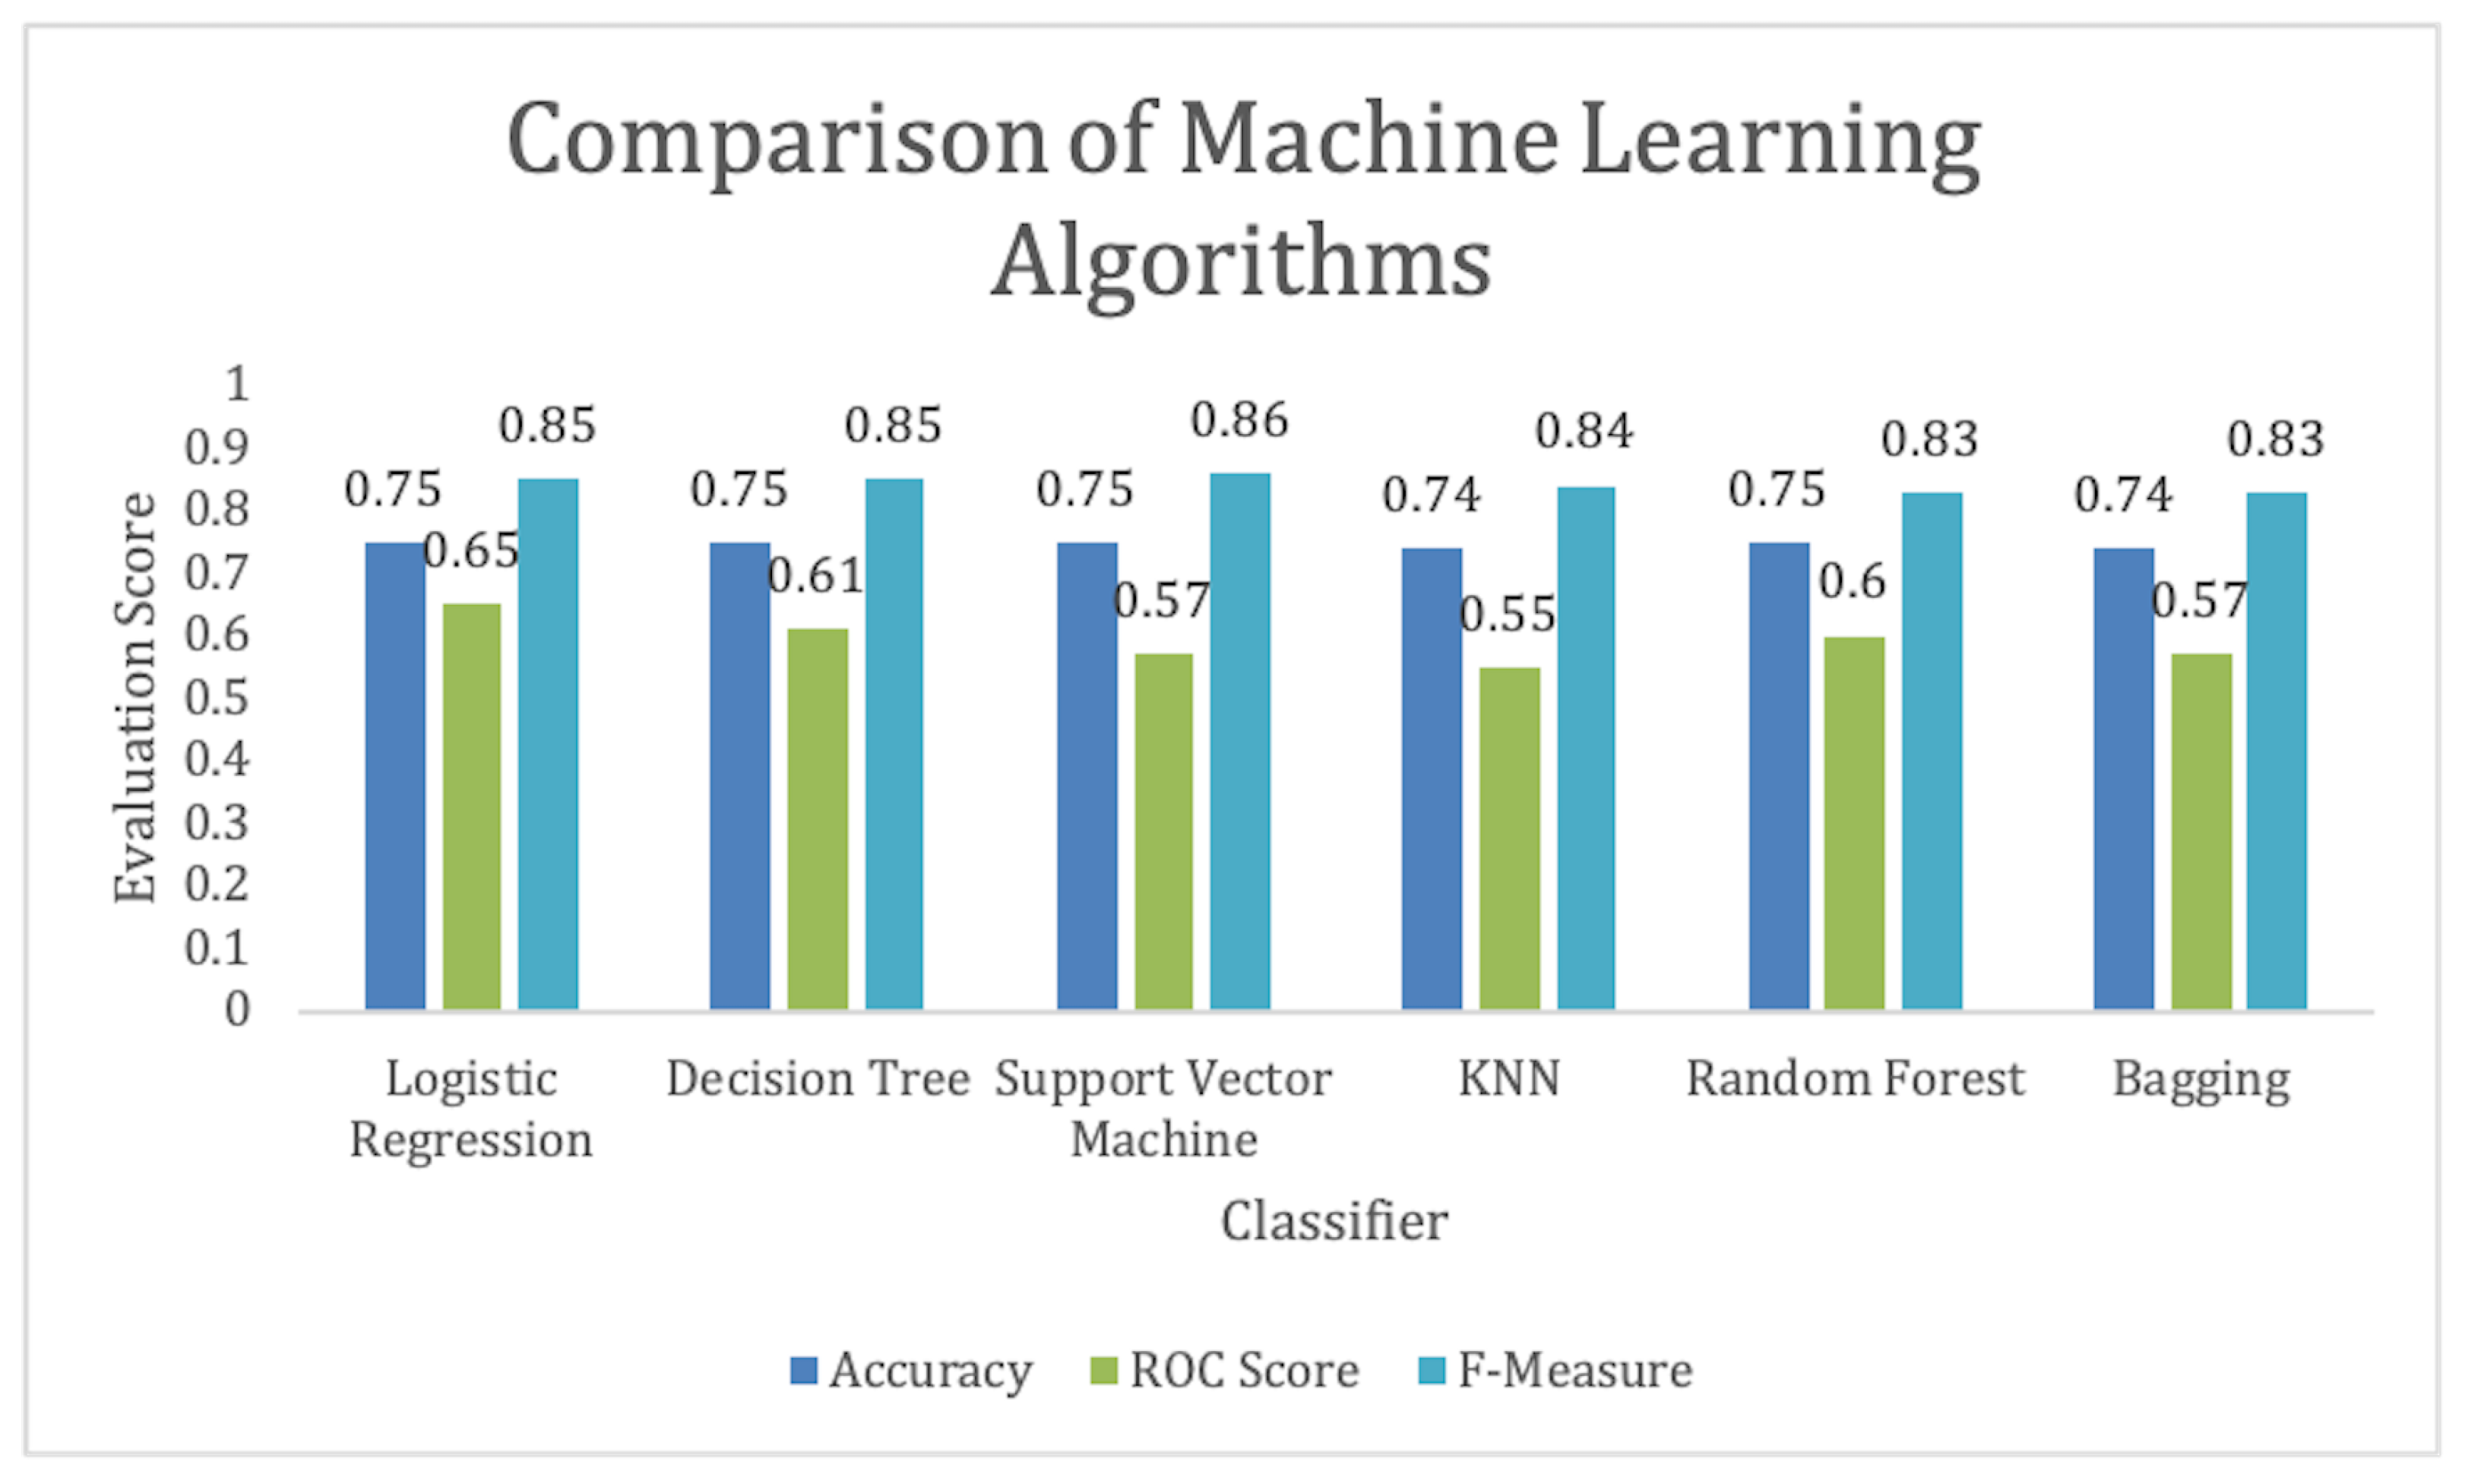
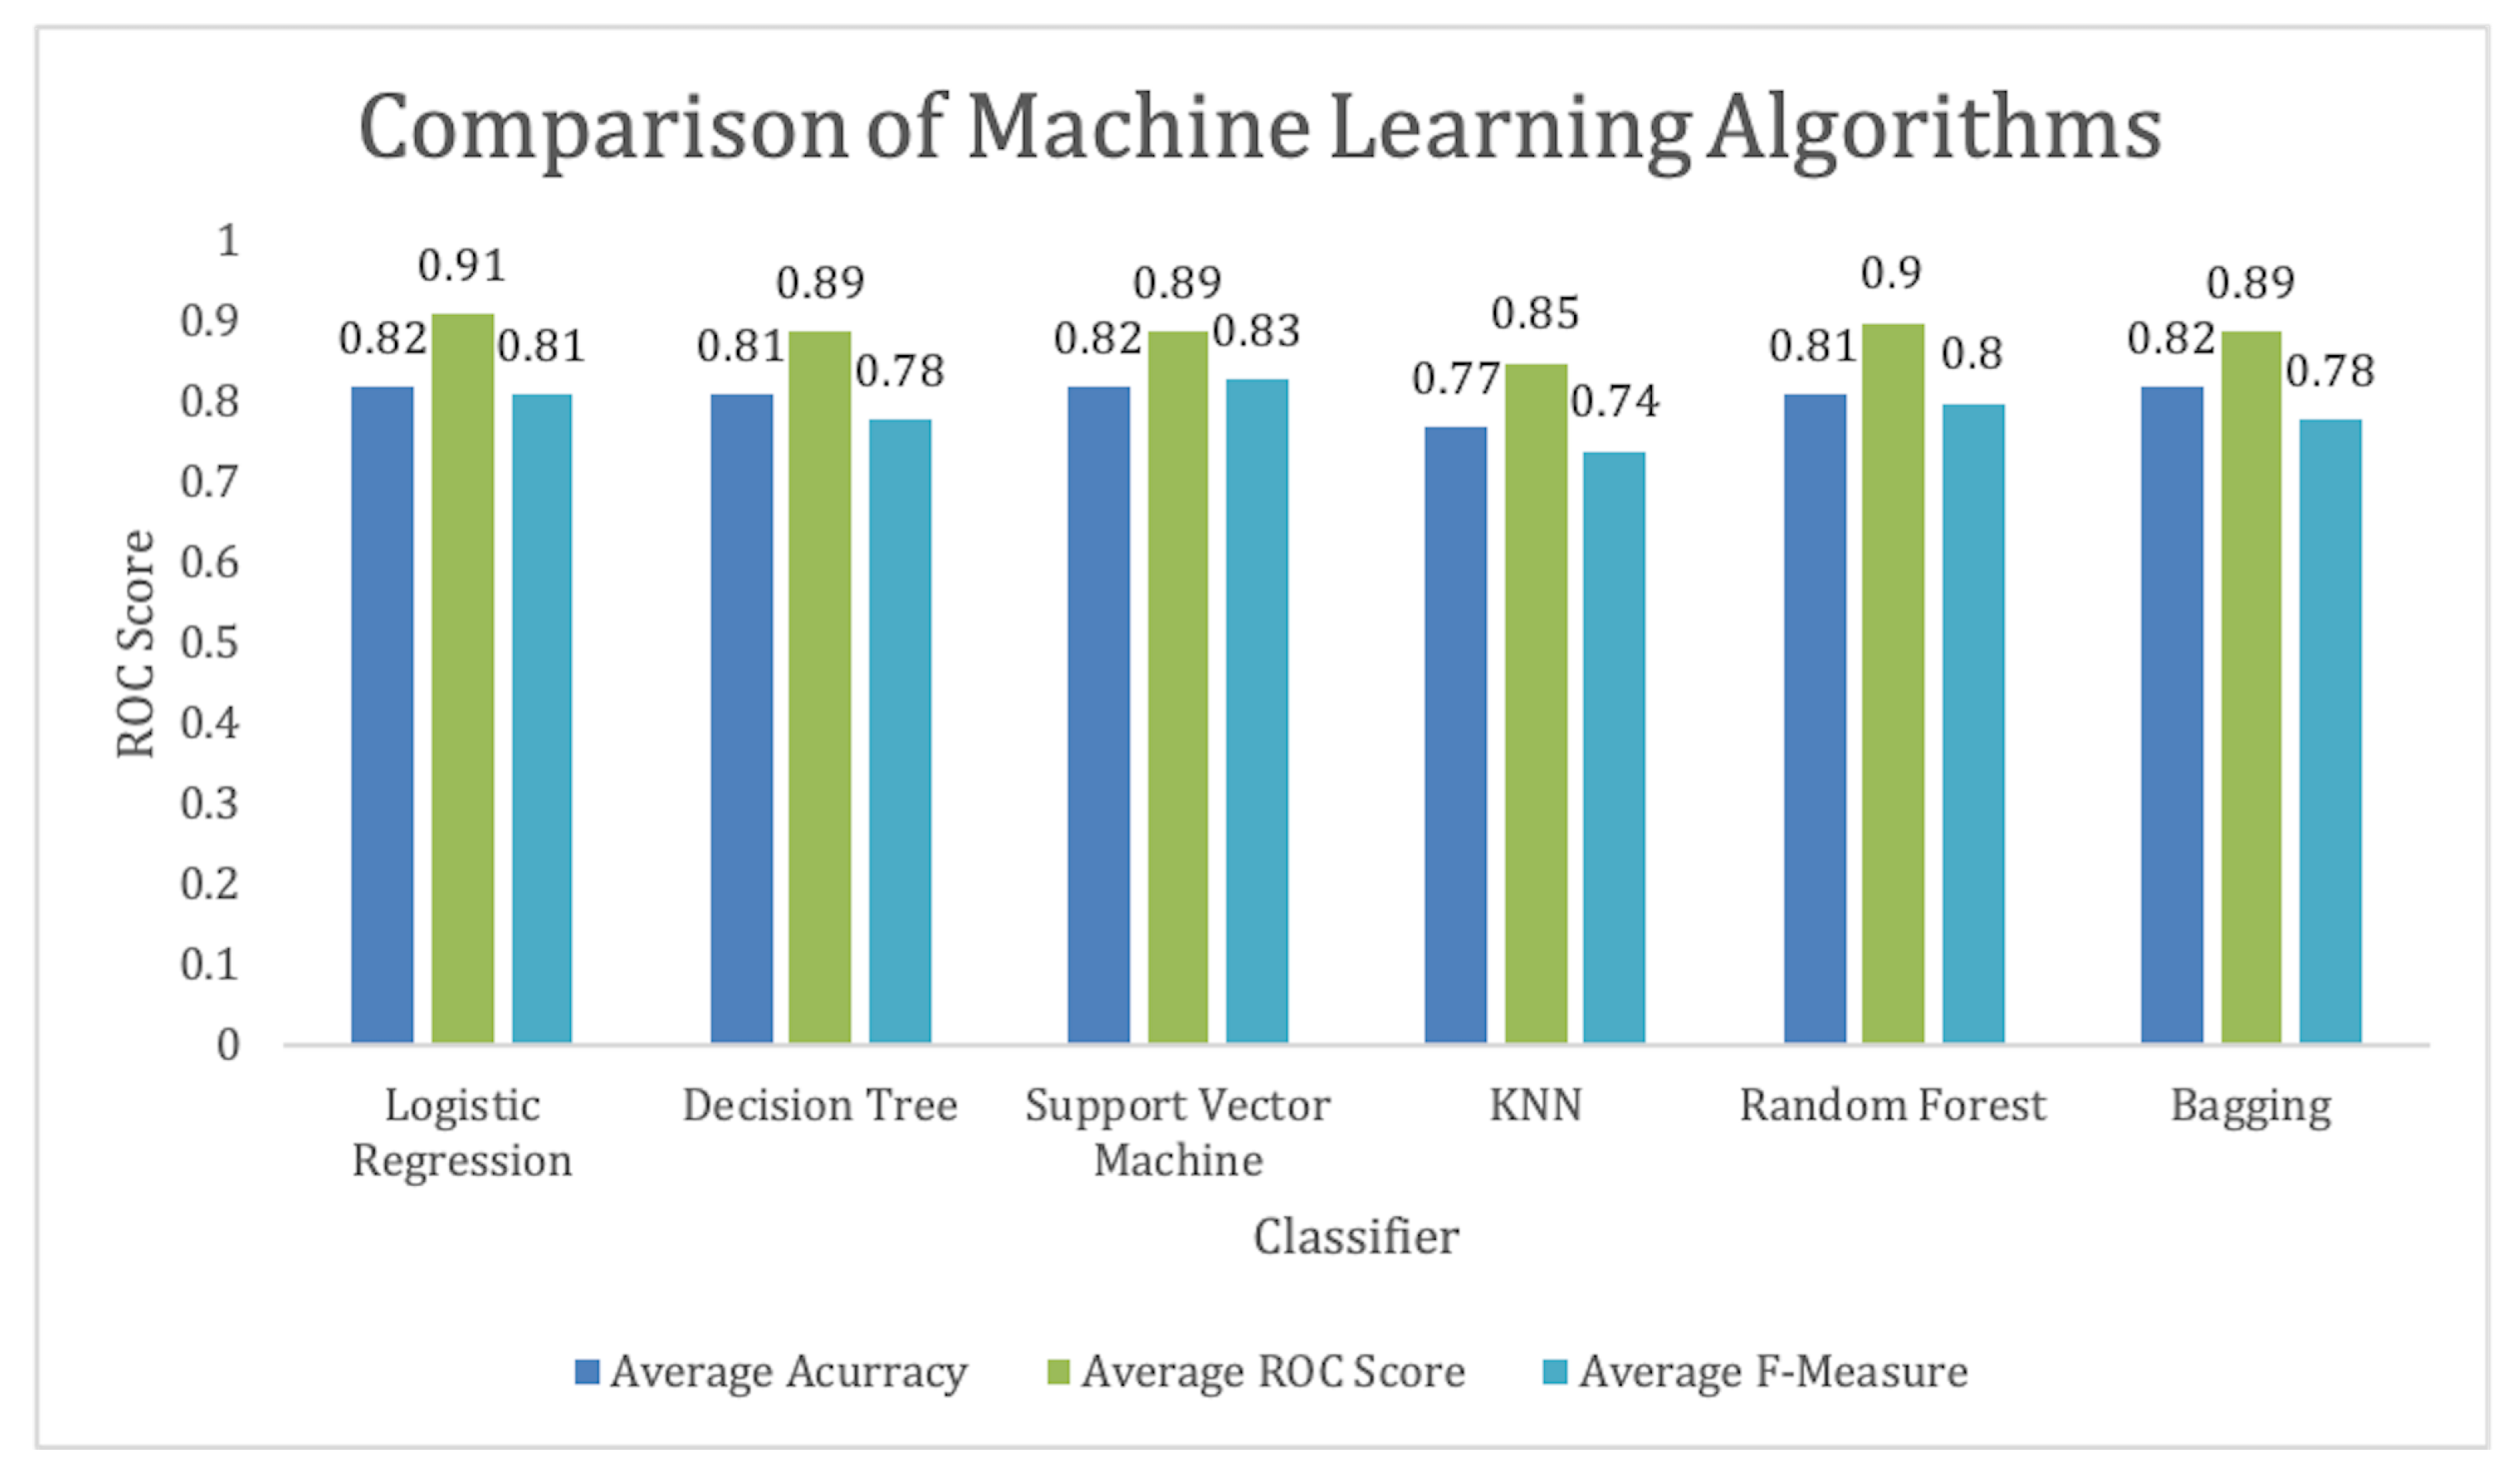
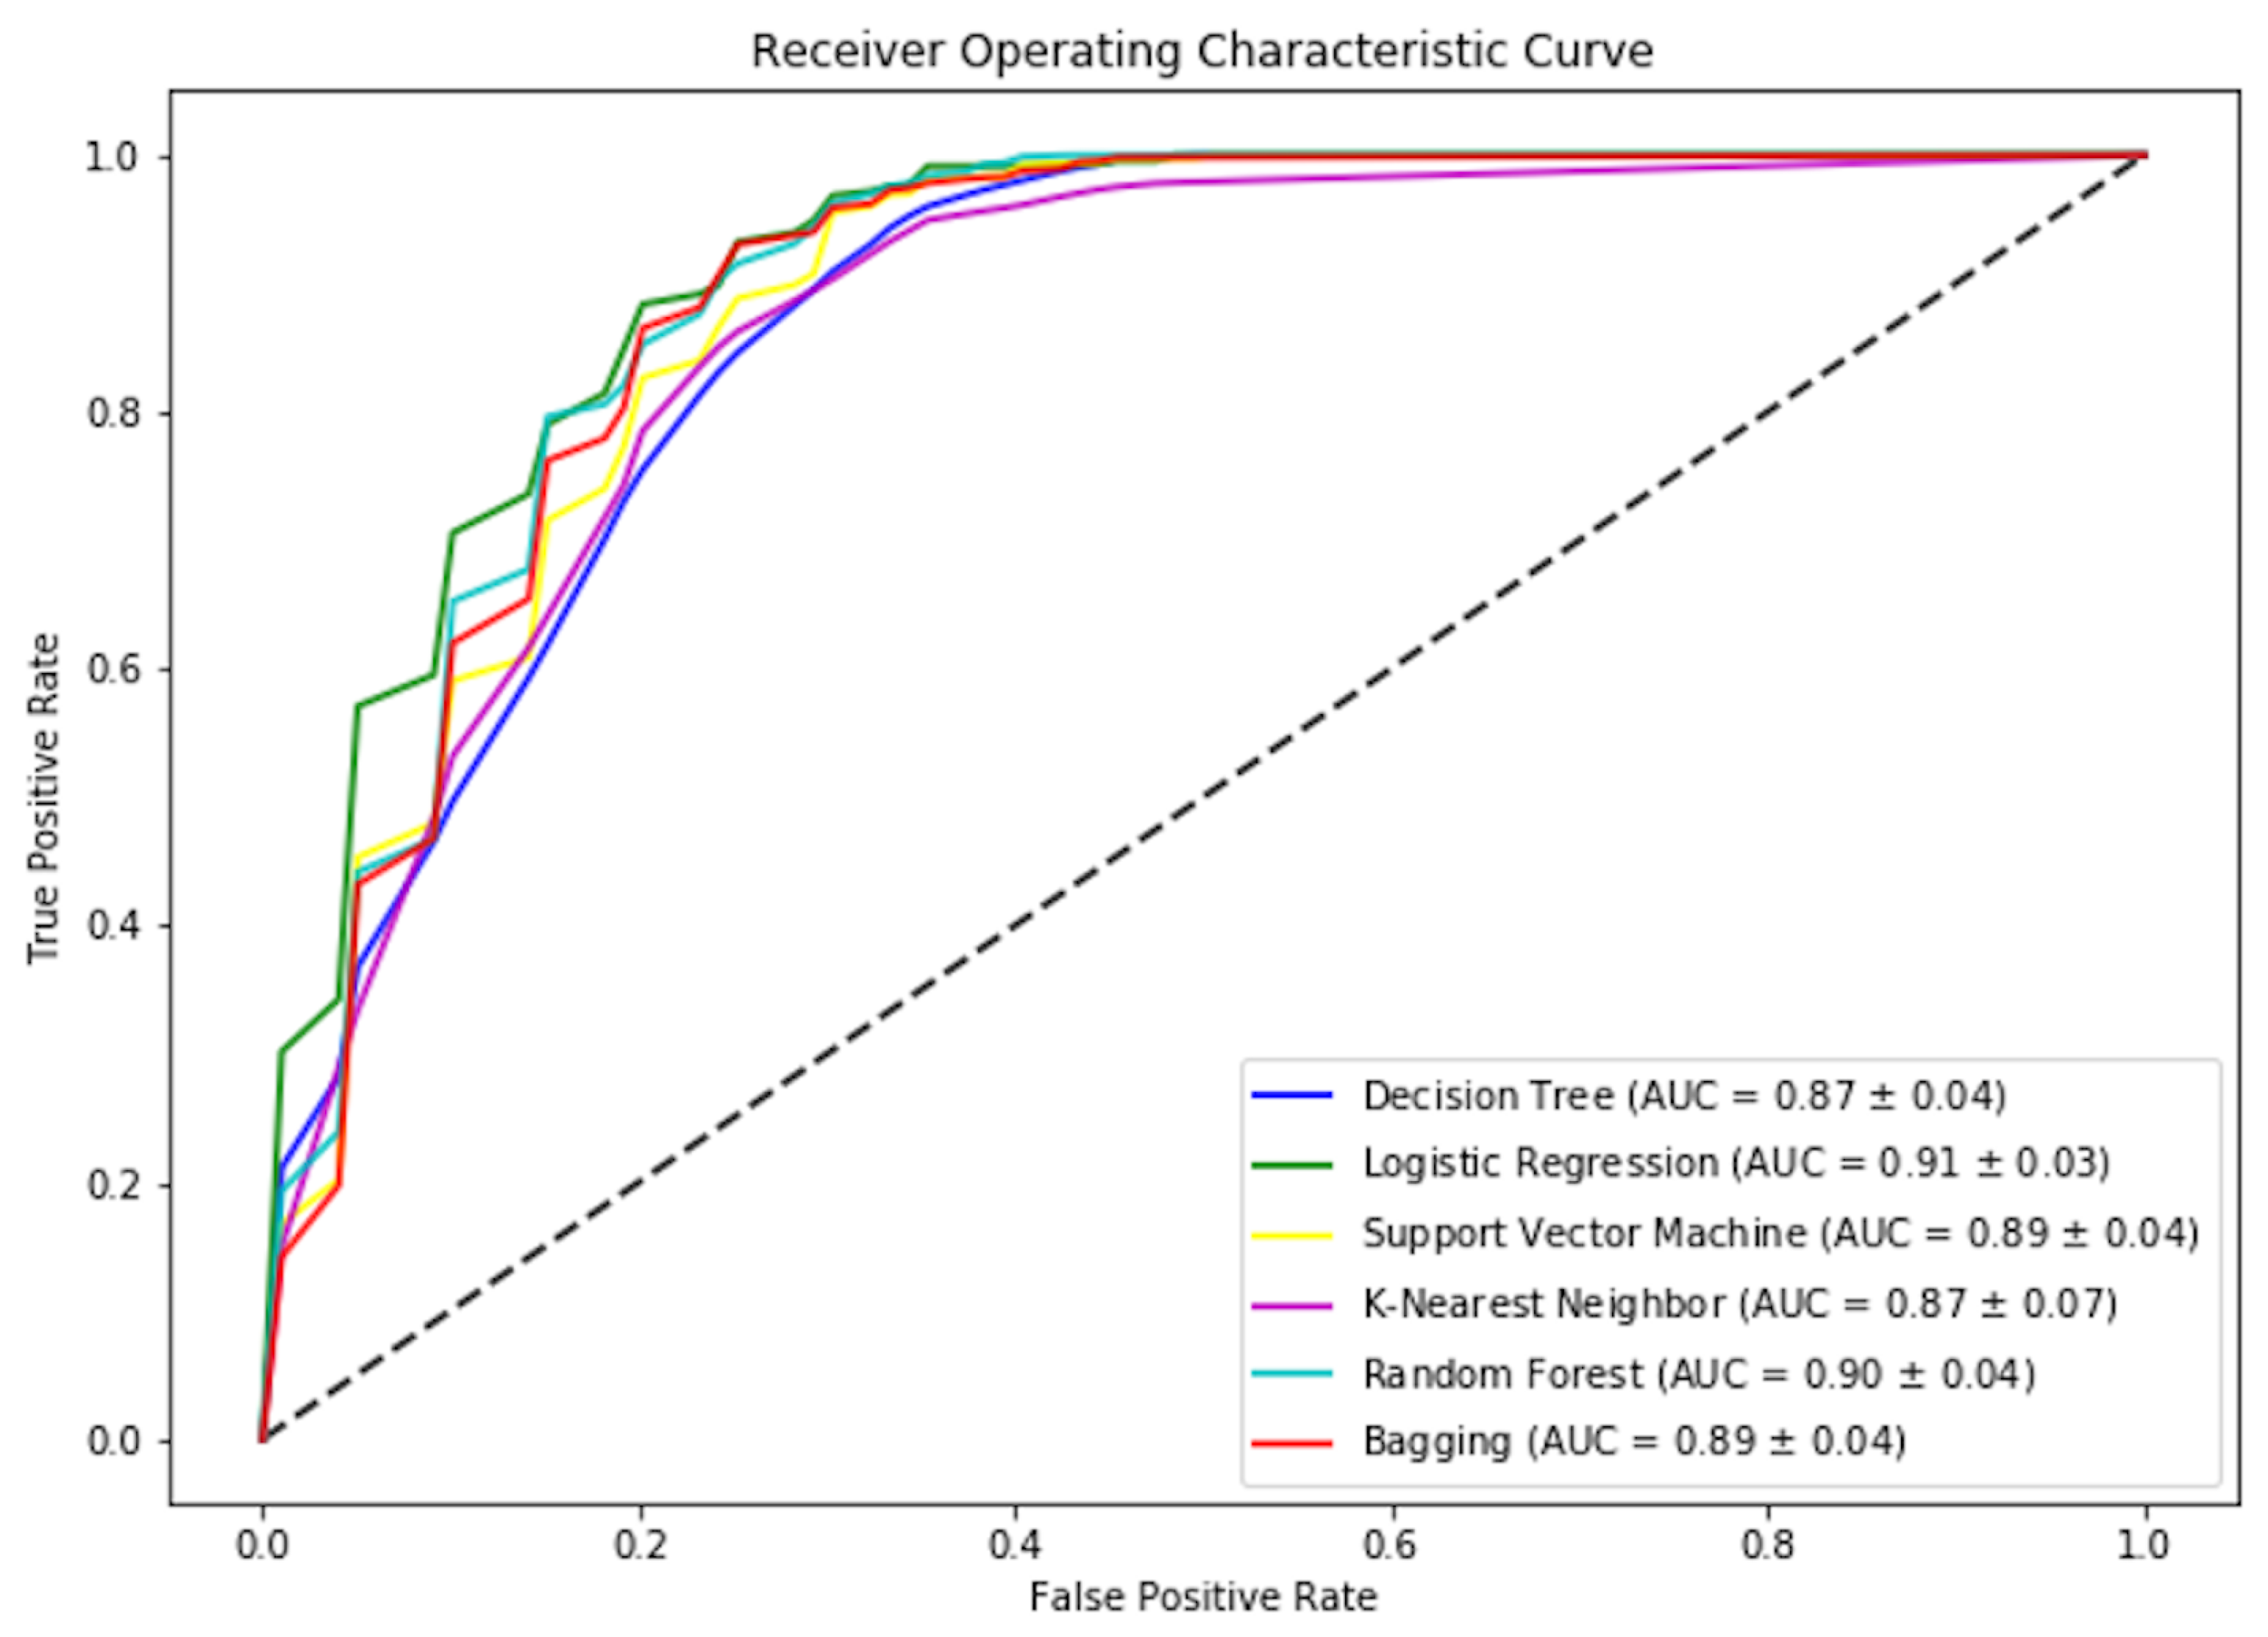
We can achieve above 70% accuracy using most of the selected algorithms. Similarly, the highest F-measure is achieved by the SVM. We can observe that logistic regression is performing best to predict which student will pass the test once the training is provided for the CS unplugged activity, as shown in Figure 9. Regarding the ROC score, as shown in Figure 10, we can see that logistic regression has the highest score. These results show the prediction of student performance based on past results and age, gender, and academic level.
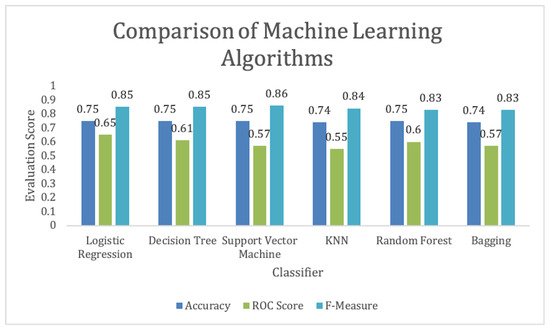
Figure 9.
Student performance prediction comparison using after training using machine learning algorithms.
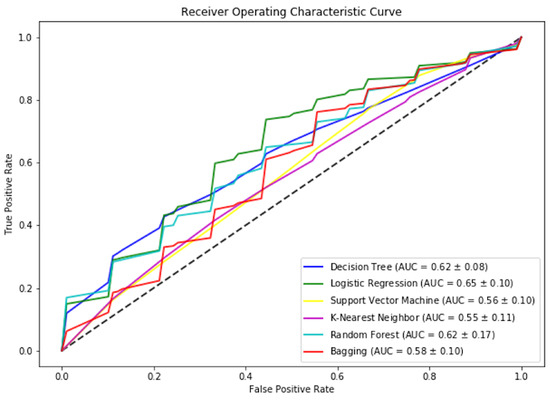
Figure 10.
Mean ROC Score for models used for student performance prediction based on training.
Our major interest in applying machine learning was addressed in Q2. We were looking at how effective our training is using the label to indicate positive outcomes only when the student failed pre-training and successfully completed the activity after training. The results of this experiment are summarized in Table 4.

Table 4.
Evaluation scores for predicting student performance.
Support Vector Machine(SVM) provides the highest F-measure score. Looking at the Accuracy and ROC score, we can conclude that Logistic regression is the best classifier among the chosen algorithms, as shown in Figure 11. The results showed that we were able to achieve more than 80% accuracy in 5 out of 6 selected algorithms. The highest ROC score is by Logistic regression, as shown in Figure 12. Due to a small data set, we picked those algorithms that can work efficiently for a smaller data set. We also have a small feature vector. We believe the decision tree will easily provide us with general rules. However, we could not get a pure tree and had to perform pruning. Also, KNN was picked that will be able to perform well due to its small dimensions. However, KNN was not able to perform as expected. That means our data is overlapping but maybe in a hyper-sphere structure. We can also observe that ensemble methods performed better, which was also expected due to the nature of the algorithm’s states.
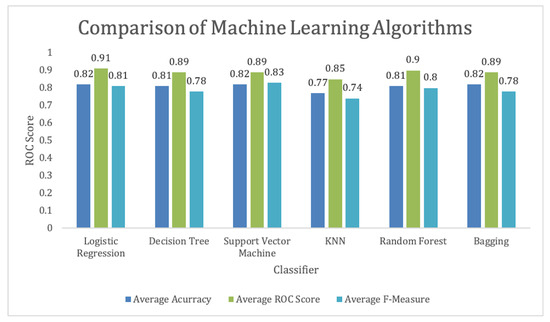
Figure 11.
Student performance prediction comparison using machine learning algorithms.
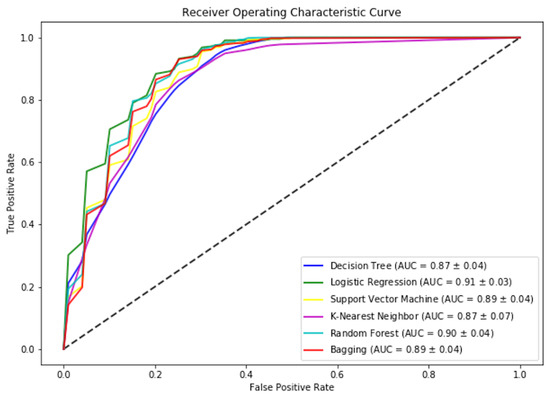
Figure 12.
Mean ROC Score for models used for student performance prediction.
We can observe logistic regression performs slightly better than the other algorithms. This depicts that the CS-Unplugged activity is simple to use and will have good learning results. Also, a simple model can predict these changes with much higher performance. This study is unique, and to the best of our knowledge, no such work has been done in providing CS-Unplugged training to students to understand the technique within limited resources in Pakistan. In these circumstances, we validated our results by random sampling. We created another data set using the ranges of each feature. We annotated our random data set using Gaussian distribution and then generated a logistic regression model using the same parameters.
The idea was to reject the following null hypothesis: Null Hypothesis: When our target function is applied, the random data set generates a similar outcome to the original data set. Alternate Hypothesis: When our target function is applied, the random data set will have a different outcome from the original data set.
We performed the 10-fold cross-validation on the random data set. To compare whether our two data sets are significantly different, we performed the Student’s t-test. Our p-value for accuracy results of both data sets for the first problem (given attributes, can we predict who will pass the after training) is , and for the second problem (given the training, whether there will be a positive outcome) is . This helps us reject the null hypothesis and validate the experiment.
6. Challenges and Threats to Validity
Considering the high dropout rate in the rural part of the country, the curriculum might be adapted to suit regional needs. This will require translating the proposed curriculum to regional languages and properly training teachers for unplugged activities.
7. Conclusions
Computational thinking is the step that comes before programming. Children who develop computational skills can articulate a problem and think logically. This process assists them to break down the issues at hand and predict what may happen in the future. It also helps them to explore cause and effect and analyze how their actions or the actions of others impact the given situation. Our study provides a stepping stone towards using the available resources but empowering elementary students with useful techniques to develop their analytical skills. Living in a third-world country, it is nearly impossible to equip each student with high-tech devices, but we can still provide them with the knowledge for problem-solving without computers. Besides, we have observed that CS-Unplugged training can be given to any Mathematics or Science teacher, as the approach does not require computer science knowledge. This could be a big success factor behind this methodology, which no longer depends on hardware or software resources for imparting the fundamentals of Computer Science to young minds. To the best of our knowledge, this is the first time that machine learning has been employed to predict the viability of CS Unplugged activities. We have developed a machine-learning model to predict students’ performance. This is a supervised learning model to predict student performance based on age, gender, class, and pre-training results. During the empirical study, we found that Logistic Regression performs best among the selected algorithms. In the future, we plan to conduct more studies encompassing other unplugged activities. The results will be used to train the model to improve the prediction performance. We also plan to add computer vision techniques to predict students’ interest in computer science based on the images of results from several experiments obtained from a student over the course of a specified time.
Author Contributions
S.J. conducted the literature review. During the case study, she collected data, trained the instructors, and contributed to manuscript writing. P.A. conducted the literature review, designed the project, applied machine learning to predict students’ performance, and contributed to manuscript writing. All authors have read and agreed to the published version of the manuscript.
Funding
This research received no external funding.
Institutional Review Board Statement
Not applicable.
Informed Consent Statement
Informed consent was obtained from all subjects involved in the study. The elementary school mathematics teacher performed this activity as a one-day activity during their regular lecture hour. Students were informed that it would be considered a research activity later on. The parents of the students were sent a letter to explain the research. No parent opt-out from the participation.
Data Availability Statement
Data and code will be available on request.
Acknowledgments
We thank Omar Arif, Hina Hussain Kazmi and Muhammad Asif Warsi for providing insightful comments on the earlier draft of the paper.
Conflicts of Interest
The authors declare no conflict of interest.
References
- United Nations. The Sustainable Development Goals Report 2022; Technical Report; United Nations: New York, NY, USA, 2022. [Google Scholar]
- NEMIS-PIE. Pakistan Education Statistics 2020-21; Number PIE Publication No. 296 in Analysis of Education Statistics II; NEMIS-PIE: Islamabad, Pakistan, 2021. [Google Scholar]
- Corradini, I.; Lodi, M.; Nardelli, E. Computational thinking in Italian schools: Quantitative data and teachers’ sentiment analysis after two years of “programma il future”. In Proceedings of the 2017 ACM Conference on Innovation and Technology in Computer Science Education, Bologna, Italy, 3–5 July 2017; pp. 224–229. [Google Scholar]
- Mughal, A.W.; Aldridge, J. Head teachers’ perspectives on school drop-out in secondary schools in rural Punjab, Pakistan. Educ. Stud. 2017, 53, 359–376. [Google Scholar] [CrossRef]
- Papert, S. Mindstorms: Children, Computers, and Powerful Ideas; Basic Books: New York, NY, USA, 1980. [Google Scholar]
- Wing, J.M. Computational Thinking. Commun. ACM 2006, 49, 33–35. [Google Scholar] [CrossRef]
- Wing, J. Research notebook: Computational thinking—What and why. Link Mag. 2011, 6, 20–23. [Google Scholar]
- Tsarava, K.; Moeller, K.; Román-González, M.; Golle, J.; Leifheit, L.; Butz, M.V.; Ninaus, M. A cognitive definition of computational thinking in primary education. Comput. Educ. 2022, 179, 104425. [Google Scholar]
- Relkin, E.; de Ruiter, L.; Bers, M.U. TechCheck: Development and validation of an unplugged assessment of computational thinking in early childhood education. J. Sci. Educ. Technol. 2020, 29, 482–498. [Google Scholar]
- Bers, M.U.; González-González, C.; Armas-Torres, M.B. Coding as a playground: Promoting positive learning experiences in childhood classrooms. Comput. Educ. 2019, 138, 130–145. [Google Scholar]
- Pugnali, A.; Sullivan, A.; Bers, M.U. The impact of user interface on young children’s computational thinking. J. Inf. Technol. Educ. Innov. Pract. 2017, 16, 171. [Google Scholar]
- Saxena, A.; Lo, C.K.; Hew, K.F.; Wong, G.K.W. Designing unplugged and plugged activities to cultivate computational thinking: An exploratory study in early childhood education. Asia-Pac. Educ. Res. 2020, 29, 55–66. [Google Scholar]
- Relkin, E.; de Ruiter, L.E.; Bers, M.U. Learning to code and the acquisition of computational thinking by young children. Comput. Educ. 2021, 169, 104222. [Google Scholar]
- Minamide, A.; Takemata, K.; Yamada, H. Development of Computational Thinking Education System for Elementary School Class. In Proceedings of the 2020 IEEE 20th International Conference on Advanced Learning Technologies (ICALT), Tartu, Estonia, 6–9 July 2020; pp. 22–23. [Google Scholar]
- Busuttil, L.; Formosa, M. Teaching computing without computers: Unplugged computing as a pedagogical strategy. Inform. Educ. 2020, 19, 569–587. [Google Scholar]
- Tsarava, K.; Leifheit, L.; Ninaus, M.; Román-González, M.; Butz, M.V.; Golle, J.; Trautwein, U.; Moeller, K. Cognitive Correlates of Computational Thinking: Evaluation of a Blended Unplugged/Plugged-In Course. In Proceedings of the 14th Workshop in Primary and Secondary Computing Education, Glasgow, UK, 23–25 October 2019. [Google Scholar] [CrossRef]
- Su, J.; Yang, W. Artificial intelligence in early childhood education: A scoping review. Comput. Educ. Artif. Intell. 2022, 3, 100049. [Google Scholar]
- Zhang, L.; Nouri, J. A systematic review of learning computational thinking through Scratch in K-9. Comput. Educ. 2019, 141, 103607. [Google Scholar]
- Schanzer, E.; Krishnamurthi, S.; Fisler, K. What does it mean for a computing curriculum to succeed? Commun. ACM 2019, 62, 30–32. [Google Scholar]
- Bell, T. Establishing a nationwide CS curriculum in New Zealand high school. Commun. ACM 2014, 57, 28–30. [Google Scholar]
- Webb, M.; Davis, N.; Bell, T.; Katz, Y.J.; Reynolds, N.; Chambers, D.P.; Syslo, M.M. Computer science in K-12 school curricula of the 21st century: Why, what and when? Educ. Inf. Technol. 2017, 22, 445–468. [Google Scholar]
- Passe, D. Computer Science (CS) in the compulsory education curriculum: Implications for future research. Educ. Inf. Technol. 2017, 22, 421–443. [Google Scholar]
- Medeiros, R.P.; Ramalho, G.L.; Falcão, T.P. A Systematic Literature Review on Teaching and Learning Introductory Programming in Higher Education. IEEE Trans. Educ. 2019, 62, 77–90. [Google Scholar] [CrossRef]
- Bell, T.; Andreae, P.; Robins, A.V. A case study of the introduction of computer science in NZ schools. TOCE 2014, 14, 1–31. [Google Scholar]
- Bell, T.; Tymann, P.; Yehudai, A. The big ideas in computer science for K-12 curricula. Bull. EATCS 2018, 124. [Google Scholar]
- Curzon, P.; McOwan, P.W.; Cutts, Q.I.; Bell, T. Enthusing & inspiring with reusable kinaesthetic activities. In Proceedings of the 14th Annual ACM SIGCSE Conference on Innovation and Technology in Computer Science Education, Paris, France, 3–7 July 2009; pp. 94–98. [Google Scholar]
- Román-González, M.; Pérez-González, J.C.; Moreno-León, J.; Robles, G. Can computational talent be detected? Predictive validity of the Computational Thinking Test. Int. J. Child-Comput. Interact. 2018, 18, 47–58. [Google Scholar]
- Dagienė, V.; Sentance, S. It’s computational thinking! Bebras tasks in the curriculum. In Proceedings of the Informatics in Schools: Improvement of Informatics Knowledge and Perception: 9th International Conference on Informatics in Schools: Situation, Evolution, and Perspectives, ISSEP 2016, Münster, Germany, 13–15 October 2016; Springer: Berlin/Heidelberg, Germany, 2016; pp. 28–39. [Google Scholar]
- Sentence, S.; Csizmadia, A.P. Computing in the curriculum: Challenges and strategies from a teacher’s perspective. EAIT 2017, 22, 469–495. [Google Scholar]
- Teaching London Computing Project. Available online: http://teachinglondoncomputing.org/ (accessed on 25 January 2021).
- Hosseini, H.; Hartt, M.; Mostafapour, M. Learning IS Child’s Play: Game-Based Learning in Computer Science Education. ACM Trans. Comput. Educ. 2019, 19, 1–18. [Google Scholar] [CrossRef]
- Computer Science (CS) Unplugged. Available online: https://csunplugged.org/ (accessed on 23 January 2023).
- Hastie, T.; Tibshirani, R.; Friedman, J. The Elements of Statistical Learning: Data Mining, Inference, and Prediction; Springer: New York, NY, USA, 2011. [Google Scholar]
- Kay, R.; Little, S. Transformations of the explanatory variables in the logistic regression model for binary data. Biometrika 1987, 74, 495–501. [Google Scholar] [CrossRef]
- Quinlan, J. Induction of decision tree. J. Mach. Learn. 1986, 1, 81–106. [Google Scholar] [CrossRef]
- Cortes, C.; Vapnik, V. Support Vector Network. Mach. Learn. 1995, 20, 273–297. [Google Scholar] [CrossRef]
- Han, J.; Kamber, M.; Pei, J. Data Mining: Concepts and Techniques; Elsevier: Amsterdam, The Netherlands, 2011. [Google Scholar]
- Breiman, L. Random Forests. Mach. Learn. 2001, 45, 5–32. [Google Scholar] [CrossRef]
- Hall, M.; Witten, I.; Frank, E. Data Mining: Practical Machine Learning Tools and Techniques; Kaufmann: Burlington, MA, USA, 2019. [Google Scholar]
Disclaimer/Publisher’s Note: The statements, opinions and data contained in all publications are solely those of the individual author(s) and contributor(s) and not of MDPI and/or the editor(s). MDPI and/or the editor(s) disclaim responsibility for any injury to people or property resulting from any ideas, methods, instructions or products referred to in the content. |
© 2023 by the authors. Licensee MDPI, Basel, Switzerland. This article is an open access article distributed under the terms and conditions of the Creative Commons Attribution (CC BY) license (https://creativecommons.org/licenses/by/4.0/).


