Article

Acceptance and Intentions of Using Dynamic Geometry Software by Pre-Service Primary School Teachers

by
Steven Van Vaerenbergh
1,*,
Adrián Pérez-Suay
2 and
Pascual D. Diago
2
1
Departamento de Matemáticas, Estadística y Computación, Universidad de Cantabria, Av. de los Castros 48, 39005 Santander, Spain
2
Departament de Didàctica de la Matemàtica, Universitat de València, Av. Tarongers 4, 46022 València, Spain
*
Author to whom correspondence should be addressed.
Educ. Sci. 2023, 13(7), 661; https://doi.org/10.3390/educsci13070661
Submission received: 30 April 2023 / Revised: 24 June 2023 / Accepted: 26 June 2023 / Published: 28 June 2023
(This article belongs to the Special Issue Models and Tools for Math Education)

Abstract

:
In this paper, we empirically verify the validity of the extended Technology Acceptance Model (TAM) for the use of Dynamic Geometry Software (DGS) in teaching geometry, as proposed by Pittalis. The model includes the notion of “perceived pedagogical-learning fit” in addition to the traditional belief and attitude variables of TAM. We employ a structural equation modeling approach to capture the relationships between the different latent constructs. With a sample of 135 pre-service primary school teachers as participants, our study provides valuable insights into the factors influencing the adoption of DGS in geometry teaching. The results reveal that the extended TAM serves as a suitable framework to evaluate the intentions of teachers to use DGS in teaching geometry. However, we also observe some discrepancies in the predictive power of various latent factors when compared to the original study. These findings not only contribute to our understanding of the factors affecting the adoption of DGS in geometry teaching but also provide valuable insights for future research and practice.

1. Introduction

Dynamic geometry software (DGS) holds the potential to revolutionize the teaching and learning of geometry by integrating modern instruments into human activities [1]. A wealth of literature exists, highlighting the efficacy of DGS in geometry education. As a powerful didactic tool, DGS offers numerous advantages, including enhancing mathematics instruction, bolstering visualization skills, examining the interrelationships of geometric shapes’ structural elements, and fostering creative thinking [2,3,4]. Additionally, an appropriate use of DGS lays the groundwork for analysis and deductive proof [5,6], encourages participation in classroom interactions [7], and elevates students’ overall understanding of geometry [8].
Despite the potential benefits of DGS, research indicates that its adoption and utilization in classrooms remain limited [9]. This underutilisation may be attributed to teachers’ beliefs and attitudes towards the software [3,4,10], making it essential to investigate teachers’ beliefs concerning the usefulness of DGS and their intentions to integrate it into their teaching practices [11]. In particular, by examining the influence of mathematics teachers’ beliefs on their intended and actual usage of dynamic mathematics software, valuable insights can be gained into the perceived usefulness of the technology and its potential to enrich learning and teaching experiences in the classroom [9,12].
Building upon this understanding, the Technology Acceptance Model (TAM) serves as a widely used framework to comprehend how users’ beliefs and attitudes influence their acceptance of information technology systems [13]. Although initially designed from a business and commercial perspective, TAM has been extensively adopted in education through empirical studies, as it elucidates how users’ beliefs and attitudes affect their technology usage behavior [14,15,16,17,18]. However, several weaknesses of TAM have been identified, including its lack of task focus [19], as it does not measure the alignment of technology use with specific topics to be taught or learned. To address this issue, Dishaw and Strong expanded the model to incorporate “task-technology fit” (TTF) [19], which refers to matching the capabilities of the technology to the demands of a particular topic.
In the context of teaching with dynamic geometry software, Pittalis introduced an extended TAM that integrates traditional TAM indicators and TTF considerations [20]. In this extended model, TTF is employed to assess the perceived alignment between a technology and the instructional goals, by means of the “perceived learning-fit” (PLF) of the software. This factor is added to the conventional TAM as a predictor of teachers’ intentions to use DGS in geometry teaching. Specifically, PLF encompasses the teacher’s perception of the suitability of employing DGS to teach a particular geometry concept. In particular, the extended TAM was employed to evaluate the intention of secondary school teachers to use DGS in their instruction. Among other findings, the study concluded that perceived pedagogical-learning fit and attitude were the strongest predictive factors of intention to use DGS in geometry teaching, while perceived usefulness did not significantly affect their intention to use it.
The objective of this paper is to assess the validity of the extended TAM proposed by Pittalis [20] in evaluating pre-service primary school teachers’ intention to use DGS in geometry teaching. We expect our findings to be consistent with the previous research, showing that the extended TAM is a suitable framework for assessing how teachers perceive and intend to use DGS in geometry teaching. We conduct a replication study using the same materials and a different sample of participants, following a data processing procedure similar to the original study. Through this research, we seek to confirm and generalize previous findings in educational research, enhancing the robustness and reliability of the results [21].

2. Research framework

2.1. Technology Acceptance Model (TAM)

The Technology Acceptance Model (TAM) is a widely accepted theoretical framework used to explain the factors that influence individuals’ acceptance and use of technology [22]. The model was first introduced by Davis in 1989, and since then, numerous researchers have extended and modified it to suit various contexts. TAM posits that individuals’ behavior towards technology is volitional, implying that they can either accept or reject technology based on their beliefs and attitudes [14]. The model suggests that two belief variables, perceived usefulness (PU) and perceived ease of use (PEU), primarily determine an individual’s intention to employ technology [23]. PU encompasses the subjective belief that using a specific technology will enhance job performance or productivity, while PEU pertains to the extent to which an individual believes that employing the technology will be effortless.
The TAM has been extensively applied across diverse fields, including healthcare, business, and information systems, to assess individuals’ acceptance and usage of various technologies such as mobile devices, e-learning platforms, social media platforms, and many others. Its incorporation in education is a more recent development, with studies examining teachers’ acceptance of novel technologies like online learning and technology in education [24].
Nonetheless, the basic TAM exhibits certain limitations. TAM presupposes a linear relationship between PU, PEU, attitude towards using technology, and intention to use it, which may not consistently correspond to real-world situations [25]. Moreover, the model does not account for external variables, such as social influence or organisational culture, which could affect individuals’ acceptance of technology, although it can readily be expanded to include external variables [26]. Other variables, including trust, experience, and compatibility, can also influence individuals’ acceptance of technology and ought to be considered in conjunction with TAM.

2.2. Perceived-Learning Fit Extension

In the context of dynamic geometry, Pittalis introduced the concept of “perceived pedagogical-learning fit” as a reflection of the TTF, to represent the teacher’s perception of the quality of teaching and learning geometry with Dynamic Geometry Software (DGS) [20]. In essence, teachers may opt to utilise a technological tool if they believe its use aligns with their instructional objectives. Specifically, DGS can be used to perform several tasks of the mathematical work involved in learning geometry, such as creating, visualizing, exploring, and analyzing geometric concepts [27].
To integrate PLF into the Technology Acceptance Model (TAM) framework, Duval’s geometry reasoning model was employed as a foundation for measuring the specific task requirements and tool functionality of DGS. This model offers a theoretical framework for understanding how students learn geometry through three types of cognitive processes, which fulfill specific epistemological functions [28]:
  • Visualization processes related to space representation for illustrating statements, heuristic exploration of complex situations, synoptic glances, or subjective verification;
  • Construction processes using tools, where the construction of configurations can work like a model, relating actions on the representative and observed results to the mathematical objects being represented;
  • Reasoning processes in relation to discursive processes for extending knowledge, providing proof, and offering explanations
While these processes could be performed independently, they represent three interconnected cognitive processes that are essential for achieving proficiency in geometry [28]. Notably, DGS can address each of these processes and foster their synergy, thereby facilitating a comprehensive approach to geometric learning [5].

2.3. Extended TAM

Based on the previous arguments, the extended TAM used in this study consists of the following latent constructs [20]:
(a)
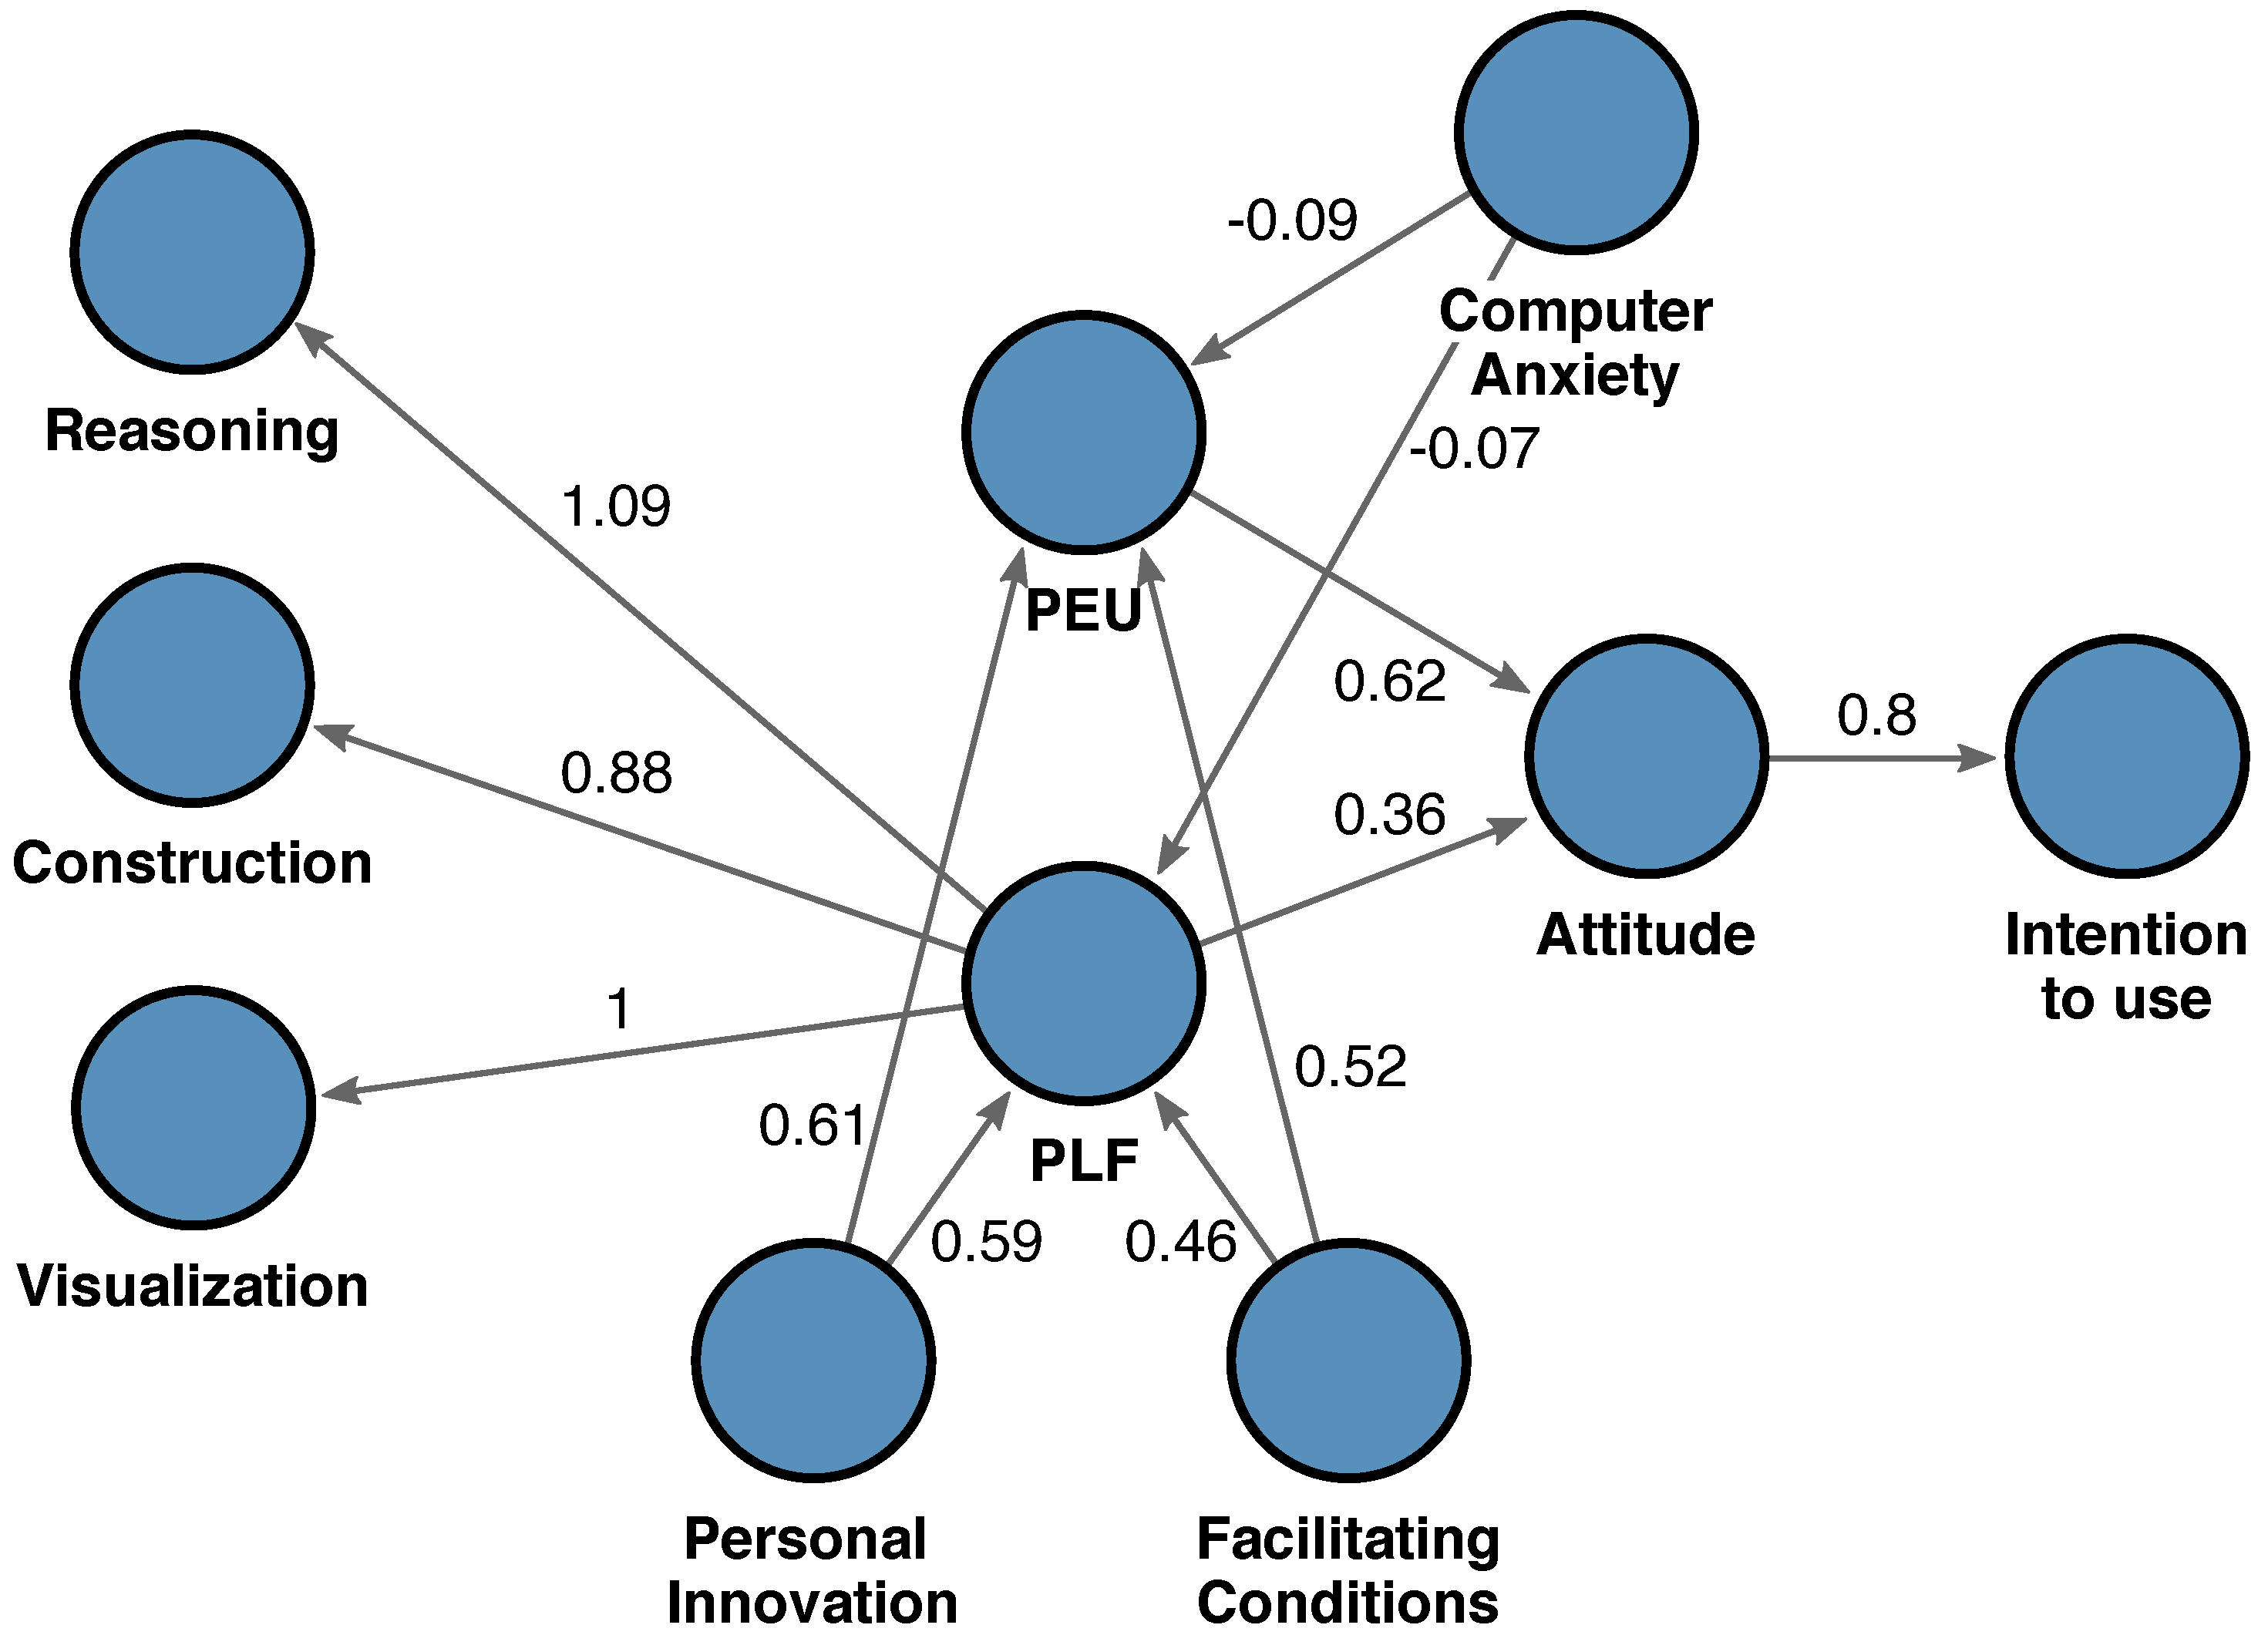
First-order latent variables related to the geometry reasoning model: Visualization Processes (VP), Reasoning Processes (RP), and Construction Processes (CP). These factors constitute the second-order latent factor Perceived Learning-fit (PLF). Specifically, it is hypothesized that PLF influences teachers’ intention to use DGS in geometry teaching.
(b)
Traditional TAM variables as first-order latent factors: Perceived usefulness (PU), Perceived Ease of Use (PEU), Attitude Towards Use (ATU), and Intention to Use (IU). It is hypothesized that teachers’ intention to use DGS in geometry teaching is directly influenced by their attitude towards the use of DGS and indirectly by the PU of DGS, the PEU, and the PLF, through their attitude towards the use of DGS, based on the assumptions of TAM theory. Finally, the proposed model suggests that PU and PLF have a direct effect on attitude, while PEU has both a direct and an indirect (through PU and PLF) effect on attitude.
(c)
External variables as first-order latent factors: Facilitating Conditions (FC), Computer Anxiety (CA), and Personal Innovation (PI). It is hypothesized that these external variables influence the latent constructs PEU, PU, and PLF.
In the original proposed model, “Age” was included as an additional external variables. However, in our study, we did not incorporate this external variable. The rationale behind this decision is that the participants in our study were predominantly students from the same course, with only a few exceptions having a different age. Furthermore, in the original study, age exhibited only a minimal impact on the latent variables within the model.

3. Methodology

We employ a structural equation modeling (SEM) approach to capture the relationships between the different variables described earlier. This statistical technique allows us to construct a comprehensive research model that represents the complex interplay among the factors influencing pre-service primary school teachers’ acceptance and intentions to use dynamic geometry software (DGS) in their teaching practices. By using SEM, we can assess both the direct and indirect effects of these variables, while accounting for measurement error and potential confounding factors. This method also enables us to test the proposed hypotheses and examine the goodness of fit of our research model, providing a robust and reliable framework for understanding the key determinants of DGS adoption in the context of primary mathematics education.

3.1. Participants

A total of 135 voluntary participants were involved in this study, all of whom were pre-service primary school teachers enrolled in a Bachelor’s degree program in Elementary Education at a public university in Spain. As part of their coursework, these students received instruction in the use of a DGS during the subject “Didactics of Geometry”, which is dedicated to the pedagogical aspects of teaching geometry in primary education. The instruction consisted of three practical two-hour sessions, providing the participants with hands-on experience in utilizing DGS. To facilitate more effective learning and individual attention, the participants were divided into four groups, each led by a different instructor. Despite the difference in instructors for each group, a consistent teaching approach was ensured by using a uniform syllabus, identical presentation slides, and standardized activity sheets across all groups.

3.2. Instrument

The questionnaire utilized in this study is based on the Technology Acceptance Model (TAM), which was extended to evaluate the perceived pedagogical-learning fit of pre-service teachers. This extension aims to examine the participants’ perceived fit of DGS in terms of visualization, reasoning, and construction processes, based on the geometry reasoning model [28]. The questionnaire comprises a total of 30 statements, represented in Table 1. Out of these, 9 statements are dedicated to the three aforementioned dimensions, and the remaining 21 statements measuring correspond the traditional TAM constructs. These constructs include perceived ease of use, perceived usefulness, attitude towards using DGS, and intention to use. The questionnaire was designed with careful consideration for its reliability and validity [20].
We utilized a seven-level Likert-type scale to assign numerical values to each question. This scaling method measures positive or negative responses to a statement. Our questionnaire consisted of answers ranging from strongly disagree to strongly agree, with numerical values assigned to each answer on a scale from 1 to 7. Specifically, the scale included the following responses: strongly disagree, disagree, somewhat disagree, neither agree nor disagree, somewhat agree, agree, and strongly agree.

3.3. Structural Equation Model

The considered set of variables describing the acceptance model consists of two parts. The first part is based on the geometrical reasoning model, which involves three cognitive processes fulfilling different epistemological functions: visualization, construction with tools, and reasoning processes for the extension of knowledge, explanation and proof. These cognitive processes are closely interrelated and necessary for achieving proficiency in geometry. The second part is the traditional technology acceptance model, which includes the variables perceived ease of use (PEU) and perceived usefulness, influencing attitude towards use and intention to use DGS.
The adopted structural equation model of the TAM is illustrated in Figure 1. Each node in the diagram represents a latent factor that is supported by three indicators, which can be found in Table 1. The arrows between the nodes indicate the relationships among the latent variables, and the values next to each node show the estimated strength of the relationship between the variables. For example, the PLF latent factor comprises Reasoning, Visualization, Construction, and Attitude, which are ordered based on their estimated numerical values. It should be noted that, based on the analysis in [20], PU was found not to exert a statistically significant effect on teachers’ attitudes towards the employment of DGS. As our work aims to faithfully replicate the structural equation model from this previous study, PU was not incorporated into the diagram of the structural equation model illustrated in Figure 1.
The analysis in [20] indicated that PU did not exert a statistically significant impact on teachers’ attitudes towards the use of DGS, and since we are replicating their structural equation model, it is not included in the diagram of Figure 1.
To analyze the SEM, we employ the expectation-maximization technique [29] (chapter 3). As evidenced in Figure 1, regression values greater than 1 may appear, as established by Deegan [30], indicating that such values can legitimately occur in the presence of strong multicollinearity. To evaluate the validity of the measurement model used in this study, several indicators were considered, including reflective indicator loadings, internal consistency reliability, and convergent and discriminant validity. According to Hair et al. [31], reflective indicator loadings above 0.70 are expected, with values above 0.40 considered acceptable. For internal consistency reliability, values of Cronbach’s alpha and composite reliability (CRI) exceeding 0.60 are desirable in exploratory studies [32,33]. Finally, a good measure of convergent validity is indicated by an average variance extracted (AVE) greater than 0.50.

3.4. Software

We utilized the open-source software R [34] for the majority of our data analyses. There are numerous external libraries available for implementing structural equation modeling (SEM) within the R software environment. Among these, we selected the lavaan [35] library, which is arguably one of the most advanced software packages in this field. The lavaan R package was developed to offer applied researchers, educators, and statisticians a free, fully open-source, yet commercially competitive solution for latent variable modeling. Specifically, our study focuses on the SEM features provided by this function within the lavaan package. Furthermore, the R package semPlot [36] was utilized to extend the capabilities of the lavaan package and obtain statistical measurements.
Additional statistical tests were performed using PSPP software, version 1.6.2.

4. Results

In this section, we empirically validate the modified technology acceptance model through the use of a structural equation model procedure. However, prior to this, a series of basic statistical tests are conducted to ensure the validity and reliability of the data collected.

4.1. Descriptive Statistics

First, we examine the individual distributions of the responses to the statements, as illustrated in Figure 2. The results show that most distributions of the responses are left-skewed, with statements receiving a relatively high mean score on the Likert scale. This situation corresponds to a positive attitude towards the different dimensions of the TAM and PLF models for using DGS. However, there were exceptions to this trend, particularly in the responses to the questions on computer anxiety, where the mean scores were relatively low and the distributions of the responses are right-skewed. This suggests that the participants had a relatively low level of anxiety when it came to using DGS, which is a positive indicator for the acceptance of technology.

Differences between Groups

To test for statistically significant differences in the responses to the questionnaire between the four groups of participants, a Levene test was performed. For each variable, the Levene statistic indicated that there were no significant differences in the variances of the groups (p > 0.05).

4.2. Structural Equation Model

In the following, we present the results of the Partial Least Squares Structural Equation Modeling (PLS-SEM) analysis, which was employed to examine the relationships among the constructs in our research model.

4.2.1. Reliability and Validity of the Measurement Models

The reliability and validity of the measurement models for each construct were assessed using various statistical values. Figure 1 illustrates the standardized loadings for each construct in the model.
Table 2 summarizes various statistical values for the principal latent variables in Duval’s geometry reasoning model, specifically focusing on the first three first-order factors. These variables include Loadings, Average Variance Extracted (AVE), Composite Reliability Index (CRI), and Cronbach’s alpha. The loading values surpassed 0.6, with all significance levels proving to be statistically significant. The AVE values ranged between 0.677 and 0.695, indicating that a substantial amount of the variance in the observed variables is accounted for by the latent constructs. AVE measures the total amount of the variance of the indicators taken into account by the latent construct ([37], p. 130), and, according to [38], must be higher than 0.5 for more than 50% of the variance of the construct to be due to the indicators. Our table present the values achieved, which in all cases exceed the aforementioned value. Regarding to the composite reliability index (CRI), it is allowed to have a build reliability coefficient greater than 0.70. A value of CR ≥ 0.7 is required to achieve construct reliability [39]. The CRI values varied from 0.810 to 0.814, demonstrating strong internal consistency and reliability of the constructs.
Furthermore, the Cronbach’s alpha values ranged between 0.899 and 0.915, indicating excellent reliability and consistency among the items measuring each construct. These findings collectively confirm the validity of the perceived learning-fit as a second-order factor, which, in the present model, is composed of the three first-order factors VP, RP, and CP.
Table 3 provides an overview of the loadings for individual indicators corresponding to each of the latent factors in the SEM. The loadings range between 0.8 and 1.29, which is notably larger than the 0.70 threshold, indicating a strong relationship between the latent factors and their respective indicators. The AVE values span from 0.626 to 0.726, which, being greater than 0.5, suggests a satisfactory measure of convergent validity. This indicates that the latent factors are effectively capturing the variance in their corresponding observed variables. Furthermore, the CRI varies from 0.802 to 0.842, well above the threshold required to represent good internal consistency. This demonstrates that the constructs are reliable and internally consistent. Finally, Cronbach’s alpha values range between 0.815 and 0.936, further reinforcing the reliability and consistency of the latent factors in the model. Collectively, these results provide strong evidence for the validity and reliability of the measurement models in the SEM.

4.2.2. Assessment of the Structural Model Relationships

In terms of the regression coefficients of the SEM, the Attitude Towards Use (ATU) variable, which depends on PEU and PLF, showed statistically significant values of 0.62 and 0.36, respectively, with p-values < 0.05 and < 10 3 , respectively. The PLF variable, composed of Personal Innovation (PI), Facilitating Conditions (FC), and Computer Anxiety (CA), yielded a negative value of −0.07 only for CA, indicating a lower negative relationship. PI had a value of 0.59 and FC had a value of 0.46; all variables except CA achieved significant results with p-value < 0.01 . The first-order factors with the highest values have the greatest impact on the second-order factor, which provides a useful measure of relevance.
Table 4 displays the direct and indirect effects within the structural model. The analysis highlights the strong direct effect of mathematics teachers’ attitude towards DGS use in geometry teaching on their intention to use it (r = 0.804). Both PEU and PLF show indirect effects on students’ intention to use DGS (r = 0.496 and r = 0.292, respectively), emphasizing the importance of the PLF factor. Examining the external variables, Computer Anxiety has a weak negative direct effect on both PLF and PEU (r = −0.065 and r = −0.085, respectively), while Facilitating Conditions and Personal Innovation exhibit strong direct effects on the latent factors. Consequently, in the proposed TAM, Computer Anxiety has a weak negative indirect effect, and Facilitating Conditions and Personal Innovation have moderate indirect effects on the intention to use DGS.
Figure 1 provides a conceptual representation of the model’s relationships, while Table 5 presents the corresponding R-squared values. These values indicate the proportion of the variance in the dependent variables that can be explained by the independent variables. The R-squared values for the geometric reasoning processes VP (0.945) and RP (0.971) are exceptionally high, showcasing the model’s strong explanatory power for these variables, while CP (0.830) also has a relatively high value. The complete model accounts for a significant portion of the variance in mathematics teachers’ intention to use DGS in geometry teaching, with an R-squared value of 0.807. This suggests that the model effectively captures the key factors influencing teachers’ intentions in this context.

4.2.3. Evaluation of Model Fit and Predictive Power

The overall quality of the model fit and its explanatory and predictive power were assessed using various fit indices and statistical tests. A Chi-Square test was conducted to evaluate the overall significance of the SEM, yielding a p-value of < 10 3 . This result indicates that the proposed model accounts for a considerable proportion of the variance in the data, providing strong evidence for its overall performance and adequacy.
Comparing the user model with the baseline model, fit indices such as the Comparative Fit Index (CFI) and Tucker-Lewis Index (TLI) were obtained, with values of 0.912 and 0.901, respectively. The robust versions of these indices, Robust CFI and Robust TLI, were 0.918 and 0.907, respectively. These values suggest a good model fit, as they are close to the threshold of 0.95.
The Root Mean Square Error of Approximation (RMSEA) was calculated as 0.086, with a 90% confidence interval ranging from 0.076 to 0.096. The Robust RMSEA was 0.083, with a 90% confidence interval between 0.072 and 0.093. Although these RMSEA values are slightly above the recommended threshold of 0.08, they still indicate a reasonable model fit.

5. Discussion and Conclusions

This study demonstrated that the extended TAM proposed by Pittalis in [20] serves as an appropriate model to evaluate the intentions of pre-service primary school teachers to use DGS in teaching geometry, as evidenced by the reliability and consistency of the model’s latent factors. Particularly, the significance of the perceived pedagogical-learning fit was confirmed, which is noteworthy since it bridges the factors of the traditional TAM constructs with the different processes of the geometry reasoning model, and plays a pivotal role in teachers’ intention to use DGS.
The in-depth analysis conducted in this study revealed some differences in the predictive power of various latent factors compared to the original study. Firstly, the negative effect of Computer Anxiety was weaker in our findings. This discrepancy could be attributed to the age of the participants, which differed in our study (comprising only pre-service teachers) compared to the original study (involving both pre-service and in-service teachers). Furthermore, our structural modeling results indicate moderate to strong direct and indirect effects of most factors (Attitude, PEU, PLF, Facilitating Conditions, and Personal Innovation) on the intention to use DGS in teaching geometry. In contrast, the original study highlighted only three factors as standing out (Attitude, PLF, and Personal Innovation).
Another study that corroborates our findings regarding the role of PLF in teachers’ intention to use DGS is that of Segal et al. [40]. They also used DGS to enhance pre-service mathematics teachers’ specialized content knowledge (SCK) in the case of reflection and transformation. They found that DGS provided a valuable instrument for revising and expanding their knowledge, and that the inquiry-based geometrical task demonstrated the value of technological tools in teaching and learning processes. Their study supports our finding that PLF is an important factor for teachers’ intention to use DGS, as they argued that adapting learning tasks in geometry to a dynamic geometry environment can expand and deepen geometrical and pedagogical knowledge and reasoning skills.
A related study that used a different theoretical framework to examine mathematics teachers’ intention to use DGS in class was conducted by Chan [41]. He applied the theory of planned behavior (TPB) to identify the salient beliefs of secondary school mathematics teachers who had knowledge of and experience using DGS. He surveyed 30 teachers and found that their intention to use DGS was influenced by social sources, such as school leaders and professional organizations. This finding contrasts with our study, which used the technology acceptance model (TAM) extended by the notion of perceived pedagogical-learning fit (PLF). TAM focuses on the individual factors that affect teachers’ intention to use DGS, such as perceived usefulness, perceived ease of use, attitude, and PLF. TPB, on the other hand, considers the social factors that influence teachers’ intention to use DGS, such as subjective norm, perceived behavioral control, and behavioral beliefs. These two models have different assumptions and implications for understanding and promoting teachers’ intention to use DGS in geometry teaching.
Based on the findings and limitations of our study and the comparison with other studies that used different theoretical frameworks, we suggest some future research directions. These include investigating the impact of external variables such as teaching experience and curriculum alignment on the extended TAM. Furthermore, expanding the research to different educational levels and assessing the effectiveness of DGS in teaching other mathematical subjects or interdisciplinary curricula would provide valuable insights. Finally, evaluating the role of teacher training and professional development programs in enhancing the perceived pedagogical-learning fit and adoption of DGS would contribute to a comprehensive understanding of the factors influencing DGS implementation.

Author Contributions

Conceptualization, S.V.V., A.P.-S. and P.D.D.; methodology, S.V.V. and A.P.-S.; software, A.P.-S. and S.V.V.; validation, S.V.V., A.P.-S. and P.D.D.; formal analysis, S.V.V. and A.P.-S.; investigation, S.V.V., A.P.-S. and P.D.D.; resources, S.V.V. and A.P.-S.; data curation, S.V.V. and A.P.-S.; writing—original draft preparation, S.V.V. and A.P.-S. and P.D.D.; writing—review and editing, S.V.V. and A.P.-S.; visualization, S.V.V. and A.P.-S.; supervision, S.V.V., A.P.-S. and P.D.D.; project administration, S.V.V., A.P.-S. and P.D.D. All authors have read and agreed to the published version of the manuscript.

Funding

A.P.-S. was with the project AICO/2021/019, funded by the Regional Government of València (Spain).

Institutional Review Board Statement

This study has been developed following the code of good practice in research of the Universitat de València.

Informed Consent Statement

Informed consent was obtained from all subjects involved in the study.

Data Availability Statement

The data presented in this study is not publicly available due to privacy restrictions.

Conflicts of Interest

The authors declare no conflict of interest.

References

  1. Straesser, R. Cabri-Géomètre: Does dynamic geometry software (DGS) change geometry and its teaching and learning? Int. J. Comput. Math. Learn. 2002, 6, 319–333. [Google Scholar] [CrossRef]
  2. Clements, D.H.; Sarama, J.; Yelland, N.J.; Glass, B. Learning and teaching geometry with computers in the elementary and middle school. Res. Technol. Teach. Learn. Math. 2008, 1, 109–154. [Google Scholar]
  3. Sinclair, N.; Bartolini Bussi, M.G.; de Villiers, M.; Jones, K.; Kortenkamp, U.; Leung, A.; Owens, K. Recent research on geometry education: An ICME-13 survey team report. ZDM 2016, 48, 691–719. [Google Scholar] [CrossRef] [Green Version]
  4. Hillmayr, D.; Ziernwald, L.; Reinhold, F.; Hofer, S.I.; Reiss, K.M. The potential of digital tools to enhance mathematics and science learning in secondary schools: A context-specific meta-analysis. Comput. Educ. 2020, 153, 103897. [Google Scholar] [CrossRef]
  5. Olivero, F.; Robutti, O. Measuring in dynamic geometry environments as a tool for conjecturing and proving. Int. J. Comput. Math. Learn. 2007, 12, 135–156. [Google Scholar] [CrossRef]
  6. Kovács, Z.; Recio, T.; Vélez, M.P. Automated Reasoning Tools with GeoGebra: What Are They? What Are They Good For. In Mathematics Education in the Age of Artificial Intelligence: How Artificial Intelligence can Serve Mathematical Human Learning; Richard, P.R., Vélez, M.P., Van Vaerenbergh, S., Eds.; Springer International Publishing: Cham, Switzerland, 2022; pp. 23–44. [Google Scholar] [CrossRef]
  7. Güven, B.; Kosa, T. The effect of dynamic geometry software on student mathematics teachers’ spatial visualization skills. Turk. Online J. Educ. Technol. 2008, 7, 100–107. [Google Scholar]
  8. Guven, B. Using dynamic geometry software to improve eight grade students’ understanding of transformation geometry. Australas. J. Educ. Technol. 2012, 28. [Google Scholar] [CrossRef] [Green Version]
  9. Stols, G.; Kriek, J. Why don’t all maths teachers use dynamic geometry software in their classrooms? Australas. J. Educ. Technol. 2011, 27. [Google Scholar] [CrossRef] [Green Version]
  10. Herbst, P.; Cheah, U.H.; Richard, P.R.; Jones, K. International Perspectives on the Teaching and Learning of Geometry in Secondary Schools; Springer: Berlin/Heidelberg, Germany, 2018. [Google Scholar]
  11. Mitchell, B.; Bailey, J.; Monroe, E. Integrating technology and a standards-based pedagogy in a geometry classroom: A mature teacher deals with the reality of multiple demands and paradigm shifts. Comput. Sch. 2007, 24, 75–91. [Google Scholar] [CrossRef]
  12. İbili, E. The use of dynamic geometry software from a pedagogical perspective: Current status and future prospects. J. Comput. Educ. Res. 2019, 7, 337–355. [Google Scholar] [CrossRef]
  13. Davis, F.D. Perceived usefulness, perceived ease of use, and user acceptance of information technology. MIS Q. Manag. Inf. Syst. 1989, 13, 319–340. [Google Scholar] [CrossRef] [Green Version]
  14. Scherer, R.; Siddiq, F.; Tondeur, J. The technology acceptance model (TAM): A meta-analytic structural equation modeling approach to explaining teachers’ adoption of digital technology in education. Comput. Educ. 2019, 128, 13–35. [Google Scholar] [CrossRef]
  15. Teo, T.; Lee, C.B.; Chai, C.S.; Wong, S.L. Assessing the intention to use technology among pre-service teachers in Singapore and Malaysia: A multigroup invariance analysis of the Technology Acceptance Model (TAM). Comput. Educ. 2009, 53, 1000–1009. [Google Scholar] [CrossRef]
  16. Fearnley, M.R.; Amora, J.T. Learning Management System Adoption in Higher Education Using the Extended Technology Acceptance Model. IAFOR J. Educ. 2020, 8, 89–106. [Google Scholar] [CrossRef]
  17. Sun, H.; Zhang, P. The role of moderating factors in user technology acceptance. Int. J. Hum.-Comput. Stud. 2006, 64, 53–78. [Google Scholar] [CrossRef] [Green Version]
  18. Teo, T.; Noyes, J. An assessment of the influence of perceived enjoyment and attitude on the intention to use technology among pre-service teachers: A structural equation modeling approach. Comput. Educ. 2011, 57, 1645–1653. [Google Scholar] [CrossRef]
  19. Dishaw, M.T.; Strong, D.M. Extending the technology acceptance model with task–technology fit constructs. Inf. Manag. 1999, 36, 9–21. [Google Scholar] [CrossRef]
  20. Pittalis, M. Extending the technology acceptance model to evaluate teachers’ intention to use dynamic geometry software in geometry teaching. Int. J. Math. Educ. Sci. Technol. 2021, 52, 1385–1404. [Google Scholar] [CrossRef]
  21. Nosek, B.A.; Errington, T.M. What is replication? PLoS Biol. 2020, 18, e3000691. [Google Scholar] [CrossRef] [Green Version]
  22. Davis, F.D. A Technology Acceptance Model for Empirically Testing New End-User Information Systems: Theory and Results. Ph.D. Thesis, Massachusetts Institute of Technology, Cambridge, MA, USA, 1985. [Google Scholar]
  23. Granić, A.; Marangunić, N. Technology acceptance model in educational context: A systematic literature review. Br. J. Educ. Technol. 2019, 50, 2572–2593. [Google Scholar] [CrossRef]
  24. Abdullah, F.; Ward, R.; Ahmed, E. Investigating the influence of the most commonly used external variables of TAM on students’ Perceived Ease of Use (PEOU) and Perceived Usefulness (PU) of e-portfolios. Comput. Hum. Behav. 2016, 63, 75–90. [Google Scholar] [CrossRef]
  25. Rondan-Cataluña, F.J.; Arenas-Gaitán, J.; Ramírez-Correa, P.E. A comparison of the different versions of popular technology acceptance models: A non-linear perspective. Kybernetes 2015, 44, 788–805. [Google Scholar] [CrossRef]
  26. Burton-Jones, A.; Hubona, G.S. The mediation of external variables in the technology acceptance model. Inf. Manag. 2006, 43, 706–717. [Google Scholar] [CrossRef]
  27. Laborde, C.; Kynigos, C.; Hollebrands, K.; Strässer, R. Teaching and learning geometry with technology. In Handbook of Research on the Psychology of Mathematics Education; Brill: Leiden, The Netherlands, 2006; pp. 275–304. [Google Scholar]
  28. Duval, R. Geometry from a Cognitive Point of View; New ICMI Study Series; Springer: Amsterdam, The Netherlands, 2012. [Google Scholar]
  29. Kline, R.B. Principles and Practice of Structural Equation Modeling, 3rd ed.; Guilford Publications: New York, NY, USA, 2011. [Google Scholar]
  30. Deegan, J. On the occurrence of standardized regression coefficients greater than one. Educ. Psychol. Meas. 1978, 38, 873–888. [Google Scholar] [CrossRef]
  31. Hair, J.F.; Risher, J.J.; Sarstedt, M.; Ringle, C.M. When to use and how to report the results of PLS-SEM. Eur. Bus. Rev. 2019, 31, 2–24. [Google Scholar] [CrossRef]
  32. O’Dwyer, L.M.; Bernauer, J.A. Quantitative Research for the Qualitative Researcher; SAGE Publications: New York, NY, USA, 2013. [Google Scholar]
  33. Carmines, E.G.; Zeller, R.A. Reliability and Validity Assessment; Quantitative Applications in the Social Sciences; Sage Research Methods: New York, NY, USA, 1979. [Google Scholar]
  34. R Core Team. R: A Language and Environment for Statistical Computing; R Foundation for Statistical Computing: Vienna, Austria, 2022. [Google Scholar]
  35. Rosseel, Y. lavaan: An R Package for Structural Equation Modeling. J. Stat. Softw. 2012, 48, 1–36. [Google Scholar] [CrossRef] [Green Version]
  36. Jorgensen, T.D. semTools: Useful Tools for Structural Equation Modeling; R Foundation for Statistical Computing: Vienna, Austria, 2022. [Google Scholar]
  37. Varela Mallou, J.; Lévy Mangin, J.P. Modelización con Estructuras de Covarianzas en Ciencias Sociales: Temas Esenciales, Avanzados y Aportaciones Especiales; Netbiblo: La Coruña, Spain, 2023. [Google Scholar]
  38. Bagozzi, R.P.; Yi, Y. On the Evaluation of Structural Equation Models. Journal of the Academy of Marketing Sciences. J. Acad. Mark. Sci. 1988, 16, 74–94. [Google Scholar] [CrossRef]
  39. Tentama, F.; Anindita, W.D. Employability Scale: Construct Validity And Reliability. Int. J. Sci. Technol. Res. 2020, 9, 3166–3170. [Google Scholar]
  40. Segal, R.; Oxman, V.; Stupel, M. Using dynamic Geometry Software to enhance specialized content knowledge: Pre-service mathematics teachers’ perceptions. Int. Electron. J. Math. Educ. 2021, 16, em0647. [Google Scholar]
  41. Chan, K.K. Salient beliefs of secondary school mathematics teachers using dynamic geometry software. Eurasia J. Math. Sci. Technol. Educ. 2015, 11, 139–148. [Google Scholar] [CrossRef]
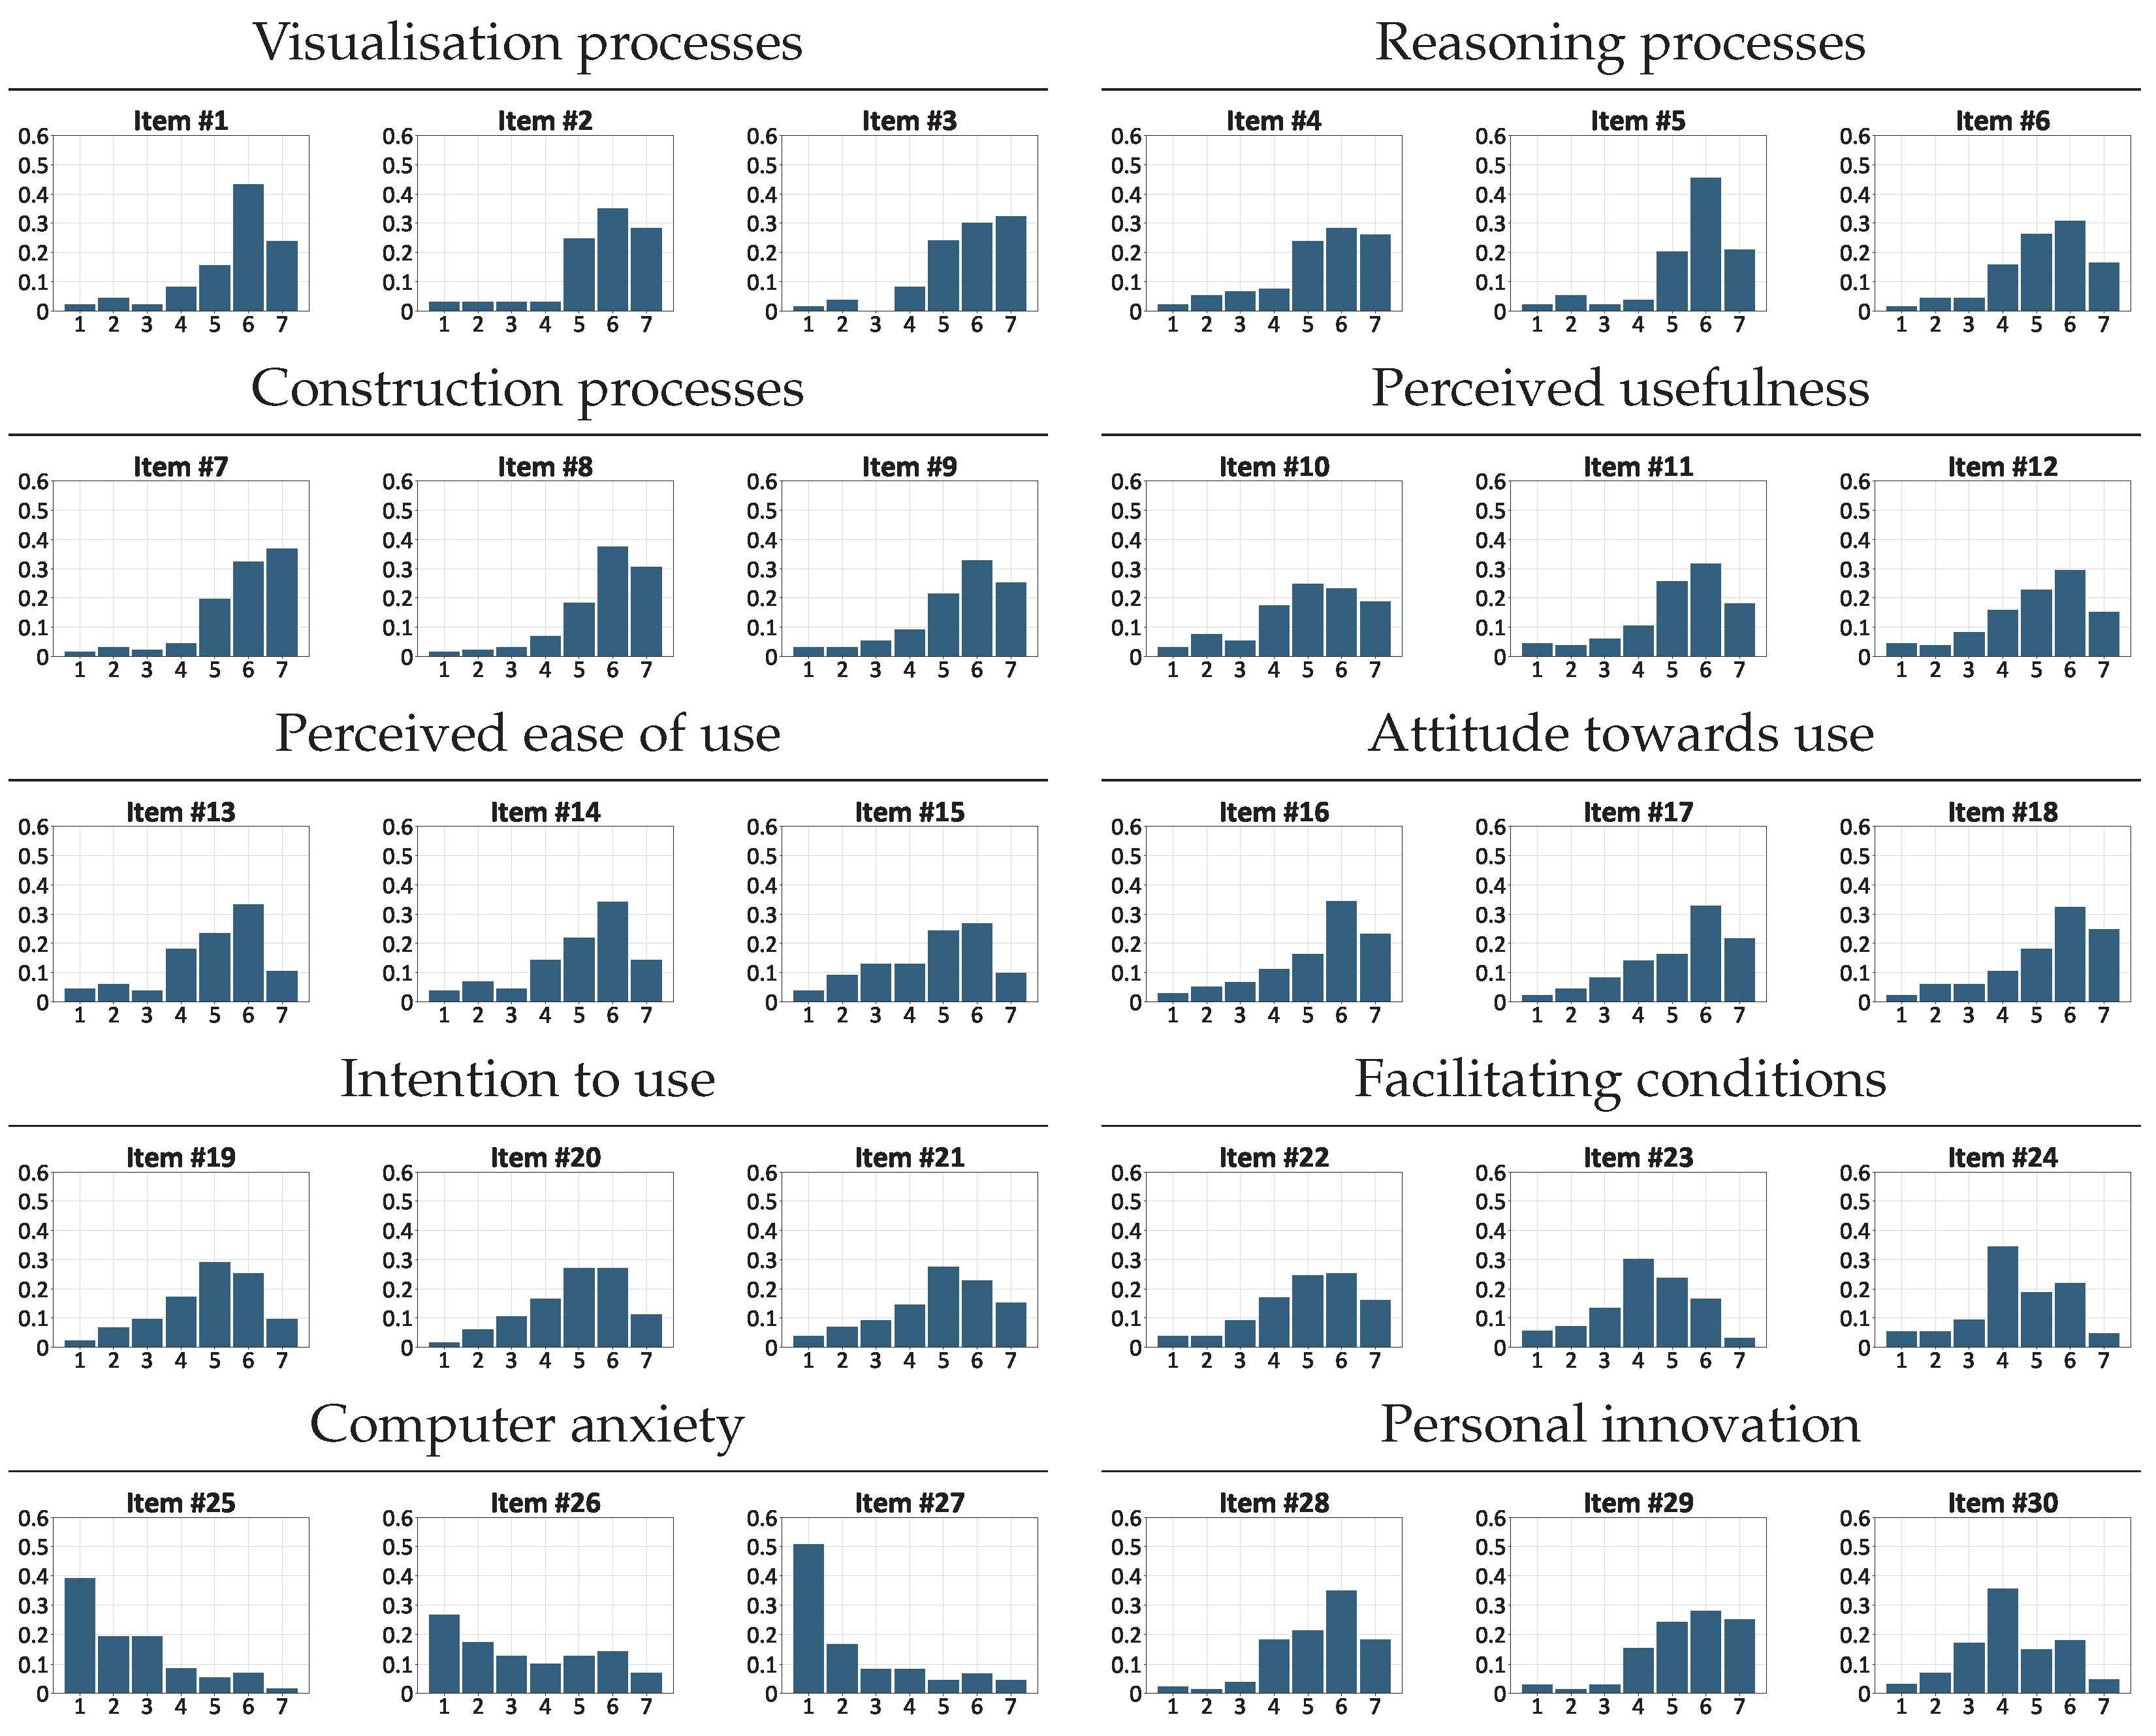
Figure 1. Path diagram of the structural equation model, adapted from [20] with values obtained from our data.
Education 13 00661 g001
Figure 2. Histograms of each of the items considered in the questionnaire, illustrating the descriptive statistics. Each factor is composed of three items ranging on a seven-level Likert-scale represented on the x-axis, and the frequency is represented on the y-axis.
Education 13 00661 g002
Table 1. Items of the extended TAM questionnaire from [20]. Items 1 to 9 correspond to PLF statements, while the items 10 to 30 are the traditional TAM statements and external variables.
FactorItems
Visualization processes (VP)Q1. DGS facilitates the dynamic visualization and understanding of geometric theorems and proofs.
Q2. DGS functions (i.e., dragging) help students to ‘see’ the properties and characteristics of geometric shapes.
Q3. DGS offers dynamic images that promote dynamic visualisation of geometrical concepts.
Reasoning processes (RP)Q4. Teaching geometry with DGS helps in developing students’ reasoning and conjecturing.
Q5. Manipulating shapes in DGS contributes to an understanding of the relations between geometric shapes.
Q6. DGS measurement and dragging tools help students make generalisations.
Construction processes (CP)Q7. DGS tools make possible the construction of geometric shapes based on their properties.
Q8. DGS tools facilitate the construction of complex geometrical constructions, such as locus.
Q9. Constructing geometric shapes in DGS is not a mechanical process, but it develops students’ construction abilities.
Perceived usefulness (PU)Q10. Using DGS in geometry teaching will enable me to accomplish my tasks more quickly.
Q11. Using DGS in geometry teaching will enable me to enhance my effectiveness in teaching.
Q12. Using DGS in geometry teaching will enable me to increase my productivity in teaching.
Perceived ease of use (PEU)Q13. My interaction with DGS tools will be clear and understandable.
Q14. I will find the DGS tools to be flexible to interact with.
Q15. I will find the DGS tools easy to use.
Attitude towards Use (ATU)Q16. I think it would be very good to use DGS in geometry teaching rather than traditional methods.
Q17. In my opinion it would be very desirable to use DGS in geometry teaching rather than traditional methods.
Q18. Teaching geometry with DGS makes the lesson more interesting.
Intention to Use (IU)Q19. I will use DGS in geometry teaching rather than traditional methods of teaching geometry.
Q20. My intention is to use DGS in geometry teaching rather than traditional teaching methods.
Q21. In geometry teaching, I would rather use DGS than traditional methods.
Facilitating Conditions (FC)Q22. When I need help in teaching geometry with DGS, one ofmy colleagues will help me.
Q23.When I need help in teaching geometry with DGS, one expert will help me.
Q24. When I need help in teaching geometry with DGS, someone will provide me with additional material.
Computer Anxiety (CA)Q25. I am reluctant to use a computer because I am afraid that I will make mistakes that cannot be corrected.
Q26. When I use a computer I am scared that I might lose important data by clicking a wrong button.
Q27. I feel uncomfortable when using a computer.
Personal Innovation (PI)Q28. When I am informed about a new technological tool, I find ways to experiment with it.
Q29. I like to experiment with new technological tools.
Q30. Among my colleagues, I am usually the first person to try new technological tools.
Table 2. Indices for convergent and discriminant validity of the measurement model for the perceived learning-fit statements.
FactorLoadingsAVECRICronbach’s α
Visualisation Factor10.6940.8100.915
Q11
Q20.92
Q30.92
Reasoning Factor1.090.6950.8110.912
Q41
Q50.92
Q60.81
Construction Factor0.880.6770.8140.899
Q71
Q81
Q90.98
Table 3. Indices for convergent and discriminant validity of the measurement model for the traditional TAM statements and external variables.
FactorLoadingsAVECRICronbach’s α
Perceived ease of use 0.6920.8090.915
Q131
Q141.06
Q150.99
Attitude towards use 0.7070.8020.930
Q161
Q170.95
Q180.85
Intention to use0.80.7260.8190.936
Q191
Q201.01
Q211.03
Facilitating Conditions 0.6260.8420.815
Q221
Q230.97
Q241.29
Computer Anxiety 0.6420.8330.850
Q251
Q260.98
Q270.91
Personal Innovation 0.6770.8140.881
Q281
Q291.08
Q300.88
Table 4. Direct and indirect effects within the SEM.
Standardised Estimates
OutcomeDeterminantDirectIndirectTotal
Intention to use ( R 2 = 0.807 ) Attitude0.804 0.804
PEU 0.4960.496
PLF 0.2920.292
Computer Anxiety −0.061−0.061
Facilitating Conditions 0.3910.391
Personal Innovation 0.4750.475
Attitude ( R 2 = 0.589 ) PEU0.617 0.617
PLF0.363 0.363
Computer Anxiety −0.076−0.076
Facilitating Conditions 0.4860.486
Personal Innovation 0.5900.590
PEU ( R 2 = 0.510 ) Computer Anxiety−0.085 −0.085
Facilitating Conditions0.516 0.516
Personal Innovation0.611 0.611
PLF ( R 2 = 0.524 ) Computer Anxiety−0.065 −0.065
Facilitating Conditions0.462 0.462
Personal Innovation0.588 0.588
Table 5. R-squared values for the structural model.
Variable R 2
VP0.945
RP0.971
CP0.830
PEU0.510
ATU0.589
IU0.807
PLF0.524
Disclaimer/Publisher’s Note: The statements, opinions and data contained in all publications are solely those of the individual author(s) and contributor(s) and not of MDPI and/or the editor(s). MDPI and/or the editor(s) disclaim responsibility for any injury to people or property resulting from any ideas, methods, instructions or products referred to in the content.

