Article

Where Is It Best to Sit in Class? Description of an Experience Based on STEM Problem Solving in a School Context

by
Irene Ferrando
1,*,
Lluís Albarracín
2 and
Pascual D. Diago
1
1
Departament de Didàctica de la Matemàtica, Universitat de València, 46022 Valencia, Spain
2
Department de Didàctica de la Matemàtica i les Ciències Experimentals, Universitat Autònoma de Barcelona, 08193 Cerdanyola del Vallès, Spain
*
Author to whom correspondence should be addressed.
Educ. Sci. 2023, 13(4), 417; https://doi.org/10.3390/educsci13040417
Submission received: 6 March 2023 / Revised: 12 April 2023 / Accepted: 15 April 2023 / Published: 19 April 2023
(This article belongs to the Special Issue STEAM Education and Problem Solving)

Abstract

:
This study aims to describe the design and development of a STEM problem-solving activity involving mathematics and physics content. It is an activity whose starting point is a question based on a real problem: to identify the areas of the classroom where the intensity of sound is higher. In this way, the problem involves the physics of sound. However, in addition, by trying to give an answer to the initial question, students have the opportunity to develop progressively more complex mathematical models from already known mathematical concepts and procedures. The analysis of the results of the implementation based on the identification of the learning opportunities and the catalyst elements that generate them, allows us to state that the activity encourages students to enrich their mathematical models by incorporating new mathematical concepts such as the function of two variables. We conclude that the design of the activity and the choice of data acquisition technology are key, but also the interaction between the students and the teacher.

1. Introduction

The development of science, technology, engineering, and mathematics (STEM) skills is crucial in an era of rapid technological innovation and global challenges. They are a necessary foundation for responsible citizenship and for international economic competitiveness. However, even in economically developed countries such as Europe, the United States and Australia, around 20% of students are not proficient in mathematics or science, according to the latest results of the Programme for International Student Assessment ([1]). This trend highlights the urgent need for research to identify the elements for effective classroom implementation of STEM learning.
A key aspect to consider when addressing this issue is the design of the activities proposed to students. A good way to approach the introduction of STEM activities is through problem solving based on a real situation close to the students’ reality ([2]). However, in order to guarantee the success of the activity, it is necessary that its design starts from a problem based on a real situation of interest to the students, whose solution involves concepts from the scientific-technological field supported by mathematical procedures.
Physical phenomena provide a rich context for study, linking the real world with an abstract representation of it. In such an experimental scientific activity, it is possible to focus on the understanding of the phenomenon under investigation, but also on the mathematical concepts and procedures needed to describe it. It is not possible to guarantee that students will develop their STEM skills when investigating a complex situation, but the choices students make during the solving process to explain the phenomenon can be transformed into mathematical learning opportunities (Cai et al. [3], Albarrracín and Gorgorió [4]). In this didactic design, it is important to consider not only how to use the available technology to study physical phenomena, but also the teacher’s knowledge of it and the teacher’s role in carrying out the activity.
These types of activities allow students to develop STEM skills. However, when implementing these activities in the classroom, the teacher needs to be able to successfully take advantage of students’ learning opportunities during the development of the activity [5]. To date, relatively little research has focused on the teacher’s role in this process. Doerr and Ärlebäck [6] provide evidence of teaching practices that foster students’ independence and autonomy as learners and problem solvers in real contexts. In the same vein, Stender and Kaiser [7] explore what types of scaffolding and intervention activities are appropriate to support students’ autonomous work when working on modelling activities in groups. Challenges for both students and teachers arise from working with open-ended problems, making and validating assumptions and interpreting mathematical results in the context of the given situation ([8]).
This article presents an exploratory study in which we analyse the design and implementation of a STEM problem-solving project whose objective is for students to work with functions of two real variables based on the study of a physical phenomenon. From the point of view of the didactic proposal, the activity combines specific learning about the physical phenomenon studied, the possibilities of using different technological tools to obtain data and the representation of the phenomenon by means of a representation that involves the concept of function of two variables. In this rich context, it would be possible to carry out various studies, but the focus of our work is the generation of mathematical learning opportunities about the functions of two variables.
In this case, the phenomenon studied is sound intensity, but it is feasible to reformulate this project considering other phenomena such as WiFi coverage. The project challenges secondary school students to describe mathematically the way in which the sound propagates in the classroom. The activity leads the students to make some decisions, first about the process of data collection, then about data representation and, finally about data analysis. The students’ work in the classroom is complex, as they have to deal with the physical characteristics of the physical phenomenon, the mathematical knowledge that allows them to describe it formally, and the use of the technological tools to collect and analyse real data. Throughout the whole process, the teacher acts as a facilitator and intervenes in the learning process.
In order to explore how to promote advanced mathematical learning through the study of physical phenomena, in this study we are interested in identifying the mathematical learning promoted by the activity (which we will call “learning opportunities”) and the factors that promote this learning (which will be the “catalyst elements”).

2. Theoretical Framework

2.1. STEM Problem Solving Activities

There is currently no clear consensus on whether STEM education refers to the development of knowledge within individual subjects or to an interdisciplinary approach to teaching. However, most STEM applications in real life and in the world of work are interdisciplinary in nature. Lawrenz et al. [9], note that this ’reality’ provides a compelling argument for considering interdisciplinary or integrated approaches to STEM education, although further research is needed on how to effectively integrate this teaching approach into practice.
This integration of disciplines, and in particular the promotion of the relationship between science, technology, and mathematics in education, requires a review of what we mean by teaching through problem solving. To this end, Li and Schoenfeld [10] suggest that the first step to this is to delve deeper into the nature of mathematics—indeed, of all STEM disciplines—as a meaning-making activity.
Often, in secondary education, the inductive part of mathematics is ignored and the deductive part is presented as a series of rote procedures rather than as a way of making sense of reasoning. One way to overcome this dichotomy and to promote complete mathematical reasoning is to provide students with appropriate experiences that allow them to bring into play the content related to formal mathematics in order to organise and systematise these experiences (Li and Schoenfeld [10]). On the other hand, traditionally, in mathematics (but also in other disciplines in the STEM context), most teaching has focused on the content and practices of the discipline and on what the teacher has to do to enable students to access it. Instead, it is important that the focus is on the learner’s experience of the discipline, i.e., on the possibilities that the environment offers the learner to make sense of the discipline.
With this in mind, we consider, in line with Duijzer et al. [11] that the development of the STEM problem-solving activities requires the following aspects to considered:
  • It should promote the improvement of critical thinking and problem solving skills. One way to achieve this is to provide an activity that starts from a real-world problem and allows students to integrate mathematical procedures with non-mathematical concepts.
  • Creativity should be encouraged, so it is necessary to design complex STEM problem-solving activities that challenge students to develop creative solutions.
  • Teamwork and collaboration should be encouraged. This is a key aspect of teaching students to learn to work effectively with and through others.
  • The activity should provide learning opportunities, including those as a practical nature. Indeed, finding applications of academic content to real-world problems can contribute to increased student motivation and a greater sense of achievement.
Overall, designing STEM problem-solving activities in secondary school should help students develop the skills and knowledge they need to succeed in the 21st century.
In relation to the design and implementation of STEM problem solving activities, Hallström and Schönborn [12] point to the importance of considering the notions of modelling and applications. Indeed, these authors state that “the integration of science, technology, engineering and mathematics could be greatly enhanced by operationalising the influence, functions and implications of models and modelling” (p. 4). Based on this idea, in this study we design a task that allows students to build mathematical models based on a real problem -identifying in which areas of the classroom have higher sound intensity- which they will progressively enrich by collecting and analysing the data. In this paper, we draw on Lesh and Harel’s [13] definition of a mathematical model, which they interpret as an integrated system of concepts and procedures that makes it possible to describe a phenomenon. Taking into account what Hallström and Schönborn [12] point out, during the process of solving a STEM problem-solving activity, students use models to describe, explain, construct, modify and predict from a real experience. Thus, we understand mathematical models as a tool generated by solvers to help them organise relevant information, to generate or (re)interpret hypotheses about a real situation, to explain how information relates, and to make decisions.

2.2. The Role of Teachers, Students and Technology in STEM Problem-Solving

Although it is becoming increasingly common for educational programs to address interdisciplinary approaches to teaching STEM disciplines (see, for example, the new education law enacted in Spain, Ministry of Education, 2022), their implementation in everyday teaching practice remains difficult. Several factors that explain this difficulty. First of all, the integration process is challenging in itself, because it is not always easy to integrate mathematics content in relation to science, especially at the lower levels, when students’ knowledge is more basic [5]. On the other hand, teachers often lack confidence or discipline-specific knowledge, the so-called ’STEM teaching skills gap’ (see [14]). Finally, secondary school teachers often have only one area of specialisation (in Spain only one, in other countries, such as Germany, at most two). This degree of specialisation in initial training means that teachers, although they have in-depth knowledge of their subject area, often have a rather narrow view of the relationship of their discipline to other disciplines, or even of the importance of other disciplines [15]. Indeed, as Pang and Good [16] point out, the success of science and mathematics integration depends to a large extent on teachers’ understanding of the subject. The results of previous research on integrated mathematics and science education allow us to identify effective practices in the implementation of STEM approaches. Zemelman, Daniels and Hyde [17] list ten good practices for teaching mathematics and science:
  • use of manipulatives and hands-on learning;
  • cooperative learning;
  • discussion and enquiry;
  • questioning and conjecture;
  • use of justification of thinking;
  • writing for reflection and problem solving;
  • use of a problem-solving approach;
  • integration of technology;
  • teacher as facilitator;
  • use of assessment as part of instruction.
It is important to consider these aspects not only in the design of the activity itself, but also in the design of its implementation, particularly with regard to the role of the teacher (who should act as a facilitator) and the integration of technology.
Burkhardt [18] describes the change in the role of the teacher from imitative teaching to problem-solving based teaching. According to this author, the demands are different and, consequently, the intervention models need to be different. Thus, during the development of a problem-solving activity, the teacher moves from the role of a transmitter of knowledge to that of a counsellor who allows students to work with a certain degree of autonomy by making their own decisions. As Blomhoj and Jensen [19] point out, this change of roles in relation to more directed teaching can lead to the dilemma of teaching directed autonomy. To overcome this dilemma (helping and intervening, but without excessively directing the students’ work), Blomhoj and Kjeldsen [20] propose two forms of didactic intervention. On the one hand, it is necessary for the teacher to prepare a proposal that promotes student progress, presenting the conditions, objectives, expectations, and material information that students must provide during the solving process (i.e., the STEM problem-solving activity proposal must be designed in such a way that fosters the autonomous work of the solver). On the other hand, through monitoring and, in particular, through dialogue, the teacher should support learners in overcoming blockages and difficulties (Blomhoj and Kjeldsen) [20]. Another possible approach is to organise students’ work in a way that promotes their learning. It is common in STEM projects for students to work in heterogeneous teams, usually organised by teachers (Torras et al. [21]). Cooperative work is not only a practical matter of serving students, but is also a strategy for harnessing the dynamics of social interdependence (DeRuntz et al. [22]). Working in a team promotes positive interdependence, but it is necessary for students to get to know one another and group interactions must be fostered (Torras et al. [21]).
Doerr [23] develops a theoretical framework for an approach to a problem-solving that involves the use of technological tools. In this approach we identify important aspects that have been considered in our work: the starting point is a physical phenomenon that is identified through a simulation to be analysed using technological tools. Technology plays a crucial role in STEM problem solving in secondary school. There are some ways in which technology can be important:
  • Enhancing the learning experience: Technology can make STEM subjects more engaging and interactive for students. It can provide visual aids, simulations, and interactive tools that allow students to experiment and test their hypotheses. This helps to bring abstract concepts to life and makes learning more enjoyable and memorable.
  • Developing problem-solving skills: Technology can help students develop problem-solving skills by providing them with opportunities to work on real-world problems using technology-based tools. This allows students to apply their knowledge and skills to solve problems and challenges they may face in the future.
  • Fostering collaboration: Technology can facilitate collaboration among students, teachers, and experts from various fields. Students can work together on projects, share ideas and resources, and collaborate with experts to find solutions to complex problems.
These aspects are essential to the design of our STEM problem solving approach. As Geiger [24] states, the use of technological tools enriches the solution process. Indeed, the use of technology in the development of mathematical routines and processes engages students in collaborative problem solving. The literature describes different roles that technological tools can play in such activities. The use of technological tools, the possibilities to visualise information (Brown [25]) or to recreate a context in a simulated environment (Frejd and Ärlebäck [26]) are increased. Technological tools can also be useful for reorganising information during the solution process, in the sense of determining the way data is collected or organised, thus facilitating discussions about the nature of the phenomenon under study (Perrenet and Adan [27]).

2.3. Mathematics Learning Opportunities

In a teaching/learning activity the ultimate goal is for learners to develop new learning whether in terms of content, processes or attitudes. However, the actual conditions in which classroom activities take place do not always allow for the corroboration of effective learning, which is difficult to measure. Therefore, from the perspective of educational research, there is an interest in identifying those actions that promote learning opportunities for students. The interest is in learning as a product, as a result of certain conditions including learning opportunities. It is important to note that in this interpretation, opportunity is not seen as necessarily implying learning. Indeed, Törnroos [28] pointed out that having the opportunity to learn is a prerequisite for learning, but a learning opportunity does not guarantee that students will actually learn.
The concept of learning opportunity itself covers a wide range of situations. On the one hand, we have large-scale studies that measure learning acquisition. At the other extreme are micro-studies that address the achievement of specific learning objectives, usually in classroom activities. In general, studies related to learning opportunities try to explain the lack of learning as being caused by a lack of opportunities. However, Floden [29] pointed out that there are other factors that influence learning outcomes, such as the quality of teaching and the skills of learners.
When the term mathematical learning opportunity is used, it is initially linked to the analysis of classroom interactions (between students or with the teacher) in which mathematical knowledge is constructed. Cobb and Whitenack [30] argue that learning mathematics is a personal process of conceptual self-organisation and enculturation. From this perspective, a mathematical learning opportunity is a situation in which students have the opportunity to reorganise their conceptual structures and approaches when confronted with a new mathematical activity, facing a STEM problem-solving activity. In this way, learning opportunities are directly related to the specific content to be learned, the learning process and the characteristics of the learning activity.
Cai et al. [3] consider that any definition of mathematical learning opportunity in the classroom must necessarily consider the interactions between the following three elements: the mathematical tasks, the teacher, and the students. The interactions between the three elements create complexities that are likely to be understood only through multiple iterations of studies based on successive evidence. To move forward, they suggest that multiple studies, often on a small scale, should be conducted in order to gradually move towards more complete and accurate answers.
Wijaya, van den Heuvel-Panhuizen and Doorman [31] have studied the potential of different types of mathematical tasks to promote learning opportunities. In their work they concluded that the lack of real-world contextualised tasks in textbooks limits students’ learning opportunities. If the procedure to be used is not made explicit or easily recognisable, students cannot determine what might be the appropriate mathematical procedures to solve the task, which means that they will not develop their ability to identify concepts or procedures appropriate to a particular task.
On this basis, Wijaya, van den Heuvel-Panhuizen and Doorman [31] recommend including more tasks based on real-life contexts in classroom practice and provide some guidelines on how to implement them. They point out that contextualised tasks should not only appear immediately after explanations of concepts or procedures, as then the strategies to follow seem clear. The quality of the tasks is also important: they should be presented in essential, relevant contexts that can provide opportunities to mathematise or organise situations mathematically. In addition, consideration should be given to including superfluous information or requiring a search for new information, so that students have the opportunity to select relevant information. Finally, they suggest that tasks should be cognitively demanding so that students can develop complex reasoning that requires reflection in relation to real-life contexts and the mathematical concepts that explain them. There are other good practices suggested by other authors, such as the use of digital or manipulative tools and the involvement of students in research that can improve the development of mathematical learning opportunities (Vermont report [32]). In addition, collaborative work enhances learning opportunities.
In this study we seek to identify the learning opportunities that arise during the development of a STEM problem solving activity involving real data collection and analysis using different technological tools. This activity is complex in the sense that it requires the coordination of several elements in order to articulate it in such a way that the learning opportunities arise. Furthermore, we are interested in finding out what are the elements in design, technology, teacher intervention or student behaviour that promote the emergence of such learning opportunities. Thus we will look at what we call catalyst elements, those factors that create learning opportunities. These elements, as we will explain later, can be related to the design of the activity (especially the nature or mathematical model of the physical phenomenon involved in the task), the actions of the teacher, the interactions between students or the use of particular tools.

3. Goals of the Study

In this study, we explore the potential of a STEM problem-solving activity to promote mathematical knowledge through the mathematisation of a physical phenomenon. We aim to identify the key factors for this learning in terms of mathematical learning opportunities. Our focus is on finding the catalysts that promote the creation of these learning opportunities. In this way, by identifying these catalysts, we aim to open a way to improve the design of STEM problem-solving activities in which students generate mathematical knowledge about abstract concepts from the study of complex real-world phenomena, supported by the use of data collection technologies.
Therefore, the following research questions were posed in this study:
  • What learning opportunities are provided by the development of a STEM problem-solving activity based on sound intensity and involving the mathematical concept of a two-variable function?
  • What is the catalyst for each of these learning opportunities?

4. Methods

4.1. Participants and Data Collected

The experience was carried out over five 50-min sessions in a school in Onda (Spain). A group of 32 Year 9 students (14–15 years old) took part, who in turn were organised into five groups of six or seven students. The activity was conducted by the teacher of the group and by one of the researchers (except during the third session, when two researchers participated). During the experience, each group of students had an iPad on the table to record their discussions and the teacher also had a sound recorder during the whole experience. All sessions were also videotaped with two cameras placed in opposite corners of the classroom. To analyse the teacher’s activity during the development of the task, we transcribed the discussions between the students working in small groups and the teacher. Sound and video recordings, in addition to handwritten documents, were used to analyse the students’ performance. Mathematical concepts related to two-variable functions are not included in the curriculum of the corresponding level for these students (Generalitat Valenciana, 2007).

4.2. The STEM Problem-Solving Activity

Students need to answer a specific research question: How is sound intensity distributed in our classroom? This main question is accompanied by these other questions: How is sound distributed in the classroom? Does the perception of sound change much from one point in the classroom to another, and what variables do our perceptions of sound in the classroom depend on? The purpose of these questions is for students to describe the physical phenomenon of sound propagation in space. The learning objective for the students focuses on giving meaning to functions of two variables by working on a representation of the phenomenon being studied.
The students use the iPad as their main digital interactive tool for both qualitative and quantitative analyses of the phenomena. The teaching experience was conducted by the class teacher. The whole activity was observed by the first author of this article as a non-participating researcher. The teaching sequence is divided into two different parts, which are described in the following sections.

4.2.1. The Sound Measure Experiment

The first part consists of the sound measurement experiment using a punctual sound source. This part is divided into three sessions. Below are details of the purpose of each session and the activities planned by the teacher to accompany the students’ work. In all sessions, time slots are provided for discussion of the activity in the working groups and in the whole group, to allow ideas to circulate.
During the first session (S1), the teacher explains concepts related to sound and instrumental tools. Immediately after this short explanation, the students use the iPad (https://www.apple.com/ipad/, accessed on 1 April 2023) as a sound meter in the research process. The students use the Decibel Ultra Pro® (http://www.dev-apps.de/app-decibelultra.html, accessed on 1 April 2023) app to measure real data from a sound source. The purpose of this session is to familiarise the students with the instruments they will use in the project and to give them a first impression of the values obtained when measuring sound intensity expressed in decibels.
During the second session (S2), the students discuss the discretisation of the classroom so as to produce a sound map of the room. In groups, the students selected an appropriate procedure for collecting sound intensity measurements that cover all the classroom space. The idea is to depict a sound intensity map of the classroom based on the punctual sound source. The sound is emitted from a computer placed on the teacher’s desk. Figure 1 shows the grid pattern chosen by the class after the group discussion, which consists of a discretisation of the classroom into cells in which the sound intensity will be measured during the third session.
The third session (S3) is devoted to gathering data by taking sound intensity measurements for each cell of the selected division of the classroom. This session uses a single source that emits pink noise with a constant intensity. The sound is emitted from the computer speaker located on the teacher’s desk. Figure 2 shows the classroom being prepared for these measurements.

4.2.2. Data Representation

In the fourth session the students worked on developing a three-dimensional representation of the sound intensity in the classroom using Multilink cubes. They used a flat matrix representing the map of the classroom on which they placed a certain number of Multilink cubes to represent the sound intensity values in each zone. The most effective strategy, which emerged in one of the groups, was to start from the lowest intensity value recorded (52.15 dB) and increase the height by giving the cubes values of 0.5 dB. Four of these representations are shown in the Figure 3.
In the fifth session, the sound intensity data collected in Plotly is entered and the resulting heat maps and contour maps are generated (Figure 4). From these representations the students work on generating explanations both for the representation format and to explain how the sound is distributed in the classroom.

4.3. Data Analysis

To analyse the data collected during the experience, the students’ interactions with each other recorded on the iPads during all the sessions are reviewed, the interactions with the teacher are also identified and the materials produced in each of the sessions are qualitatively analysed.
To analyse students’ work during the solution process of the STEM problem-solving activity, we follow Lesh and Harel’s definition [13] of a mathematical model as a conceptual system that explains a phenomenon in which the concepts are accompanied by the procedures necessary to implement them and which need to be expressed or communicated. In previous works, we have used an analysis tool based on the identification of the procedures used by students, since this is the easiest element to identify and classify, and thus to be able to identify the concepts that make them necessary in the case that students do not make them explicit (Gallart et al. [33]).
In this way we can identify the elements that compose the mathematical model that the students are considering at any given moment, as well as the changes they introduce to that model they are working with. We will consider that all those situations that provoke students to consider a change in the model are promoted by mathematical learning opportunities. This will allow us to identify these learning opportunities, thus responding to the first objective of the study.
Our second research objective is to identify the catalyst for each mathematical learning opportunity. To identify the catalyst elements, we analysed the interactions between students, teacher, and the task they are currently working on. Thus, during the analysis of the transcripts of the students’ discussions, we first identified the learning opportunities that appeared as the students progressed through the activity. This identification was done through a parallel analysis by two of the three authors, followed by a pooling to contrast and complete the results. Once the learning opportunities have been identified, each of them is linked to a catalyst. The five categories of catalysts that are defined in the following lines were established and agreed upon by the three researchers during a joint analysis of the learning opportunities.
To ensure the reliability of the analysis of the learning opportunities, the three researchers independently analysed the transcripts where learning opportunities were identified. The aim was to assign at least catalyst elements to each learning opportunity. Since this is not a univocal categorisation (as a learning opportunity can be generated by several catalytic elements) and, moreover, this is an exploratory study, we did not measure intercoder reliability by means of any test. What we have done is to pool information between the three researchers. In this pooling to assign categories, we grouped the results of the three independent analyses. Thus, a catalyst element was assigned to each learning opportunity whenever there was agreement on the result of the analysis of at least two of the three researchers.
Catalyst elements can be related to different aspects. Below we describe and illustrate each catalyst with an example taken from the transcriptions, using T for transcriptions of teacher interventions, and the letters A, B, C and D followed by a number for the students.
Nature of the phenomenon: Although sound is an everyday physical phenomenon, students do not have a deep understanding of all its properties and the appropriate way to interact with it. In the following conversation it can be how students discuss the nature of sound and some characteristics of sound propagation, based on their previous knowledge.
T: How do you think sound propagates?
A2: There needs to be some always air for sound to propagate
A3: And if there is a wall near the source of the sound, it can bounce, that produces the echo.
A1: So, there are vibrations in the air!
T: Indeed, the emitting source vibrates and, in doing so, the molecules in the air receive this vibration and transmit it to neighboring particles. This promotes a pressure fluctuation, which is called a wave.
Technologies for data acquisition: The different instruments or technological devices used have a specific way of being used and provide information in their own format. In the following conversation, students express some beliefs about the expected results of sound intensity measurements from the instruments used.
[Students try to take measurements with the iPad at their desks. The intensity of the emitting source is constant, but they observe that the measurement result is variable]
B1: The measurements are not always the same, but no we haven’t moved!
T: Wow, did you expect the measurements to be always the same?
A2: Of course!
B1: I’m thinking that perhaps the noise is irregular… or maybe the iPad’s sensor is not accurate.
T: How can we get a reliable measurement at a specific point?
B1: We can measure several times and…!
B2: Take the average of the values!
B3: I’m thinking that maybe the differences appeared because we changed the orientation of the iPad…see that the microphone is here [points to the exact spot on the device].
Group work interaction: During the work in small groups, students pool their ideas and discuss them in order to come up with answers to the problems they encounter. At this point, the catalytic element is provided by the interactions between students in each group when the outcomes of individuals are affected by others’ actions in the group work.
[Students are discussing how to use the cubes to represent the data]
B1: We must use these little coloured cubes…
B2: Yeah, no idea what we can do with this.
B3: This kind of reminds me of the histograms we did in statistics.
B2: Wait…if we look at the data in one row…
B3: We can try to make several columns of cubes, one that represents each of the measurements in that row!
B1: However are we going to use the colours for anything? We don’t have the same number of cubes of each colour…
B2: Well, let’s forget about the colours for the moment… Let’s focus on seeing how to raise a column in each cell.
[After this discussion the students have already understood the first step in the representation of the data. They then begin to collect the pieces to make the first columns. This is an important moment in the solving process, as the notion of function appears. Indeed, the discussion among the students allows them to see that they must associate a value with each point on the plane a value corresponding to the measure of intensity at that point and that, in addition, this relationship can be represented by raising a column at each of the points].
Mathematical model of the phenomenon: Students construct a function (understood as a relation between points on the plane and the sound intensity at that point) which they must express so that it can be interpreted. This function provides a real value for each point on a plane and they do not know ways of representing this relationship as can be seen in the excerpt below.
[Once the students have the data and are ready to represent them using the multilink cubes].
T: How could you represent this data?
C1: We could make a bar diagram…for each…
T: For each row?
C1: Exactly, we represent with bars the measurements obtained in each row of points.
T: Okay, what would you get then?
C2: I see…then we will have…five bar charts?
C1: No, not five, no. We would have about seven rows, so a bar chart for each row.
C2: And we can order them from closest to farthest.
Teacher: As the students progress through the STEM problem solving activity, in fact as they represent the model of the physical phenomena, they encounter obstacles which they consult or discuss with the teacher. The teacher provides them with ideas, concepts, or tools to make the right choices as can be seen in the teacher’s interventions in the following conversation.
[Students have already decided that they will raise a column of cubes in each cell according to the value of the intensity at that point].
D1: We must raise a column in each cell, it will be higher if the value of the measurement is higher.
T: That’s a good idea!
D2: Yes, but…how do we do it? If there are numbers like that…[gesticulates referring to big]
D1: 10 by 10!
T: Come on, give it a try.
[After a while of trying, the students realise that if they give this value to the cubes, there is hardly any difference]
T: How are you doing?
D2: It’s going badly, because we don’t know how to represent this data…
T: Yeah, they’re big and they’re not that different either… how about looking at the difference between the biggest and the smallest of the data?
D1: I have an idea! We can represent the lowest value with a cube and, from there, we increase…

5. Results: Mathematical Learning Opportunities

In this section we detail the mathematical learning opportunities and their categorisation for each of the working sessions of the activity.

5.1. Sound Measure Experiment Phase

5.1.1. Session 1:

During this first session, after explaining to the students that they were starting a five-session STEM problem-solving activity that would involve taking and analysing data, basic concepts about the physics of sound were introduced. To this end, the teacher posed questions to the students such as: How is sound distributed throughout the classroom? Does the perception of sound changes from one point in the classroom to another? What variables affect our perception of sound in the classroom?
These questions were discussed in a large group and some preconceptions were observed, such as the (erroneous) idea that sound is static and present in the classroom at all times while noise is emitted from a source. It was also observed that some students believed that noise “travels”, as if it were a substance dissolved in the air. These initial difficulties make it possible to introduce the concept of vibration and waves.
Next, an exploratory measurement of sound intensity is addressed, introducing the common unit of measurement, the decibel, and explaining that this unit is derived from a logarithmic scale. Once this has been explained, the teacher shows how the Decibel Ultra Pro app works on the iPad device to familiarise the students with the app through a series of measurements. Although there was not complete silence during the sound emission and intensity measurements, the students already observed some interesting phenomena. In fact, the students noticed that there were variations depending on the location of the measurements, differences in the measurement depending on the orientation of the device’s microphone, and slight changes in successive measurements under the same conditions. Table 1 details the learning opportunities identified in this session.

5.1.2. Session 2:

At the beginning of the second session, some of the phenomena observed during the initial exploratory measurement are revisited: in particular the reduction of sound intensity as the measurement moves away from the source of the emission. This discussion allows the teacher to return to the concept of sound as vibration (as opposed to the preconceived misconception that it is “waves moving in the air”).
Next, the initial problem of the project is recalled: to understand the acoustics of the classroom, namely to obtain a sound map of the classroom. To do this, each group of students is given a blank map of the classroom and asked to think about the choices that need to be made in order to organise the measurement. At this point, the students first discuss possible interferences in the measurement process due to the classroom furniture. They also note that it is necessary to discretise the space by setting specific points to determine sound intensity measurements. To this end, the groups of students agree on the need to divide the classroom into zones, and gradually, the need for a regular organisation of the distribution of the measurement points becomes clearer.
Once these initial ideas have been defined and shared, the students, working in small groups on the maps, make their proposals for the distribution of the measurement points. Some students, when considering the distribution of the measurement points, make inefficient approaches, both by excess (as they propose an excessively precise mapping of the classroom) and by default (some propose taking measurements at five points: four corners and a central point). The need to define the points at which measurements are to be taken arises from the students’ discussion, but the teacher’s intervention is necessary to arrive at a proposal that allows data to be collected in a way that is consistent with the project’s objectives.
After this discussion, the need to establish a grid to define the exact points of measurement, so that this is done uniformly throughout the classroom space, is discussed. Now the reflection is about the size of the cells in this grid. At this point, some groups of students require the use of a measurement tape to obtain the precise measurements of the classroom, while other groups base their reasoning on the tiles which, after all, also form a grid on the classroom floor. This is a key moment when it is necessary to make decisions that will shape the rest of the activity. After a whole group reflection led by the teacher, students agree to establish a grid with square cells of one meter on each side. The teacher’s role is focused on proposing a feasible strategy that takes up the ideas of the students, acting as a facilitator of the project’s development. Table 2 shows the learning opportunities identified in this session.

5.1.3. Session 3:

The third session is dedicated to taking measurements in the classroom. The starting point for this session is the grid set up to determine the points at which measurements will be taken. However, before starting the measurement process, the teacher leads a guided large group discussion. This discussion is based on the possible influence of the device on the measurement taken. At this point, the teacher recalls the phenomenon observed during the exploratory measurements of the first session, where variations in the measurements were noted depending on the orientation of the microphone of the device.
On the basis of this question, students reflect and discuss how to tackle this problem. They conclude that they can take more than one measure at each point. Once this idea is established, they discuss what to do with the values obtained: after discarding one of the extreme values, they decide that the most reasonable thing to do is to take several values and to average the measurements at each point, thus overcoming measurement errors. Once the students have arrived at this idea, the teacher intervenes to facilitate decision-making suggesting that they take four values at each point, one from each direction in relation to the source of the sound emission: from the front, from the back and from both sides. This is a complex learning opportunity in which the characteristics of the data acquisition tools, the interaction of the students to overcome the limitations encountered and the intervention of the teacher to overcome the difficulties are intertwined. Table 3 details the learning opportunities identified in this session.

5.2. Data Representation Phase

5.2.1. Session 4:

During this session, the students had to use the material provided (Multilink cubes of different colours and a grid base) to represent the values obtained during the measurement in the previous session.
For this purpose, each group of students was given with a table of the mean values obtained in each of the grid cells. The instruction given to the students was: “Look carefully at the map of the classroom and the mean data of the values obtained in each of the grid cells. Using the coloured blocks you have in your group, you should try to represent the numerical information in a way that gives a useful representation that allows us to better understand how sound intensity is distributed in the classroom”.
At the beginning of the session, students were asked to share their reflections on the data collected the previous day. At this point, students looked at the differences between the values in different parts of the classroom and tried to assess whether they were meaningful. In addition, the reflection was guided towards the mathematical interpretation of the data, showing that in this case there is a relationship that assigns a numerical value to each region of the plane (the measure of the intensity of the sound). The aim was for the students to begin to understand the situation as a functional relationship between the plane and the set of real numbers. Next, the students had to discuss in small groups to agree on a representation system based on the Multilink cubes.
At this point, different ideas emerged in each group, some of which are highlighted below. First, the students had to decide what meaning they wanted to give to each of the cubes. For example, in one group the students decided to make a column of cubes representing the intensity where it was highest. From there, they tried to make shorter columns by removing cubes. However, they soon realised two issues: the number of cubes is limited and it is necessary to decide what value to give to each of the cubes (since the values collected in the measurement had two decimal places). Once these constraints were identified by the students, it was observed that they used different solutions to try to overcome them.
Some students thought that since there were blocks of different colours, they could assign a value according to the colour: for example, blue represents 10 dB, red 5 dB, green 1 dB, white 0.5 dB, pink 0.1 dB and so on. The problem is that they soon realised that they didn’t have enough cubes of any one colour. This led them to try rounding the values to whole numbers. However, they found that rounding prevented them from observing differences between the measurements. This led the students to a very interesting key idea: in order to represent the data accurately, it is necessary to move the vertical axis of the coordinates, starting from the whole number corresponding to the lowest measurement. Table 4 details the learning opportunities identified in this session.

5.2.2. Session 5:

In the last session, the aim was for the students to try to represent the information collected during the measurement in a two-dimensional form. For this purpose the session was held in the computer room.
At the beginning of the session, the students had difficulties in thinking of possible flat representations of the sound distribution, but some of the ideas that had emerged in the previous session were very useful here. For example, when working with the cubes, some groups thought it would be a good idea to place cubes with warmer and more intense colours in the areas where the intensity of the sound was greatest. Therefore, the students soon thought that assigning a colour to each cell according to a graded colour scale was a good way of presenting the data in 2 dimensions. This is the first version of a heat map showing the results of the measurements taken in the classroom.
Having introduced this idea, the teacher recalls the concept of the contour line. Although the contour line had not been used in mathematics before, it was a representation with which the students were familiar. Pupils were familiar with it from the study of physical maps in geography class, and also from the maps with isobar lines that are common in the meteorology section of television news bulletins. Table 5 details the learning opportunities identified in this session.

6. Discussion

The literature on STEM teaching and learning highlights its complexity and the difficulties it poses for both teachers (Diana et al. [34]) and learners (Shekhar et al. [35]). In our study we have focused on identifying the mathematical learning opportunities (Cai et al. [3], Wijaya, van den Heuvel-Panhuizen and Doorman [31]) that sound intensity analysis promotes in a classroom and the catalyst elements that promote the development of the mathematical model that students build.
First, we have identified a large number of mathematical learning opportunities. Some of these are related to concepts specific to physics as a discipline, motivated by the choice of a physical phenomenon as the starting point of the modelling activity (Ortega and Puig [36], Ortega, Puig and Albarracín [37]). However we have also identified opportunities related to other essential aspects of the characteristics of the activity and, particularly noteworthy, to the combination of several of these characteristics. These characteristics that act as promoters of learning opportunities are what we have called catalysts in this study.
In compiling the identified catalysts, we first identified the need for complex measurements and the use of the data obtained, as well as their management, and representation. There are several elements that need to be combined to create a mathematical model that adequately represents the sound intensity in a classroom. In this way the choice of software and its characteristics is a key element in the design of the activity, since it involves a series of decisions in the method of data acquisition, data management and representation of results are key procedures. In this sense, it is necessary for the teacher to anticipate the implications of the characteristics of the tools to be used, as small differences may imply very different uses in the STEM problem-solving process. We conclude that STEM problem solving activities should consider the use of technological tools (Greefrath et al. [38], Daher and Shahbari [39]) and that the design of the activity should aim to promote students’ reflection on their actions and the decisions they make, which are those that connect the real world and mathematics. Here, reflection on actions with data collection tools and the consequences of decisions are fundamental for the development of the modelling activity (Perrenet and Adan [27]).
In the same way, the teacher who guides the activity has a key role to play. It is not enough to design a STEM problem solving activity, it is imperative that the teacher knows how to foster classroom situations to promote learning opportunities. These mathematical learning opportunities are significant when the teacher invites students to participate and keeps them on track. This type of intervention is the most common in our experience. We interpret this fact as follows: when the teacher appears during a discussion in a group, students try to explain their strategies clearly and at the same time they think about them aloud in order to be clear and easy to understand. When students discuss with the teacher, they can more easily see when something does not fit into their argument. However, when the teacher brings the students back into line (acting as a resource manager), the students interpret their results and, in some cases, they modify their solution plans or even reject them. In this way, we conclude that the teacher’s role has a formalising element in the mathematical activity, which is key to giving a defined form to the mathematical model.
Our study shows that for teacher interventions to be effective, the concepts to be studied must emerge from the interaction between students (DeRuntz et al. [22]). There is also some evidence of differences between intra-group and extra-group debates. In the former, the teacher tends to act as a resource manager or even as an observer. Moreover, during the intra-group debates, we find that the teacher’s interventions lead to the promotion of procedural and managerial learning opportunities, but always helping to concretise the procedures necessary to materialise the concepts that the students consider as part of the developed model. Therefore, the richest learning opportunities identified in this study have a complex catalyst, starting from the difficulty of obtaining a measurement or representing data, through a discussion among the students in a group in which the concepts that support the constructed model are generated, and are consolidated when the teacher’s intervention is necessary to provide procedures unknown to the students that allow the materialisation of these concepts. However, in whole group discussions (extra group debate) the teacher tends to act as a facilitator and mainly promotes conceptual learning opportunities (Blomhoj and Kjeldsen [20]).
This exploratory work confirms that the implementation of a STEM problem-solving activity is, also from the teacher activity point of view, a very complex task, in line with Diana, Turmudi and Yohannes [34]. We have identified several aspects about students interactions and teacher interventions that can lead to deeper studies. We understand that other physical phenomena that have a similar mathematical formulation can be studied in classrooms, such as the intensity of WiFi or the temperature in the classroom, but the way in which these values are measured, as well as the relationship that students have with these phenomena, is different. Therefore, we consider that it is necessary to study to what extent the concepts and procedures used by students can be transferable from the study of one phenomenon to another, as well as the elements that the teacher must take into consideration to guide the activity.
All this leads us to the main contribution of this study. We confirm that it is possible to design and implement a realistic STEM activity based on modelling (Hallström and Schönborn [12]) in which mathematical knowledge is the focus of learning. This allows us to overcome an instrumental use of mathematics within STEM activities by using realistic contexts. A key element of the implementation is the need to promote complex learning opportunities (Cai et al. [3]) in which it is necessary to coordinate the characteristics of the phenomenon studied, the possibilities and limitations of the technological tools used (Geiger [24]), the interaction of the students that generates the main concepts to analyse the phenomenon (Ortega et al. [37]) and, finally, the role of the teacher (Burkhardt [18]). In this sense, the teacher has a multiple role: proposing the activity, guiding it and facilitating the students’ work. It is the transition between the teacher’s roles that provides the greatest number of learning opportunities in conjunction with group work.

Author Contributions

Conceptualization, I.F. and P.D.D.; methodology, I.F., L.A. and P.D.D.; validation, I.F., L.A. and P.D.D.; formal analysis, I.F., L.A. and P.D.D.; investigation, I.F., L.A. and P.D.D.; writing—original draft preparation, I.F and L.A.; writing—review and editing, I.F., L.A. and P.D.D. All authors have read and agreed to the published version of the manuscript.

Funding

This work has been done with the financial support of Universitat de València, through the project UVINV-AE-1557785 and AGAUR (Generalitat de Catalunya) through the research group GIPEAM - 2021SGR00497. Authors are grateful to the support provided by the grants PID2020-117395RB-I00 and PID2021-126707NB-I00 funded by MCIN/AEI/10.13039/501100011033 and by “ERDF A way of making Europe”. Lluís Albarracín is Serra Húnter Fellow in Universitat Autònoma de Barcelona.

Institutional Review Board Statement

The study was conducted in accordance with the Declaration of Helsinki and the Code of good practices in research from Universitat Autònoma de Barcelona https://www.uab.cat/doc/DOC_CBP_EN, accessed on 1 April 2023.

Informed Consent Statement

Informed consent was obtained from all subjects involved in the study.

Data Availability Statement

The datasets supporting the reported results are available from I.F. (irene@[email protected]) on reasonable request.

Conflicts of Interest

The authors declare no conflict of interest.

References

  1. Maass, K.; Geiger, V.; Ariza, M.R.; Goos, M. The role of mathematics in interdisciplinary STEM education. ZDM 2019, 51, 869–884. [Google Scholar] [CrossRef]
  2. Chalmers, C.; Carter, M.; Cooper, T.; Nason, R. Implementing “big ideas” to advance the teaching and learning of science, technology, engineering, and mathematics (STEM). Int. J. Sci. Math. Educ. 2017, 15, 25–43. [Google Scholar] [CrossRef]
  3. Cai, J.; Morris, A.; Hohensee, C.; Hwang, S.; Robison, V.; Cirillo, M.; Kramer, S.L.; Hiebert, J.; Bakker, A. Maximizing the quality of learning opportunities for every student. J. Res. Math. Educ. 2020, 51, 12–25. [Google Scholar] [CrossRef]
  4. Albarracín, L.; Gorgorió, N. Mathematical modeling projects oriented towards social impact as generators of learning opportunities: A case study. Mathematics. 2020, 11, 2034. [Google Scholar] [CrossRef]
  5. Honey, M.; Pearson, G.; Schweingruber, H. (Eds.) STEM Integration in K-12 Education: Status, Prospects, and an Agenda for Research; National Academies Press: Washington, DC, USA, 2014. [Google Scholar]
  6. Doerr, H.; Ärlebäck, J.B. Fostering students’ independence in modelling activities. In Proceedings of the CERME 9-Ninth Congress of the European Society for Research in Mathematics Education, Prague, Czech Republic, 4–8 February 2015; pp. 855–861. [Google Scholar]
  7. Stender, P.; Kaiser, G. Scaffolding in complex modelling situations. Zdm 2015, 47, 1255–1267. [Google Scholar] [CrossRef]
  8. Blum, W.; Niss, M. Applied mathematical problem solving, modelling, applications, and links to other subjects—State, trends and issues in mathematics instruction. Educ. Stud. Math. 1991, 22, 37–68. [Google Scholar] [CrossRef]
  9. Lawrenz, F.; Gravemeijer, K.; Stephan, M. Introduction to this Special Issue. Int. J. Sci. Math. Educ. 2017, 51, S1–S4. [Google Scholar] [CrossRef]
  10. Li, Y.; Schoenfeld, A.H. Problematizing teaching and learning mathematics as “given” in STEM education. Int. J. Stem Educ. 2019, 6, 44. [Google Scholar] [CrossRef]
  11. Duijzer, C.; den Heuvel-Panhuizen, V.; Veldhuis, M.; Doorman, M. Supporting primary school students’ reasoning about motion graphs through physical experiences. ZDM 2019, 51, 899–913. [Google Scholar] [CrossRef]
  12. Hallström, J.; Schönborn, K.J. Models and modelling for authentic STEM education: Reinforcing the argument. Int. J. Stem Educ. 2019, 6, 22. [Google Scholar] [CrossRef]
  13. Lesh, R.; Harel, G. Problem solving, modeling, and local conceptual development. Math. Think. Learn. 2003, 5, 157–189. [Google Scholar] [CrossRef]
  14. Academy of Learned Academies (ACOLA). STEM: Country Comparisons: International Comparisons of Science, Technology, Engineering and Mathematics (STEM) Education; Final Report; ACOLA: Canberra, Australia, 2013. [Google Scholar]
  15. Venville, G.J.; Wallace, J.; Rennie, L.J.; Malone, J.A. Curriculum integration: Eroding the high ground of science as a school subject? Stud. Sci. Educ. 2002, 37, 43–84. [Google Scholar] [CrossRef]
  16. Pang, J.; Good, R. A review of the integration of science and mathematics: Implications for further research. Sch. Sci. Math. 2000, 100, 73–82. [Google Scholar] [CrossRef]
  17. Zemelman, S.; Daniels, H.; Hyde, A. Best Practice: New Standards for Teaching and Learning in America’s School; Heinemann: London, UK, 2005. [Google Scholar]
  18. Burkhardt, H. Modelling in Mathematics Classrooms: Reflections on past developments and the future. ZDM 2006, 38, 178–195. [Google Scholar] [CrossRef]
  19. Blomhøj, M.; Jensen, T.H. What’s all the fuss about competencies? In Modelling and Applications in Mathematics Education; Springer: Berlin/Heidelberg, Germany, 2007; pp. 45–56. [Google Scholar]
  20. Blomhøj, M.; Kjeldsen, T.H. Teaching mathematical modelling through project work. ZDM 2006, 38, 163–177. [Google Scholar] [CrossRef]
  21. Torras Galán, A.; Pastor, S.L.; Llach, M.C. El aprendizaje basado en proyectos en el ámbito STEM: Conceptualización por parte del profesorado. Rev. Electron. Ensen. Las Cienc. 2021, 20, 359–380. [Google Scholar]
  22. DeRuntz, B.; Henson, H.; Withee, T. Leadership Development and STEM Student Success Using the Social Interdependence Model. In Proceedings of the 2022 ASEE Annual Conference and Exposition, Minneapolis, MN, USA, 26–29 June 2022. [Google Scholar]
  23. Doerr, H.M. Experiment, simulation and analysis: An integrated instructional approach to the concept of force. Int. J. Sci. Educ. 1997, 19, 265–282. [Google Scholar] [CrossRef]
  24. Geiger, V. Factors affecting teachers’ adoption of innovative practices with technology and mathematical modelling. In Trends in Teaching and Learning of Mathematical Modelling; Springer: Berlin/Heidelberg, Germany, 2011; pp. 305–314. [Google Scholar]
  25. Brown, J.P. Visualisation tactics for solving real world tasks. In Mathematical Modelling in Education Research and Practice; Stillman, G.A., Blum, W., Biembengut, M.S., Eds.; Springer: Berlin/Heidelberg, Germany, 2015; pp. 431–442. [Google Scholar]
  26. Frejd, P.; Ärlebäck, J.B. Initial results of an intervention using a mobile game app to simulate a pandemic outbreak. In Mathematical Modelling and Applications: Crossing and Researching Boundaries in Mathematics Education; Stillman, G.A., Blum, W., Kaiser, G., Eds.; Springer: Berlin/Heidelberg, Germany, 2017; pp. 517–527. [Google Scholar]
  27. Perrenet, J.; Zwaneveld, B. The many faces of the mathematical modeling cycle. J. Math. Model. Appl. 2012, 1, 3–21. [Google Scholar]
  28. Törnroos, J. Mathematics textbooks, opportunity to learn and student achievement. Stud. Educ. Eval. 2005, 31, 315–327. [Google Scholar] [CrossRef]
  29. Floden, R.E. The measurement of opportunity to learn. In Methodological Advances in Cross-National Surveys of Educational Achievement; Porter, A.C., Adam, G., Eds.; National Academy Press: Washington, DC, USA, 2002; pp. 231–266. [Google Scholar]
  30. Cobb, P.; Whitenack, J.W. A method for conducting longitudinal analyses of classroom videorecordings and transcripts. Educ. Stud. Math. 1996, 30, 213–228. [Google Scholar] [CrossRef]
  31. Wijaya, A.; van den Heuvel-Panhuizen, M.; Doorman, M. Opportunity-to-learn context-based tasks provided by mathematics textbooks. Educ. Stud. Math. 2015, 89, 41–65. [Google Scholar] [CrossRef]
  32. Vermont Department of Education. Vermont’s Framework of Standards and Learning Opportunities; Vermont Department of Education: Montpelier, VT, USA, 2000.
  33. Gallart, C.; Ferrando, I.; García-Raffi, L.M.; Albarracín, L.; Gorgorió, N. Design and Implementation of a Tool for Analysing Student Products When They Solve Fermi Problems. In Mathematical Modelling and Applications: Crossing and Researching Boundaries in Mathematics Education; Springer: Berlin/Heidelberg, Germany, 2017; pp. 265–276. [Google Scholar]
  34. Diana, N. Analysis of teachers’ difficulties in implementing STEM approach in learning: A study literature. J. Phys. Conf. Ser. 2021, 1806, 012219. [Google Scholar] [CrossRef]
  35. Shekhar, P.; Borrego, M.; DeMonbrun, M.; Finelli, C.; Crockett, C.; Nguyen, K. Negative Student Response to Active Learning in STEM Classrooms. J. Coll. Sci. Teach. 2020, 49, 45–54. [Google Scholar]
  36. Ortega, M.; Puig, L. Using modelling and tablets in the classroom to learn quadratic functions. In Mathematical Modelling and Applications; Springer: Berlin/Heidelberg, Germany, 2017; pp. 565–575. [Google Scholar]
  37. Ortega, M.; Puig, L.; Albarracín, L. The Influence of Technology on the Mathematical Modelling of Physical Phenomena. In Lines of Inquiry in Mathematical Modelling Research in Education; Springer: Berlin/Heidelberg, Germany, 2019; pp. 161–178. [Google Scholar]
  38. Greefrath, G. Using technologies: New possibilities of teaching and learning modelling–Overview. In Trends in Teaching and Learning of Mathematical Modelling; Springer: Berlin/Heidelberg, Germany, 2011; pp. 301–304. [Google Scholar]
  39. Daher, W.M.; Shahbari, J.A. Pre-service teachers’modelling processes through engagement with model eliciting activities with a technological tool. Int. J. Sci. Math. Educ. 2015, 13, 25–46. [Google Scholar] [CrossRef]
Figure 1. Selected measurement points in the classroom.
Education 13 00417 g001
Figure 2. The classroom where the STEM problem-solving activity takes place being prepared for the sound intensity measurements.
Education 13 00417 g002
Figure 3. Student representations of the collected data using Multilink® material.
Education 13 00417 g003
Figure 4. Heat map (left) and contour map (right) of the collected values computed using the online collaborative tool Plotly®.
Education 13 00417 g004
Table 1. Learning opportunities of Session 1.
DescriptionCatalysts
Sound wave: it is explained in class that a sound wave is a disturbance of molecules, caused by vibrations that propagate in a material medium, usually air, or even in a vacuum.Nature of the physical phenomenon; Teacher
Sound intensity: it is explained to students that sound intensity is the amount of energy proportional to the vibrations and pressure changes created in the passage of a sound wave.Nature of the physical phenomenon; Teacher
Logarithmic scale: A measurement scale that uses the logarithm of a quantity, rather than the quantity itself. It is commonly used when the data are large numbers.Teacher
Ways of representing information on a surface: the teacher asks the students about various ways known to the students for representation on a plane. Students propose different types of graphics or maps.Mathematical model of the physical phenomenon; Teacher
Decibel Ultra Pro software: students are instructed to use the software to make accurate measurements.Technologies for data acquisition
Using real data: At the beginning of the session, the teacher makes it clear to the students that in the real world, the empirical work of collecting data is not always an easy task and that it is necessary to obtain valid and authentic information to enable them to make judgements.Technologies for data acquisition
Table 2. Learning opportunities of Session 2.
DescriptionCatalysts
Decrease in intensity with distance: students experiment with the phenomenon of decreasing intensity with distance from the sound source and provide their explanations for the change in the values obtained.Nature of the physical phenomenon; Technologies for data acquisition
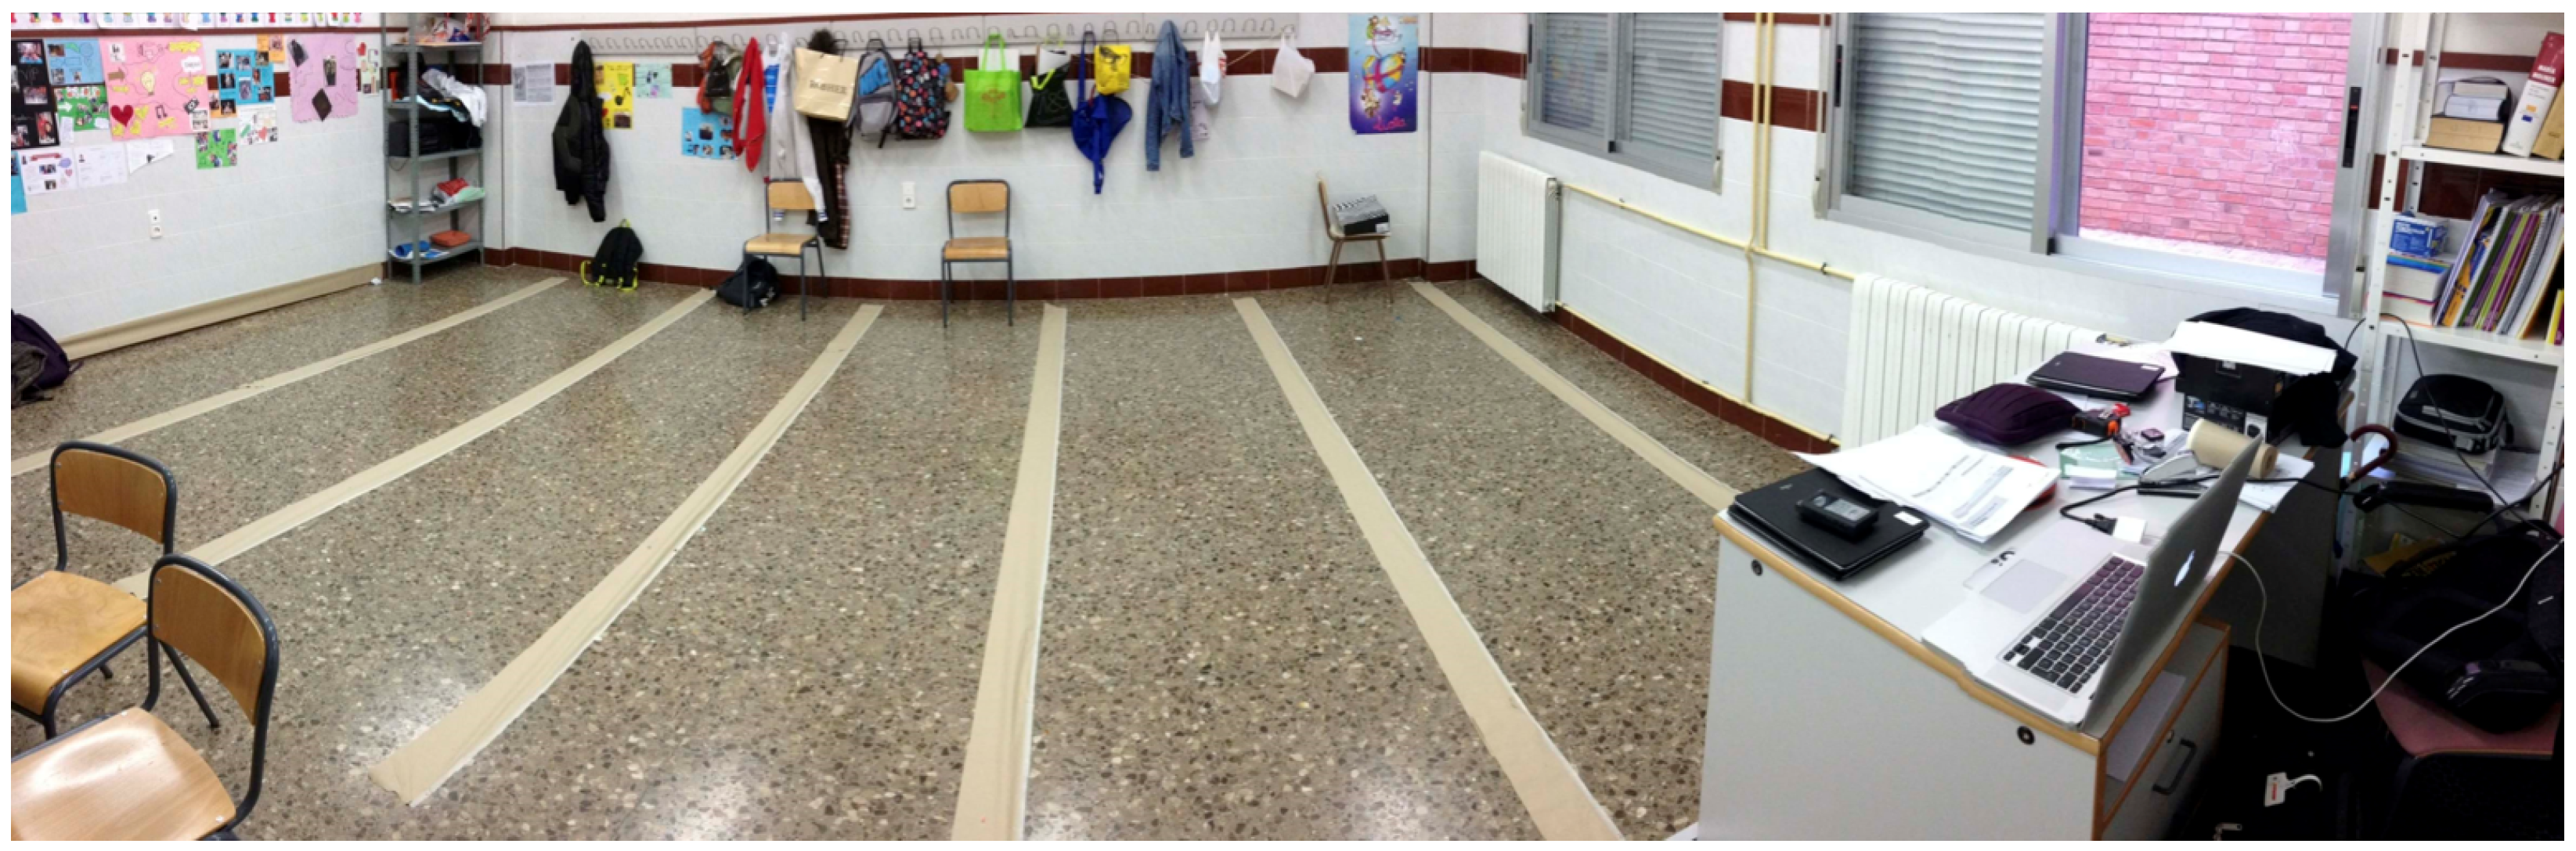
Verbal descriptions of physical constraints considered in the real situation: students discuss the variations in sound intensity in each area of the classroom due to the constraints introduced by the furniture, the distance to the sound source and the geometry of the classroom boundary.Nature of the physical phenomenon
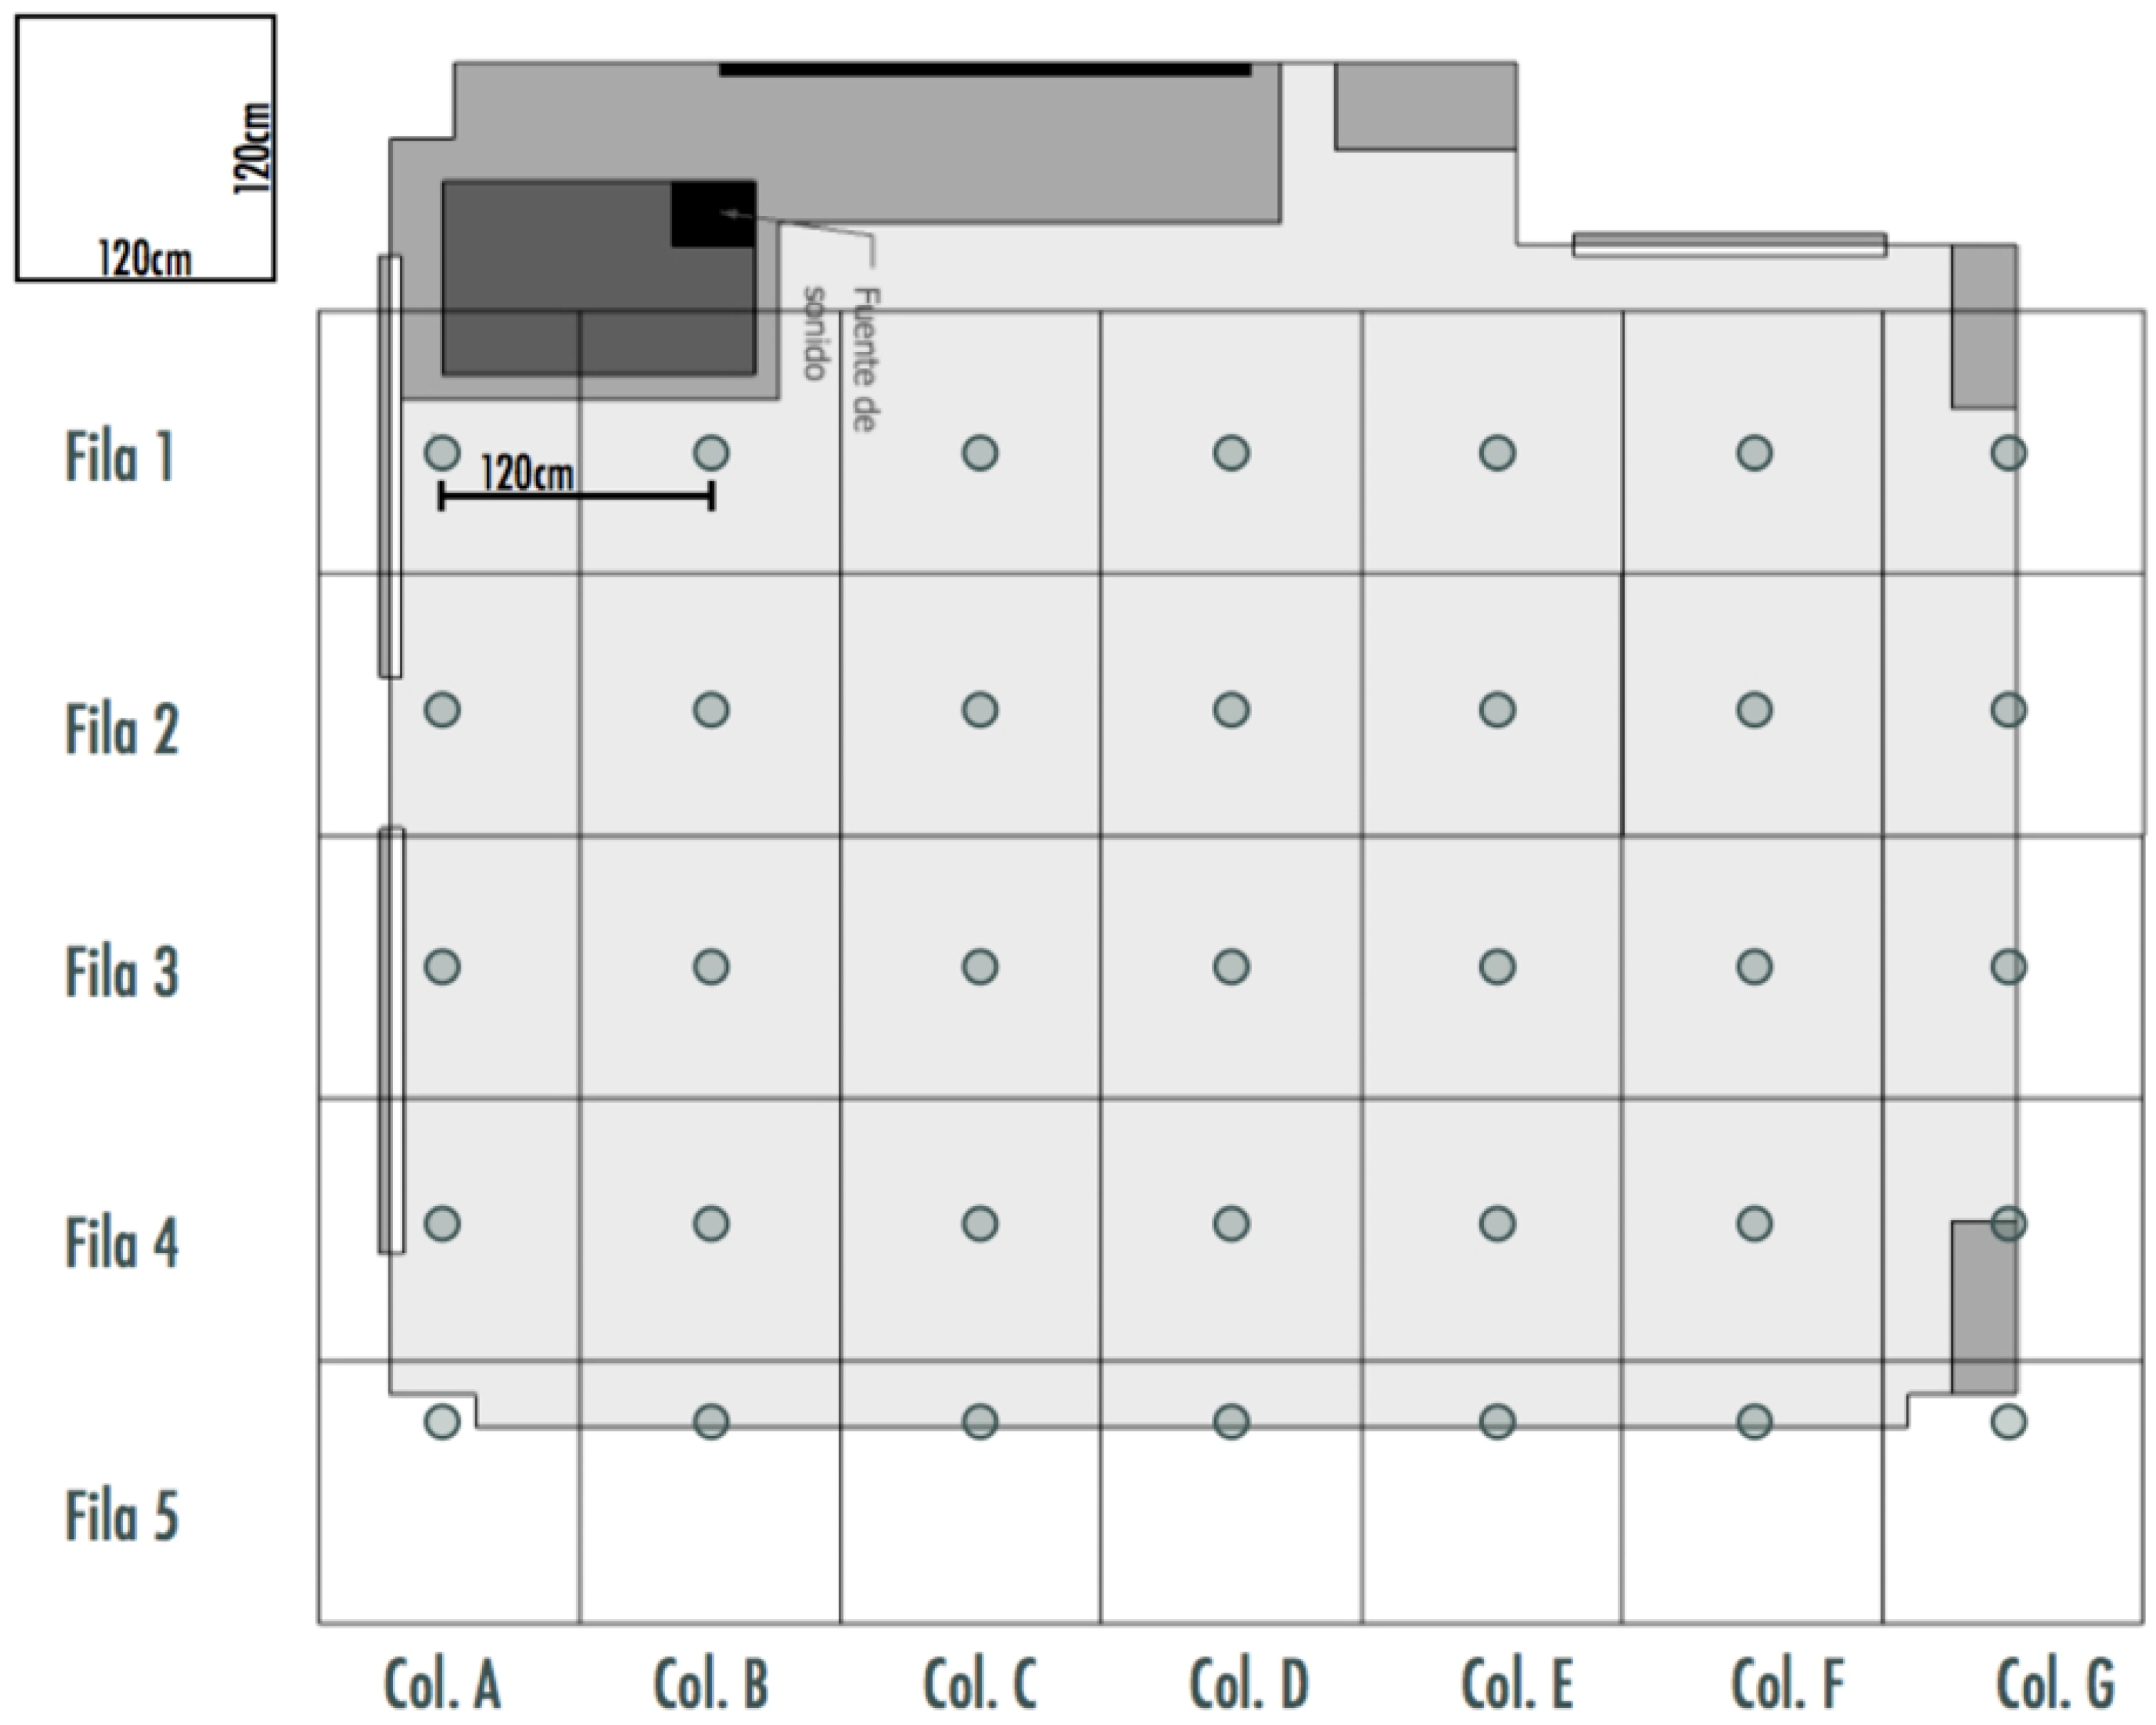
Ways of dividing a plane surface: since it is not possible to get data for each point on the class plane, students discuss ways of dividing the plane and note that there are multiple ways and that some ways fit the needs of the study better than others.Teacher
Grid: students discretise the plane from a structure of rows and columns to obtain representative measurements of the entire surface of the classroom.Technologies for data acquisition
Adequate distance between measurement points: students note that it is necessary to maintain a balance between the effort required to carry out all the measurements and the desired accuracy.Technologies for data acquisition; Group work interaction
Need of discrete measurement: Students identify the need to make divisions in the classroom to make measurements.Group work interaction
The grid as a two-dimensional form of representation: students observe that the plane can be represented using two dimensions and that this fact conditions the way in which they must refer to each measuring point, so that a notation referring to two variables must be generated to denote each point on the plane.Mathematical model of the physical phenomenon; Teacher
Table 3. Learning opportunities of Session 3.
DescriptionCatalysts
Arithmetic mean as a form of error minimisation: Measurement errors can be systematic or random. Systematic errors are due to the use of poorly calibrated instruments and therefore, not taking these effects into account influences the measurements taken. Others can be random and unavoidable, which are those due to the observer, or those that reflect the dispersion of the magnitude measured when repeating the experiment. The errors detected in the experiment were of both types.Technologies for data acquisition; Group work interaction; Teacher
Use of an application to measure sound intensity: The Decibel Ultra Pro® application provides sound intensity values, but like any device it can have accuracy errors. The students tested the robustness of the app in capturing data. In the same area, without moving and in silence, two different intensity values are obtained, which makes us think of ways to help us avoid this technological obstacle.Technologies for data acquisition
Table 4. Learning opportunities of Session 4.
DescriptionCatalysts
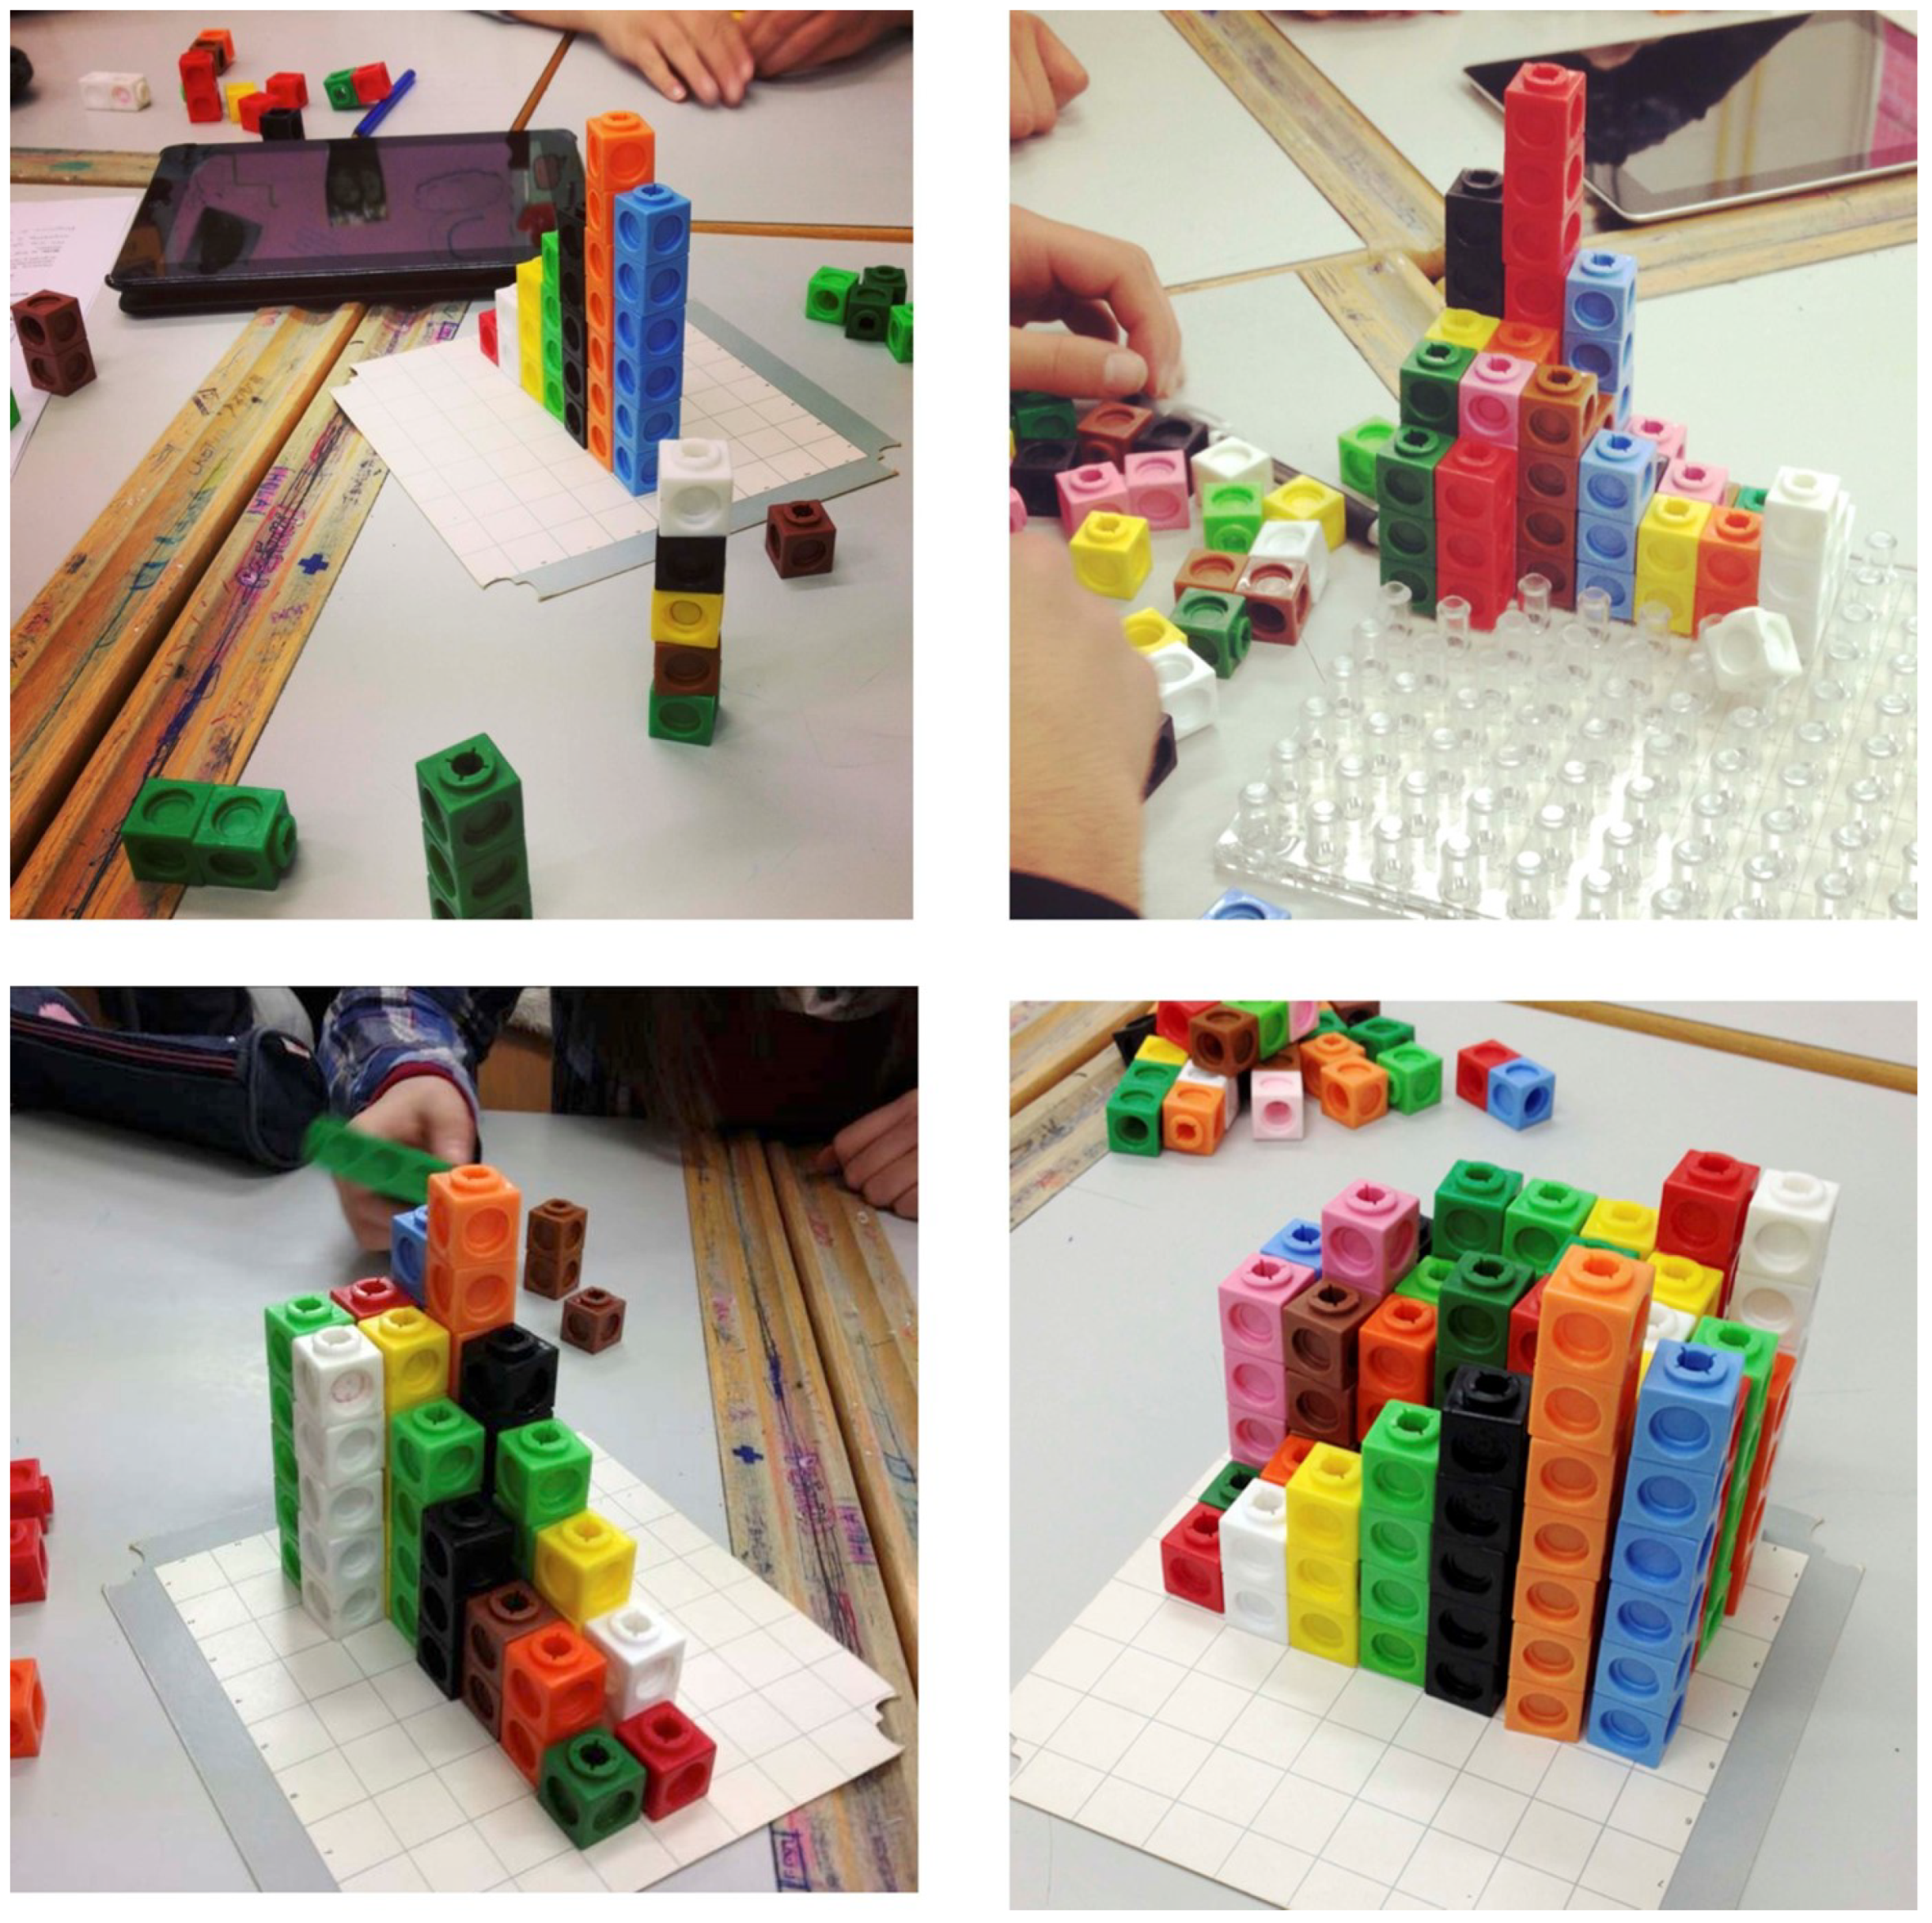
Three-dimensional representation: they are made to see that an object or entity is three-dimensional if each point can be located by specifying three numbers within a certain range. For example, in our classroom case, height, length and depth. This concept is closely linked to the concept of a function of two variables.Mathematical model of the physical phenomenon; Teacher
Function of two variables: in experimental sciences, it is very common that we are interested in expressing one variable (variable we are often interested in expressing a variable (response variable or independent variable) as a function of two or more variables.Mathematical model of the physical phenomenon; Teacher
Range: when designing the strategy, students find the obstacle of the lack of cubes to execute it, and therefore, they will have to reflect on the concept of range, which is the interval between the maximum and minimum value of the values they have available to them. From it, they will be able to estimate the value that they have to to assign to a cube to make a representation without missing any cube.Group work interaction; Teacher
Using visual strategies to represent data: Students have to make a three-dimensional representation of the data found in the table representing the mean sound intensity values for the marked points in the classroom. Students introduce the use of different colours of the cubes in their representation. This promotes a learning situation in which the need to use visual representations to provide information is appreciated.Mathematical model of the physical phenomenon; Group work interaction
Learning to ask questions to validate results: The teacher uses interventions such as strategy redirection to manage the strategies that groups devise. manage the strategies devised by the groups. In both groups, the same error arises the same mistake, which consists of omitting the decimal values and using only the integer part. For this reason, the teacher emphasises the need to provide meaningful information that is coherent with the data provided in the table. If two columns have the same height, this would mean that that the same loudness has been reached at the two measurement points. Asking questions such as “What does the height of these columns mean? helps students to check the status of their solutions.Teacher
Table 5. Learning opportunities of Session 5.
DescriptionCatalysts
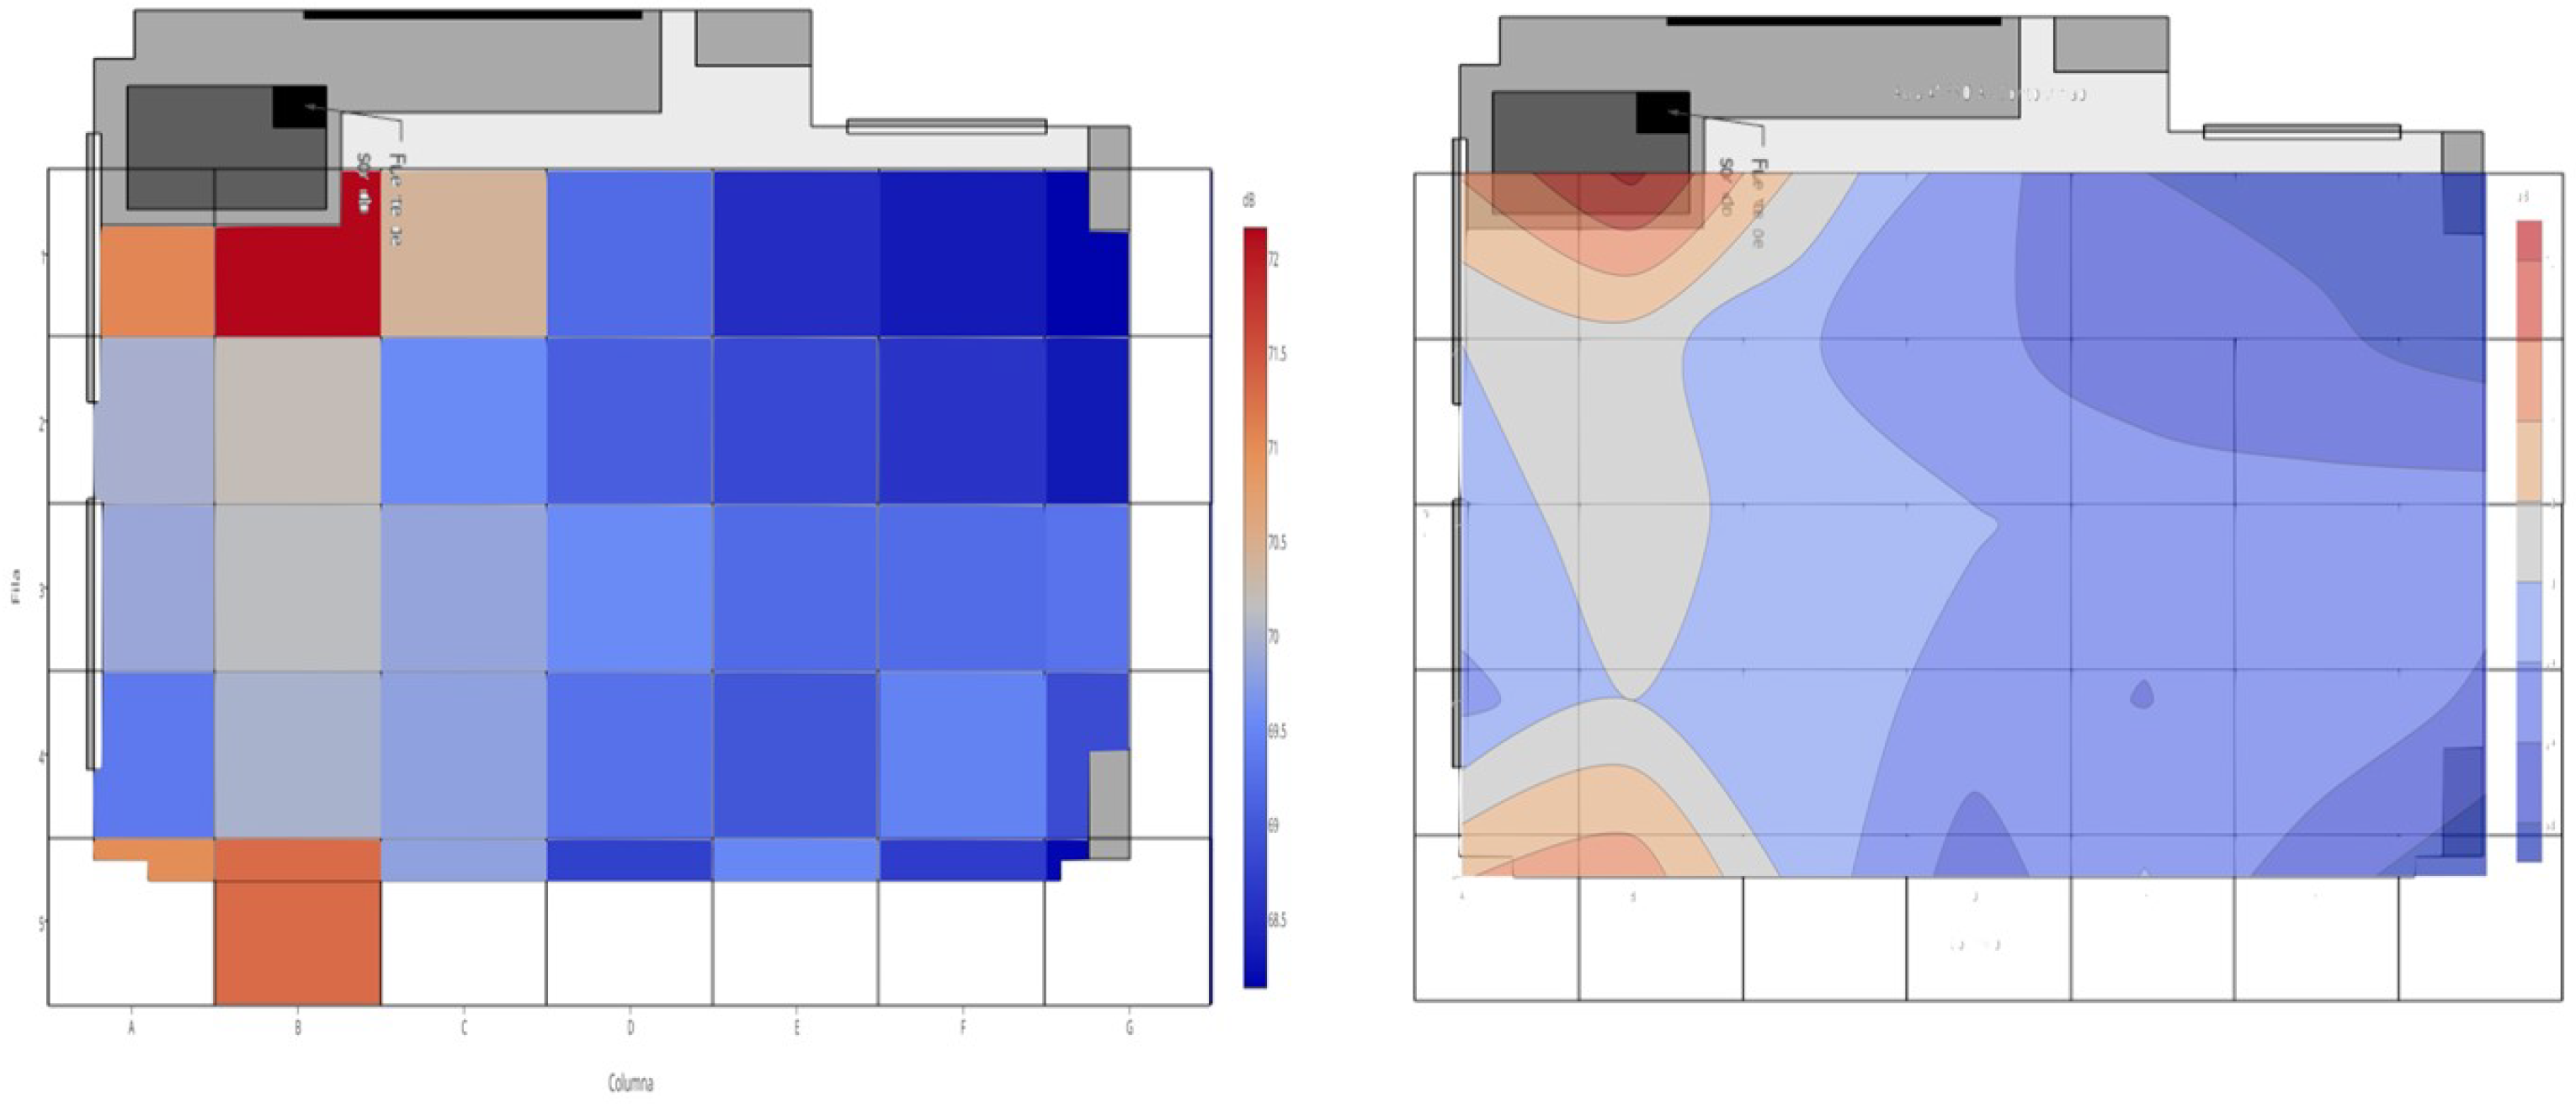
Heat maps: This is a graphic in which specific areas are highlighted using colour coding based on criteria, such as highlighting areas of higher or lower sound intensity.Mathematical model of the physical phenomenon; Group work interaction; Teacher
Contour lines or contour maps: Very often the functions of two variables are represented by their contour lines. Indeed, the representation of functions of two variables by means of contour lines is particularly interesting, because they are simple to interpret and much easier to represent. They are those lines on a map that join those the points that have equal sound intensity, thus clustering the regions of the plane with sound intensities in the same sound intensity range.Mathematical model of the physical phenomenon; Group work interaction; Teacher
Search for alternatives to show the same result: The teacher stresses the need to work in a productive and efficient way. To this end, he uses resources such as the invitation to reflection and the conduction of the strategy, so that the idea of improving the strategy carried out during session 4, which was based on a three-dimensional representation of the data, is reflected. The teacher uses resources such as inviting reflection and conducting the strategy to reflect the idea of improving the strategy carried out during session 4, which was based on a three-dimensional representation of the data, and to obtain the same information but using a two-dimensional representation that is much more manageable.Mathematical model of the physical phenomenon; Group work interaction; Teacher
Relate the result obtained to everyday information: The teacher talks about and shows a picture of contour lines, which appears continuously on isobar maps when we hear about the weather. This fact allows them to have a real reference of the functionality of the heat maps.Teacher
Disclaimer/Publisher’s Note: The statements, opinions and data contained in all publications are solely those of the individual author(s) and contributor(s) and not of MDPI and/or the editor(s). MDPI and/or the editor(s) disclaim responsibility for any injury to people or property resulting from any ideas, methods, instructions or products referred to in the content.

